ECE 16:332:568 Software Engineering of Web...
51
Web based Stock Forecaster Group 804 1 ECE 16:332:568 Software Engineering of Web Applications WEB BASED STOCK FORECASTER By Group 4: Shivangi Chaudhari Ronak Daya Snehapreethi Gopinath Mohnish Kulkarni Vaidehi Kulkarni Nishant Sagar Instructor: Dr. Ivan Marsic Submission Date: 3 rd May 2008 Prepared By : Group 804 Version : 1.0 Submission : 31 st March 2008 Version : 2.0 Submission : 7 th May 2008 Version : 3.0 Submission : 10 th May 2008 Version : 4.0 Last Revised : 14 th May 2008
Transcript of ECE 16:332:568 Software Engineering of Web...

Web based Stock Forecaster Group 804
1
ECE 16:332:568 Software Engineering of Web Applications
WEB BASED STOCK FORECASTER
By Group 4:
Shivangi Chaudhari
Ronak Daya
Snehapreethi Gopinath
Mohnish Kulkarni
Vaidehi Kulkarni
Nishant Sagar
Instructor:
Dr. Ivan Marsic
Submission Date: 3rd May 2008
Prepared By : Group 804
Version : 1.0
Submission : 31st March 2008
Version : 2.0
Submission : 7th May 2008
Version : 3.0
Submission : 10th May 2008
Version : 4.0
Last Revised : 14th May 2008

Web based Stock Forecaster Group 804
2
STOCK TICKERSTOCK TICKERSTOCK TICKERSTOCK TICKER
PREDICTION IS OURS, PROFIT IS YOURS…
Project Website :
http://software-ece.rutgers.edu/~group804/

Web based Stock Forecaster Group 804
3
Table of Contents
1. INTRODUCTION ............................................................................................... 4
2. UML DIAGRAMS ............................................................................................... 5
2.1 Client-side Use case ........................................................................ 6
2.2 Server-side Use case ........................................................................ 7
3. SYSTEM DESIGN AND ARCHITECTURE OVERVIEW ......................................... 8
3.1 CLASS DIAGRAMS ............................................................................ 9
4 DETAILED ARCHITECTURE ............................................................................... 16
4.1 Data Collection ............................................................................. 16
4.2 Web Service Infrastructure ............................................................... 20
a) Developing Web Services in .Net using Visual Studio 2005 ........................ 20
b) Login and Registration ............................................................... 21
c) Search Stock Module .................................................................... 23
d) Performance Modules ................................................................ 25
4.3 Prediction Module .......................................................................... 35
a) Understanding of Technical Analysis ................................................. 35
b) An example of Technical Analysis results ......................................... 37
5 GANTT CHART & BREAKDOWN OF INDIVIDUAL CONTRIBUTION .................... 42
6 APPENDIX A ...................................................................................................... 44
7 APPENDIX B ...................................................................................................... 45
SOAP 1.2 ........................................................................................... 49
HTTP GET .......................................................................................... 49
HTTP POST ........................................................................................ 50
8 REFERENCES .................................................................................................... 51

Web based Stock Forecaster Group 804
4
1. INTRODUCTION The project is used to provide a client a glimpse of the market, and provide him with trading tips.
For this it extracts information from Yahoo! Finance and inserts it into a database created on
MySQL server. This data is called as ‘raw’ data which is used to predict future trends using
technical analysis. For our project we will use the ‘Stochastic Oscillator’ for prediction.
Once a user Logs into our system, he can obtain the following information:
• Stock Value • Current Value • The Day’s Performance • Past Performance
• Financial Performance
• Speculative Price
• Trading Tips with short term and long term perspective
• Stock values of the competitor’s in that Industrial sector
Many softwares which are available online do the same prediction as done by our project.
Some of them are:
a) Metastocks: http://www.equis.com/whc/google6.aspx
b) Esignal: www.esignal.com
c) CQG: www.cqg.com
d) Ninja Trader: www.ninjatrader.com
e) Optimal Trader: http://www.optimaltrader.net/

Web based Stock Forecaster Group 804
5
2. UML DIAGRAMS
Fig. 1
The Flow of events for the System, as shown in the above diagram is as follows-
• The client logs on to the website which calls the Web service, passing the clients query. • The Web service then calls the Data Access layer to get the data from the MySQL database. • The data base is populated using data obtained from the Yahoo! Finance Site. • This data is then retrieved by the Data Access Layer and returned to the web service. • The Web service then calls the different Processing and Predicting modules to calculate the
results. • These results are then returned to the client in his UI.
Web based Stock Forecaster Group 804
6
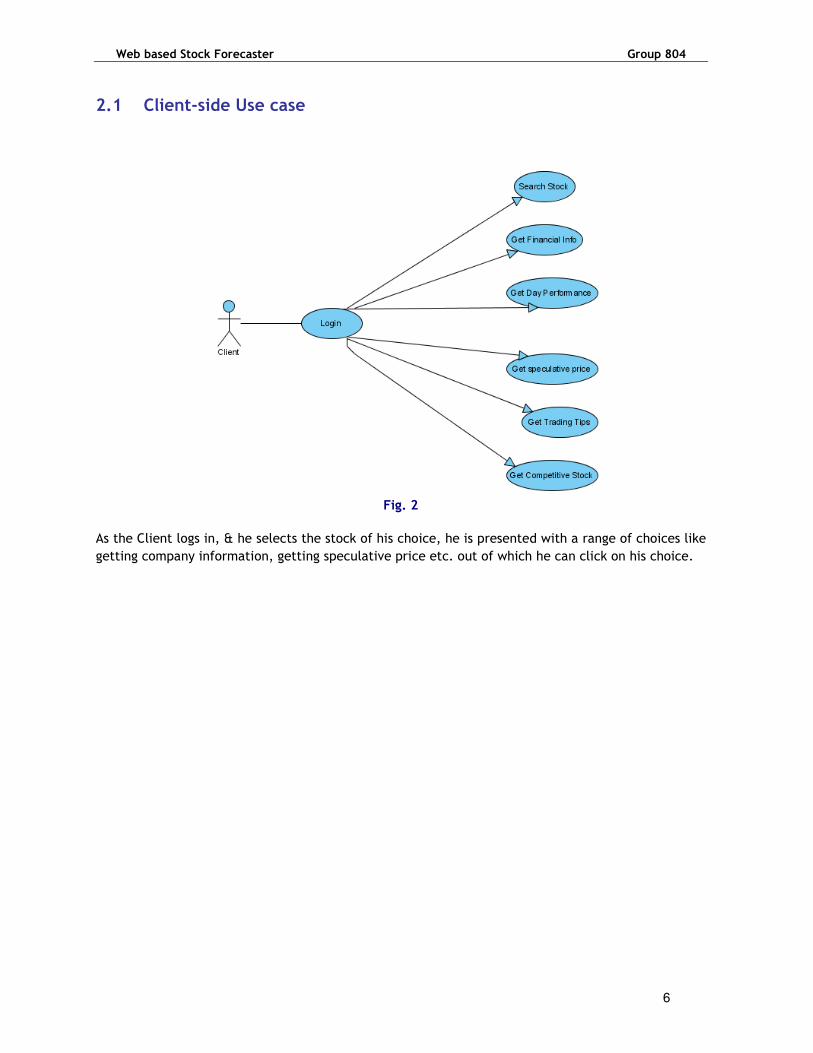
2.1 Client-side Use case
Fig. 2
As the Client logs in, & he selects the stock of his choice, he is presented with a range of choices like
getting company information, getting speculative price etc. out of which he can click on his choice.

Web based Stock Forecaster Group 804
7
2.2 Server-side Use case
Fig. 3
At the Server side, a PHP script runs which connects to the Yahoo! Finance site, and gathers data
which is to be populated and put into the database. Later, whenever queried by the data access
layer (Our architecture consists of Presentation Layer (Client Side UI), Business Logic Layer and the
Data Access Layer explained in Section3), the database returns the required data for further
processing.

Web based Stock Forecaster Group 804
8
3. SYSTEM DESIGN AND ARCHITECTURE OVERVIEW
1 1
4
2
3
Stock Forecaster
Forecaster
Client (Presentation
Layer)
Terminal to deploy web
service (Business
Logic Layer)
Database on ECE server (Data Access Layer
interaction)
Stock Forecaster
Forecaster

Web based Stock Forecaster Group 804
9
The different components of the system are Data collection (gathering stock information), Web
service infrastructure (web interaction) and prediction calculations.
Data Collection
In the data collection component, a query is sent to the yahoo finance server for data on stocks
which is used to predict the value of a particular stock. The module is coded in PHP and a MySQL
database is used to store the stock prices obtained.
Web Service Infrastructure
A Web service is a software function or resource offered as a service; remotely accessed over the
web; and, has programmatic access using standard protocols. A Web service is an interface that
describes a collection of operations that are network accessible through standardized XML messaging.
Web services fulfill a specific task or a set of tasks. A Web service is described using a standard,
formal XML notion, called its service description that provides all the details necessary to interact
with the service including message formats, transport protocols and location.
Prediction Model
Using the stock information collected, various charts are plotted to perform technical analysis and patterns are observed. The stochastic oscillator is a momentum indicator used in technical analysis, to compare the closing price of a commodity to its price range over a given time span. This is useful in learning and recognizing a particular pattern in the stock prices.
3.1 CLASS DIAGRAMS Below are the class diagrams of the client UI(deployed on the server and accessible via the ip address of the server http://<server ip address>/< Directory_in_which_Client_deployed> ) , webservice (deployed on the server http://<server ip address>/< Directory_in_which_WebService_deployed>)

Web based Stock Forecaster Group 804
10
Presentation Layer (Client UI)
The diagrams below show the Client side web application solution which contains a class for each of the page present in the client side UI. They correspond to the code that contains the logic for the handling of different click events and displaying of information to the client. The ‘Fields’ section shows the different controls eg:
Button Controls fields starting with
‘Buttton/btn’ Labels
Fields starting with ’Label/lbl’
Form Aspx page which contains html/web
server controls Panel
Fields starting with ‘Panel’, a container to
hold other controls
Textbox Control Fields starting with
prefix ‘txt’ eg: txtInput Link Button
Fields starting with ‘lnk’ link buttons to navigate/perform
actions
GridView Fields starting with ‘Gridview’ displays
data in a tabular format serviceObj
This is the object if the Web service class
through which the web service methods are
called
The ‘methods’ are the different functions performed on the occurrence of an event eg On button click event, On page load event etc.

Web based Stock Forecaster Group 804
11
Web Service (Business Logic Layer)
The class below ‘StockInfo’ is the class that contains the webservice methods that are exposed to the client (user). The fields represent global variables.
DALObj This is the Data Access Layer object through which the functions for data access from the database are called.
dValue % D value
high The highest closing price in the given range of days (short term-14days/long term–60days)
kValue % K value
low The lowest closing price in the given range of days (short term-14days/long term–60days)
The ‘Methods’ are the implementation of the different functionalities/services provided by the web service to the user/consumers of the web service. They are explained in detail in (section 4.2)
Web Service Class Diagram

Web based Stock Forecaster Group 804
12
Data Access Layer (Fetch Data From MYSql Database)
The StockInfoDAL is a class which has all the implementation of the various queries that are required to be made to the database to get the appropriate data for various calculation/prediction and display useful information to the user.
The field STR_CONNECTION_STRING is the connection string required to form a database connection. It contains the database server name, user id, password and other credentials required for connection.
The methods are named according to the query function they perform and are self explanatory and are explained in detail in (section 4.2)
StockInfoDAL
Class
Fields
STR_CONNECTION_STRING
Methods
CloseConnection
CreateConnection
FindStockDAL
GetCompetitiveStocksDAL
GetCurrentDayPerformanceDAL
GetFinancialInfoDAL
GetGeneralStockInfoDAL
GetNextSpeculativePriceDAL
GetStockPerformanceDAL
GetStockPriceInfoDAL
GetTradingTipsDAL
LoginUser
RegisterUser
The description of the files in the Zip folder containing the code is shown below. Each file(if not .Net Internal) if opened also contains a header and comments which give a brief description of the file and the classes and methods it contains, or whether or not it is auto generated, author name etc.
http://msdn.microsoft.com/en-us/library/aa730760(VS.71).aspx This link contains general information for C# Project properties
**NOTE: The files *.csproj, *.csproj.user, and *.sln are used by Visual Studio to manage the project. Visual Studio provides two types of containers called solutions and projects for managing items necessary for developing services such as references, folders, files, and dependencies. In addition, Visual Studio provides Solution Folders to organize related projects into groups and then perform actions on those groups of projects. Solution Explorer, an interface for viewing and managing these containers and their associated items, is part of the Visual Studio integrated development environment (IDE). http://msdn.microsoft.com/en-us/library/bb643223.aspx (Although this link is for a specific type of project it holds true for

Web based Stock Forecaster Group 804
13
the above note for any project created in Visual Studio) http://www.faqts.com/knowledge_base/view.phtml/aid/27512
http://msdn.microsoft.com/en-us/library/h8w79z10%28VS.71%29.aspx
FOR WEB SERVICE PROJECT
Main Folder-StockForecasterService: StockForecasterService.sln: This is the main solution file which can be double clicked to be opened in Visual Studio.
Subfolder- SFSDataAccessLayer: StockInfoDAL.cs: This file has the Data Access layer functions of the bussiness layer which
has all the queries fired to the data base depending of the functionality requested by the user
SFSDataAccessLayer.csproj: Visual Studio internal auto generated file required for running the actual classes
MySql.Data.dll: Third party dll used to access the mysql database through .Net code
Subfolder-Properties:
AssemblyInfo.cs: The AssemblyInfo.cs file contains some project wide attributes that you do not normally have to modify. It is auto generated.
Subfolder- bin
This folder has the output file or built binaries (eg:.exe,.dll etc. in our case it is .dll) and the debug information file(.pdb) used for debugging.
Subfolder-obj
This folder again has files used by .Net internal and Visual Studio like .cache file other than the built binaries and debug information files
Subfolder- StockForecasterService:
StockForecasterService.csproj: Visual Studio internal auto generated file required for running the actual classes. On double clicking this file it opens the project.
StockForecasterService.csproj.user: Visual Studio internal auto generated file required for running the actual classes by .Net and the operating system. (http://msdn.microsoft.com/en-us/library/aa287473(VS.71).aspx)
StockForecasterService.Publish.xml: It has the publish information (eg time of publishing, the folder on the server where the service is published etc) about the published web service
StockInfo.asmx: This is the Web Service File which contains the design view where controls can be dragged and dropped (In our case as it’s a webservice there are no controls and the file)
StockInfo.asmx.cs: This is the code file (in general .cs represents a code file in Visual Studio .Net) that contains the code for Web Service methods.
Web based Stock Forecaster Group 804
14
Web.config: This is the file in which we can configure application setting. It is auto generated with some default data. For eg setting of parameters like authentication, authorization, database connection strings, web references can be configured.
Subfolder-Properties:
AssemblyInfo.cs: The AssemblyInfo.cs file contains some project wide attributes that you do not normally have to modify. It is auto generated.
Subfolder- bin
This folder has the output file or built binaries (eg:.exe,.dll etc. in our case it is .dll) and the debug information file(.pdb) used for debugging.
Subfolder-obj
This folder again has files used by .Net internal and Visual Studio like .cache file other than the built binaries and debug information files
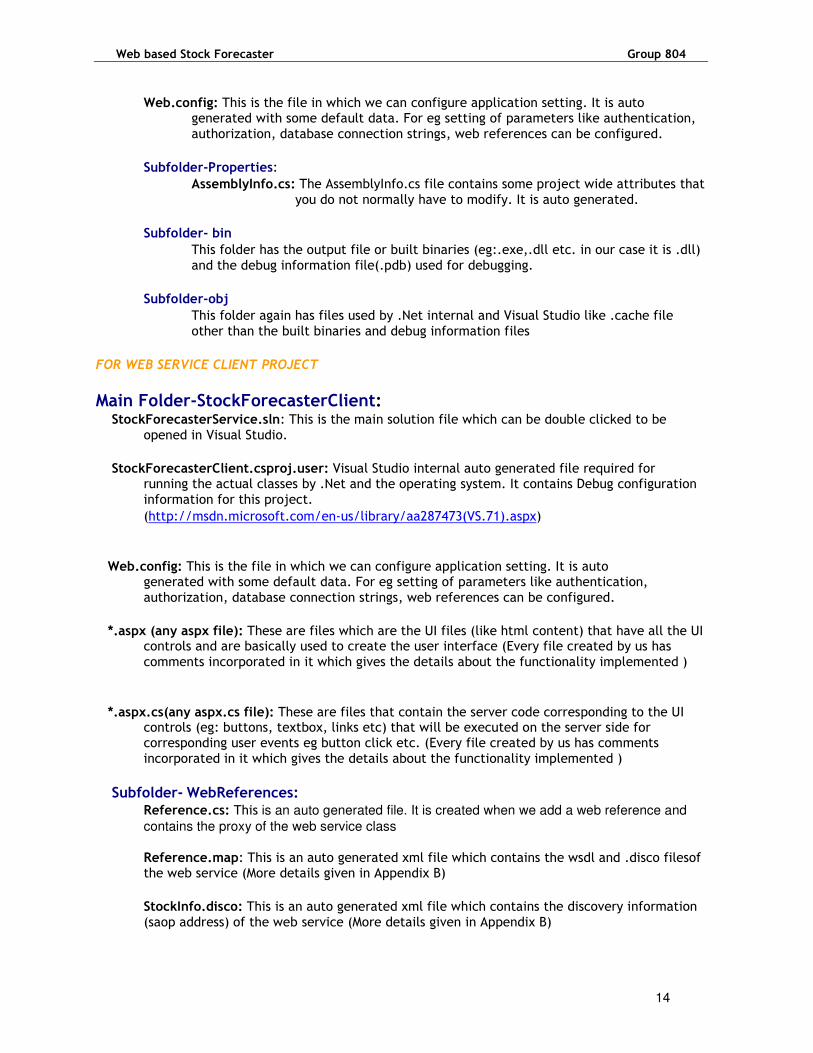
FOR WEB SERVICE CLIENT PROJECT
Main Folder-StockForecasterClient: StockForecasterService.sln: This is the main solution file which can be double clicked to be opened in Visual Studio.
StockForecasterClient.csproj.user: Visual Studio internal auto generated file required for running the actual classes by .Net and the operating system. It contains Debug configuration information for this project.
(http://msdn.microsoft.com/en-us/library/aa287473(VS.71).aspx)
Web.config: This is the file in which we can configure application setting. It is auto generated with some default data. For eg setting of parameters like authentication, authorization, database connection strings, web references can be configured.
*.aspx (any aspx file): These are files which are the UI files (like html content) that have all the UI controls and are basically used to create the user interface (Every file created by us has comments incorporated in it which gives the details about the functionality implemented )
*.aspx.cs(any aspx.cs file): These are files that contain the server code corresponding to the UI controls (eg: buttons, textbox, links etc) that will be executed on the server side for corresponding user events eg button click etc. (Every file created by us has comments incorporated in it which gives the details about the functionality implemented )
Subfolder- WebReferences: Reference.cs: This is an auto generated file. It is created when we add a web reference and
contains the proxy of the web service class
Reference.map: This is an auto generated xml file which contains the wsdl and .disco filesof the web service (More details given in Appendix B)
StockInfo.disco: This is an auto generated xml file which contains the discovery information (saop address) of the web service (More details given in Appendix B)

Web based Stock Forecaster Group 804
15
StockInfo.wsdl: This is an auto generated wsdl file of the web service (More details given in Appendix B)
Subfolder-images: Contains all the images used to design the client UI
Subfolder-Properties: AssemblyInfo.cs: The AssemblyInfo.cs file contains some project wide attributes that you do not normally have to modify. It is auto generated.
Subfolder- bin: This folder has the output file or built binaries (eg:.exe,.dll etc. in our case it is .dll) and the debug information file(.pdb) used for debugging.
Subfolder-obj: This folder again has files used by .Net internal and Visual Studio like .cache file other than the built binaries and debug information files

Web based Stock Forecaster Group 804
16
4 DETAILED ARCHITECTURE
4.1 Data Collection
A MySQL database is created on the ECE server machine. The database contains information about 60
companies in all. These 60 companies were chosen at random trying to cover all possible industrial
sectors. The list of these companies is given in Appendix A. The database contains 7 Tables which are
updated every 15 minutes: • Stocks • Day Price • Month Price • Financial Info • User Info • Stock Info • Sector ID +-------------------------+ | Tables_in_group804| +-------------------------+ | DayPrice | | Financial_info | | MonthPrice | | Sectors | | StockInfo | | User_info | | stocks | +-------------------------+ • Stocks: It contains the current information about the stock. This table contains 8 columns. These
columns contain the Stock ID, stock name, current value, change points (difference between
opening and closing price of the stock that day), opening value, Day’s High, Day’s Low, date, and
time.

Web based Stock Forecaster Group 804
17
• Day price: It has the values of the stocks at 10 am, 11 am, 12 pm…- 4pm, the Stock Id and the
date. The hourly prices are maintained to give the client information about how the stock price
varies during the day. Although the prediction algorithm needs 14 and 60 days’ data for short and
long term prediction respectively, hourly prices are given only for the user’s information.
• MonthPrice: Month price has the stock name, date, closing price, opening price, day high and
day low of the stocks on all the days in the previous 2 months.(More past data could be taken but
currently not used in the prediction algorithm). MonthPrice table has values for the day stocks
for the past two months. This is different from the DayPrice table such that the day price table
gives information about the day’s hourly performance whereas the month price table gives
information such as the opening and closing price, day’s high and low for every day in the past
two months.
Web based Stock Forecaster Group 804
18
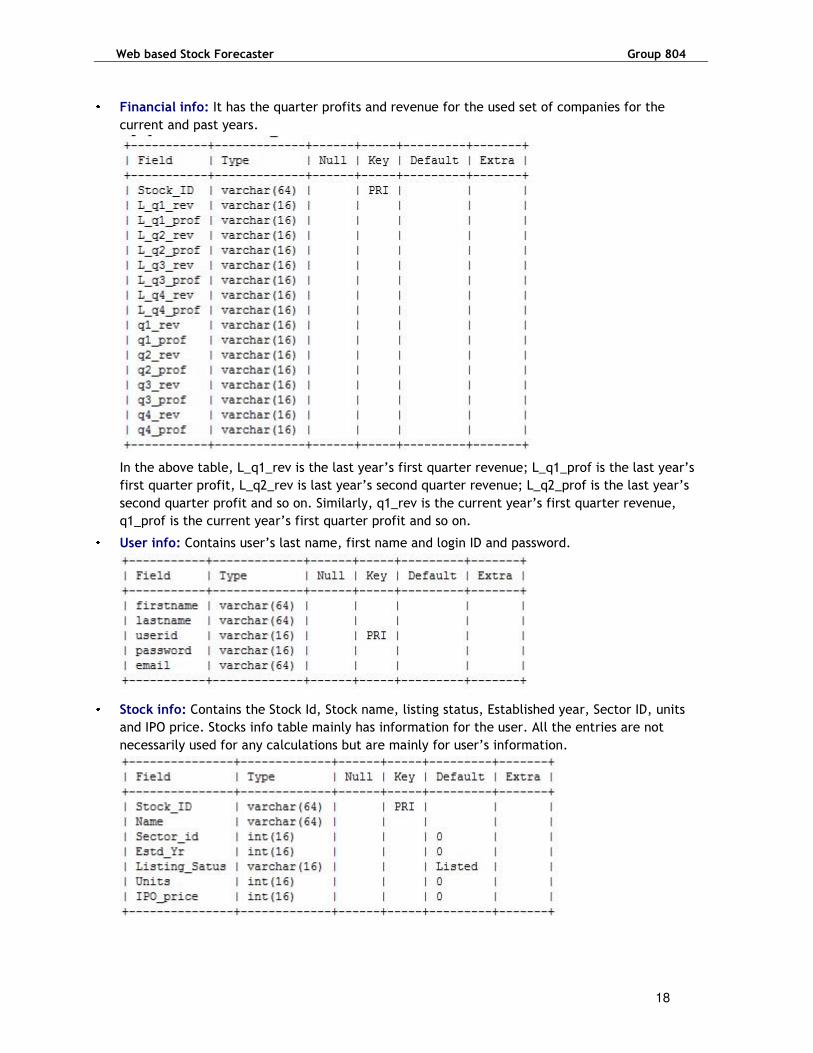
• Financial info: It has the quarter profits and revenue for the used set of companies for the
current and past years.
In the above table, L_q1_rev is the last year’s first quarter revenue; L_q1_prof is the last year’s
first quarter profit, L_q2_rev is last year’s second quarter revenue; L_q2_prof is the last year’s
second quarter profit and so on. Similarly, q1_rev is the current year’s first quarter revenue,
q1_prof is the current year’s first quarter profit and so on. • User info: Contains user’s last name, first name and login ID and password.
• Stock info: Contains the Stock Id, Stock name, listing status, Established year, Sector ID, units
and IPO price. Stocks info table mainly has information for the user. All the entries are not
necessarily used for any calculations but are mainly for user’s information.

Web based Stock Forecaster Group 804
19
• Sector Id: Contains Sector Id and Sector Name. Sector Id distinguishes the various sectors to
which companies belong. Since the stock forecaster also gives a list of Competitive Stocks, this
table is required. The Get Competitive Stocks functionality provides the client with a list of
companies which are in the same sector as the company of his interest, so that he can view their
stock data to make his decision.
A PHP script runs on the server, which does the function of connecting to Yahoo! Finance and then
get inserts it into the database. The interaction diagram for the same is shown in Fig.4 below.
Fig. 4 Interaction diagram for database and yahoo

Web based Stock Forecaster Group 804
20
4.2 Web Service Infrastructure
a) Developing Web Services in .Net using Visual Studio 2005 Web Services brings information into the applications from the Internet in much the same way that
browsers make information available to end users.
The .Net framework abstracts most of the internal logic that handles the remoting details of method
calls over the wire and Visual Studio .Net builds support for Web Services directly into the
development environment. With all of this in place it becomes almost as easy to call a method over
the Net as it is to call a local method. Web services can be easily supported on a wide range of
platforms. The web service may extend its interface and add new methods without affecting the
clients as long as it still provides the old methods and parameters. A client makes a request to a web
service, the web service returns the result, and the connection is closed. There is no permanent
connection. This makes it easy to scale up and out to many clients and use a server farm to serve the
web services. The underlying HTTP used by web services is also stateless. Microsoft suggests two
rules of thumb for deciding whether to use web services. If you need to cross platform boundaries
(for example, communicate between a .NET and a Java application) or trust boundaries (for
example, communicate between two companies), web services make great sense. Web services are
also a good choice if you want to use built-in ASP.Net features such as caching or IIS features such as
SSL security or Windows authentication.
Once a client logs in, he has to search for the company of his interest. He can input the entire
company name or just a single character. A search operation is performed and all the companies
having that string in their Stock_name will be returned. The search stock module describes this
process of searching for the stocks and displaying the results. After the search results are displayed,
the user clicks on the desired company name. The user is then presented with a set of options as
shown below:
• Get company information: This provides the user with general information about the company and
the stock. This information will contain information about the company and information like the last
year’s all quarters’ revenue and profit and current year’s quarters’ revenue and profit for example.
• Day Performance: This provides user with the stock data for the current day which has the hourly
data for the company for that day.
• Current Performance: This provides the user with the latest price of the stock at the point of
time.
• Month Performance: This provides the user with the past two months performance of the stock.
• Get Short term Speculation: This provides the user with the short term prediction of price. The
short term prediction is made for 14 days.
• Get Long term Speculation: This provides the user with the long term prediction of price. The long
term prediction is made for 60 days.
• Get trading tips: This provides the user with tips on whether to buy or sell or hold the stock.
• Competitive Stocks: This provides the user with the list of companies in the same sector as the
company of the user’s choice.
The Performance module for each of these functions mentioned is described. As all these functions
go through the same sequence of operations, an explanation of one of these is given below.

Web based Stock Forecaster Group 804
21
b) Login and Registration The first page that the user sees is the Login.apsx page, where the user can login and continue
searching for stock information and get trading tips. In case it is a first time user, he can click on the
“To Register” link or the “REGISTRATION” tab on the right and he will be lad to the member
registration page where he can enter his information and create a new account.
1. Login
The Login page looks like in Fig.5. When a user enters his username, password and clicks on the Login
button, an object of the service is created and the function ‘LoginUser’ in the file Stockinfo.asmx.cs
is called. The Stockinfo.asmx.cs is a file running on the server machine, which when called creates
an object of the Data Access Layer. A function ‘LoginUserDAL’ in the file StockInfoDAL.cs is called.
This Data Access layer function then opens a connection with the database, queries it for the user
information which is the user name and password list in this case, checks whether the user exists in
the User Info table and whether user has entered correct password by comparing entries in the
database. It returns the appropriate value (0 if user does not exist, 1 if user exists) and then closes
the connection. This value is then returned back to the StockInfo.asmx.cs which in turn returns it
back to the client function calling it. If the user exists and correct password has been entered, the
user is redirected to the ForecasterClient.aspx page where the user can search the company stock he
wants.
Signature:
[WebMethod]
public int LoginUser(string userId, string pwd)
userId contains the username that the user has entered and pwd contains the password the user has
entered.
Fig. 5

Web based Stock Forecaster Group 804
22
2. Registration
After the user is redirected to the Registration page, the page looks like in Fig.6. A new user can
enter his data in the correct fields. When the clicks on the Register button, an object of the service
is created and the function RegisterUser in the file Stockinfo.asmx.cs is called. The
Stockinfo.asmx.cs is a file running on the server machine, which when called creates an object of the
Data Access Layer. A function RegisterUserDAL in the file StockInfoDAL.cs is called. This Data Access
layer function then opens a connection with the database, queries the User Info table to check
whether another user with the same name already exists. If there is no other user with the same
name already in the database, a new entry is created in the table with the information the user has
entered. It returns the appropriate value (0 if user exists, 1 if user does not exist) and then closes
the connection. This value is then returned back to the StockInfo.asmx.cs which in turn returns it
back to the client function calling it. If user entry has been created, a message saying “Registered
Successfully” is displayed and the user is directed to the Login.aspx page. If user name already
exists, a message saying “Registration Unsuccessful” is displayed and the user is directed to the
Login.aspx page.
Signature:
[WebMethod]
public int RegisterUser(string firstName, string lastName, string userId, string pwd, string email)
firstName contains the string which contains the first name of the user, lastName contains the string
which contains the last name of the user, userId contains the username that the user wishes to use,
pwd contains the password the user wishes to use and email contains the email address of the user.
All these strings are then used to create a new entry in the Stock Info table in the database as
explained above.
Fig. 6

Web based Stock Forecaster Group 804
23
c) Search Stock Module
Interaction Diagram for Search Stock
Fig. 7
The basic interaction diagram of search stock method is shown Fig.7. It shows the interaction
diagram after login. Once a client has logged into the system, he has to the search for the company
of his interest. The webpage presented to him is a .asmx file.(Forecaster client.asmx). The code for
this page is contained in the Forecaster.asmx.cs file. Whenever a client logs-in an object of the web
service is created. On, hitting the Submit button on the webpage, a corresponding web service
method is called, which is located on the Server side. The Stockinfo.asmx.cs is a file running on the
server machine, which when called creates an object of the Data Access Layer. The data access layer
is an added layer which is used to access the database. It acts as a security layer, and prevents the
web service directly connecting to the database. This Data Access layer then opens a connection with
the database, queries it for the stock info, retrieves this information from the database and then
closes the connection. This data is then returned back to the StockInfo.asmx.cs where the business
logic is implemented for processing the data fetched and then in turn is returned back to the client
function calling it. Finally, this Stock value is then displayed on the client Webpage again.

Web based Stock Forecaster Group 804
24
The activity diagram for search stock is as shown in Fig. 8 below.
Fig.8
The screen shot of the Search Stock page as seen by the client is as shown in Fig.9 below.
Fig. 9

Web based Stock Forecaster Group 804
25
d) Performance Modules After a client has logged into the system and found the company of interest, he is guided to another
page which is the Performance page (Performance.aspx). On this page the client is provided with the
options mentioned above. Each of these options is called a performance module and they are
explained as follows.
1. Day Performance
Fig. 10
The user is provided with the company’s day stock performance. This mainly includes the hourly
prices of the stock for that day.
The basic interaction diagram to get the current day’s performance is shown above Fig.10. When the
client clicks on the link for Day Performance, a function GetCurrentDayPerformance in the file
Stockinfo.asmx.cs is called (Step 2 in Fig.10). The Stockinfo.asmx.cs is a file running on the server
machine, which when called creates an object of the Data Access Layer. A function
GetCurrentDayPerformanceDAL in the file StockInfoDAL.cs is called (Step 3 in Fig.10). This Data
Access layer function then opens a connection with the database, queries it for the stock information
which is the current day’s performance in this case, retrieves this information from the database
and then closes the connection. This data is then returned back to the StockInfo.asmx.cs in the form
of a table which in turn returns it back to the client function calling it. The data retrieved is the
table of price of stock taken every hour from 10AM to 4 PM. This data is displayed in the form of a
table on the Performance.aspx page.
Signature:
[WebMethod] (This is the ‘decoration’ needed for making a function available as a web service) public DataSet GetCurrentDayPerformance(string stockID)
stockID is the ID of the company selected for which day prices are being retrieved.This function calls
GetCurrentDayPerformanceDAL and returns hourly prices for the day from 10AM to 4PM. The output
of the web service method is ‘DataSet’ which is a table container available in .Net in which the

Web based Stock Forecaster Group 804
26
output of the database query is filled. This dataset is the bound with a display container(Data Grid)
to display the results on the client UI.
The Activity diagram for Get Day Performance is as is given in Fig.11 below.
Fig. 11

Web based Stock Forecaster Group 804
27
The screenshot for Get Day Performance as the client would see it is shown in Fig. 12.
Fig. 12
**NOTE: The use case diagram, interaction diagram and activity diagram for all the methods of
the web service described below are the same as the ‘Get Day Performance’ as shown above
only the methods called will change , if otherwise the corresponding diagrams will be shown for
that particular module .
2. Get Company Information
This provides user with information about the company and the last year’s all quarter results and the
current years’ quarter results.
When the client clicks on Get Company Information, a function GetFinancialInfo in the file
Stockinfo.asmx.cs is called . The Stockinfo.asmx.cs is a file running on the server machine, which
when called creates an object of the Data Access Layer. A function GetFinancialInfoDAL in the file
StockInfoDAL.cs is called. This Data Access layer function then opens a connection with the database,
queries it for the stock information which is the company’s last 8 quarter performances in this
case if available, retrieves this information from the database and then closes the connection. This
data is then returned back to the StockInfo.asmx.cs in the form of a table which in turn returns it
back to the client function calling it. This data is displayed in the form of a table on the
Performance.aspx page in a table format.
Signature:
[WebMethod] public DataSet GetFinancialInfo(string stockID) stockID is the ID of the company for which month prices are being retrieved.This function calls
GetFinancialInfoDAL and returns last few quarter returns.
The screenshot for Get Company Information as the client would see it is shown in Fig. 13.

Web based Stock Forecaster Group 804
28
Fig. 13
3. Get Competitive Stocks
This provides the user with a list of companies in the same sector as the company of interest of the
user. When the client clicks on Get Company Information, a function GetComepetitiveStocks in the
file Stockinfo.asmx.cs is called . The Stockinfo.asmx.cs is a file running on the server machine, which
when called creates an object of the Data Access Layer. A function GetFinancialInfoDAL in the file
StockInfoDAL.cs is called. This Data Access layer function then opens a connection with the database,
queries it for the stock information which is the companies from the same sector as the selected
company, retrieves this information from the database and then closes the connection. This data is
then returned back to the StockInfo.asmx.cs in the form of a table which in turn returns it back to
the client function calling it. This data is displayed in the form of a table on the Performance.aspx
page in a table format.
Signature:
[WebMethod] public DataSet GetCompetitiveStocks(string stockID)
stockID is the ID of the company for which month prices are being retrieved.This function calls
GetFinancialInfoDAL and returns last few quarter returns.
The screenshot for Get Competitive Stock as the client would see it is shown in Fig. 14.

Web based Stock Forecaster Group 804
29
Fig. 14
4. Get Month Performance
The user is provided with the performance data of the stock over the past two months.
When the client clicks on Get Month Performance, a function GetStockPerformance in the file
Stockinfo.asmx.cs is called. The Stockinfo.asmx.cs is a file running on the server machine, which
when called creates an object of the Data Access Layer. A function GetStockPerformanceDAL in the
file StockInfoDAL.cs is called. This Data Access layer function then opens a connection with the
database, queries it for the stock information which is the month’s performance in this case,
retrieves this information from the database and then closes the connection. This data is then
returned back to the StockInfo.asmx.cs in the form of a table which in turn returns it back to the
client function calling it. The data retrieved is the table of last month’s data which has the opening
and closing price of each day of the month. This data is displayed in the form of a table on the
Performance.aspx page.
Signature:
[WebMethod] public DataSet GetStockPerformance(string stockID, int dayRangeCode) stockID is the ID of the company for which month prices are being retrieved. dayRangeCode is the
number of months for which this data is to be retrived.Currently our implementation of this function
calls GetStockPerformanceDAL and returns all the month’s prices available .
The screenshots for Get Month Performance as the client would see it is shown in Fig. 15 and Fig. 16.

Web based Stock Forecaster Group 804
30
Fig. 15
Fig. 16

Web based Stock Forecaster Group 804
31
5. Get Short term Speculation
This method gives the user the predicted price of the stock after 14 days.
The following diagram (Fig.17) shows the interaction diagram of the Prediction module functions
Fig. 17
The basic interaction diagram to get the next speculative price is as shown in Fig. 17. When the
client clicks on Get Speculative Price, a function GetNextSpeculativePrice in the file
Stockinfo.asmx.cs is called (Step 2 in Fig.17). The Stockinfo.asmx.cs is a file running on the server
machine, which when called creates an object of the Data Access Layer. A function
GetNextSpeculativePriceDAL in the file StockInfoDAL.cs is called (Step 3 in Fig.17). This Data Access
Layer function then opens a connection with the database, queries it for the stock information. Data
for 14 days is returned and the connection is closed. This data is obtained from the MonthPrice table
in the database. This data is then returned back to the StockInfo.asmx.cs where it is processed and
the speculative price is returned to the client function calling. This speculative price given is based
on the predictor, Stochastic Oscillator, which is displayed on the Performance.aspx page.
Signature:
[WebMethod] public decimal GetNextSpeculativePrice(string stockID)stockID is the ID of the company for which
Speculative price is being calculated. This function calls GetNextSpeculativePriceDAL, processes data
sent by this function, calculates and returns the precicted price of the stock.
Signature:
[WebMethod] public decimal GetSpeculativePrice(string stockID, int termCode )
stockID is the ID of the company for which Speculative price is being calculated, termcode
determines the term period used for prediction. It should be equal to 0 for short term Speculative
Price, so that data of the past 14 days is retrieved from the MonthPrice table in the database.

Web based Stock Forecaster Group 804
32
The screenshot for Get Short Term Speculation as the client would see it is shown in Fig. 18.
Fig. 18
6. Get Long term Speculation
This method gives the user the predicted price of the stock after 60 days.
The same procedure as for Short term speculation is followed here. The only difference is that of the
term period. For long term speculation, data for 60 days is retrieved from the database.
Signature:
[WebMethod] public decimal GetNextSpeculativePrice(string stockID)
stockID is the ID of the company for which Speculative price is being calculated. This function calls
GetNextSpeculativePriceDAL, processes data sent by this function, calculates and returns the
precicted price of the stock.
Signature:
[WebMethod] public decimal GetSpeculativePrice(string stockID, int termCode )
stockID is the ID of the company for which Speculative price is being calculated, termcode
determines the term period used for prediction. It should be equal to 0 for short term Speculative
Price, so that data of the past 14 days is retrieved from the MonthPrice table in the database.
The screenshot for Get Long Term Speculation as the client would see it is shown in Fig. 19.

Web based Stock Forecaster Group 804
33
Fig. 19
7. Get trading tips
This method in the end gives the user trading tips such as sell or buy or hold on to the stock.
The basic interaction diagram to get trading tips is similar to Fig. 17 with only some small
differences. When the client clicks on Get Trading Tips, a function GetTradingTips in the file
StockInfo.asmx.cs is called (Step 2 in Fig.17). The StockInfo.asmx.cs is a file running on the server
machine, which when called creates an object of the Data Access Layer. A function
GetTradingTipsDAL in the file StockInfoDAL.cs is called (Step 3 in Fig.17). This function further calls
the GetNextSpeculativePriceDAL function. This Data Access layer function then opens a connection
with the database, queries it for the stock information. Depending on whether short or long term
speculation is required, data for 14 days or 60 days respectively is returned and the connection is
closed. This data is obtained from the MonthPrice table in the database. This data is then returned
back to the StockInfo.asmx.cs where it is processed and tips are returned to the client function
calling. These tips are given based on the predictor, Stochastic Oscillator. The tip, either “Buy Stock”
or “Sell Stock” on some particular day or whether to hold on to the stock is displayed on the
Performance.aspx page.
Signature:
[WebMethod] public string GetTradingTips(string stockId, int termCode)
stockID is the ID of the company and termCode is the short term and long term period value for which
Speculative price is being calculated. This function in turn calls GetTradingTips. This function calls
GetNextSpeculativePriceDAL and the speculative price is obtained as explained in the previous
module. Based on the calculated speculative price, trading tips such as “Buy stock”, “Sell stock” on a
particular date or hold on to the stock are returned.
The screenshot for Get Trading Tips for Short Term as the client would see it is shown in Fig.20.

Web based Stock Forecaster Group 804
34
Fig. 20
The screenshot for Get Trading Tips for Long Term as the client would see it is shown in Fig. 21.
Fig. 21

Web based Stock Forecaster Group 804
35
4.3 Prediction Module
a) Understanding of Technical Analysis Technical Analysis is the name given to the analysis of data from which we extract information about
the possible future motion of the stock price. We studied various types of Technical Analysis which
can be used for our project and finally decided upon ‘Stochastic Oscillator’ as the analysis which
would give optimal results for the project.
The Oscillator uses the historical value of data which is stored in the database. The number of
historical values depends upon the type of user. For our application we have 2 types of users - "short
term" user and "long term" user. We have defined a short tern user as one who will trade stocks
within the next 14 days ( 2 weeks ) and a long term user is one who will trade stocks within the next
60 days ( 2 mnths ). These time periods are taken based on the error values in the predicted data.
Since our application will also give the predicted price at the end of these two periods ( 14 days and
60 days ) we want this value to be accurate and within an acceptable error percent of around 5-10%.
Thus these two time periods are selected. These values are fixed by administrator and not by the
user. This is because we would want to give the prediction till the maximum time possible which still
falls within the acceptable error percent. Thus we fix it to 14 days and 60 days and these values are
constant. However we also predict the next day price which can be used by the user.
The ‘Stochastic Oscillator’ uses an indicator which is usually calculated as:
[1]
[1]There are two types of Stochastic Oscillators which are used to assess future variations in price :
a fast (%K) and slow (%D). By analyzing these statistics we can observe the speed at which the prices
are changing or the “Impulse of the Price”. The fast stochastic oscillator or %K calculates the ratio of
two closing price statistics: the difference between the latest closing price and the lowest closing
price in the last N days over the difference between the highest and lowest closing prices in the last
N days. This is given as :
[1]
where CP is the closing price of the day
HIGH is high price
LOW is low price
The value of N is 14 days for our project. The value of %K will fluctuate between 0 and 100. It will be
0 if the current CP is the lowest for the last 14 days. It is 100 if the current CP is the highest for the
past 14 days. For any other value of CP , the value will be between 0 and 100.

Web based Stock Forecaster Group 804
36
However the %K values have a very large variation from one value to the next. Thus the prediction
will not be very accurate. Due to very large variation, this oscillator is called “Fast Oscillator”. To
increase the accuracy, we use a version of the Oscillator known as “Slow
Oscillator”. This oscillator calculates the simple moving average of the %K statistic across “s”
periods. This is shown as:
[1] This can also be written as :
[1] The value of ‘s’ can vary depending on the application. Taking a larger value of s will include more
historical data into the calculation of %D. Thus the accuracy will increase with a larger value of %D.
Usually the value s=3 is taken for most applications. Even for our project we will use s=3.
The trend given by the values of %D is used to predict the buying or selling strategy. Levels near the
extremes 100 and 0, for %D, indicate strength or weakness respectively because prices have made or
are near new 14-day highs or lows. Thus a signal of ‘BUY’ is generally given when the %D value is near
the 0 and expected to rise while the signal of ‘SELL’ is given when the %D value is near 100 and
expected to fall.
[1]There are two methods for using the %D indicator to make decisions about when to buy or sell
stocks. The first involves crossing of %K and %D signals while the second involves decisions based on
the assumption that %D oscillates.
[1]In the first case, %D acts as a trigger or signal line for %K. A buy signal is given when %K crosses up
through %D and a sell signal is given when it crosses down through %D. However due to the volatile
nature of the %K graph , such crossovers can occur too often. To avoid repeated triggers we can give
our decision when a crossover occurs together with an overbought/oversold pullback, or only after a
peak or trough in the %D line. If price volatility is high, a simple moving average of the %D indicator
may be taken. This statistic averages out rapid fluctuations in price.
In the second case , the condition of overbought or oversold can be obtained when the %D line
crosses certain thresholds. This assumes that the prices oscillate. Hence when the %D line crosses and
goes over the lower threshold we assume that it is moving towards the high point. Hence we should
give the signal of ‘BUY’. When the %D line crosses and goes below the upper threshold , we assume
that it is moving towards the low point. Hence we should give the signal of ‘SELL’.
For our project , we have used the second case for prediction. The upper threshold and lower
threshold are adjusted to give predictions which are not too frequent but also not too rare. The most
widely used values for upper and lower threshold is 80 and 20 respectively. We use the same values
for our project too.
The oscillation of %D and the points of decision can be shown in the diagram given below :

Web based Stock Forecaster Group 804
37
[2]
The diagram above is based on the assumption that the stock prices always oscillate as shown. As can
be seen above , when the %D value goes below 80 , it gives and indication of overbought and hence
the stock should have the ‘SELL’ status. The stock then returns to the lower price region. When the
value of %D goes above 20 , it gives the indication of oversold and hence the stock should have the
‘BUY’ status.
Thus the Stochastic Oscillator can be successfully used to predict the trend of the stock and hence
can be used for prediction of whether we should ‘BUY’ or ‘SELL’ the stock. If the current trend is
insufficient to decide the buy or sell status of the stock , we assign the status of ‘HOLD STOCK’ or
‘SIT OUT’ depending on whether the client currently possesses the stock or not.
b) An example of Technical Analysis results
An example of Technical Analysis is obtained by taking the stock prices for any stock. Here we have
taken the stock price of the firm ‘Goldman Sachs’ which we will be tracking in our project. The stock
prices are obtained from Yahoo! Finance and they are fortnightly prices from the period March 2007
to October 2007.
This data starting from the earliest data to the last data is as follows :
200.89 206.63 214.52 218.58 224.38 230.82
226.19 216.75 220.4 188.34 169.75 176.01
190.59 222.98

Web based Stock Forecaster Group 804
38
The %K data can only be calculated when a minimum of 2 data entries are obtained. Also %D can be
calculated only when 4 %K values are obtained which is equivalent to obtaining 5 data entries.
When the second data entry of 206.63 is taken up , %K is calculated. The HIGH value is 206.63
and the LOW value is 200.89. Also CP is 206.63.
%K = 100
(i) Data Entry = 214.52 HIGH = 214.52 LOW = 200.89 CP = 214.52 %K = 100
(ii) Data Entry = 218.58 HIGH = 218.58 LOW = 200.89 CP = 218.58 %K = 100
(iii) Data Entry = 224.38 HIGH = 224.38 LOW = 200.89 CP = 224.38 %K = 100 %D = 100
(iv) Data Entry = 230.82 HIGH = 230.82 LOW = 200.89 CP = 230.82 %K = 100 %D = 100
(v) Data Entry = 226.19 HIGH = 230.82 LOW = 200.89 CP = 226.19 %K = 84.5306 %D = 96.1326
(vi) Data Entry = 216.75 HIGH = 230.82 LOW = 200.89 CP = 216.75 %K = 52.9903 %D = 84.3802
(vii) Data Entry = 220.4 HIGH = 230.82 LOW = 200.89 CP = 220.4 %K = 65.1854 %D = 75.6766
(viii) Data Entry = 188.34 HIGH = 230.82 LOW = 188.34 CP = 188.34 %K = 0 %D = 50.6766
(ix) Data Entry = 169.75 HIGH = 230.82 LOW = 169.75 CP = 169.75 %K = 0 %D = 29.5439
(x) Data Entry = 176.01 HIGH = 230.82 LOW = 169.75 CP = 176.01 %K = 10.2505 %D = 18.859
(xi) Data Entry = 190.59 HIGH = 230.82 LOW = 169.75 CP = 190.59 %K = 34.1248 %D = 11.0938
(xii) Data Entry = 222.98 HIGH = 230.82 LOW = 169.75 CP = 222.98 %K = 87.1623 %D = 32.8844
Since for Data Entry (vii), %K value has crossed and gone below the 80 mark, a prediction of ‘SELL
STOCK’ will be obtained at this point. However since this data is old data, the prediction may or may
not still hold true. Thus no output is generated here.

Web based Stock Forecaster Group 804
39
Since %K value for (xii) has crossed and gone above the 20 mark, a prediction of ‘BUY STOCK’ will be
obtained at this point. Since this is the most recent data the prediction will still hold true.
In our project , we have also predicted the future 3 values of the stock price using the formula:
a1 = d[n-2]-d[n-3]
a2 = d[n-1]-d[n-2]
a3 = d[n]-d[n-1]
pred_d[n] = (a1+a2+a3)/3 + k[n]
pred_price = (pred_d/100)*(high-low) + low
where : pred_d is the predicted %D
pred_price is the predicted price
d[n] is the last obtained value of %D
k[n] is the last obtained value of %K
All values are converted to integer format so the decimal is neglected.
a1 = -10
a2 = -8
a3 = 21
pred_d = 87
HIGH = 230
LOW = 169
pred_price = 222.07
a1 = -8
a2 = 21
a3 = 55
pred_d = 109
HIGH = 230
LOW = 169
pred_price = 235.49
a1 = 21
a2 = 55
a3 = 22
pred_d = 141
HIGH = 230
LOW = 169
pred_price = 255.01
Thus the price has been predicted for the next 3 days. The graph of the data is given below. This
graph is obtained from the Yahoo! Finance website and it also shows the actual stock values for the
time we have predicted the stock values. Thus the comaprison of predicted stock values and actual
stock values can also be done.

Web based Stock Forecaster Group 804
40
[3]
From the graph above , we obtain the actual values for the predicted period. This is given below :
Date Actual Value Predicted Value
16 October 2007 224.83 222.07
1 November 2007 240.21 235.49
16 November 2007 233.31 255.01
Also as can be seen from the graph , the stock prices oscillate and hence the %D values oscillate.
Hence the assumption that the %D values oscillate also holds true.
The earlier example corresponds to month end values and the price predicted was for the next 3
months. This corresponds to a long term user. We can also use this techinuqe to predict values for a
short term user for another company. Here we take day end values. The prices are for the company
Deutsch Bank. The historical values are given below from the period starting from 08 May 2008 to 21
April 2008. The values are :
118.39 , 120.32 , 120.01 , 121.71 , 121.39 , 119.40 , 118.79 , 118.69 , 120.14 , 119.56 , 117.32 ,
117.40 , 119.64 , 121.63
Date Actual Value Predicted Value
18 April 2008 121.74 118
17 April 2008 118.99 117.99
16 April 2008 117.66 118.01

Web based Stock Forecaster Group 804
41
The Absolute Error using the 6 comparisons in the 2 examples above is : -9.83
The Relative Error is : 0.01
The Percentage Error is 1%
However this low value of error is usually an exceptional case. The error is very low for values which
are confined to a small band which it is large for highly varying values. This is because any prediction
technique would be unable to follow a highly varying dataset for prediction. The daily values are
usually assumed to fall within a small band while the month end values might have high variation.
On an average our predictor has an error percentage of 2-5%. This error might increase to about 5-
10% for highly varying values. Error higher than that are usually not seen for stock values hence the
error rate is low. Another way to keep error low is to predict values at times close to the data set.
Hence we do not exceed 14 days for a small term user and 60 day for a long term user. The long term
user will use month values for prediction and will predict the value of stock after 2 months.
Exceeding two months will cause error rate to increase because month end values might be highly
varying values. Since day end values are not expected to vary as much we can extend our prediction
to 14 days with acceptable error percentage.

Web based Stock Forecaster Group 804
42
5 GANTT CHART & BREAKDOWN OF INDIVIDUAL CONTRIBUTION Group members
1. Shivangi Chaudhari
2. Ronak Daya
3. Snehapreethi Gopinath
4. Mohnish Kulkarni
5. Vaidehi Kulkarni
6. Nishant Sagar
Contribution by all group members in %:
Name -> Shivangi
Chaudhari
Ronak Daya
Snehapreethi
Gopinath
Mohnish
Kulkarni
Vaidehi
Kulkarni
Nishant
Sagar
Task
Database tables
creation 0 50 10 0 0 40
Population of
Database(script
s/manual)
40 30 15 0 0 15
Webservice
modules 100 0 0 0 0 0
Client
Implementaion 100 0 0 0 0 0
Predictor
Algorithm 0 0 0 100 0 0
Client UI Html 10 10 0 0 80 0
Report
documentation 15 3 26 15 40 1
UML Diagrams 0 20 40 0 40 0

Web based Stock Forecaster Group 804
43
Gantt chart:

Web based Stock Forecaster Group 804
44
6 APPENDIX A The list of companies listed in the database:
List of Companies
Google Microsoft Motorola
AT & T AMD Apple
Amazon BSC Euro Stoxx 50
AIG Xilinx Analog Devices
Bank of America Intel Wachovia
Lenovo Toshiba Dell
Tata Infosys Technologies Tata Consultancies Services
Adobe Abercrombie and Fitch Goldman Sachs
Barclays Capital Barnes & Noble Hewlett Packard
Merrill Lynch Lockheed Martin Honeywell
Warner Brothers Goodyear Tyres NY Times
Texas Instruments National Instruments Qualcomm
Avaya Lehmann Brothers Verizon Wireless
Vodafone Sprint IBM
Yahoo Disney Walmart
Walgreens Siemens Blackrock
Cognizant Accenture Cisco
Delphi JP Morgan Sony
Philips Johnson & Johnson Schlumberger
Citibank Deutsche Bank UBS

Web based Stock Forecaster Group 804
45
7 APPENDIX B Web Services in .Net[6]
Web Services brings information into the applications from the Internet in much the same way that browsers make information available to end users. Web services can be easily supported on a wide range of platforms. The web service may extend its interface and add new methods without affecting the clients as long as it still provides the old methods and parameters. A client makes a request to a web service, the web service returns the result, and the connection is closed. There is no permanent connection. This makes it easy to scale up and out to many clients and use a server farm to serve the web services. The underlying HTTP used by web services is also stateless. Microsoft suggests two rules of thumb for deciding whether to use web services. If you need to cross platform boundaries (for example, communicate between a .NET and a Java application) or trust boundaries (for example, communicate between two companies), web services make great sense. Web services are also a good choice if you want to use built-in ASP.NET features such as caching or IIS features[5] such as SSL security or Windows authentication. Several specifications are used when building web services. Figure shows the web service stack as it exists today.
Figure - The web service technology stack The SOAP, WSDL, and UDDI protocols that support web services.

Web based Stock Forecaster Group 804
46
Table summarizes these standards. Table - Web Service Standards
Standard Description
WSDL Used to create an interface definition for a web service. The WSDL document tells a client what methods are present in a web service, what parameters and return values each method uses, and how to communicate with them.
SOAP The message format used to encode information (such as data values) before sending it to a web service.
HTTP The protocol over which all web service communication takes place. For example, SOAP messages are sent over HTTP channels.
DISCO Used to create discovery documents that provide links to multiple web service endpoints. This standard is Microsoft-specific and will eventually be replaced by a similar standard named WS-Inspection.
UDDI A standard for creating business registries that catalog companies, the web services they provide, and the corresponding URLs for their WSDL contracts.
Two specifications help in the discovery of a web service: DISCO (an abbreviation of discovery): The DISCO standard creates a single file that groups a list of related web services. A company can publish a DISCO file on its server that contains links to all the web services it provides. Then clients simply need to request this file to find all the available web services. This is useful when the client already knows a company that it's offering services and wants to see what web services they expose and find links to the details of its services. It's not very useful to search for new web services over the Internet, but it may be helpful for local networks where a client connects to the server and can see what and where services are available. UDDI (Universal Description, Discovery, and Integration): UDDI is a centralized directory where web services are published by a group of companies. It's also the place where potential clients can go to search for their specific needs. Different organizations and groups of companies may use different UDDI registries. To retrieve information from a UDDI directory or register components, we use a web service interface. In our case, we have registered our web service in the Local host (IIS server). Discovery is one of the newest and least mature parts of the web service protocol stack. DISCO is supported only by Microsoft and is slated to be replaced by a similar more general standard named WS-Inspection in future .NET releases. Describing a Web Service For a client to know how to access a web service, the client must know what methods are available, what parameters each method uses, and what the data type of each parameter is. The WSDL (Web Service Description Language) is an XML-based language that describes all these details. It describes the request message a client needs to submit to the web service and the response message the web service returns. It also defines the transport protocol you need to use (typically HTTP) and the location of the web service. WSDL is a complex standard. But .Net frame work provides internal tools that consume WSDL

Web based Stock Forecaster Group 804
47
information and automatically generate helper classes that hide the low-level plumbing required to interact with web services. The Wire Format To communicate with a web service, you need a way to create request and response messages that can be parsed and understood on any platform. SOAP (formerly Simple Object Access Protocol but no longer considered an acronym) is the XML-based language you use to create these messages. It's important to understand that SOAP defines the messages you use to exchange data (the message format), but it doesn't describe how you send the message (the transport protocol). With ASP.NET web services, the transport protocol is HTTP. In other words, to communicate with a web service, a client opens an HTTP connection and sends a SOAP message. .NET also supports HTTP GET and HTTP POST, two simpler approaches for interacting with web services that aren't as standardized and don't offer the same rich set of features. In both these cases, an HTTP channel is used for communication, and data is sent as a simple collection of name/value pairs, not as a full-blown SOAP message. The only place you're likely to see this simpler approach used in the .NET environment is in the simple browser-based page ASP.NET provides for testing your web services. In fact, by default the ASP.NET 1.1 machine.config[7] file allows only HTTP POST requests from the local computer and disables HTTP GET support entirely. Web.config[9] [8] is the main settings and configuration file for an ASP.NET web application. The file is an XML document that defines configuration information regarding the web application. The web.config file contains information that control module loading, security configuration, session state configuration, and application language and compilation settings. Web.config files can also contain application specific items such as database connection strings and configurable parameters. Figure summarizes the web service life cycle. First, the web service consumer finds the web service, either by going directly to the web service URL or by using a UDDI server or DISCO file. Next, the client retrieves the web service WSDL document, which describes how to interact with the web service. Both of these tasks take place at design time. When you run the application and actually interact with the web service, the client sends a SOAP message to trigger to the appropriate web method.
Figure - The web service life cycle

Web based Stock Forecaster Group 804
48
The screen shot of the web application is shown below. This can be seen when you right click and browse the file StockInfo.asmx.

Web based Stock Forecaster Group 804
49
On clicking on any of the method links, the following page appears. The image also shows the soap
request and response generated.
SOAP 1.2
The following is a sample SOAP 1.2 request and response. The placeholders shown need to be replaced with actual values.
POST /StockInfo.asmx HTTP/1.1
Host: localhost
Content-Type: application/soap+xml; charset=utf-8
Content-Length: length
<?xml version="1.0" encoding="utf-8"?>
<soap12:Envelope xmlns:xsi="http://www.w3.org/2001/XMLSchema-instance"
xmlns:xsd="http://www.w3.org/2001/XMLSchema"
xmlns:soap12="http://www.w3.org/2003/05/soap-envelope">
<soap12:Body>
<GetSpeculativePrice xmlns="http://tempuri.org/">
<stockID>string</stockID>
<termCode>int</termCode>
</GetSpeculativePrice>
</soap12:Body>
</soap12:Envelope>
HTTP/1.1 200 OK
Content-Type: application/soap+xml; charset=utf-8
Content-Length: length
<?xml version="1.0" encoding="utf-8"?>
<soap12:Envelope xmlns:xsi="http://www.w3.org/2001/XMLSchema-instance"
xmlns:xsd="http://www.w3.org/2001/XMLSchema"
xmlns:soap12="http://www.w3.org/2003/05/soap-envelope">
<soap12:Body>
<GetSpeculativePriceResponse xmlns="http://tempuri.org/">
<GetSpeculativePriceResult>decimal</GetSpeculativePriceResult>
</GetSpeculativePriceResponse>
</soap12:Body>
</soap12:Envelope>
HTTP GET
The following is a sample HTTP GET request and response. The placeholders shown need to be replaced with actual values.
GET /StockInfo.asmx/GetSpeculativePrice?stockID=string&termCode=string
HTTP/1.1
Host: localhost
HTTP/1.1 200 OK
Content-Type: text/xml; charset=utf-8
Content-Length: length
<?xml version="1.0" encoding="utf-8"?>
<decimal xmlns="http://tempuri.org/">decimal</decimal>

Web based Stock Forecaster Group 804
50
HTTP POST
The following is a sample HTTP POST request and response. The placeholders shown need to be replaced with actual values.
POST /StockInfo.asmx/GetSpeculativePrice HTTP/1.1
Host: localhost
Content-Type: application/x-www-form-urlencoded
Content-Length: length
stockID=string&termCode=string
HTTP/1.1 200 OK
Content-Type: text/xml; charset=utf-8
Content-Length: length
<?xml version="1.0" encoding="utf-8"?>
<decimal xmlns="http://tempuri.org/">decimal</decimal>
The WSDL file that is generated can be viewed by clicking the “Service Description” (in blue).

Web based Stock Forecaster Group 804
51
8 REFERENCES
[1] http://en.wikipedia.org/wiki/Stochastic_oscillator
[2] http://www.investopedia.com/terms/s/stochasticoscillator.asp
[3] http://finance.yahoo.com/q/bc?s=GS&t=1d
[4] http://msdn.microsoft.com/en-us/library/ms972326.aspx
[5] http://msdn.microsoft.com/en-us/library/aa737439.aspx
[6] http://msdn.microsoft.com/en-us/library/ms644563.aspx
[7] http://msdn.microsoft.com/en-us/library/ms229697(vs.71).aspx
[8] http://support.microsoft.com/kb/815179
[9] http://msdn.microsoft.com/en-us/library/aa719558(VS.71).aspx
[10] http://msdn.microsoft.com/en-us/library/aa287473(VS.71).aspx
[11] http://www.faqts.com/knowledge_base/view.phtml/aid/27512
[12] http://msdn.microsoft.com/en-us/library/h8w79z10%28VS.71%29.aspx