ECBC-TR-1506 NIST-TRACEABLE NMR METHOD TO DETERMINE ...
34
ECBC-TR-1506 NIST-TRACEABLE NMR METHOD TO DETERMINE QUANTITATIVE WEIGHT PERCENTAGE PURITY OF MUSTARD (HD) FEEDSTOCK SAMPLES David J. McGarvey RESEARCH AND TECHNOLOGY DIRECTORATE William R. Creasy LEIDOS, INC. Abingdon, MD 21009-1261 Theresa R. Connell EXCET, INC. Springfield, VA 22150-2519 January 2018 Approved for public release: distribution unlimited.
Transcript of ECBC-TR-1506 NIST-TRACEABLE NMR METHOD TO DETERMINE ...
ECBC-TR-1506
NIST-TRACEABLE NMR METHOD TO DETERMINE QUANTITATIVE WEIGHT PERCENTAGE PURITY OF MUSTARD (HD)
FEEDSTOCK SAMPLES
David J. McGarvey
RESEARCH AND TECHNOLOGY DIRECTORATE
William R. Creasy
LEIDOS, INC. Abingdon, MD 21009-1261
Theresa R. Connell
EXCET, INC.
Springfield, VA 22150-2519
January 2018
Approved for public release: distribution unlimited.

Disclaimer
The findings of this report are not to be construed as an official Department of the Army position unless so designated by other authorizing documents.

REPORT DOCUMENTATION PAGE Form Approved
OMB No. 0704-0188 Public reporting burden for this collection of information is estimated to average 1 hour per response, including the time for reviewing instructions, searching existing data sources, gathering and maintaining the data needed, and completing and reviewing this collection of information. Send comments regarding this burden estimate or any other aspect of this collection of information, including suggestions for reducing this burden to Department of Defense, Washington Headquarters Services, Directorate for Information Operations and Reports (0704-0188), 1215 Jefferson Davis Highway, Suite 1204, Arlington, VA 22202-4302. Respondents should be aware that notwithstanding any other provision of law, no person shall be subject to any penalty for failing to comply with a collection of information if it does not display a currently valid OMB control number. PLEASE DO NOT RETURN YOUR FORM TO THE ABOVE ADDRESS.
1. REPORT DATE (DD-MM-YYYY)
XX-01-2018
2. REPORT TYPE
Final
3. DATES COVERED (From - To)
Jan 2012–May 2012
4. TITLE AND SUBTITLE
NIST-Traceable NMR Method to Determine Quantitative Weight Percentage Purity
of Mustard (HD) Feedstock Samples
5a. CONTRACT NUMBER
W911SR-10-D-0004 5b. GRANT NUMBER
5c. PROGRAM ELEMENT NUMBER
6. AUTHOR(S)
McGarvey, David J. (ECBC); Creasy, William R. (Leidos); and Connell, Theresa R.
(Excet)
5d. PROJECT NUMBER
5e. TASK NUMBER
5f. WORK UNIT NUMBER
7. PERFORMING ORGANIZATION NAME(S) AND ADDRESS(ES)
Director, ECBC, ATTN: RDCB-DRC-M, APG, MD 21010-5424
Leidos, Inc.; Box Hill Corporate Center Drive, Abingdon, MD 21009-1261
Excet, Inc.; 6225 Brandon Avenue, Suite 360, Springfield, VA 22150-2519
8. PERFORMING ORGANIZATION REPORT NUMBER
ECBC-TR-1506
9. SPONSORING / MONITORING AGENCY NAME(S) AND ADDRESS(ES)
10. SPONSOR/MONITOR’S ACRONYM(S)
11. SPONSOR/MONITOR’S REPORT NUMBER(S)
12. DISTRIBUTION / AVAILABILITY STATEMENT
Approved for public release: distribution unlimited.
13. SUPPLEMENTARY NOTES
14. ABSTRACT
A National Institute of Standards (NIST)-traceable method for using nuclear magnetic resonance (NMR) with proton detection
is described for determining the weight percent purity of feedstock samples of sulfur mustard (HD). A precision and accuracy
test was done. An alternative method for 13C NMR detection is also described.
15. SUBJECT TERMS
Sulfur mustard (HD) Purity determination Nuclear magnetic resonance (NMR)
16. SECURITY CLASSIFICATION OF:
17. LIMITATION OF ABSTRACT
UU
18. NUMBER OF PAGES
34
19a. NAME OF RESPONSIBLE PERSON
Renu B. Rastogi
a. REPORT
U b. ABSTRACT
U c. THIS PAGE
U 19b. TELEPHONE NUMBER (include area code)
(410) 436-7545
Standard Form 298 (Rev. 8-98) Prescribed by ANSI Std. Z39.18

ii
Blank
iii
PREFACE
The work described in this report was authorized under contract no. W911SR-10-
D-0004. This work was started in January 2012 and completed in May 2012.
The use of either trade or manufacturers’ names in this report does not constitute
an official endorsement of any commercial products. This report may not be cited for purposes of
advertisement.
The text of this report is published as received and was not edited by the
Technical Releases Office, U.S. Army Edgewood Chemical Biological Center.
This report has been approved for public release.
Acknowledgment
The authors thank Sue Procell (Directorate of Program Integration; U.S. Army
Edgewood Chemical Biological Center; Aberdeen Proving Ground, MD).

iv
Blank
v
CONTENTS
1. INTRODUCTION……………………………………………………………………………………………………… ... ….1
2. PROCEDURE………………………………………………………………………………………….……………… .... ……1
2.1 Supplies……………………………………………………………………………….………………… .... ……..1
2.2 Sample Preparation…………………………………………………………….……………….………. .... 2
2.3 Obtaining the NMR spectrum……….…………………………………….………………… ..... ……..3
2.4 Data Processing……………………………………………………………….…………………..…… .... ….4
2.5 Purity Calculation…………………………………………………………………………………… ..... …….6
3. ALTERNATE METHOD FOR PURITY CONFIRMATION USING 13C SPECTRA……………… ..... ……7
4. CONCLUSIONS…………………………………………………………………………………………………… ...... .……9
LITERATURE CITED……………………………………………………………………………………………. ..... ….…10
Appendix I: Precision and Accuracy Testing Data for the NIST-Traceable HD Method using Proton NMR.11
I-1. Approach…………………………………………………………………………………………. ... ………….11
I-2. Results………………………………………………………………… .... ………………………….…………..12
I-3 Certify Results………………………………………………… ......... ………………………..…………….17
Appendix II: Confirmation Data for the HD Method Using 13C NMR ....................................... …………………21
II-1 Approach .............................................................................................................. 21
vi
FIGURES
1. Proton NMR spectrum of HD agent and the internal standard 1,2,4,5-
tetramethylbenzene………………………………………………………………………………………….. …………….……..5
2. Plot showing the spectrum in Figure 1 with an expanded y-scale……………………….…………… ………6
3. Plot showing a 13C spectrum of the same sample used for the proton spectrum in Figure 1 for
HD………….........................................................................................................................................9
I-1: Plot of the data from four days, Found Z vs. Target Z………………………………………………………………14 I-2: Certify Results……………………………………………………………………………………………………..………………….17 I-3: Certify Results……………………………………………………………………………………………………………………..….18 I-4: Certify Results………………………………………………………………………………………………………………………...19 I-5: Certify Results………………………………………………………………………………………………………………………...20 II-1: Inversion Recovery Results……………………………………………………………………………………………..……..22
II-2: 13C NMR spectrum of HD with an internal standard of 1,1,1,2-tetrachloroethane………25
TABLES
I-1: Data from Day 1…………………………………………………………………………………………………… ............ .12
I-2: Data from Day 2….………………………………………………………………………………………………… ............ 13
I-3: Data from Day 3……………………………………………………………….…………………….…………...... .......... .13
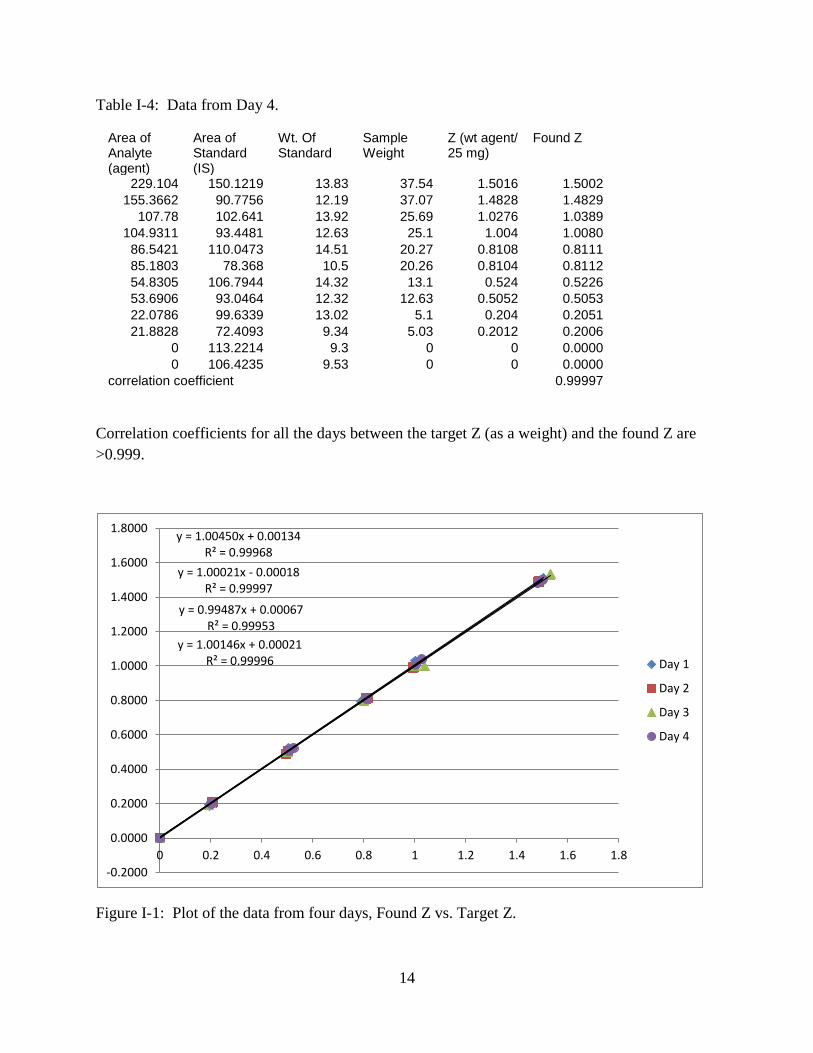
I-4: Data from Day 4………………………………………………………………………...………………….……… ........... .14
I-5: Data from Day 1, used to calculate purity for each run…………………….…….………….…….. ........ 15
I-6: Data from Day 1 using only the 3.65 triplet in the calculations……………….……….….…… ......... 16
I-7: Data from repeated runs of one prepared sample………………………………….……….….… ......... …16
II-1: Data showing the relationship of signal to noise ratio to the number of scans for 13C
spectra…………………………………………………………………………… ............................................ …23
1
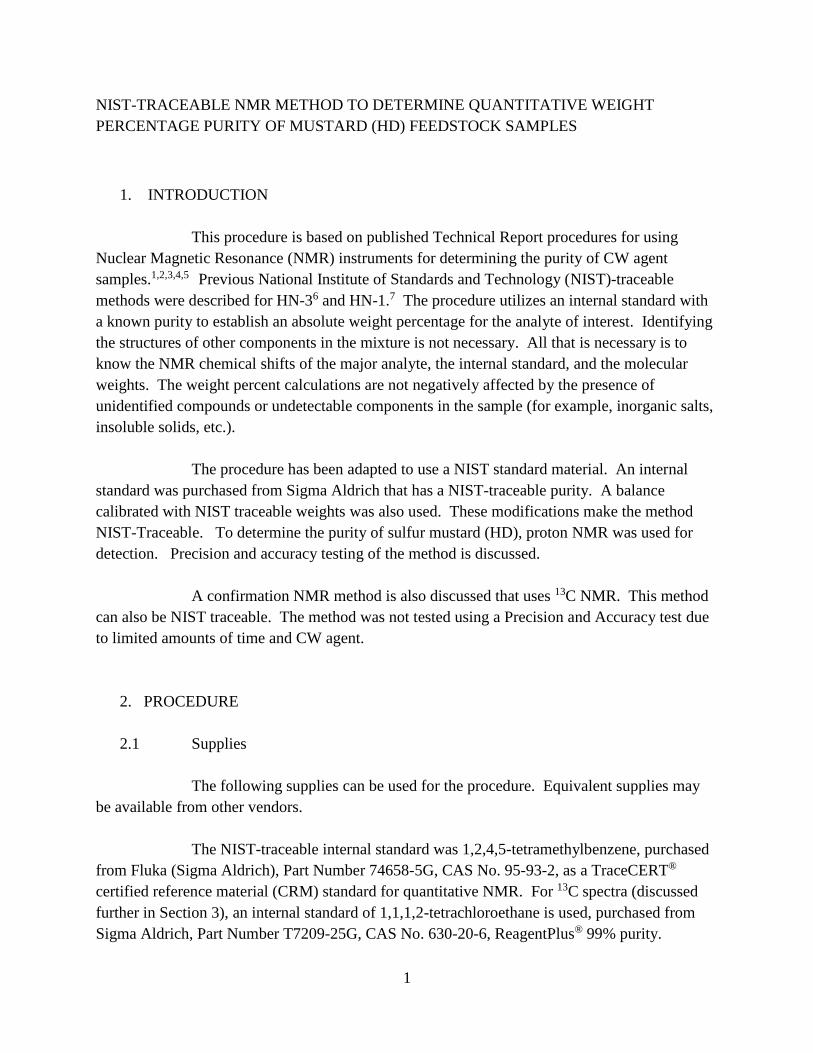
NIST-TRACEABLE NMR METHOD TO DETERMINE QUANTITATIVE WEIGHT
PERCENTAGE PURITY OF MUSTARD (HD) FEEDSTOCK SAMPLES
1. INTRODUCTION
This procedure is based on published Technical Report procedures for using
Nuclear Magnetic Resonance (NMR) instruments for determining the purity of CW agent
samples.1,2,3,4,5 Previous National Institute of Standards and Technology (NIST)-traceable
methods were described for HN-36 and HN-1.7 The procedure utilizes an internal standard with
a known purity to establish an absolute weight percentage for the analyte of interest. Identifying
the structures of other components in the mixture is not necessary. All that is necessary is to
know the NMR chemical shifts of the major analyte, the internal standard, and the molecular
weights. The weight percent calculations are not negatively affected by the presence of
unidentified compounds or undetectable components in the sample (for example, inorganic salts,
insoluble solids, etc.).
The procedure has been adapted to use a NIST standard material. An internal
standard was purchased from Sigma Aldrich that has a NIST-traceable purity. A balance
calibrated with NIST traceable weights was also used. These modifications make the method
NIST-Traceable. To determine the purity of sulfur mustard (HD), proton NMR was used for
detection. Precision and accuracy testing of the method is discussed.
A confirmation NMR method is also discussed that uses 13C NMR. This method
can also be NIST traceable. The method was not tested using a Precision and Accuracy test due
to limited amounts of time and CW agent.
2. PROCEDURE
2.1 Supplies
The following supplies can be used for the procedure. Equivalent supplies may
be available from other vendors.
The NIST-traceable internal standard was 1,2,4,5-tetramethylbenzene, purchased
from Fluka (Sigma Aldrich), Part Number 74658-5G, CAS No. 95-93-2, as a TraceCERT®
certified reference material (CRM) standard for quantitative NMR. For 13C spectra (discussed
further in Section 3), an internal standard of 1,1,1,2-tetrachloroethane is used, purchased from
Sigma Aldrich, Part Number T7209-25G, CAS No. 630-20-6, ReagentPlus® 99% purity.
2
The following supplies were purchased from Wilmad (1172 NW Boulevard
Vineland, NJ 08360, phone 800-220-5171, http://www.wilmad-labglass.com/ordering/index.jsp):
Item Part Number
5 mm dia. 8" long NMR tube WG-1000-8-50
Teflon inserts 6005
pasteur pipets, 9" C-7095B-9
The following supplies were purchased from Sigma Aldrich
(http://www.sigmaaldrich.com/chemistry.html):
Item Part Number
chloroform, 99.9% D 23,689-6
For the Precision and Accuracy testing, a JEOL ECS-400 Nuclear Magnetic
Resonance spectrometer with a 400 MHz (9.8 T) superconducting magnet and 5 mm liquid
analysis probe was used. A Sartorius Cubis balance (Model MSA6.6S-000-DM, precision 1 µg)
was used after installation in a fume hood and calibration using NIST-traceable weights. NMR
systems and balances from other vendors should give comparable results, if the operators have
the appropriate training.
Other common laboratory equipment is used, including a vortex mixer, spatulas,
and volumetric pipets. This equipment is not critical to the accurate performance of the method.
2.2 Sample Preparation
This procedure was performed under proper engineering controls, in accordance
with surety and safety regulations, equipment validations, and SOPs approved by the ECBC
Safety and Health Office. The balance must be calibrated using NIST-traceable weights.
a. Tare a screw-cap vial with cap on the balance. Transfer 10-20 mg of neat internal
standard, the NIST traceable 1,2,4,5-tetramethylbenzene, into the vial. This compound is
a solid material, so it is transferred with a clean spatula. Replace the cap and determine
the weight of the internal standard to an accuracy of 0.01 mg. Tare the balance after
recording the weight.
b. Add 5-35 mg of feedstock agent sample to the vial. The liquid agent can be measured
with a pipet (4 to 30 µl of liquid). (A precision and accuracy test of this method has been
done over this range of agent amounts, see Appendix I.) Record the weight to an
3
accuracy of 0.01 mg in a laboratory notebook. Appropriate agent accountability
documentation is used to record the consumption.
c. Add 0.4 ml of reagent-grade deuterated chloroform (CDCl3).
d. Vortex or mix the sample for at least 15 s to dissolve both compounds in the solvent.
e. Transfer the solution into a PTFE NMR tube insert. (Optional: A glass 4mm insert tube
may be used, and flame sealed, if desired)
f. Place the insert into a 5 mm glass NMR tube and push it to the bottom of the tube. Cap
the insert with a PTFE stopper. Cap the NMR tube with a cap, or flame seal the outer
tube without damaging the insert.
2.3 Obtaining the NMR spectrum
Operators of the NMR must have sufficient training to understand the general
operational principles and to use the instrument computer control to perform the required tasks.
To validate the NMR is functioning correctly, a manufacturer sample such as 0.01%
ethylbenzene in deuterated acetone can be analyzed to check the signal response. The analysis of
this sample can be done periodically as part of the instrument QC validation. Detailed QC
specifications are not included in this method.
a. Place the NMR tube into the spinner using a depth gauge to orient the tube at the correct
depth relative to the detection coils. Activate the lift air supply, place the sample on top
of the magnet, and deactivate the lift air supply to lower the sample into the magnet bore.
(Note: The doubly-contained NMR tube that contains agent will be outside of
engineering controls.)
b. Lock the instrument on the deuterium signal from the CDCl3.
c. Shim the magnet to maximize the lock signal.
d. Tune and match the probe. (Tune for the optimal signal response, and impedance match
the probe to the sample. On some instruments, this operation is done automatically by
the instrument software and autotune equipment. On older instruments, it must be done
using manual adjustments on the NMR probe.)
e. OPTIONAL: Determine the T1 relaxation time of the analytes in the sample solution.
Use the instrument console to load the data file or instrument parameters for an inversion
recovery experiment for proton detection. Perform the experiment with at least six delay
times. Process the data to plot the recovery curve for each analyte peak, and determine
the T1 relaxation time from the data plot. Identify the longest T1 value for all the peaks.
The relaxation delay time for the quantitative purity measurement is calculated to be at
least 10 times the longest relaxation time. This procedure to determine the T1 relaxation
time should be done if there is an inconsistency in the purity determination, if a new
instrument is being used, or if it is necessary to minimize the experiment acquisition time.
4
f. Load instrument parameters to acquire a 1D proton spectrum. If the T1 relaxation time is
not determined (i.e., step e is not performed), then set the relaxation time to 40 s. (This is
typically 20 times longer than the longest T1 in the solvent.) Do not use Nuclear
Overhauser Enhancement (NOE), decoupling, or water peak suppression pulse
sequences.
g. Open a new data file on the NMR computer with a unique filename, the sample
information, and notebook reference. Load the parameters for proton acquisition. The
following parameters are used. (Actual parameter names will vary depending on the
make and model of the NMR and can be found in the NMR documentation.):
Relaxation time: 40 s or as determined in step e.
Excite pulse: 90º pulse (Determining the time and amplitude for this pulse that
corresponds to a 90° proton excitation should be found in the NMR instrument
documentation.)
Number of data points: 64K
Number of scans: 16
Sweep width: 15 ppm
Center frequency: 5 ppm
Decoupling: off
NOE: off
Automatic gain determination: on
h. Acquire data.
i. A total of seven or more replicate runs are acquired for statistical determination of the
NMR variability, signal to noise ratio, and integration errors. Several samples can be
prepared by weight to determine the weighing statistical errors (see Appendix I).
2.4 Data Processing
a. Apply a window function (exponential multiplication). This may be done using a line
broadening parameter in the range of 0.5 to 2 Hz, which can be adjusted to enhance the
signal to noise ratio. A larger line broadening produces wider peaks, which can degrade
the resolution between peaks. The same value of line broadening must be used for all the
data files for the repeat runs.
b. Fourier transform (FFT) to convert data from time to frequency domain and to produce
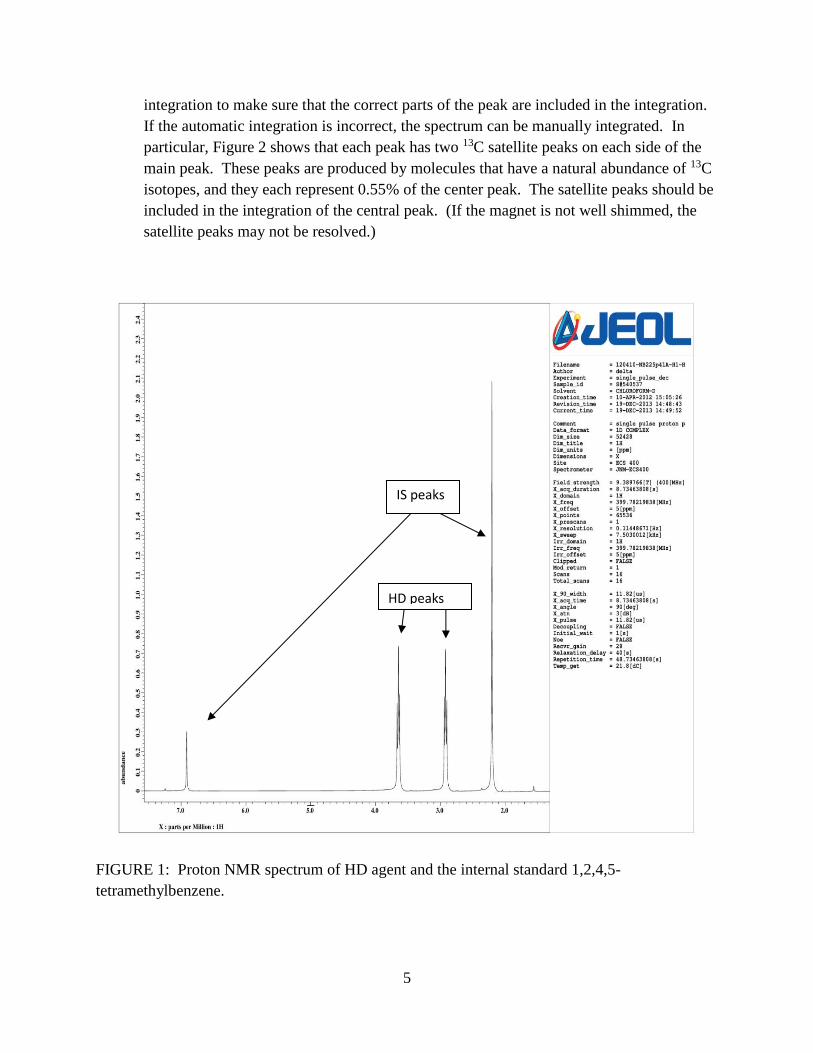
the NMR spectrum. A sample spectrum is shown in Figure 1.
c. Phase all peaks in the spectrum and correct the baseline if necessary.
d. If necessary for reporting, reference the chemical shift against the internal standard.
e. Integrate the relevant peaks in the spectrum to obtain the areas. A sample integrated
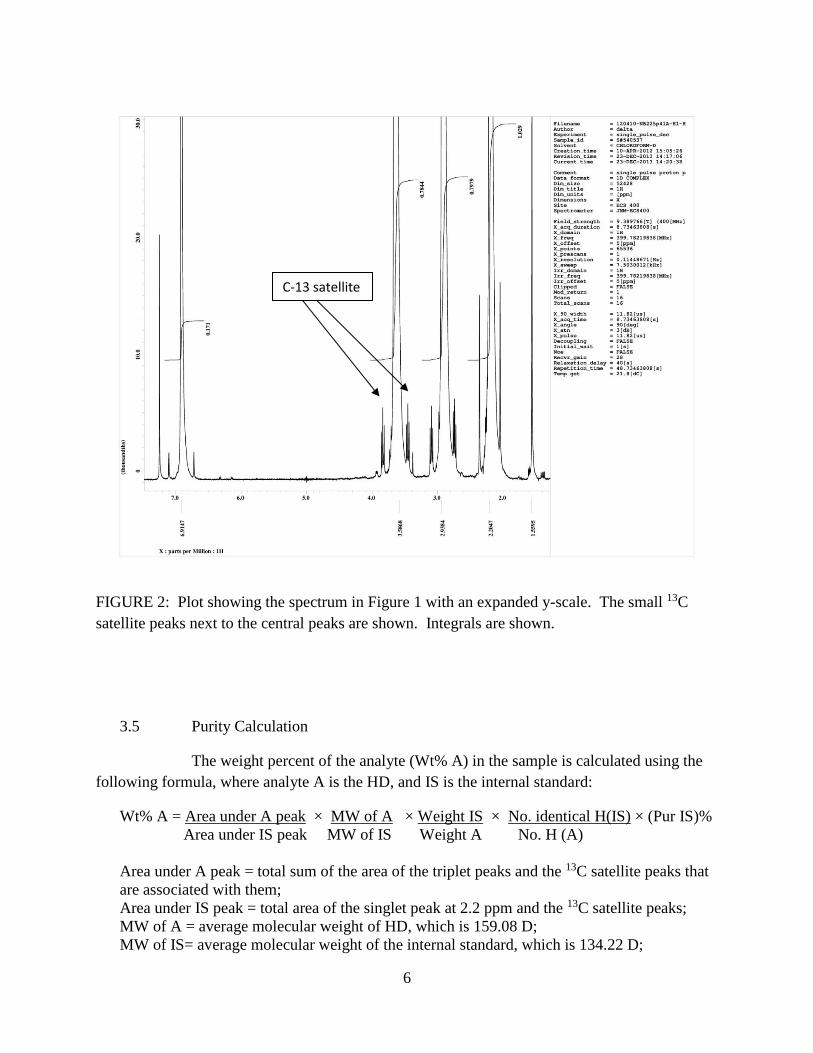
spectrum is shown in Figure 2 with an expanded y-scale. Some data systems will
perform automatic integration of peaks. It is necessary for the operator to examine the
5
integration to make sure that the correct parts of the peak are included in the integration.
If the automatic integration is incorrect, the spectrum can be manually integrated. In
particular, Figure 2 shows that each peak has two 13C satellite peaks on each side of the
main peak. These peaks are produced by molecules that have a natural abundance of 13C
isotopes, and they each represent 0.55% of the center peak. The satellite peaks should be
included in the integration of the central peak. (If the magnet is not well shimmed, the
satellite peaks may not be resolved.)
FIGURE 1: Proton NMR spectrum of HD agent and the internal standard 1,2,4,5-
tetramethylbenzene.
HD peaks
IS peaks
6
FIGURE 2: Plot showing the spectrum in Figure 1 with an expanded y-scale. The small 13C
satellite peaks next to the central peaks are shown. Integrals are shown.
3.5 Purity Calculation
The weight percent of the analyte (Wt% A) in the sample is calculated using the
following formula, where analyte A is the HD, and IS is the internal standard:
Wt% A = Area under A peak × MW of A × Weight IS × No. identical H(IS) × (Pur IS)%
Area under IS peak MW of IS Weight A No. H (A)
Area under A peak = total sum of the area of the triplet peaks and the 13C satellite peaks that
are associated with them;
Area under IS peak = total area of the singlet peak at 2.2 ppm and the 13C satellite peaks;
MW of A = average molecular weight of HD, which is 159.08 D;
MW of IS= average molecular weight of the internal standard, which is 134.22 D;
C-13 satellite
ks
7
Weight IS=balance recorded weight of internal standard in the vial;
Weight A=balance recorded weight of feedstock HD sample in the vial;
No. identical H (IS)=the number of identical protons in the internal standard, which is 12;
No. H (A)=the number of protons in the integrated peaks of the analyte,
Pur IS = the purity of the internal standard is taken from the documentation from the NIST
traceable internal standard.
Two alternatives are possible for integrating the HD peaks. If the total area of
both triplets at 2.9 and 3.6 ppm are used, then the total number of protons No. H (A) is 8. When
only one triplet is used, usually at 3.6 ppm, then No. H (A) is 4. The reason for using only one
triplet is that when the sample contains a significant amount of the impurity dithiane, the NMR
peaks for that compound may overlap with the triplet at 2.9 ppm, and cause that triplet to have an
area that is too large. There are other impurities that contain C-S bonds that may also have a
chemical shift near the 2.9 ppm triplet. This can result in an inaccurate purity determination.
If the analytical statistical accuracy is reported, the calculated weight percentages
for each replicate run can be averaged to find a mean (average) and standard deviation. For
seven replicates, the mean ± 2 × (standard deviation) provides the 95% confidence range.
3. ALTERNATE METHOD FOR PURITY CONFIRMATION USING 13C SPECTRA
As an alternative method for confirming the results of the purity determination
method, the purity can also be found using a 13C spectrum. The advantage of this approach is to
provide higher spectral resolution, so that impurities can be more easily identified in the
spectrum by resolving them from the HD peaks. The disadvantage is that the 13C spectrum is
less sensitive. This is because 13C is only present as 1.1% of all the carbon atoms. As a result,
longer data acquisition times are needed to obtain an adequate signal to noise ratio, and the
precision of the result is less.
The sample can be prepared following the same procedure as in Section 2. A
modification is to use a larger amount of HD and internal standard to compensate for the lower
sensitivity. Quantities of up to 200 mg of HD and internal standard can be used in Step b of
Section 2.2.
The following NMR instrument parameters can be used, substituting for Step g of
Section 2.3:
Load the parameters for 1D 13C acquisition.
Relaxation time: 30 to 60 s or as determined in step e.
Excite pulse: 90º pulse (determining the time for this pulse that corresponds to a
90° pulse should be found in the NMR instrument documentation)
Number of data points: 64K
Number of scans: 128 or more
Sweep width: 400 ppm
8
Center frequency: 100 ppm
Proton Decoupling: on
NOE: off
Automatic gain determination: on
There are several main modifications for the instrument conditions. First, the
proton decoupling is turned on, which increases the sensitivity and decreases the splitting and
peak widths. However, this condition causes some distortion of the signal responses for different
peaks. Since the decoupling transfers signal intensity to the carbon atom, it is observed that CH3
groups have the highest relative signal intensity, and others follow in the order of CH3 > CH2 >
CH > C. In order to obtain accurate quantitation for the CH2 groups in HD, it is necessary to
have an internal standard that also has CH2 groups. A convenient internal standard is 1,1,1,2-
tetrachloroethane, purchased from Sigma Aldrich, Part Number T7209-25G, CAS No. 630-20-6,
ReagentPlus® 99% purity. However, this standard is not a TraceCERT standard, so in order for
the method to be NIST traceable, the standard has to be treated as a secondary standard relative
to 1,2,4,5-tetramethylbenzene (or another NIST standard). The purity of the standards can be
compared using proton NMR. In practice, the purity that is determined by 13C NMR has lower
precision than that for proton NMR, so the uncertainty in the purity of the internal standard is not
usually a large contribution to the overall uncertainty.
The second modification is to the relaxation delay time. As discussed in Step e of
Section 2.3, the T1 delay time can be obtained for the peaks in the 13C spectrum in the same way
as for a proton spectrum, using an inversion recovery experiment. The T1 delay times are
typically longer for 13C spectra than for proton spectra, so the relaxation delay should be the
same or longer for the 13C spectral parameters. But the delay is changed from 40 s for proton to
30 to 60 s for 13C for one acquisition, so that more signal averaging can be done or more
repetitions can be done. The number of scans increases from 16 for proton to 128 (or more) for 13C. Smaller values for the relaxation delay can lead to some systematic error of the relative
peak areas, but the error is typically less than the random error that is produced by the lower
signal-to-noise ratio of the spectra due to the lower signal strength. The signal to noise ratio for
a typical spectrum should be at least 50. The measurement of a T1 value is discussed in
Appendix II.
The spectral sweep width of 400 ppm and center frequency of 100 ppm are typical
default values for 13C spectra, since the spectra cover a wider range of frequencies than the
proton spectra cover. A typical spectrum is shown in Figure 3.
Using these conditions, the purity can be calculated using the same method as
described in Section 2.5. A P&A study has not been done on the 13C purity method. A study to
optimize the parameters such as the relaxation time and number of scans will be time consuming.
Typical testing results are given in Appendix II.
9
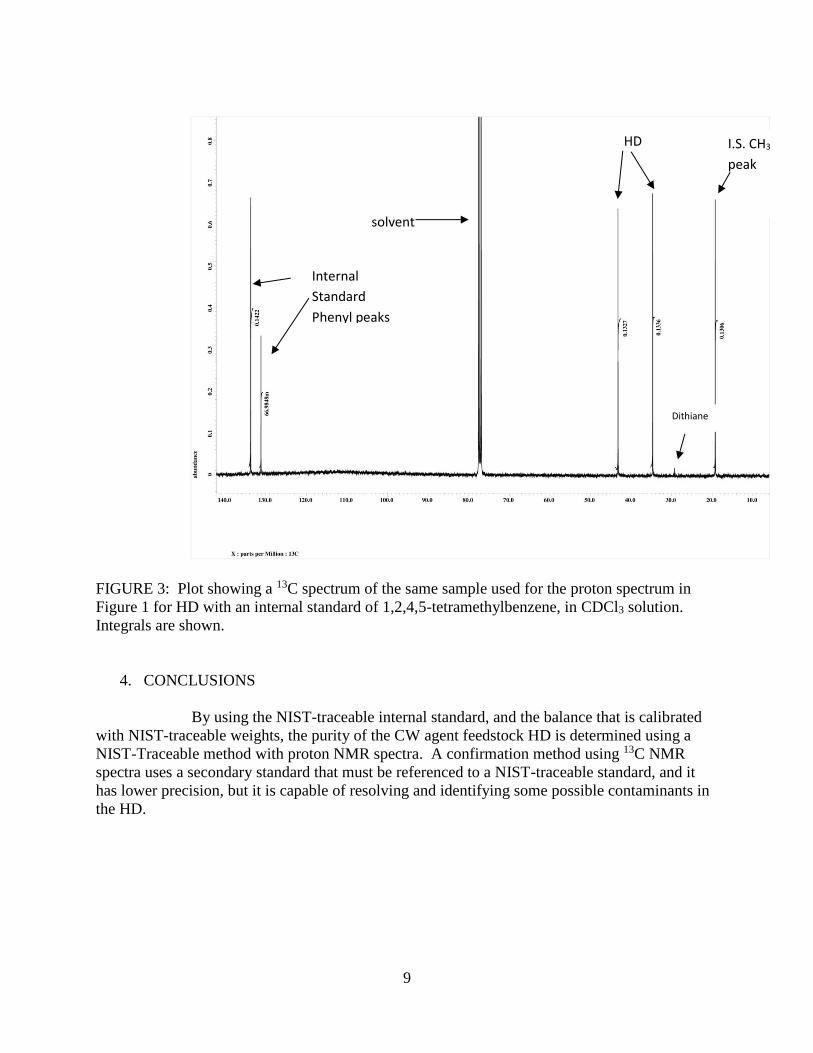
FIGURE 3: Plot showing a 13C spectrum of the same sample used for the proton spectrum in
Figure 1 for HD with an internal standard of 1,2,4,5-tetramethylbenzene, in CDCl3 solution.
Integrals are shown.
4. CONCLUSIONS
By using the NIST-traceable internal standard, and the balance that is calibrated
with NIST-traceable weights, the purity of the CW agent feedstock HD is determined using a
NIST-Traceable method with proton NMR spectra. A confirmation method using 13C NMR
spectra uses a secondary standard that must be referenced to a NIST-traceable standard, and it
has lower precision, but it is capable of resolving and identifying some possible contaminants in
the HD.
Internal
Standard
Phenyl peaks
solvent
HD I.S. CH3
peak
Dithiane
10
LITERATURE CITED
1 O’Connor, R.J.; Brickhouse, M.D.; McGarvey, D.; Durst, H.D., Creasy, W.R.; Ruth, J.L.,
NMR Method for the Quantitative Purity Analysis of Neat Feed Stock Samples; ECBC-TR-253;
U.S. Army Edgewood Chemical Biological Center: Aberdeen Proving Ground, MD, 2002;
UNCLASSIFIED Report (AD-A406815).
2 Brickhouse, M.D.; Rees,M.; O’Connor,R.J.; Durst, H. D. Nuclear Magnetic Resonance (NMR)
Analysis of Chemical Agents and Reaction Masses Produced by their Chemical Neutralization;
ERDEC-TR-449 U. S. Army Edgewood Research, Development and Engineering Center:
Aberdeen Proving Ground, MD, December 1997; UNCLASSIFIED Report (AD-A339308).
3 O’Connor, R.J.; Brickhouse, M.D.; Rice, J.R.; Durst, H.D. McGarvey, D.J.; Creasy, W.R.; Pence,
J.; Mongomery J. L.NMR Method for the Quantitative Analysis of Liquid Samples; ECBC-TR-
416, U.S. Army Edgewood Chemical Biological Center: Aberdeen Proving Ground, MD, January
2005; UNCLASSIFIED Report (AD-A430358).
4 O’Connor, R.J.;, Brickhouse, M.D.; Durst, H.D.; McGarvey, D.J.; Creasy, W.R. NMR Method
for the Quantitative Analysis of VX Hydrolysates; ECBC-TR-417, U.S. Army Edgewood Chemical
Biological Center: Aberdeen Proving Ground, MD, January 2005; UNCLASSIFIED Report (AD-
A430360) .
5 Creasy, W.R.; McGarvey, D.J.; Rice, J.S.; O’Connor, R.J.; Durst, H.D. Study of Detection Limits
and Quantitation Accuracy using 300 MHz NMR (ADA482893),In Proceedings of the 2002 Joint
Service Scientific Conference on Chemical and Biological Defense Research, 19-21 November
2002; Berg, D.A., Compiler; U.S. Army Edgewood Chemical Biological Center: Aberdeen
Proving Ground, MD, 2003; UNCLASSIFIED Report.
6 McGarvey, D.J.; Creasy, W.R. NIST-Traceable NMR Method to Determine Quantitative
Weight Percentage Purity of Nitrogen Mustard HN-3 Feedstock Samples, ECBC-TR-1159, U.S.
Army Edgewood Chemical Biological Center, Aberdeen Proving Ground, MD, August 2013;
UNCLASSIFIED Report.
7 McGarvey, D.J.; Creasy, W.R. Nitrogen Mustard HN-1 Analysis Method using NMR to
Generate Quantitative Weight Percentage Purity of Feedstock Samples That is NIST-Traceable,
ECBC-TR in process, U. S. Army Edgewood Chemical Biological Center, Aberdeen Proving
Ground, MD, May 2012; UNCLASSIFIED Report.
11
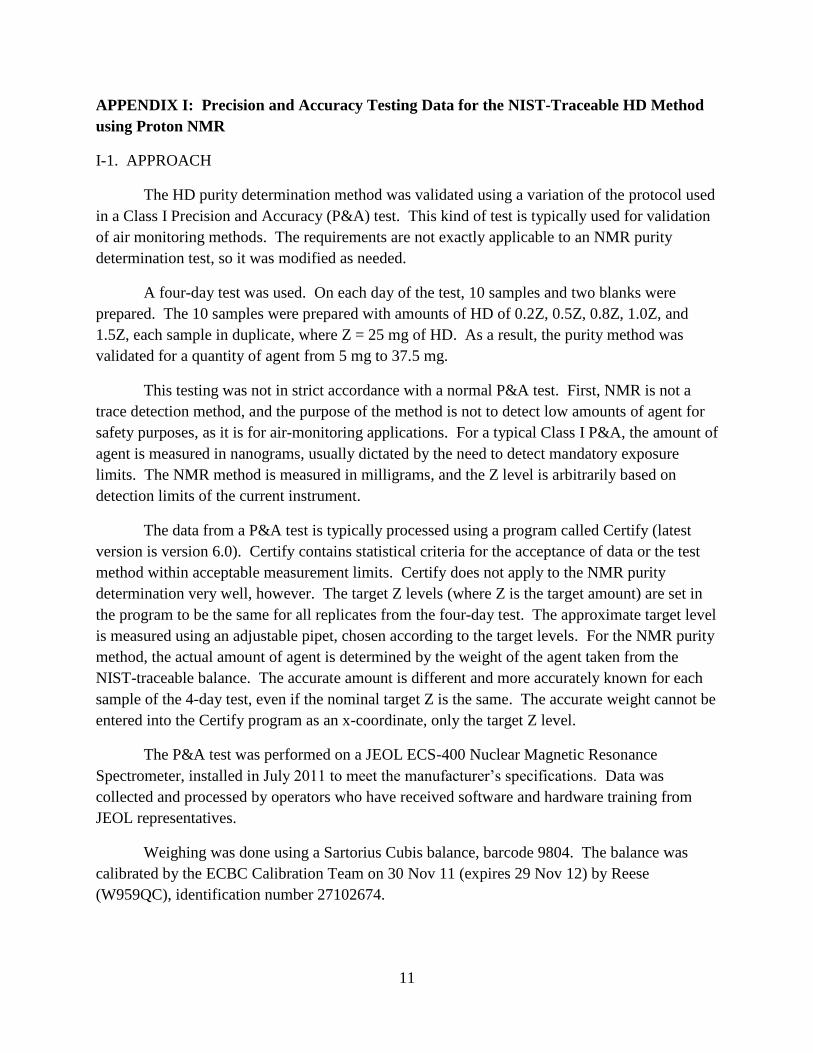
APPENDIX I: Precision and Accuracy Testing Data for the NIST-Traceable HD Method
using Proton NMR
I-1. APPROACH
The HD purity determination method was validated using a variation of the protocol used
in a Class I Precision and Accuracy (P&A) test. This kind of test is typically used for validation
of air monitoring methods. The requirements are not exactly applicable to an NMR purity
determination test, so it was modified as needed.
A four-day test was used. On each day of the test, 10 samples and two blanks were
prepared. The 10 samples were prepared with amounts of HD of 0.2Z, 0.5Z, 0.8Z, 1.0Z, and
1.5Z, each sample in duplicate, where Z = 25 mg of HD. As a result, the purity method was
validated for a quantity of agent from 5 mg to 37.5 mg.
This testing was not in strict accordance with a normal P&A test. First, NMR is not a
trace detection method, and the purpose of the method is not to detect low amounts of agent for
safety purposes, as it is for air-monitoring applications. For a typical Class I P&A, the amount of
agent is measured in nanograms, usually dictated by the need to detect mandatory exposure
limits. The NMR method is measured in milligrams, and the Z level is arbitrarily based on
detection limits of the current instrument.
The data from a P&A test is typically processed using a program called Certify (latest
version is version 6.0). Certify contains statistical criteria for the acceptance of data or the test
method within acceptable measurement limits. Certify does not apply to the NMR purity
determination very well, however. The target Z levels (where Z is the target amount) are set in
the program to be the same for all replicates from the four-day test. The approximate target level
is measured using an adjustable pipet, chosen according to the target levels. For the NMR purity
method, the actual amount of agent is determined by the weight of the agent taken from the
NIST-traceable balance. The accurate amount is different and more accurately known for each
sample of the 4-day test, even if the nominal target Z is the same. The accurate weight cannot be
entered into the Certify program as an x-coordinate, only the target Z level.
The P&A test was performed on a JEOL ECS-400 Nuclear Magnetic Resonance
Spectrometer, installed in July 2011 to meet the manufacturer’s specifications. Data was
collected and processed by operators who have received software and hardware training from
JEOL representatives.
Weighing was done using a Sartorius Cubis balance, barcode 9804. The balance was
calibrated by the ECBC Calibration Team on 30 Nov 11 (expires 29 Nov 12) by Reese
(W959QC), identification number 27102674.
12
The internal standard was 1,2,4,5-tetramethylbenzene, purchased from Fluka
(Sigma Aldrich), Part Number 74658-5G, CAS No. 95-93-2, as a TraceCERT® certified
reference material (CRM) standard for quantitative NMR. The lot number is #BCBC1486,
Pcode number 100975857, expiration June 2012. The standard was received with a certification
of analysis of 99.95% (g/g), and uncertainty of 0.08% (g/g).
The T1 for the solutions (see Section 2.3 step e) was not determined, and 40 s was
used as the NMR relaxation delay time.
I-2. RESULTS
Tables I-1 to I-4 show the data sets collected on each day of the four-day P&A test.
Figure I-1 shows the data plotted together with the regression lines and correlation coefficients.
Table I-1: Data from Day 1.
Area of Analyte (agent)
Area of Standard
Wt. Of Standard
Sample Weight
Z (wt agent/ 25 mg)
Found Z
212.53 79.3407 7.78 37.12 1.4848 1.4813
186.9916 75.181 8.54 37.62 1.5048 1.5097
137.7546 99.0741 10.43 25.08 1.0032 1.0308
106.8118 50.6484 6.77 25.2 1.008 1.0148
90.9133 62.4321 7.68 19.77 0.7908 0.7949
88.6052 73.2226 9.34 20.09 0.8036 0.8033
76.7406 100.5017 9.63 12.59 0.5036 0.5226
64.8385 104.1854 11.44 12.63 0.5052 0.5060
28.2555 90.1932 8.71 4.85 0.194 0.1939
20.4064 77.7134 10.15 4.92 0.1968 0.1894
0 107.5583 12.9 0 0 0.0000
0 108.4889 13.82 0 0 0.0000
correlation coefficient 0.99975
13
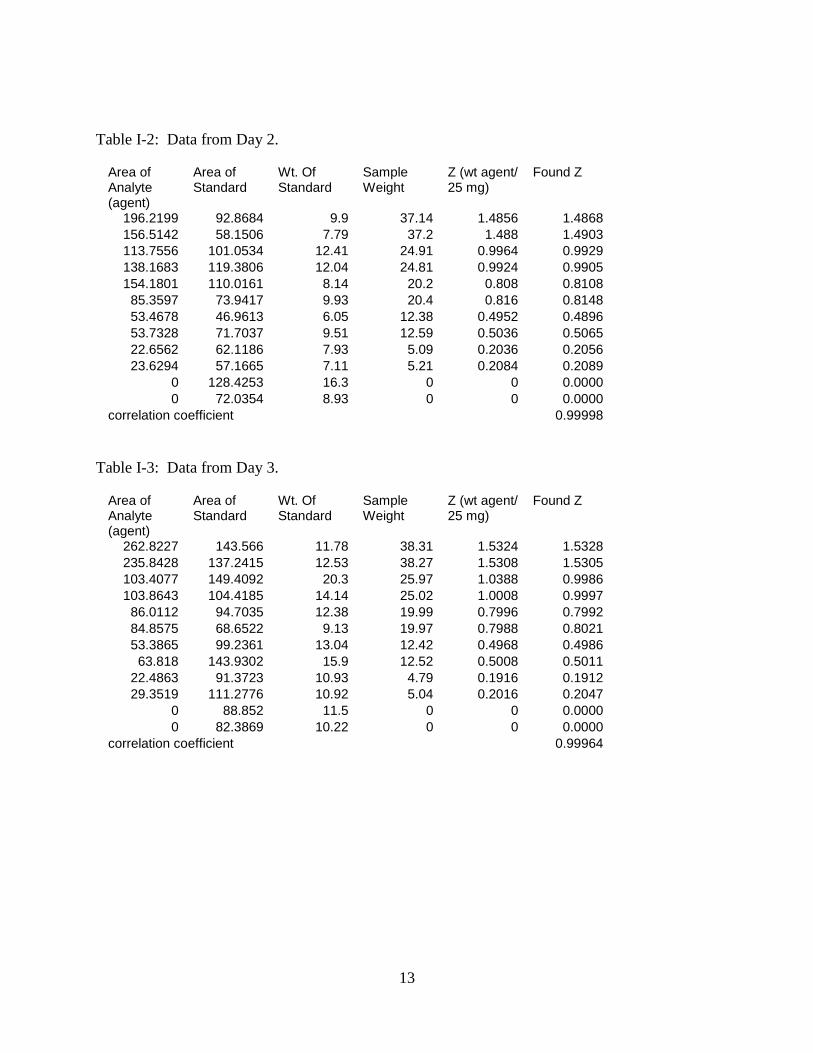
Table I-2: Data from Day 2.
Area of Analyte (agent)
Area of Standard
Wt. Of Standard
Sample Weight
Z (wt agent/ 25 mg)
Found Z
196.2199 92.8684 9.9 37.14 1.4856 1.4868
156.5142 58.1506 7.79 37.2 1.488 1.4903
113.7556 101.0534 12.41 24.91 0.9964 0.9929
138.1683 119.3806 12.04 24.81 0.9924 0.9905
154.1801 110.0161 8.14 20.2 0.808 0.8108
85.3597 73.9417 9.93 20.4 0.816 0.8148
53.4678 46.9613 6.05 12.38 0.4952 0.4896
53.7328 71.7037 9.51 12.59 0.5036 0.5065
22.6562 62.1186 7.93 5.09 0.2036 0.2056
23.6294 57.1665 7.11 5.21 0.2084 0.2089
0 128.4253 16.3 0 0 0.0000
0 72.0354 8.93 0 0 0.0000
correlation coefficient 0.99998
Table I-3: Data from Day 3.
Area of Analyte (agent)
Area of Standard
Wt. Of Standard
Sample Weight
Z (wt agent/ 25 mg)
Found Z
262.8227 143.566 11.78 38.31 1.5324 1.5328
235.8428 137.2415 12.53 38.27 1.5308 1.5305
103.4077 149.4092 20.3 25.97 1.0388 0.9986
103.8643 104.4185 14.14 25.02 1.0008 0.9997
86.0112 94.7035 12.38 19.99 0.7996 0.7992
84.8575 68.6522 9.13 19.97 0.7988 0.8021
53.3865 99.2361 13.04 12.42 0.4968 0.4986
63.818 143.9302 15.9 12.52 0.5008 0.5011
22.4863 91.3723 10.93 4.79 0.1916 0.1912
29.3519 111.2776 10.92 5.04 0.2016 0.2047
0 88.852 11.5 0 0 0.0000
0 82.3869 10.22 0 0 0.0000
correlation coefficient 0.99964
14
Table I-4: Data from Day 4.
Area of Analyte (agent)
Area of Standard (IS)
Wt. Of Standard
Sample Weight
Z (wt agent/ 25 mg)
Found Z
229.104 150.1219 13.83 37.54 1.5016 1.5002
155.3662 90.7756 12.19 37.07 1.4828 1.4829
107.78 102.641 13.92 25.69 1.0276 1.0389
104.9311 93.4481 12.63 25.1 1.004 1.0080
86.5421 110.0473 14.51 20.27 0.8108 0.8111
85.1803 78.368 10.5 20.26 0.8104 0.8112
54.8305 106.7944 14.32 13.1 0.524 0.5226
53.6906 93.0464 12.32 12.63 0.5052 0.5053
22.0786 99.6339 13.02 5.1 0.204 0.2051
21.8828 72.4093 9.34 5.03 0.2012 0.2006
0 113.2214 9.3 0 0 0.0000
0 106.4235 9.53 0 0 0.0000
correlation coefficient 0.99997
Correlation coefficients for all the days between the target Z (as a weight) and the found Z are
>0.999.
Figure I-1: Plot of the data from four days, Found Z vs. Target Z.
y = 1.00450x + 0.00134R² = 0.99968
y = 1.00021x - 0.00018R² = 0.99997
y = 0.99487x + 0.00067R² = 0.99953
y = 1.00146x + 0.00021R² = 0.99996
-0.2000
0.0000
0.2000
0.4000
0.6000
0.8000
1.0000
1.2000
1.4000
1.6000
1.8000
0 0.2 0.4 0.6 0.8 1 1.2 1.4 1.6 1.8
Day 1
Day 2
Day 3
Day 4
15
To do the calculation for the Found Z, the formula from Section 2.5 was used, except it
was normalized to 1Z = 25 mg instead of using the actual Weight A. Using this method, the
purity of the HD sample can be determined from the slopes of the curves from Figure I-1.
Averaging all four slopes gives an average purity of 100.03 wt%.
The typical way to determine the purity with this method, without an entire P&A study, is
simply to calculate purity for each run using the formula in Section 2.5. Table I-5 shows the
calculations for Day 1 data, excluding the blank runs. The resulting average purity is 100.88
wt%, with a standard deviation of 1.4%. The 95% confidence limit is 2.81%.
Table I-5: Data from Day 1, used to calculate purity for each run.
Area of Analyte (agent)
Area of Standard
Wt. Of Standard
Sample Weight Weight %
212.53 79.3407 7.78 37.12 99.76
186.9916 75.181 8.54 37.62 100.33
137.7546 99.0741 10.43 25.08 102.75
106.8118 50.6484 6.77 25.2 100.67
90.9133 62.4321 7.68 19.77 100.52
88.6052 73.2226 9.34 20.09 99.97
76.7406 100.5017 9.63 12.59 103.78
64.8385 104.1854 11.44 12.63 100.17
28.2555 90.1932 8.71 4.85 99.97
20.4064 77.7134 10.15 4.92 96.26
Average 100.88
Standard Deviation 1.41
Confidence Limits 2.81
For these purity results, the purity value is slightly above 100 wt.%, although it is within
the error limits of 100 wt.%. Alternately, the purity can be calculated by using only one triplet
peak in the NMR spectrum at 3.65 ppm. It was observed that the area for this peak is
systematically lower than the area for the triplet at 2.9 ppm. By using only one triplet, the areas
and the calculated purities are shown in Table I-6. The purity value decreases slightly to 99.6
wt.%, which is under 100 wt.%. It is possible that there is a small impurity peak hidden under
the 2.9 ppm triplet, which causes the result to be slightly too high, compared to the previously
discussed method.
16
Table I-6: Data from Day 1, but calculating the purity with only the NMR triplet at 3.65 ppm.
Area of Analyte (agent)
Area of Standard
Wt. Of Standard
Sample Weight
Weight %
104.8664 79.3407 7.78 37.12 98.45
92.2222 75.181 8.54 37.62 98.96
68.5251 99.0741 10.43 25.08 102.22
52.7531 50.6484 6.77 25.2 99.44
44.8645 62.4321 7.68 19.77 99.21
43.6973 73.2226 9.34 20.09 98.60
37.8331 100.5017 9.63 12.59 102.33
31.9362 104.1854 11.44 12.63 98.67
13.9137 90.1932 8.71 4.85 98.46
10.0149 77.7134 10.15 4.92 94.48
Average 99.59
Standard Deviation 1.56
Confidence Limits 3.11
To minimize the amount of sample preparation, it is possible to prepare only one sample
and rerun it multiple times. This approach minimizes the hazard from handling neat agent and
minimizes the consumption of agent and generation of waste. However, the repetitions include
only the error that is generated by the NMR data acquisition and integration, and not errors from
weighing and sample preparation. Table I-7 shows data from repeated runs of the 1Z sample
from Day 1. The error shown by the standard deviation is slightly smaller.
Table I-7: Data from repeated runs of one (1 Z) prepared sample.
Area of Analyte (agent)
Area of Standard
Wt. Of Standard
Sample Weight
Weight %
137.7546 99.0741 10.43 25.08 102.75
139.8176 103.3583 10.43 25.08 99.96
139.9571 103.471 10.43 25.08 99.96
140.2784 103.5179 10.43 25.08 100.14
140.1195 103.4935 10.43 25.08 100.05
139.7688 103.32 10.43 25.08 99.97
140.1056 103.5139 10.43 25.08 100.02
Average 100.41
Standard Deviation 1.03
Confidence Limits 2.07
17
I-3 Certify results
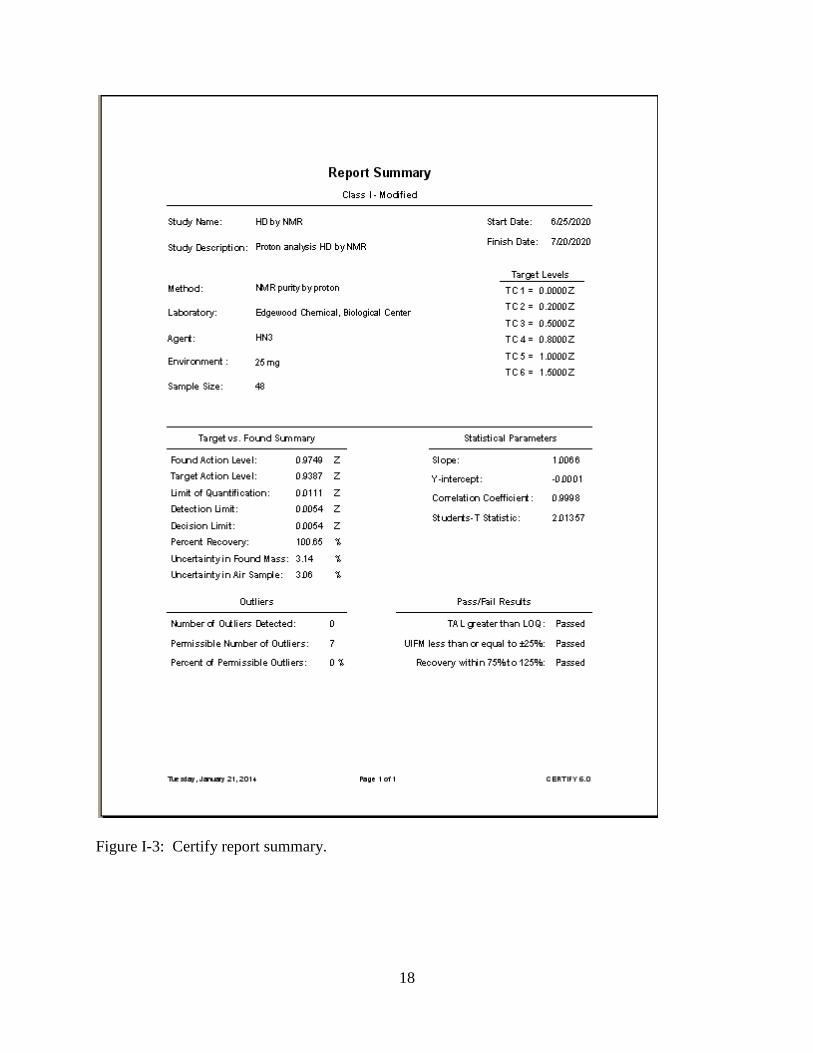
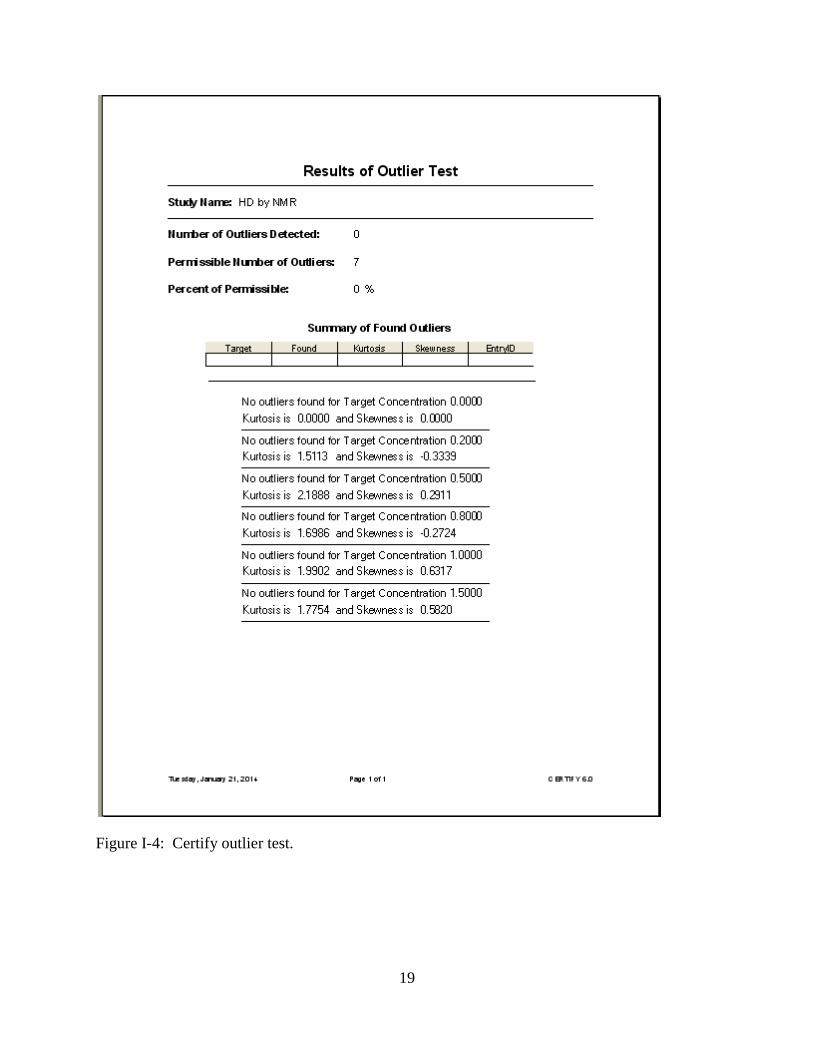
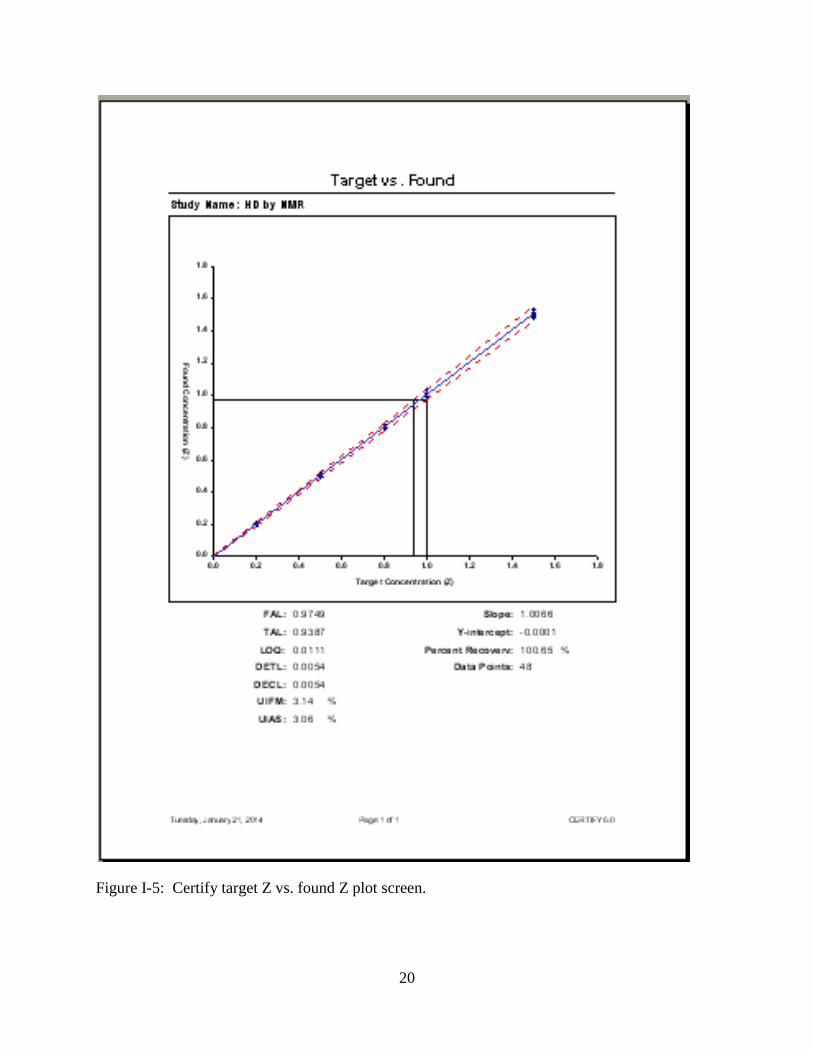
The results were analyzed by the program Certify 6.0 used for P&A data analysis.
The screens that were generated by the program are shown in Figures I-2 to I-5. Parameters that
are calculated by the program are shown on the screens.
The data that is obtained from this test is ±3.1%, which passes the Certify pass/fail
criteria of ±25%. This is much less accurate than the target accuracy of a purity determination.
But because of the way the data is entered, Certify is effectively testing the accuracy of the
pipetting, or the correspondence of the target Z with the weight. As shown in Figure I-5, there is
no scatter in the x-coordinate. The accuracy of the weighing and NMR determination is better
than the accuracy of the pipeting. The actual accuracy of the data from weighing and NMR
determination is better than the Certify calculations suggest, so using Certify to quantify the
P&A results in this case does not accurately indicate the method performance. As a result, a
better way to judge the results is in terms of standard deviations and correlation coefficients of
the data.
Figure I-2: Certify results page for the four-day P&A study.
18
Figure I-3: Certify report summary.
19
Figure I-4: Certify outlier test.
20
Figure I-5: Certify target Z vs. found Z plot screen.
21
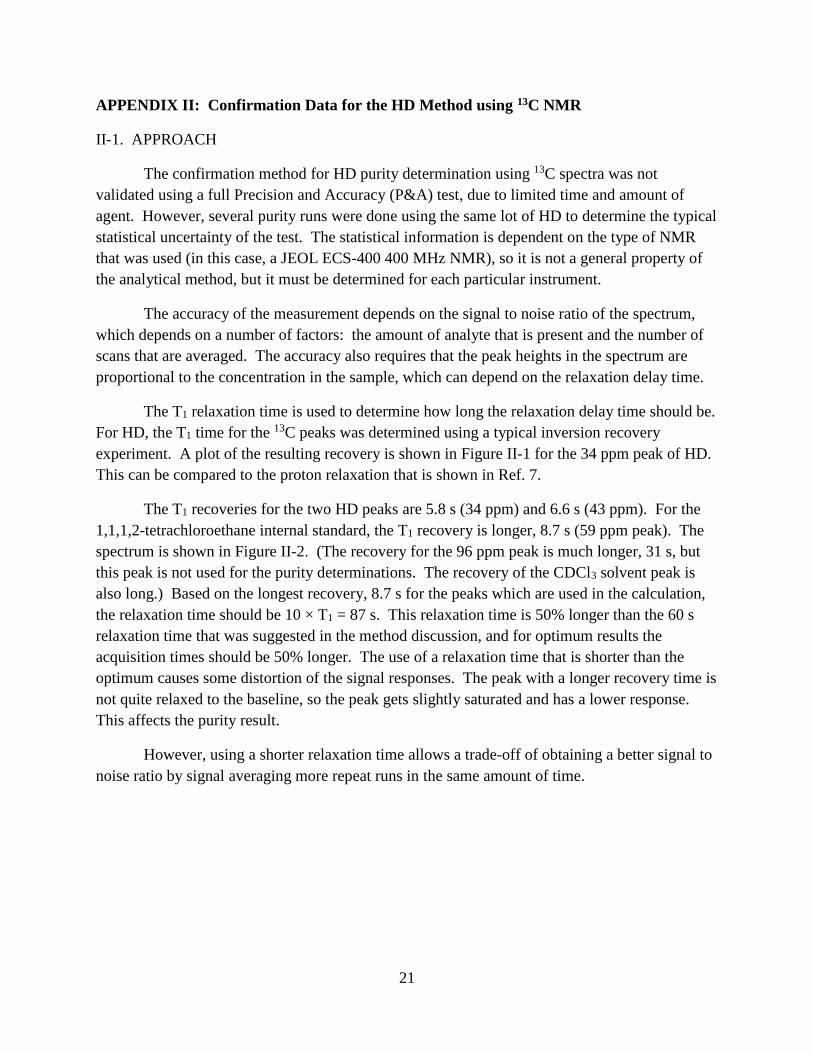
APPENDIX II: Confirmation Data for the HD Method using 13C NMR
II-1. APPROACH
The confirmation method for HD purity determination using 13C spectra was not
validated using a full Precision and Accuracy (P&A) test, due to limited time and amount of
agent. However, several purity runs were done using the same lot of HD to determine the typical
statistical uncertainty of the test. The statistical information is dependent on the type of NMR
that was used (in this case, a JEOL ECS-400 400 MHz NMR), so it is not a general property of
the analytical method, but it must be determined for each particular instrument.
The accuracy of the measurement depends on the signal to noise ratio of the spectrum,
which depends on a number of factors: the amount of analyte that is present and the number of
scans that are averaged. The accuracy also requires that the peak heights in the spectrum are
proportional to the concentration in the sample, which can depend on the relaxation delay time.
The T1 relaxation time is used to determine how long the relaxation delay time should be.
For HD, the T1 time for the 13C peaks was determined using a typical inversion recovery
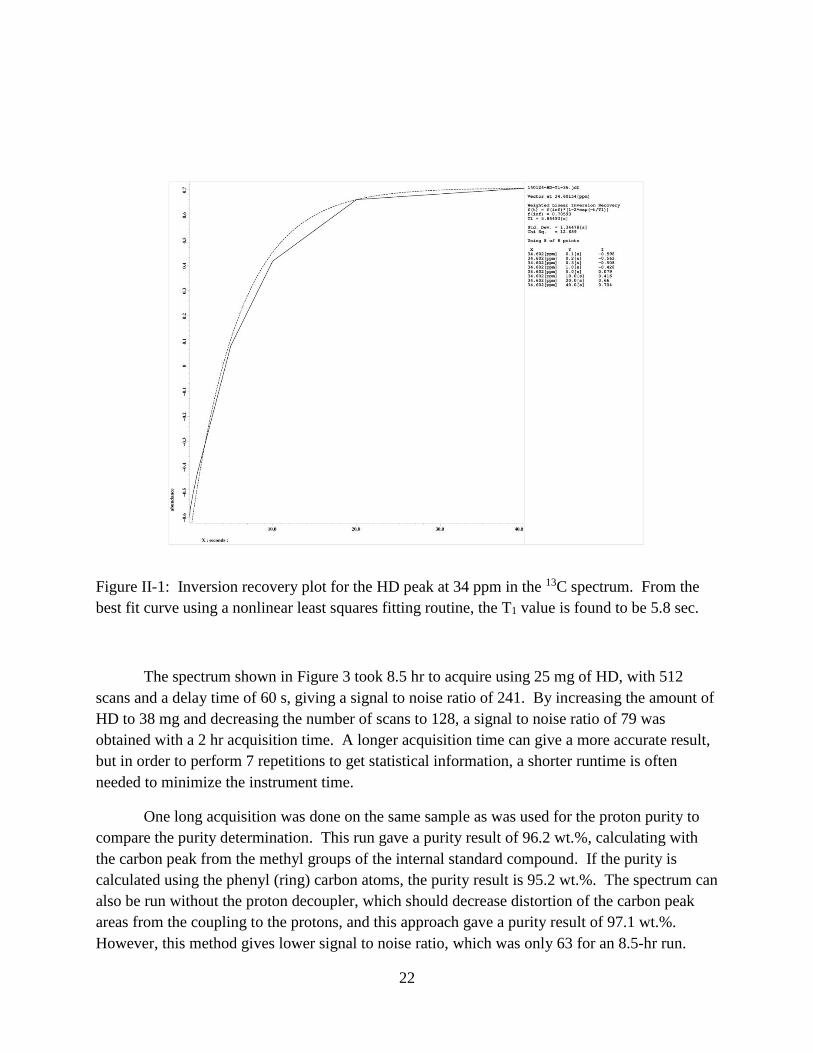
experiment. A plot of the resulting recovery is shown in Figure II-1 for the 34 ppm peak of HD.
This can be compared to the proton relaxation that is shown in Ref. 7.
The T1 recoveries for the two HD peaks are 5.8 s (34 ppm) and 6.6 s (43 ppm). For the
1,1,1,2-tetrachloroethane internal standard, the T1 recovery is longer, 8.7 s (59 ppm peak). The
spectrum is shown in Figure II-2. (The recovery for the 96 ppm peak is much longer, 31 s, but
this peak is not used for the purity determinations. The recovery of the CDCl3 solvent peak is
also long.) Based on the longest recovery, 8.7 s for the peaks which are used in the calculation,
the relaxation time should be 10 × T1 = 87 s. This relaxation time is 50% longer than the 60 s
relaxation time that was suggested in the method discussion, and for optimum results the
acquisition times should be 50% longer. The use of a relaxation time that is shorter than the
optimum causes some distortion of the signal responses. The peak with a longer recovery time is
not quite relaxed to the baseline, so the peak gets slightly saturated and has a lower response.
This affects the purity result.
However, using a shorter relaxation time allows a trade-off of obtaining a better signal to
noise ratio by signal averaging more repeat runs in the same amount of time.
22
Figure II-1: Inversion recovery plot for the HD peak at 34 ppm in the 13C spectrum. From the
best fit curve using a nonlinear least squares fitting routine, the T1 value is found to be 5.8 sec.
The spectrum shown in Figure 3 took 8.5 hr to acquire using 25 mg of HD, with 512
scans and a delay time of 60 s, giving a signal to noise ratio of 241. By increasing the amount of
HD to 38 mg and decreasing the number of scans to 128, a signal to noise ratio of 79 was
obtained with a 2 hr acquisition time. A longer acquisition time can give a more accurate result,
but in order to perform 7 repetitions to get statistical information, a shorter runtime is often
needed to minimize the instrument time.
One long acquisition was done on the same sample as was used for the proton purity to
compare the purity determination. This run gave a purity result of 96.2 wt.%, calculating with
the carbon peak from the methyl groups of the internal standard compound. If the purity is
calculated using the phenyl (ring) carbon atoms, the purity result is 95.2 wt.%. The spectrum can
also be run without the proton decoupler, which should decrease distortion of the carbon peak
areas from the coupling to the protons, and this approach gave a purity result of 97.1 wt.%.
However, this method gives lower signal to noise ratio, which was only 63 for an 8.5-hr run.
23
A set of 7 repetitions was done using the 13C purity method to compare with 3 repetitions
on the same sample with a proton purity method. The same lot of HD was used as was used for
the results in Appendix I, but it was done over a year later on 26 Nov. 2013. The internal
standard for this set was 1,1,1,2-tetrachloroethane, which was used so that both the HD and
internal standard contained CH2 carbons, avoiding enhancement of one compound from different
numbers of H atoms on the carbon. A weight of 31.7 mg of HD was used.
The purity for HD using the proton method was 100.42 wt.%, with a standard deviation
of 0.12, using only the 3.65 ppm triplet in the spectrum for the determination. The 13C runs were
2 hr long, using 128 scans and a relaxation delay of 60 s, to give a signal to noise ratio of 79. A
sample spectrum is shown in Figure II-2. The purity from the 13C method was 96.34 wt.%, with
a standard deviation of 6.7. The results of the two measurements are within one standard
deviation, but the proton determination is higher than the 13C determination. The reason that the
proton result is systematically higher than the 13C result is not known, but it may be due to the
relaxation time being shorter than is optimum.
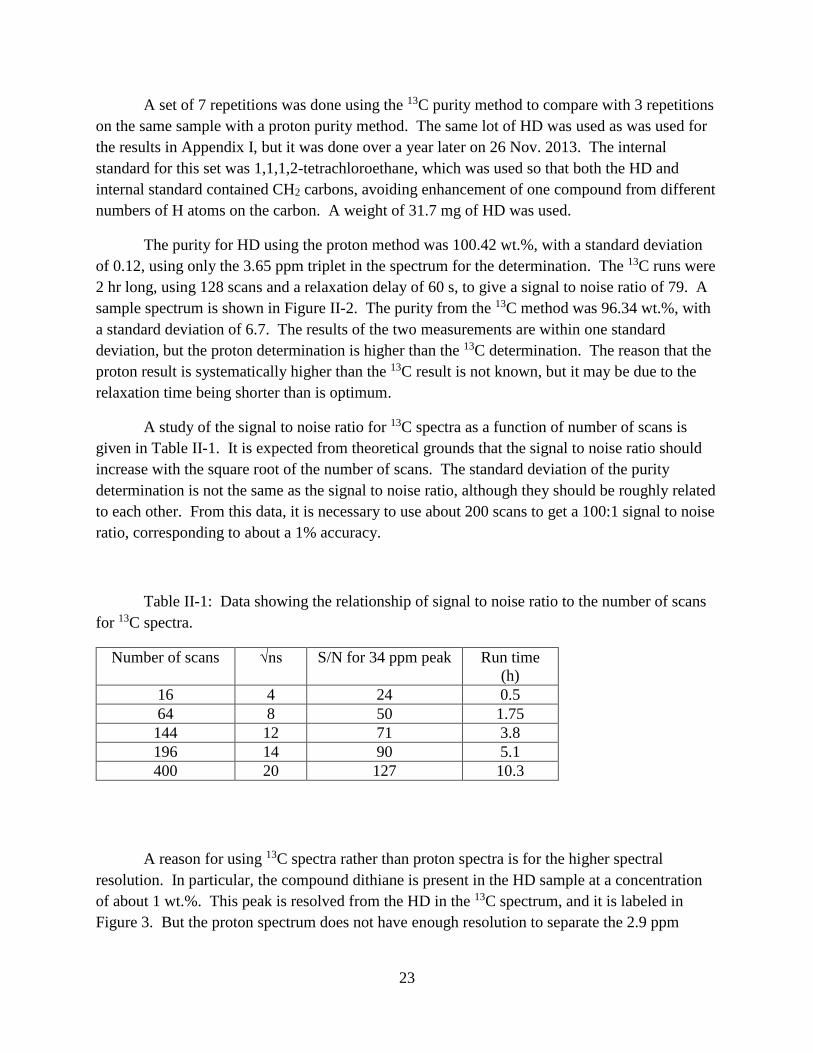
A study of the signal to noise ratio for 13C spectra as a function of number of scans is
given in Table II-1. It is expected from theoretical grounds that the signal to noise ratio should
increase with the square root of the number of scans. The standard deviation of the purity
determination is not the same as the signal to noise ratio, although they should be roughly related
to each other. From this data, it is necessary to use about 200 scans to get a 100:1 signal to noise
ratio, corresponding to about a 1% accuracy.
Table II-1: Data showing the relationship of signal to noise ratio to the number of scans
for 13C spectra.
Number of scans √ns S/N for 34 ppm peak Run time
(h)
16 4 24 0.5
64 8 50 1.75
144 12 71 3.8
196 14 90 5.1
400 20 127 10.3
A reason for using 13C spectra rather than proton spectra is for the higher spectral
resolution. In particular, the compound dithiane is present in the HD sample at a concentration
of about 1 wt.%. This peak is resolved from the HD in the 13C spectrum, and it is labeled in
Figure 3. But the proton spectrum does not have enough resolution to separate the 2.9 ppm
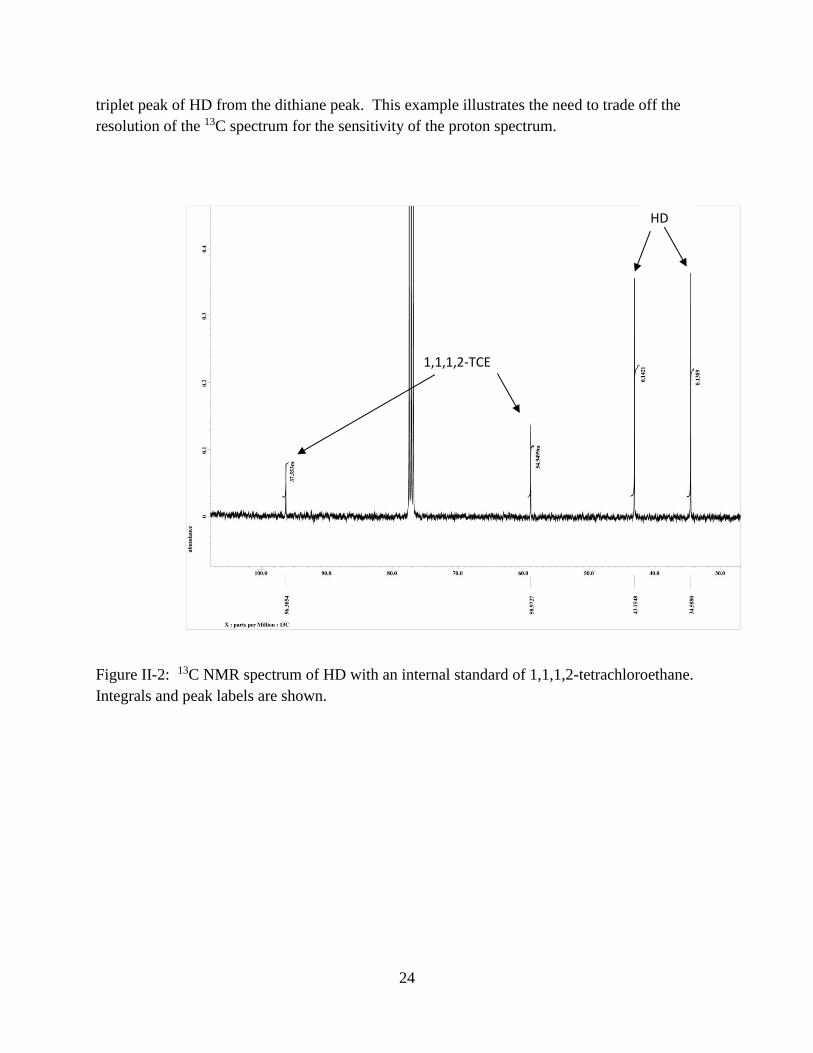
24
triplet peak of HD from the dithiane peak. This example illustrates the need to trade off the
resolution of the 13C spectrum for the sensitivity of the proton spectrum.
Figure II-2: 13C NMR spectrum of HD with an internal standard of 1,1,1,2-tetrachloroethane.
Integrals and peak labels are shown.
HD
1,1,1,2-TCE
DISTRIBUTION LIST
The following individuals and organizations were provided with one Adobe
portable document format (pdf) electronic version of this report:
U.S. Army Edgewood Chemical
Biological Center (ECBC)
RDCB-DRC-M
ATTN: McGarvey, D.
Evans, R.
Defense Threat Reduction Agency
J9-CBS
ATTN: Graziano, A.
Department of Homeland Security
RDCB-PI-CSAC
ATTN: Mearns, H.
DHS-S&T-RDP-CSAC
ATTN: Strang, P.
G-3 History Office
U.S. Army RDECOM
ATTN: Smart, J.
ECBC Technical Library
RDCB-DRB-BL
ATTN: Foppiano, S.
Stein, J.
Office of the Chief Counsel
AMSRD-CC
ATTN: Upchurch, V.
Defense Technical Information Center
ATTN: DTIC OA
ECBC Rock Island
RDCB-DES
ATTN: Lee, K.
RDCB-DEM
ATTN: Grodecki, J.