EC Contract No. FP7 N 266059 - European...
79
EC Contract No. FP7 N° 266059 Libralato Engine Prototype Project Final Report Due date of deliverable: 28/2/2015 (Three months following the completion of the project.) Actual submission date: 27/3/2015 Grant Agreement number: SCPO-GA-2011-266059 Project acronym: LIBRALATO Project title: Libralato Engine Prototype Funding Scheme: Period covered: from 1 st December 2011 from 30 th November 2014 Name of the scientific representative of the project's co-ordinator 1 , Professor Richard Stobart, Loughborough University Tel: +44 1509 227201 Fax: +44 1509 227275 E-mail: [email protected] Project website Error! Bookmark not defined. address: 1 Usually the contact person of the coordinator as specified in Art. 8.1. of the Grant Agreement.
Transcript of EC Contract No. FP7 N 266059 - European...

EC Contract No. FP7 N° 266059
Libralato Engine Prototype Project
Final Report
Due date of deliverable: 28/2/2015 (Three months following the completion of the project.)
Actual submission date: 27/3/2015
Grant Agreement number: SCPO-GA-2011-266059
Project acronym: LIBRALATO
Project title: Libralato Engine Prototype
Funding Scheme:
Period covered: from 1st December 2011 from 30th November 2014
Name of the scientific representative of the project's co-ordinator1,
Professor Richard Stobart, Loughborough University
Tel: +44 1509 227201
Fax: +44 1509 227275
E-mail: [email protected]
Project websiteError! Bookmark not defined. address:
1 Usually the contact person of the coordinator as specified in Art. 8.1. of the Grant Agreement.

Document status
Revision Date Description
1.0 27th March 2015 Draft version for approval
Project funded by the European Commission within the Seven Framework Programme (2007-2013)
Dissemination Level
PU Public x
PP Restricted to other programme participants (including Commission Services
RE Restricted to a group specified by the consortium (including the Commission Services)
CO Confidential, only for members of the consortium (including the Commission Services)
Start date of project: 01/01/2012 Duration: 36 months
Table of Contents
List of Tables 5
List of Figures 5
Executive Summary 7
The Context and Objectives of the Project 8
Principal Results and Conclusions 11
The Design of the Libralato Engine 11 The Mark 1 Design 11 Modifying the Mark 1 design in response to test results 13 The Mark 2 Design 17 The Mark 3 Design 20
Design Analysis 20 Mechanical aspects of the engine 21 Thermodynamic performance 27 CFD Analysis of engine airflow 29
Control System Implementation 38 Electronic Hardware 38 System Description 45 Technical Progress 46 Application Layer 49 System Software 52 Interfaces 53 CAN Interface to Calibration Tool 53 Development Path 54
Engine Test 55 Introduction 55 Test Plan and Rationale 55 Results and discussion 56 Analysis of engine test data 59 Discussion of test results 62
Costs Analysis and Market Assessment 64
Market Assessment for Hybrid Electric Vehicles 65
Market Assessment 65
Conclusions and Observations 67
Future Work 68
Mark 1 engine tests 68
Mark 2 engine 68
CFD analysis of internal engine conditions 68
Design of the Mark 3 version of the engine 68
Use and dissemination of foreground 69
Section A 70
Section B 72 Part B1 72 Part B2 73 Section B – the purpose of the invention 74
List of Tables Table 1 Design Changes implemented for Mark 2............................................................................................ 17 Table 2 Single rotor-pair comparison between Mark 1 and Mark 2 designs ..................................................... 26 Table 3 Predicted EnGine Performance ........................................................................................................... 28 Table 4 Integration of the Add-On ECU with sensors and actuators – signal description ................................. 46 Table 5 List of Engine specifications ............................................................................................................... 75 Table 6 Summary of the progression of the Libralato Engine Technology ...................................................... 77 List of Figures Figure 1 Libralato Engine Principal Parts .......................................................................................................... 8 Figure 2 Exploded view of the Mark 1 design ................................................................................................. 12 Figure 3 Seals on the engine block. ((c) Also shows the sealing network on the side of the rotor.) .................. 13 Figure 4 The seals on the main rotor ............................................................................................................... 14 Figure 5 Comparing Cylinder Pressure with and without seal ......................................................................... 14 Figure 6 Comparing cylinder pressure at different speeds ............................................................................. 14 Figure 7 Damaged areas on the side seal and the following rotor ................................................................... 15 Figure 8 The misalignment of the following rotor ........................................................................................... 15 Figure 9 The Friction mainly occurs on one side of the side plate (Two general views of the disassembled
engine with wear evident on the left-most of the two side plates). ............................................... 16 Figure 10 No Friction on one side of following rotor, but severe on the other side ....................................... 16 Figure 11 Evidence of severe friction on some local areas of the engine ........................................................ 16 Figure 12 The exploded view of the main rotor in Mark 1 ................................................................................ 19 Figure 13 The exploded view of the main rotor in Mark 2 ................................................................................ 19 Figure 14 The comparison of main shaft in Mark 1 & Mark 2 respectively ....................................................... 20 Figure 15 Power loss (W) per bearing at 100oC for 3 speeds (1000, 3000 and 4000 rpm) ................................... 21 Figure 16 Flow rate (l/s) per bearing at 100oC for 3 speeds (1000, 3000 and 4000 rpm) ..................................... 21 Figure 17 Thermoelastic stress field predicted by UPB as a result of heating and mounting via the two
mounting points (max stress 200 MPa) ......................................................................................... 22 Figure 18 Torque on slider at 3000 rpm (green - pure cast iron, red - blend of aluminium and cast iron) .......... 23 Figure 19 Reaction forces at the two pivots of the original, unbalanced engine at 3000 rpm as predicted by
the Simmechanics model ............................................................................................................. 23 Figure 20 Schematic of the triple-rotor-pair (TRP) engine in Simmechanics® ................................................. 24 Figure 21 Loads at leading rotor bearing for the triple-rotor-pair (TRP) engine ............................................... 24 Figure 22 Concept proposal for future versions of the Libralato engine ........................................................... 26 Figure 23 Engine block and simplified version ................................................................................................. 30 Figure 24 Leading rotor and simplified version ................................................................................................ 30 Figure 25 Following rotor and simplified version ............................................................................................ 31 Figure 26 Slider and Simplified Vesion ............................................................................................................ 31 Figure 27 Simplified Engine Assembly ............................................................................................................. 32 Figure 28 Meshing of the Engine Block ............................................................................................................ 33 Figure 29 Meshing of the volume around the leading rotor ............................................................................. 34 Figure 30 Meshing of the Volume around the following rotor .......................................................................... 34 Figure 31 Meshing of the Region around the Slider ......................................................................................... 35 Figure 32 Engine showing mesh: (a) before initialisation; (b) after initialisation; (c) volum mesh ..................... 35 Figure 33 Visualisations of gas flow during the second compression process .................................................. 36 Figure 34 Minimum modes of operation .......................................................................................................... 38 Figure 35 PSK Wiring Harness ......................................................................................................................... 40
Figure 36 Figure 1 PSKInjAddOn implemented as an external module to the PSK ....................................... 40 Figure 37 Injector drive current waveform ...................................................................................................... 42 Figure 38 Injector pulse scheduling ................................................................................................................. 42 Figure 39 PSK Add-On Block Diagram ............................................................................................................ 43 Figure 40 PSKInjAddOn PCB .......................................................................................................................... 43 Figure 41 Final PSKInjAddOn Hardware Configuration ................................................................................... 44 Figure 42 Integration of the Add-On ECU with sensors and actuators – block diagram .................................. 45 Figure 43 Engine position driver input circuit .................................................................................................. 47 Figure 44 Fuel pressure sensor input circuit ..................................................................................................... 48 Figure 45 Fuel pressure sensor 5 V power supply ............................................................................................ 48 Figure 46 TLE6270R application diagram ....................................................................................................... 49 Figure 47 Waveform diagram for one output control ...................................................................................... 50 Figure 48 Three pulse injection waveform ...................................................................................................... 50 Figure 49 VB525SP-E application diagram ............................................................................................... 51 Figure 50 Working principle of HPP HDP5 and MSV5 ..................................................................................... 51 Figure 51 HPP driver waveform ...................................................................................................................... 52 Figure 52 The engine on the test bench with one side plate removed showing the rotor ................................ 56 Figure 53 Comparison of torques of early test and later test across a range of speeds ................................... 57 Figure 54 Torque & Cylinder Pressure curves at 600 rpm ................................................................................ 57 Figure 55 Torque Curve for Hot Test 3 ............................................................................................................ 58 Figure 56 Torque & Cylinder Pressure curves at 400 rpm ................................................................................ 58 Figure 57 Comparing Torques at different speeds .......................................................................................... 59 Figure 58 - Absolute pressure in the expansion volume ................................................................................... 59 Figure 59 - Original and Matched Volume Diagrams (VLH) ............................................................................. 61 Figure 60 - Pressure diagram for single zone modelling without leakage ........................................................ 61 Figure 61 – Pressure curve for Single Zone model with leakage ....................................................................... 62 Figure 62– Pressure curve for Single Zone model without leakage .................................................................. 62 Figure 63 Illustration of cost distribution in the manufacture of an engine ..................................................... 64 Figure 64 The Proving Factory Value Chain .................................................................................................... 76

Executive Summary The Libralato Engine is a novel rotary engine design that is intended to overcome a number of issues associated with the more established Wankel design. The principle of the Libralato engine is that of two connected rotors which create in succession the volumes required for air intake and compression, combustion, expansion and exhaust. Like the Wankel engine the Libralato engine implements the four stroke cycle in a single revolution of the engine lending the efficiency and emissions benefits of this type of cycle with a power stroke for each engine revolution. The Libralato engine has, as an integral aspect of the engine design, an extended expansion stroke that leads to efficient operation. The assembly of the engine, which allows the tip seals in the Wankel rotor to be replaced by a series of long tapering passages supplemented by seals in the rotor lips.
An early engine design aimed at a rated power of 25 kW was supplied to the team by the engine inventor, Mr Ruggero Libralato. This design is referred to as the Mark 1. An early realisation of this design was essential to the progress project, but was hampered by the weakness of the design model and the need to include a new manufacturing partner in the project. Once the new partner was formally appointed the existing design was adapted to the machining processes and accuracy capabilities of the new partner. This turned out to be a\ long and tortuous process leaving the project in a difficult position.
While confirming the proper function of the engine, early analysis revealed a number of significant mechanical design issues. The use of a slider to connect the two rotors led to very high reaction torques that would lead to yield stress in rotor components even at modest speeds. With the existing design, the rated speed and power could never be realised. The relatively large diameter of the following rotor bearing led to extremely high friction torque. It was these fundamental mechanical properties of the engine that led to the early decision to move as quickly as possible to a reduced diameter rotor that would halve the working volumes. The reduction in internal forces would be significant and lead to a manageable implementation. The consequence of this decision is that a 50 kW engine would be composed of three of the smaller rotors connected in a phase relationship that would substantially balance their operation.
The design of the Mark 2 was initiated as soon as the analysis results indicated the difficulties with the Mark 1 design. As the Mark 1 engine was implemented a number of construction difficulties appeared such as the tendency of the rotor to lose its alignment. It was information like this that led to the adoption of a range of new features. The absence of a viable lubricating system on the Mark 1 engine led to the adoption of an ad-hoc system of pipework providing feed and return to bearings. For the Mark 2 this meant to an adoption of sealed rolling element bearings that could be used without a lubrication supply making the measurement of engine emissions possible.
The Mark 1 design was accompanied by the design of a special purpose test rig. The Libralato engine requires phase adjustment of the exhaust valve, and the synchronised operation of the high pressure fuel pump. The combustion system can only possibly work in a direct injection mode and so the complexity of a direct injection system needed to be managed. From the start of the project, the control solution was oriented to direct injection which ultimately proved successful. The test rig included the capability to run the engine, exhaust valve and high pressure pump in strict synchronisation.
Tests of the Mark 1 engine demonstrated the very high torque values that had been predicted in the analysis phase of the work. Those torque values showed some reduction as the engine was operated indicating that the source of at least some of the friction was misalignment in the engine. In low speed tests of the engine, combustion pressure is evident well before the secondary rotor begins the expansion process and essentially delivers a negative torque. The analysis work demonstrated otherwise and the implication is that the combustion phasing is too advanced. The two results suggest that the performance of the engine critically depends on the phasing of combustion. The resolution of this question is the essential next step in the development of the engine concept and may require both a mechanical design change to ensure the later phasing of the peak pressure as well as the control of a later combustion event. Test facilities and the manufacturing of the Mark 2 engine are substantially complete.

The Context and Objectives of the Project New engine designs are required which meet the demands of Hybrid Electric Vehicles (HEV) and Plug In Hybrid Electric Vehicles (PHEV) :–
• aggressively downsized and integrated within series/ parallel or dual mode hybrid electric vehicles;
• designed for ‘steady state’ operation exclusively within their BSFC peak efficiency zone; • exceeding Euro 6 emissions standards; • with reduced production and maintenance costs, • with exceptionally low NVH behaviour; • with compact proportions that can be easily integrated within vehicles.
The Libralato rotary engine is a potential breakthrough technology with a thermodynamic cycle that particularly suits fuel efficient operation. . Patents are pending - WO2004020791 A1 for the engine design and PCT/EP 2009 / 006807 for the engine’s thermodynamic cycle.
The Libralato engine was announced as one of six winners of the UK Low Carbon Vehicle Partnership’s Technology Challenge in Dec 09, awarded by Neville Jackson, Ricardo UK Ltd. Group Technology Director and Richard Parry-Jones, UK Automotive Council Chair. A physical proof of concept engine mechanism has been produced and has been tested at speeds up to 1500 rpm – representing a sensible mid-load operating speed. A CREO/Pro-E CAD model of the engine has been produced and this model will provide the basis for simulations, studies and construction of high grade prototypes.
The Libralato engine has only four principal moving parts: two rotors fixed by their own bearings, connected by a sliding vane and a rotating exhaust. The rotors have different (overlapping) diameters of circumference and their motion forms and reforms three separate chambers within the engine each revolution. The leading rotor is engaged with the expansion of the air/ fuel mixture and a first stage compression of intake air. The following rotor is engaged with aspiration and a second stage compression. Air enters via a port at the centre of the engine and at one point also via the exhaust port.
FIGURE 1 LIBRALATO ENGINE PRINCIPAL PARTS

The Libralato engine design is very different from the Wankel engine and avoids the reported difficulties associated with the Wankel engine by: large sealing surface areas of the rotors (equivalent in size to pistons), short flame paths acting against an acute angle working surface area, good thermal dispersion via fresh air scavenge phase and low bearing wear due to dynamic balance.
The engine cycle mechanically creates aspiration, first stage (low) compression, exhaust of scavenge gases, second stage (high) compression and expansion phases in parallel each full rotation of the engine, giving it twice the power density of a 4 stroke reciprocating engine with equivalent expansion volume. Due to the different diameters of the rotors, compression and expansion volumes are asymmetrical, allowing more complete (efficient) combustion of the air/ fuel mixture. The combination of more complete combustion and more complete scavenge of the exhaust gases using pressures crated during the first stage compression means that emissions, exhaust gas temperatures and noise can be controlled.
The project objectives as presented in the Technical Proposal are listed – and against each a summary of the achievements of the project are listed.
1) To construct and test prototypes of the Libralato engine – respectively 25 kW; <60 kW
A 25 kW prototype was re-designed, constructed and tested; a second prototype was designed, based on the observations and analysis from the Mark 1 evaluation and tests and the parts manufactured.
2) To construct a 3D CFD model, test and optimise scenarios of the compression and expansion ratios, heat transfer rates and leakage flows of the engine.
A 3D simulation model was assembled from the engine design files. An overset mesh method was prepared and used to show air flow in the second phase of compression.
3) To assess, refine and optimise the performance of the hot prototypes, determining fuel efficiency over a range of operating conditions. Target BSFC = <210g/kWh (39% efficient)
Some limited test work was completed to demonstrate that combustion could be supported. IN particular the assertion that this engine technology required the deployment of direct injection technology was supported by test results. Using liquid fuel a direct injection combustion process could be initiated and run.
4) To assess, refine and optimise the performance of the hot prototypes, determining emissions over a range of operating conditions in relation to Euro 6 standards : – Targets - THC < 0.1 g/km; CO < 1.00g/km; NOx < 0.06 g/km; PM < 0.005 g/km
This objective could not be met owing to the lubrication management process used in the Mark 1 engine. A re-design of the lubrication system and the adoption of selected rolling element bearings was to be the basis for emissions tests on the Mark 2 design , which unfortunately could not be completed.
5) To conduct design/ cost analysis of the Libralato engine. Target production costs for 50kW = $500
Based on the design and analysis work conducted for the Mark 1 and Mark 2 engines, a cost analysis has been conducted and indicates a competitive manufacturing cost at €15/kW.
6) To assess NVH behaviour. Target NVH behaviour = 50% comparative reduction

NVH analysis was not possible with the Mark 1 engine. Some vibration information could be taken with accelerometers but the data simply indicated that there were significant out of balance forces due to the rotating masses of the engine. The Mark 2 engine was intended to be the basis for a more extensive investigation of vibration information.
7) To assess critical package and weight boundaries. Target critical package and weight boundaries = 50% comparative reduction
A preliminary assessment of packaging was completed and suggests that a packaging efficiency of 50% can be achieved making the engine particularly appropriate of parallel hybrid assembly.
8) To conduct a limited market assessment for the Libralato engine
The market assessment suggests a substantial opportunity in the hybrid vehicle sector.
9) To apply for patent protection for the updated Libralato engine design and thermodynamic cycle
Two patent applications have been developed as a result of the work.
10) To undertake dissemination activities via academic and industrial networks
Dissemination activity was based on the design analysis work that was conducted during the design work on the Mark 1 engine.

Principal Results and Conclusions The results and conclusions are organised according to the main technical activity of the project. In the next section we review the design process for the engine. There is a detailed description of the Mark 1 design – the first design of the engine which was developed from an existing but incomplete design. The Mark 2 design represents a significant step forward and utilises the results of an extensive analysis into the dynamic behaviour of the Mark 1 engine. The analysis is presented to demonstrate the reasoning that led to the adoption of the Mark 2 design features. The analysis continues with the development of the understanding of air flow in the engine, and concludes with the simulation and prediction of the engine performance. The control system implementation was critical to the testing of the engine, and the control system solution in the form of an electronic implementation is presented followed by a brief description of the software. Although the team prepared a test facility for the engine, only limited testing could be done because of the relatively fragile state of the Mark 1 engine However the combustion process was demonstrated and an understanding of internal gas pressures developed that could act as a source of information about the continuing development of the engine concept.
The Design of the Libralato Engine This section summarises the design process by which the engine emerged.
The Mark 1 Design The engine design is presented as a computer aided model created using the tool historically known as Pro/Engineer (Pro/E) and now sold as CREO Elements/Pro. Pro/E is maintained by Parametric Technologies and is widely used in manufacturing, notably by Caterpillar for engine and machine design. The design work for this deliverable has been performed using version CREO 2.0.
The original design work for the Libralato engine was done using traditional sketching and drawing techniques which were used as the basis for the manufacturing of a model using mild steel and which became the basis for some concept tests and demonstration of assembly techniques. Libralato Ltd, owners of the design, commissioned the preparation of design files using Pro/E. However those files were based a set of manufactured features that were inappropriate to the machine tools to be used for initial manufacture.
The first task to be initiated in Work package 6 was the reworking of the model to incorporate new features that better matched the capabilities of the machining centres used by Techmachine, the member of the project consortium responsible for manufacture of the engine.
The original design model that was made available at the start of the project was not a completed design. Firstly, it did not include some important information that is essential to the manufacturing process, such as tolerances and materials. Secondly, some requirements are not properly considered in the design makiing certain functions unachievable. Thirdly, certain of the design features included in the initial design are not readily manufacturable. Although the engine functions are realised, their manufacturing is very difficult and the associated manufacturing cost correspondingly high. Consequently, the new CAD model was improved in all these aspects. The new model conveys the information, such as materials, processes, dimensions, and tolerances, which was not included in the original design. Techmachine built the first prototype engine based on this new updated model using their NC machining centres. This new model was also imported to finite element analysis software (ABAQUS & ANSYS) and CFD software (STAR-CCM) to build the
analysis models and perform FE analysis. The model was also imported to dynamic analysis software (ADAMS) to investigate the dynamic performance of the engine.
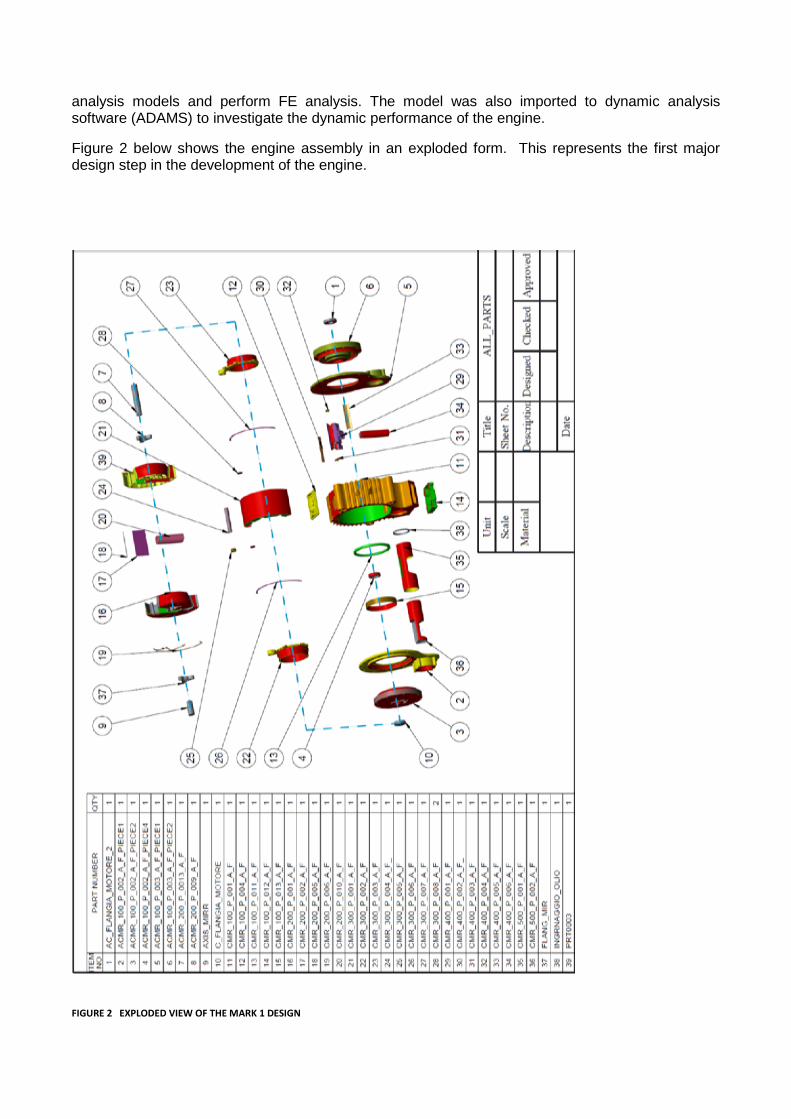
Figure 2 below shows the engine assembly in an exploded form. This represents the first major design step in the development of the engine.
FIGURE 2 EXPLODED VIEW OF THE MARK 1 DESIGN

Modifying the Mark 1 design in response to test results The Mark 1 design was tested firstly without attempting combustion. These tests were designed to evaluate the design, assess both friction and dynamic effects. The distinct categories of assessment were performed – respectively the assessment of sealing, and the assessment of wear.
Sealing of the combustion chamber Evaluation of the engine sealing components proved a significant part of the cold test work. Sealing is done on the sides of the rotors and at the rotor tips. The engine will only realise adequate compression pressures if there is a satisfactory seal.
In the Mark 1 design, three seals are provided on the engine block and one seal on the main rotor, and are shown in Figs 3 & 4.
(a) With rotor removed demonstrating spring mounting
(b) Sealing close to the combustion chamber
(c) With the rotor in place
FIGURE 3 SEALS ON THE ENGINE BLOCK. ((C) ALSO SHOWS THE SEALING NETWORK ON THE SIDE OF THE ROTOR.)
(a) (b)
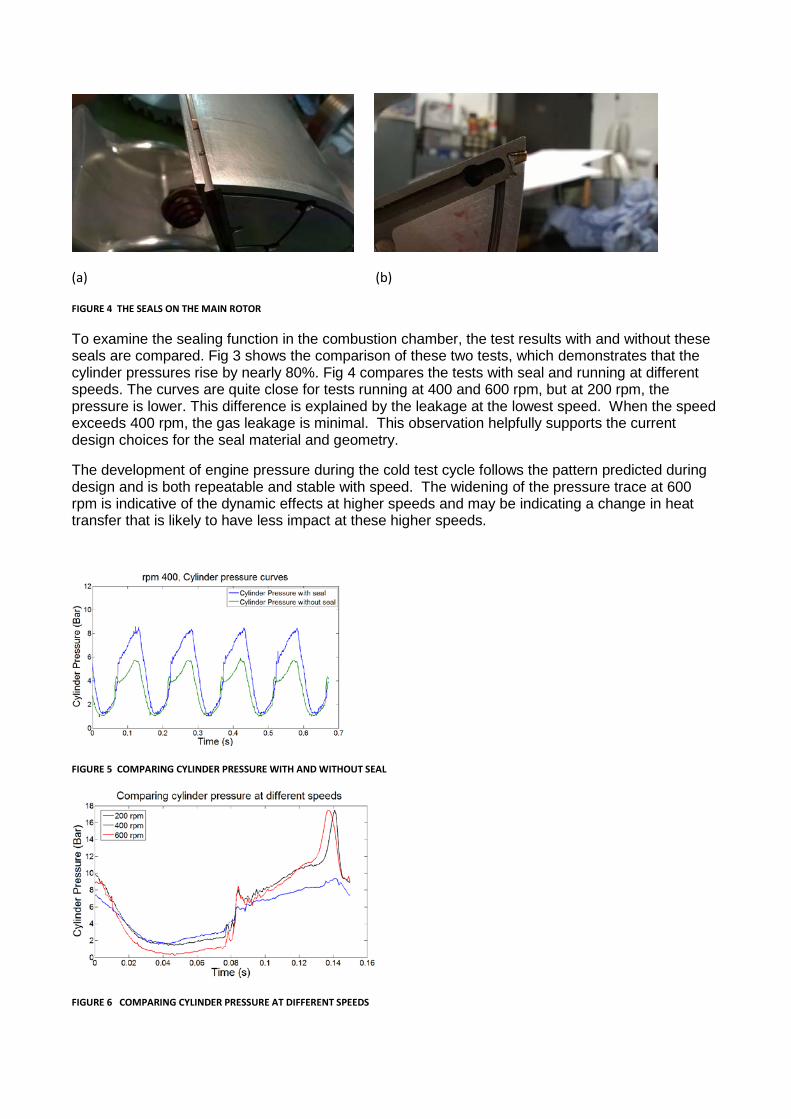
FIGURE 4 THE SEALS ON THE MAIN ROTOR
To examine the sealing function in the combustion chamber, the test results with and without these seals are compared. Fig 3 shows the comparison of these two tests, which demonstrates that the cylinder pressures rise by nearly 80%. Fig 4 compares the tests with seal and running at different speeds. The curves are quite close for tests running at 400 and 600 rpm, but at 200 rpm, the pressure is lower. This difference is explained by the leakage at the lowest speed. When the speed exceeds 400 rpm, the gas leakage is minimal. This observation helpfully supports the current design choices for the seal material and geometry.
The development of engine pressure during the cold test cycle follows the pattern predicted during design and is both repeatable and stable with speed. The widening of the pressure trace at 600 rpm is indicative of the dynamic effects at higher speeds and may be indicating a change in heat transfer that is likely to have less impact at these higher speeds.
FIGURE 5 COMPARING CYLINDER PRESSURE WITH AND WITHOUT SEAL
FIGURE 6 COMPARING CYLINDER PRESSURE AT DIFFERENT SPEEDS
The Assessment of Engine Wear During the early stages of cold tests, the engine was dissembled on three occasions to inspect components and to assess wear patterns. After the second disassembly, the engine was rebuilt – a process that included extensive re-machining and re-assembly of the engine to achieve a better alignment of the rotating components.
When the engine was disassembled, components were carefully checked, particularly the principal moving parts (Main rotor, Following rotor, Slider and Exhaust valve). A number of issues were observed and subject to analysis.
In particular the examination following disassembly revealed the following kind of damage that led to decisions about the Mark 2 design.
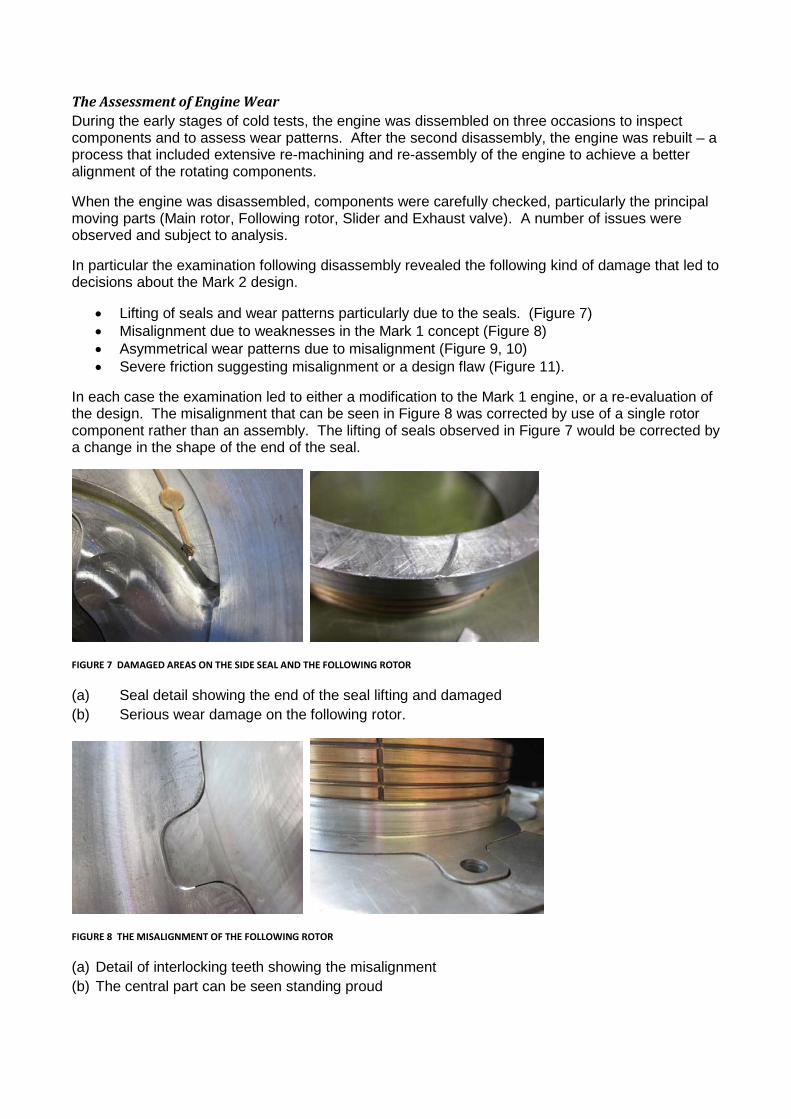
• Lifting of seals and wear patterns particularly due to the seals. (Figure 7) • Misalignment due to weaknesses in the Mark 1 concept (Figure 8) • Asymmetrical wear patterns due to misalignment (Figure 9, 10) • Severe friction suggesting misalignment or a design flaw (Figure 11).
In each case the examination led to either a modification to the Mark 1 engine, or a re-evaluation of the design. The misalignment that can be seen in Figure 8 was corrected by use of a single rotor component rather than an assembly. The lifting of seals observed in Figure 7 would be corrected by a change in the shape of the end of the seal.
FIGURE 7 DAMAGED AREAS ON THE SIDE SEAL AND THE FOLLOWING ROTOR
(a) Seal detail showing the end of the seal lifting and damaged (b) Serious wear damage on the following rotor.
FIGURE 8 THE MISALIGNMENT OF THE FOLLOWING ROTOR
(a) Detail of interlocking teeth showing the misalignment (b) The central part can be seen standing proud
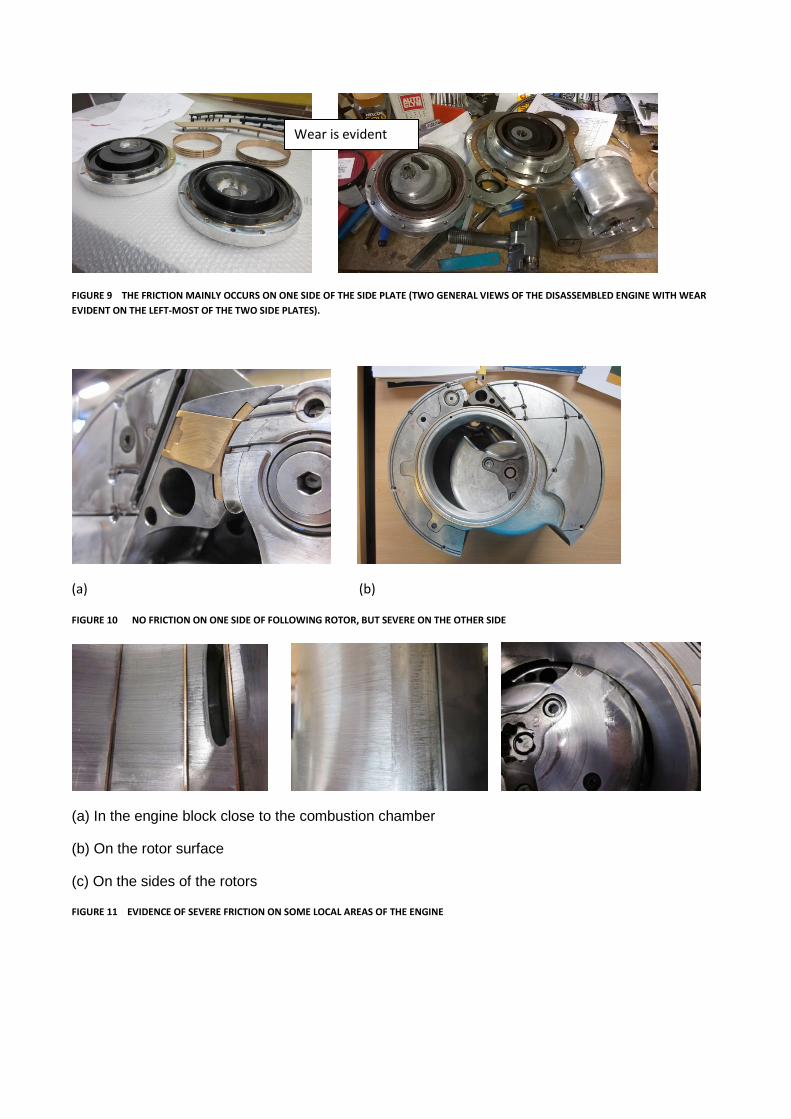
FIGURE 9 THE FRICTION MAINLY OCCURS ON ONE SIDE OF THE SIDE PLATE (TWO GENERAL VIEWS OF THE DISASSEMBLED ENGINE WITH WEAR EVIDENT ON THE LEFT-MOST OF THE TWO SIDE PLATES).
(a) (b)
FIGURE 10 NO FRICTION ON ONE SIDE OF FOLLOWING ROTOR, BUT SEVERE ON THE OTHER SIDE
(a) In the engine block close to the combustion chamber
(b) On the rotor surface
(c) On the sides of the rotors
FIGURE 11 EVIDENCE OF SEVERE FRICTION ON SOME LOCAL AREAS OF THE ENGINE
Wear is evident

The Mark 2 Design The Mark 1 design was by no means complete. Firstly, certain of the design solutions were not fully implemented simply because there was insufficient information available, and that particular information needed to come from practical test. Consequently the Mark 1 engine needed to fulfil a role where it would support certain tests whose purpose was to provide design information for later versions of the engine. . The original design of the engine that had formed the starting point for the project was much less well understood than we had expected.
Some design features originally proposed for Mark 1 proved to be difficult to manufacture. Although these features could be made, their manufacturing would be very difficult and the cost is consequently high. During the tests of Mark 1, more design weaknesses have been identified, which mainly include the uncertainty of the friction sources, the severe inertia force at normal engine speeds, an intake behaviour that was very difficult to characterise, and difficulties with sealing the rotors against the fixed part of the engine. All of these discoveries have revealed important information about the mechanisms of Libralato engine.
In order to improve the performance of the engine and identify solutions for the new Mark 2 engine design, our team visited Techmachine on several ocasions to review the test and analysis results with our partners. In the meetings, the new design solutions for Mark 2 design have been reviewed and discussed.
Therefore, the new Mark 2 model has been improved in all these aspects. Compared with the Mark 1 design, the new Mark 2 design demonstrates improved solutions in all aspects of the engine function. The main design changes are summarized in the following Table.
Summary of design changes This section summary all the main design changes in Mark 2 design. More details will be explained in next section.
TABLE 1 DESIGN CHANGES IMPLEMENTED FOR MARK 2
Mark 1 feature Issue Change required
1 Engine size The diameter of the main rotor in Mark 1 engine is 270 mm, which causes high inertia force at high running velocity.
The most effective way to reduce this inertia force is reducing the size of the engine.
2 Lubrication System The lubrication passages have not been properly sealed, which leads to flows of oil into the expansion chamber and the exhaust system
Closed oil path for slider and rolling element bearings for rotors have been applied, which can guarantee the oil only flows in the specified oil passages.
3 The main rotor The main shaft is connected to the main rotor independently, which affect the strength of the connection and can cause the misalignment of the main shaft.
The main shaft should be made as one piece and fixed on the main rotor during assembly.

4 The following rotor The position of three pieces of the following rotor can be moved during the working cycle, which can cause misalignment of the main shaft. Also can cause severe friction at some local surface.
The three pieces of the following rotor should be made as a single piece.
5 The main rotor bearing
& The following rotor bearings
The bearings are plain bearing. Considering the running loads the inertia force, the plain bearing is not a good option for this application.
The needle roller bearing can provide much stronger supporting for the rotors, which can guarantee the rotor on the right position during rotating and is more suitable for this engine design.
6 The side plate The side plate not only provides the mounting for the bearings, but also needs to make sure the bearings being sealed properly.
Considering the roller bearings adapted in Mark 2 design, the main dimensions and structure need to be modified.
7 The exhaust valve In the original design, the exhaust valve not only works as the exhaust valve, but also works as the intake port to let the air enter the engine. However, in the Mark 1 test, the intake on the exhaust port didn’t work properly. The air doesn’t flow into the engine during the working cycle.
In the Mark 2 design, the exhaust valve is redesigned to only work for exhaust system.
8 The seals for the bearings
The two rotor axes are very close, also the intake port and the main rotor bearing need to be inside the internal ring of the following bearing. The limited space on the side plate is a big challenge for the seal solution.
The grease can be used to lubricate the needle roller bearing.
9 The seals for the slider The slider needs to withstand a large torque from the rotor and have to keep moving in the cylinder. In order to reduce the friction and keep the temperature on the slider within a specified limit, the proper lubrication must be guaranteed. At the same time, the seals must be provided to make sure there is no oil leaking
The special passage need to be designed on the main shaft and the cylinder to guarantee the lubricant supply. Also, two seals need to mount on the cylinder to keep the oil inside the cylinder.

into the chambers.
10 The intake system The intake port on the exhaust valve doesn’t really let the air enter the engine. Most of air into the engine is coming from the intake port at the centre of the engine.
The air intake will only use the port on the centre of the engine,
11 The engine block When the engine size is decreased, the manufacturing for some parts becomes more challenging.
For the engine block, it has to be made as two pieces, which can guarantee the cutter can reach some local manufacturing positions.
In the Mark 1 design, the main rotor body consists of two parts which are connected by bolts from one side. The main shaft is also assembled from two pieces and connected to the main rotor body from both sides, as shown in Fig 12. The main reason of this design is due to the manufacturing and assembly considerations. But this design causes the alignment of the main shaft to deviate from the principal axis of the engine and generates severe friction at some local surfaces. In the Mark 2 design, to guarantee the main shaft remains in position during the work cycle, the main rotor body is built as one piece and the main shaft is also made as one piece, as seen in Figures 13 & 14.
FIGURE 12 THE EXPLODED VIEW OF THE MAIN ROTOR IN MARK 1
FIGURE 13 THE EXPLODED VIEW OF THE MAIN ROTOR IN MARK 2

FIGURE 14 THE COMPARISON OF MAIN SHAFT IN MARK 1 & MARK 2 RESPECTIVELY
The Mark 3 Design During the Mark 2 design process, we have already identified where even the new design could be improved. For example, in Mark 2 design, the air flow into the engine may be not sufficient to support combustion. Therefore a major design change could be made where air is introduced directly in to the compression chamber. Alternatively pressurised air could be introduced into the existing intake in the Mark 3 design. The combustion process needs to be properly considered in the new design with a more ordered pattern of air motion – with a degree of control over the motion air about a vertical axis. Combustion phasing remains a significant concern that would require tests woith the Mark 2 engine to identify changes needed for Mark 3.
The slider remains a risk – subject to high forces and as a reciprocating device, difficult to lubricate. For the Mark 3 design a rolling element bearing for the slider is needed that further simplifies the lubrication function (although lubricant will still be needed for cooling).
The discussion of Mark 3 suggests that this design is used as a development benchmark – allowing emissions and friction to be brought to acceptably low levels. The step to Mark 4 is then one of controlling costs and making design changes to keep costs to a target level while retaining the fuel economy and emissions performance.
Design Analysis We considered the design analysis in three aspects –
• The mechanical design analysis with considerations of kinematics, dynamics and the behaviour of materials
• The thermodynamic analysis consisting particularly of the analysis of mass and energy transport on the engine and how these transport processes are simulated.
• The analysis of internal gas flows using computational fluid dynamics calculations to understand the conditions at the start of combustion.

Mechanical aspects of the engine
Lubrication System In order to develop and refine the engine’s lubrication system, preliminary lubrication simulations were carried out. The simulations aimed at providing the film thickness, frictional losses and required oil flow rate in the engine. Three engine speeds were considered, namely: 1000, 3000, 4000 rpm and temperatures from approx. 25-100 deg C, using typical 5W/40 oil. Assumptions were:
• Loads at bearings as predicted by multi-body analysis (see later, task 6.4) • Short bearing geometry • Half Sommerfeld boundary condition • Viscosity independent of pressure
Figures 15 and 16 provide indicative lubrication results showing extreme power loss at the following rotor bearings, as well as very high flow rates. This is due to the very large diameter of the Mark 1engine’s following rotor bearings (150 mm) which causes a large surface velocity at the bearing. The large diameter is accompanied by a large clearance and these two factors combine to increase the required flow rate. This finding has been one of the major concerns and the proposed solution for future versions of the engine is the use of a custom roller bearing, as opposed to the current journal bearing. It is also important that the radial dimension of the bearings reduces, as power losses exhibit a quadratic dependency on the radius.
Based on lubrication analysis findings as well as design considerations, some modifications have been made to the Mark 1 lubrication system, in particular a number of oil galleries have been redesigned to promote oil flow.
FIGURE 15 POWER LOSS (W) PER BEARING AT 100OC FOR 3 SPEEDS (1000, 3000 AND 4000 RPM)
FIGURE 16 FLOW RATE (L/S) PER BEARING AT 100OC FOR 3 SPEEDS (1000, 3000 AND 4000 RPM)
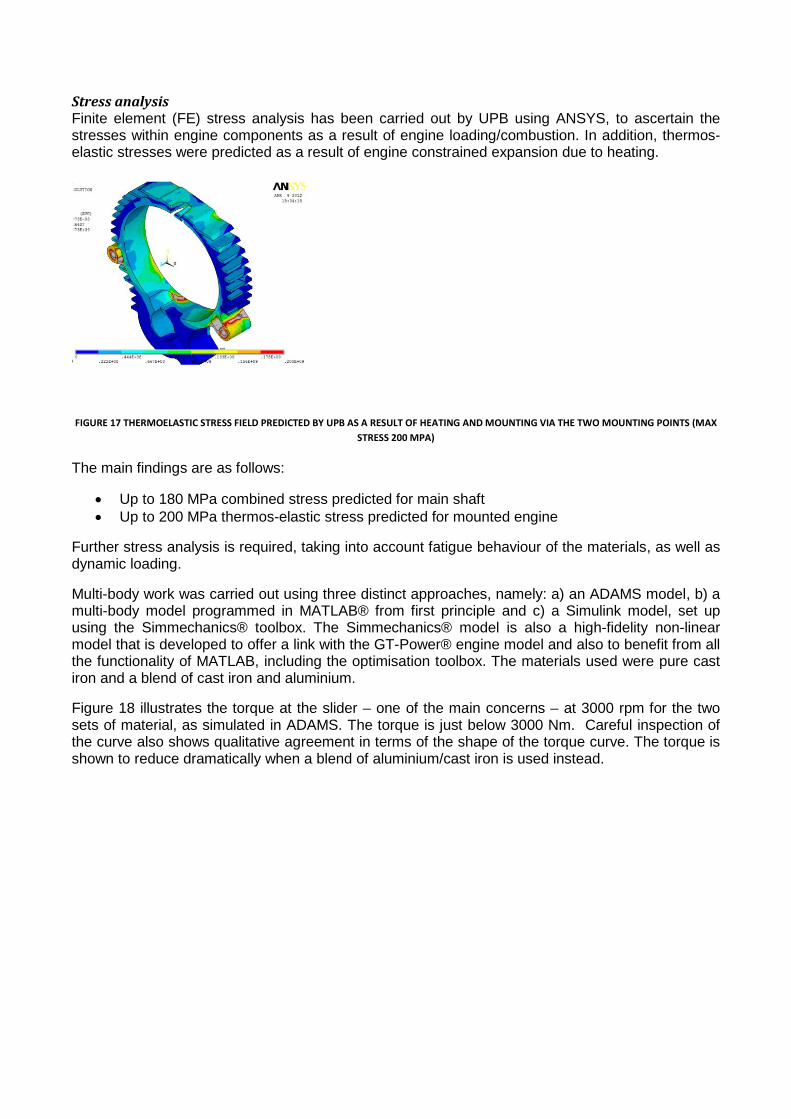
Stress analysis Finite element (FE) stress analysis has been carried out by UPB using ANSYS, to ascertain the stresses within engine components as a result of engine loading/combustion. In addition, thermos-elastic stresses were predicted as a result of engine constrained expansion due to heating.
FIGURE 17 THERMOELASTIC STRESS FIELD PREDICTED BY UPB AS A RESULT OF HEATING AND MOUNTING VIA THE TWO MOUNTING POINTS (MAX STRESS 200 MPA)
The main findings are as follows:
• Up to 180 MPa combined stress predicted for main shaft • Up to 200 MPa thermos-elastic stress predicted for mounted engine
Further stress analysis is required, taking into account fatigue behaviour of the materials, as well as dynamic loading.
Multi-body work was carried out using three distinct approaches, namely: a) an ADAMS model, b) a multi-body model programmed in MATLAB® from first principle and c) a Simulink model, set up using the Simmechanics® toolbox. The Simmechanics® model is also a high-fidelity non-linear model that is developed to offer a link with the GT-Power® engine model and also to benefit from all the functionality of MATLAB, including the optimisation toolbox. The materials used were pure cast iron and a blend of cast iron and aluminium.
Figure 18 illustrates the torque at the slider – one of the main concerns – at 3000 rpm for the two sets of material, as simulated in ADAMS. The torque is just below 3000 Nm. Careful inspection of the curve also shows qualitative agreement in terms of the shape of the torque curve. The torque is shown to reduce dramatically when a blend of aluminium/cast iron is used instead.

FIGURE 18 TORQUE ON SLIDER AT 3000 RPM (GREEN - PURE CAST IRON, RED - BLEND OF ALUMINIUM AND CAST IRON)
Figure 19 illustrates the loads on the leading and following rotor bearings as simulated by the Simmechanics® model for the aluminium/cast-iron blend of materials, at 3000 rpm. In comparison with figure 10, the peak loads are reduced significantly as a result of using a lighter material.
0 0.01 0.02 0.03 0.04 0.05 0.06 0.07 0.08 0.09 0.1-4
-3
-2
-1
0
1
2x 10
4
time (s)
forc
es o
n m
ain
roto
r (N
)
0 0.01 0.02 0.03 0.04 0.05 0.06 0.07 0.08 0.09 0.1-4
-2
0
2
4
6x 10
4
time (s)
forc
es o
n fo
llow
ing
roto
r (N
)
X axisY axis
X axisY axis
FIGURE 19 REACTION FORCES AT THE TWO PIVOTS OF THE ORIGINAL, UNBALANCED ENGINE AT 3000 RPM AS PREDICTED BY THE SIMMECHANICS MODEL
In an effort to further improve balancing, an automated optimisation study was carried using a Nelder-Mead optimisation algorithm to find the optimum position of the centres of mass of the leading rotor, following rotor and slider. The centre-of-mass positions were constrained within physical limits imposed by the geometry of the engine. The method resulted in reduction of peak loads by about 60% in the vertical direction and 90% in the longitudinal direction of the main rotor pivot. However, the remaining loads are still high and further work is required in this area.
In light of the sub-optimal balancing of the engine, consideration has been given to a multi-rotor-pair engine design. A pilot study using a three-rotor-pair engine whereby three leading rotors are connected via a common shaft at a phase angle of 120o between them was carried out using
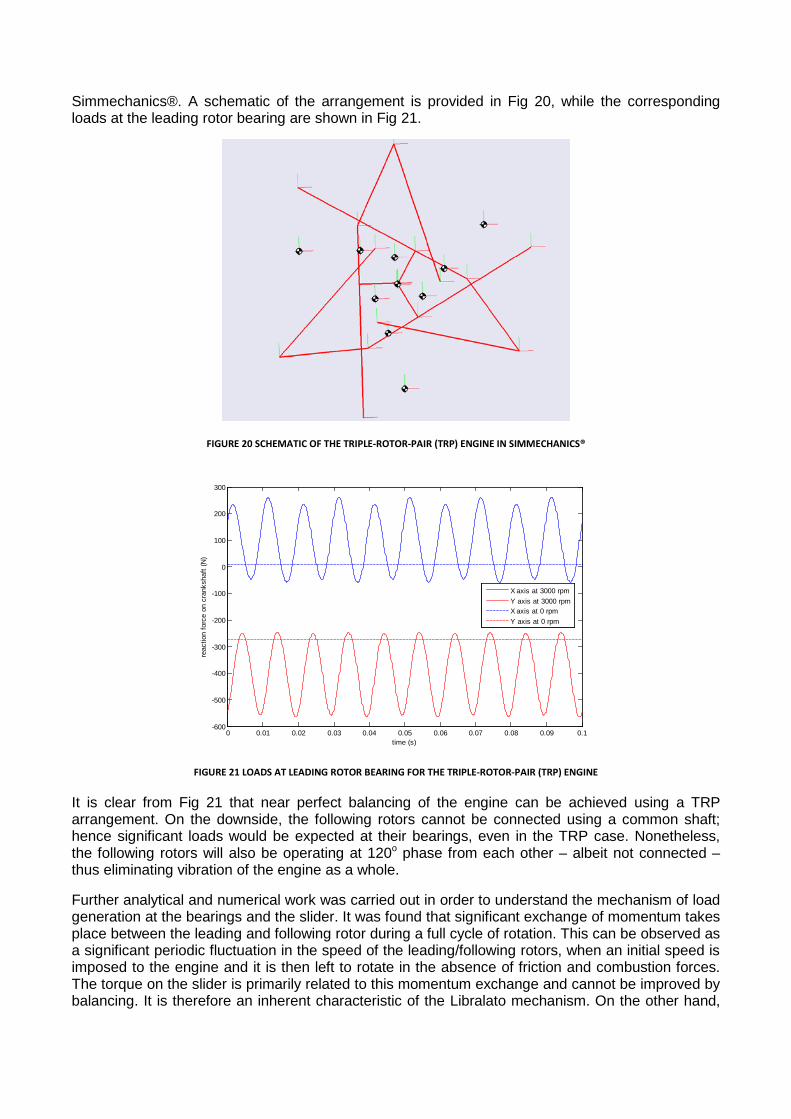
Simmechanics®. A schematic of the arrangement is provided in Fig 20, while the corresponding loads at the leading rotor bearing are shown in Fig 21.
FIGURE 20 SCHEMATIC OF THE TRIPLE-ROTOR-PAIR (TRP) ENGINE IN SIMMECHANICS®
0 0.01 0.02 0.03 0.04 0.05 0.06 0.07 0.08 0.09 0.1-600
-500
-400
-300
-200
-100
0
100
200
300
time (s)
reac
tion
forc
e on
cra
nksh
aft (
N)
X axis at 3000 rpmY axis at 3000 rpmX axis at 0 rpmY axis at 0 rpm
FIGURE 21 LOADS AT LEADING ROTOR BEARING FOR THE TRIPLE-ROTOR-PAIR (TRP) ENGINE
It is clear from Fig 21 that near perfect balancing of the engine can be achieved using a TRP arrangement. On the downside, the following rotors cannot be connected using a common shaft; hence significant loads would be expected at their bearings, even in the TRP case. Nonetheless, the following rotors will also be operating at 120o phase from each other – albeit not connected – thus eliminating vibration of the engine as a whole.
Further analytical and numerical work was carried out in order to understand the mechanism of load generation at the bearings and the slider. It was found that significant exchange of momentum takes place between the leading and following rotor during a full cycle of rotation. This can be observed as a significant periodic fluctuation in the speed of the leading/following rotors, when an initial speed is imposed to the engine and it is then left to rotate in the absence of friction and combustion forces. The torque on the slider is primarily related to this momentum exchange and cannot be improved by balancing. It is therefore an inherent characteristic of the Libralato mechanism. On the other hand,

the loads at the bearings can be reduced by improving the balancing of the mechanism, as already illustrated. This observation brings forward the torque on the slider as one of the main design concerns. Analytical work has resulted in the following dependency of slider torque on the change in the size and speed of the engine:
(1)
Where T is the torque, x is the variation factor of the radial dimension, y of the axial dimension and γ (gamma) is the variation factor of angular velocity. It is assumed that material density is kept constant. The torque increases with the 5th power of engine size (if a uniform expansion is considered) and with the 2nd power of speed. Importantly, the radial dimension of the engine has a 4th power influence on slider torque. These results have been verified by simulation and together with lubrication concerns have fundamentally influenced the design of the Mark 2 engine, as explained below.
Engine size and sealing The design refinement work reported in this section has been based on a range of simulation work. At the time of conducting the analysis it was not possible to gather any experimental evidence due to the delays in manufacture of the Mark 1 engine. However, significant knowledge has been gained from simulation studies.
With regards to overall engine design, the findings from the multi-body and lubrication analyses have led to the adoption of smaller rotors. In particular it has been decided that the Mark 1 engine is reduced uniformly in size by a factor of 0.79, resulting in a reduction in volume by a factor of 0.5. To maintain power output and in an effort to improve balancing, it has been suggested that future design, including the Mark 2 design, will consist of multiple rotors, as shown in Fig 22. In the same figure, the implementation of water cooling is shown, to address high temperatures in the engine. Finally, external balancing of the rotors is suggested at least for pre-production versions, in order to eliminate loads at bearing and vibration related concerns.
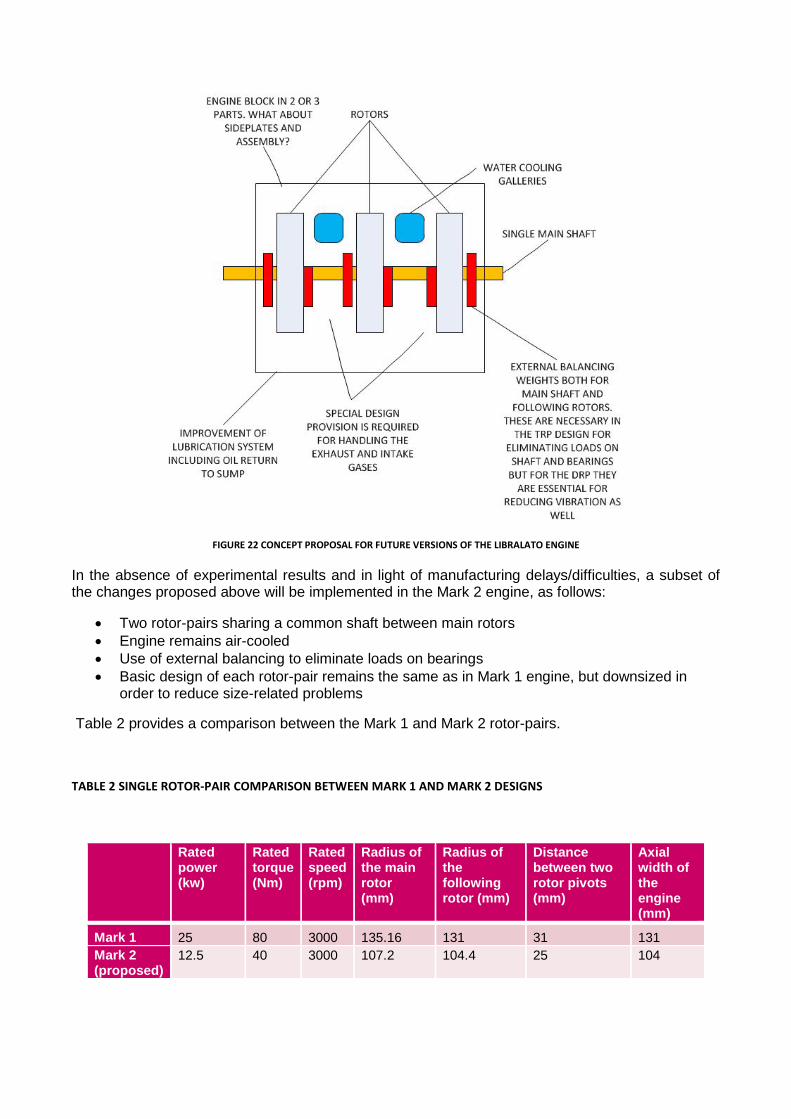
FIGURE 22 CONCEPT PROPOSAL FOR FUTURE VERSIONS OF THE LIBRALATO ENGINE
In the absence of experimental results and in light of manufacturing delays/difficulties, a subset of the changes proposed above will be implemented in the Mark 2 engine, as follows:
• Two rotor-pairs sharing a common shaft between main rotors • Engine remains air-cooled • Use of external balancing to eliminate loads on bearings • Basic design of each rotor-pair remains the same as in Mark 1 engine, but downsized in
order to reduce size-related problems
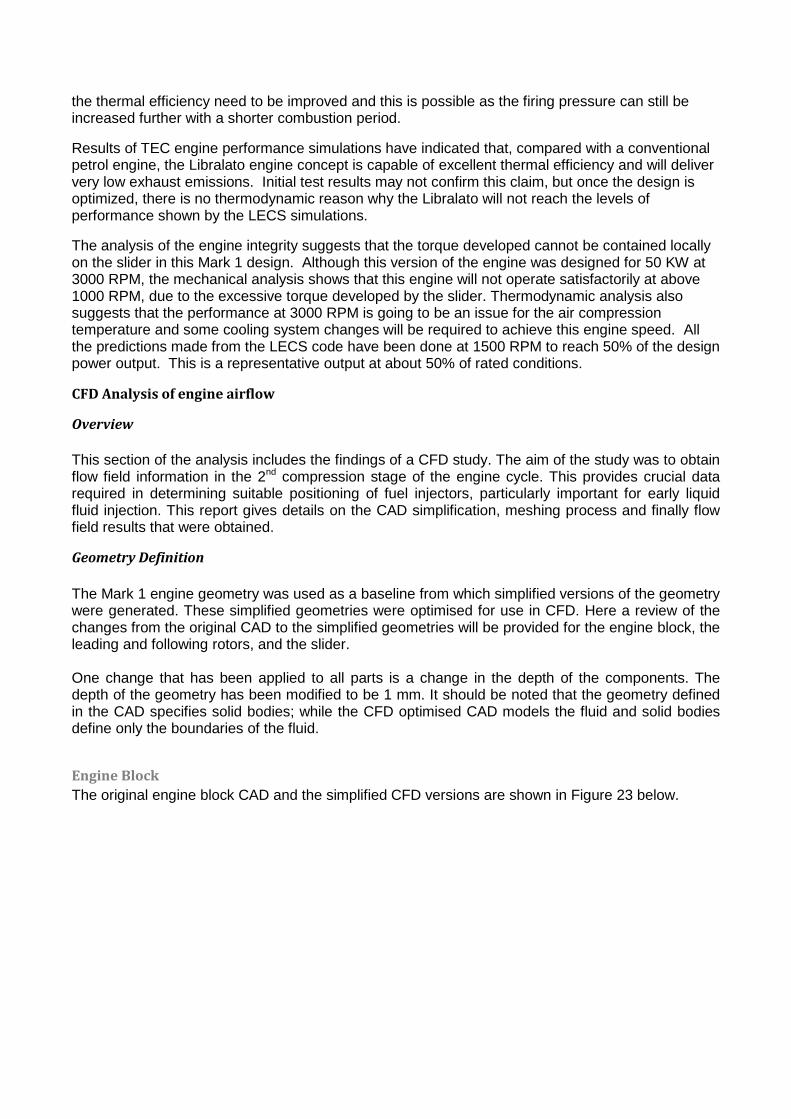
Table 2 provides a comparison between the Mark 1 and Mark 2 rotor-pairs.
TABLE 2 SINGLE ROTOR-PAIR COMPARISON BETWEEN MARK 1 AND MARK 2 DESIGNS
Rated power (kw)
Rated torque (Nm)
Rated speed (rpm)
Radius of the main rotor (mm)
Radius of the following rotor (mm)
Distance between two rotor pivots (mm)
Axial width of the engine (mm)
Mark 1 25 80 3000 135.16 131 31 131 Mark 2 (proposed)
12.5 40 3000 107.2 104.4 25 104

Sealing System The sealing system required significant re-design for the Mark 1 engine. The size of the original seals was inappropriately small for production or smooth operation. In addition, various radii of curvature had to be changed where rotors met seals, to reduce impact loads and prevent seal/rotor damage. In summary, the Mk1 sealing system was improved by:
• Calculation of all clearances between rotors/block, including the effect of thermal expansion and bearing clearances
• Re-definition of tolerances • Re-sizing and general re-design of side- and face-seals • Specification and sourcing of appropriate springs to work with the seals
Summary of conclusions from Mechanical Analysis • Large engine size (especially radially) causes extreme loads on bearings and slider. Future
engines should feature compact rotors. • Possibility of near perfect balancing using a multi-rotor-pair design with external balancing. • Relatively high stresses are predicted for some components – potentially destructive levels if
temperature and fatigue behaviour are taken into account. • Very high temperatures are predicted – water cooling seems essential in production versions. • Extreme friction losses at Mk1 following-rotor bearings. Again, large size is the culprit here.
Other engine sub-systems There has been limited progress on the analysis of fuel system, exhaust system and cooling system refinement. These tasks depend more strongly on experimental results, while they were also considered less important compared to more pressing issues such as multi-body investigations.
Thermodynamic performance The unique feature of the Libralato concept is the transient nature of its working volumes, characterized by the separation and merging of volumes as the cycle proceeds. This is in contrast with the conventional piston engine, where the cylinders form the working volume and the inlet/exhaust ports/manifold are fixed. The mathematical formulation and the results are presented in this report to assist in the validation of the program against the engine test results as they become available. Anew Libralato Engine-specific simulation software (“LECS”) was developed and includes the following features:
1. The concept of analysing the merging and separation of volumes 2. Single Zone (i.e. with no spatial property variation) with control volume concept of three-
volume interactions 3. Single zone combustion with heat transfer 4. Two zone combustion (including spatial variations) to calculate emission 5. All the above with a leakage model 6. All above with a refined model of leakage and residual gases 7. All above with multiple fuel types (gaseous and liquid) 8. All above with multi-rotor (two or three rotors) 9. Refined modelling of two cycles (720 degrees)
The current version of the LECS simulation software is based on a single zone combustion model of the Libralato engine and has already been used to simulate the performance of the engine at 25 KW

brake power at 1500 rpm. The simulation indicates that the compression pressure will be around 45-48 bar and peak pressure of 70-73 bar, with a mechanical efficiency of 90-92%. The rate of volume changes versus ignition timing and gas exchange timing have been derived from the initial CAD model, as explained earlier.
The most innovative aspect of the simulation is the way in which it processes the merging of the central volume during the expansion phase, a process which can lead to instability and which requires adjustment to pressure and temperature to provide the final solution. This modelling strategy for the central volume will be reviewed at a later stage for the complete Libralato cycle, including the gas exchange process between the expansion and compression volumes, particularly if the test results do not adequately validate the assumptions made in this first model.
Validation of the LECS program and of its Libralato engine model against the measured results from the test bed is particularly important since the Libralato cycle is completely unlike the conventional cycle of either a two-stroke or a four-stroke reciprocating engine. In the conventional cycle, working volumes are linked only through fixed volumes (i.e. the inlet and exhaust ports and manifolds). This is not the case in the Libralato cycle, where the working volumes can exchange mass directly between them.
The main engine performance parameters, as predicted by LECS are shown in Table 2.
TABLE 3 PREDICTED ENGINE PERFORMANCE
Simulation Results:
phi= 0.7365 (fuel air equivalence ratio)
Residual mass of VLH = 0.7 g Residual mass of VRH = 0.7 g
Pmax=
88.3493 bar
ISFC=
156.1 g/kWh
Indicated power =
27.3 kW
Indicated eff’y =
50.13 %
Indicated torque =
174.0 Nm
imep=
4.3 bar
BSFC =
169.7 g/kWh
Brake power =
25.1 kW
Brake efficiency =
46.1 %
Brake torque =
160.0401 Nm
bmep =
3.9 bar
Friction power =
2.19 kW
Friction torque =
13.92 Nm
fmep=
0.34 bar
Overall Heat Transfer from engine to walls= 2.60 kW
Engine Speed =
1500.0 rpm
Displacement =
2.57 dm^3
The Mark 1 engine has been tested at part load and the results of these tests were used to validate LECS software. The predicted power, cylinder pressure agree very well with the test data, but show
the thermal efficiency need to be improved and this is possible as the firing pressure can still be increased further with a shorter combustion period.
Results of TEC engine performance simulations have indicated that, compared with a conventional petrol engine, the Libralato engine concept is capable of excellent thermal efficiency and will deliver very low exhaust emissions. Initial test results may not confirm this claim, but once the design is optimized, there is no thermodynamic reason why the Libralato will not reach the levels of performance shown by the LECS simulations.
The analysis of the engine integrity suggests that the torque developed cannot be contained locally on the slider in this Mark 1 design. Although this version of the engine was designed for 50 KW at 3000 RPM, the mechanical analysis shows that this engine will not operate satisfactorily at above 1000 RPM, due to the excessive torque developed by the slider. Thermodynamic analysis also suggests that the performance at 3000 RPM is going to be an issue for the air compression temperature and some cooling system changes will be required to achieve this engine speed. All the predictions made from the LECS code have been done at 1500 RPM to reach 50% of the design power output. This is a representative output at about 50% of rated conditions.
CFD Analysis of engine airflow
Overview This section of the analysis includes the findings of a CFD study. The aim of the study was to obtain flow field information in the 2nd compression stage of the engine cycle. This provides crucial data required in determining suitable positioning of fuel injectors, particularly important for early liquid fluid injection. This report gives details on the CAD simplification, meshing process and finally flow field results that were obtained.
Geometry Definition The Mark 1 engine geometry was used as a baseline from which simplified versions of the geometry were generated. These simplified geometries were optimised for use in CFD. Here a review of the changes from the original CAD to the simplified geometries will be provided for the engine block, the leading and following rotors, and the slider. One change that has been applied to all parts is a change in the depth of the components. The depth of the geometry has been modified to be 1 mm. It should be noted that the geometry defined in the CAD specifies solid bodies; while the CFD optimised CAD models the fluid and solid bodies define only the boundaries of the fluid.
Engine Block The original engine block CAD and the simplified CFD versions are shown in Figure 23 below.

FIGURE 23 ENGINE BLOCK AND SIMPLIFIED VERSION
The radius of the leading rotor in the CFD geometry is 135.405mm. This varies from the radius of the CAD geometry of 135.19mm. The following rotor radius in the original CAD part was 130.99mm. This was changed to 131mm in the CFD simplified version. The combustion chamber on the top of the engine block was approximated from the original CAD parts at a z-coordinate of z=0. A small extrusion was included for the front inlet that extended 1mm from the face of the domain.
Leading Rotor The original leading rotor CAD part and the simplified geometry used by the CFD are shown below, Figure 24.
FIGURE 24 LEADING ROTOR AND SIMPLIFIED VERSION
Unlike the engine block, the diameter of the leading rotor body was kept constant at 135mm. The outer radius of the overset mesh region was set as 135.39mm, providing a 0.39mm space for an expected 4 cells to exist in the leading rotor mesh. These cells are necessary for the implementation of the overset regions as described in detail later in this section. The clearance between the domain and the outer radius of the leading rotor part is 0.015mm.
Following Rotor The original and modified following rotor are shown below.
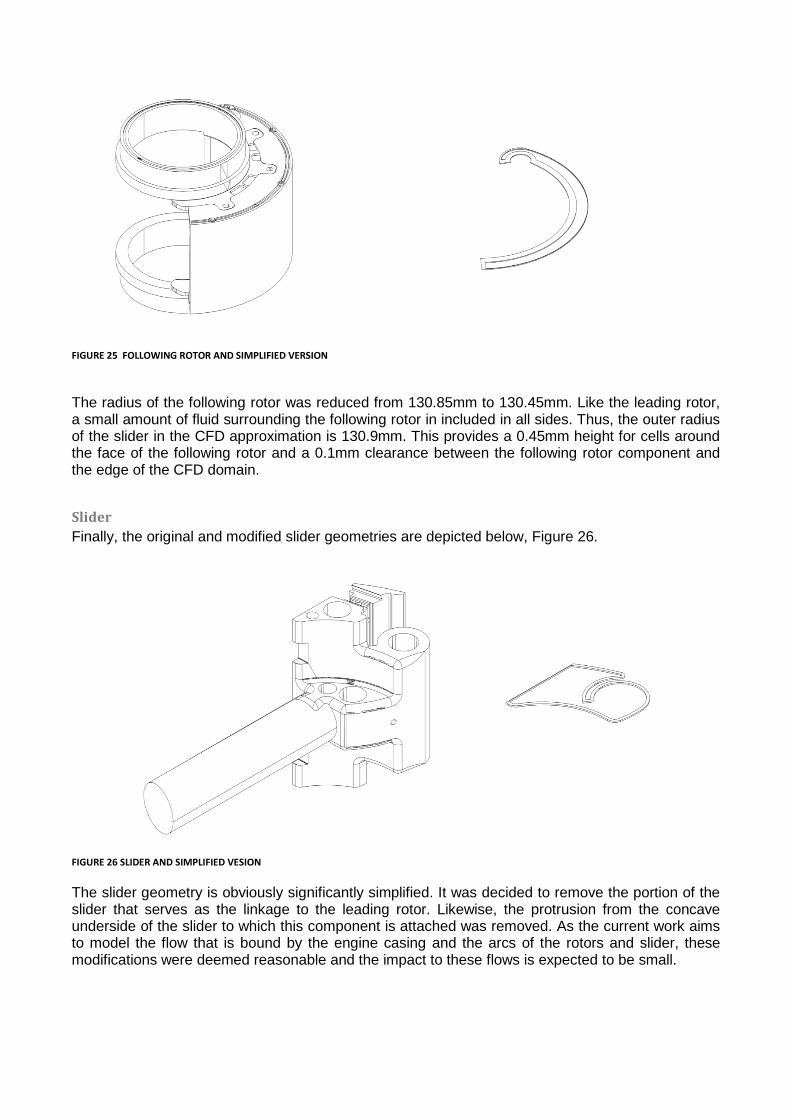
FIGURE 25 FOLLOWING ROTOR AND SIMPLIFIED VERSION
The radius of the following rotor was reduced from 130.85mm to 130.45mm. Like the leading rotor, a small amount of fluid surrounding the following rotor in included in all sides. Thus, the outer radius of the slider in the CFD approximation is 130.9mm. This provides a 0.45mm height for cells around the face of the following rotor and a 0.1mm clearance between the following rotor component and the edge of the CFD domain.
Slider Finally, the original and modified slider geometries are depicted below, Figure 26.
FIGURE 26 SLIDER AND SIMPLIFIED VESION
The slider geometry is obviously significantly simplified. It was decided to remove the portion of the slider that serves as the linkage to the leading rotor. Likewise, the protrusion from the concave underside of the slider to which this component is attached was removed. As the current work aims to model the flow that is bound by the engine casing and the arcs of the rotors and slider, these modifications were deemed reasonable and the impact to these flows is expected to be small.

Engine Assembly The complete assembly to be used by the simulation is depicted below, Figure 27.
FIGURE 27 SIMPLIFIED ENGINE ASSEMBLY
The starting position for the simulation is such that the centres of rotation are aligned on the x-axis, with a separation of 31mm. The orientation of the leading rotor is such that the face of the leading rotor that experiences the high pressures associated with the combustion is aligned parallel to the y-axis (i.e. is vertical). The projected distance in the x-direction from the vertical face of the leading rotor to the centre of the linkage between the slider and the following rotor is approximately 48mm. Finally, it should be noted that the exhaust valve was excluded from the current simulation. The exhaust valve participates in the inlet and expansion events neither of which were in the scope of this study.
Boundary Conditions
Engine Block The front and back parallel faces of the engine block domain were modelled as symmetry planes. This boundary conditions explicitly sets the shear stress to zero at the boundary. The velocity is extrapolated from the adjacent cell and the normal component is destroyed on the boundary. Likewise, pressure is extrapolated from the adjacent cell. The inlet has been set as a velocity inlet, though this is only provisional and may be changed to a mass flow inlet. The exhaust outlet is defined by a pressure outlet boundary condition. Finally, the walls have a no-slip boundary condition.
Leading Rotor, Following Rotor, and Slider Similar boundary conditions are applied to the leading rotor, following rotor, and slider. The front and back surfaces, that are coincident with the front and back of the engine block, are defined as symmetry boundary conditions. The solid walls of the parts are viscous walls. Finally, the outer edges of the parts are defined as overset mesh boundary conditions. The overset mesh boundary condition sets up a coupling with the background (engine block) and any other overset mesh parts. The motion of the components within the engine block is defined by the equations of motion created during the mechanical analysis.
Mesh Details As the components of the engine are required to move within the engine block, a dynamic meshing method is required. Mesh morphing is inappropriate for this application, as large deformations of the mesh elements would occur due to the motion. Such large deformations reduce the accuracy of the flow solution. An alternative method is the overset or Chimera method. This method meshes the components individually and overlays them on top of the engine block (background) mesh. Through interpolation methods, mesh elements are removed in the overlapping regions of the background mesh, allowing the flow solver to run on a single mesh. The details of the mesh for each component are provided. Constraining requirements of this method in CD-Adapco’s STAR-CCM+ v9.02 are:
1. Similar mesh element sizes in the overlapping regions to minimize the interpolation error. 2. At least 4-5 cells between wall boundaries.
The reasoning behind the inclusion of a gap between the walls of the engine block and rotating components in the modified CAD is now clear.
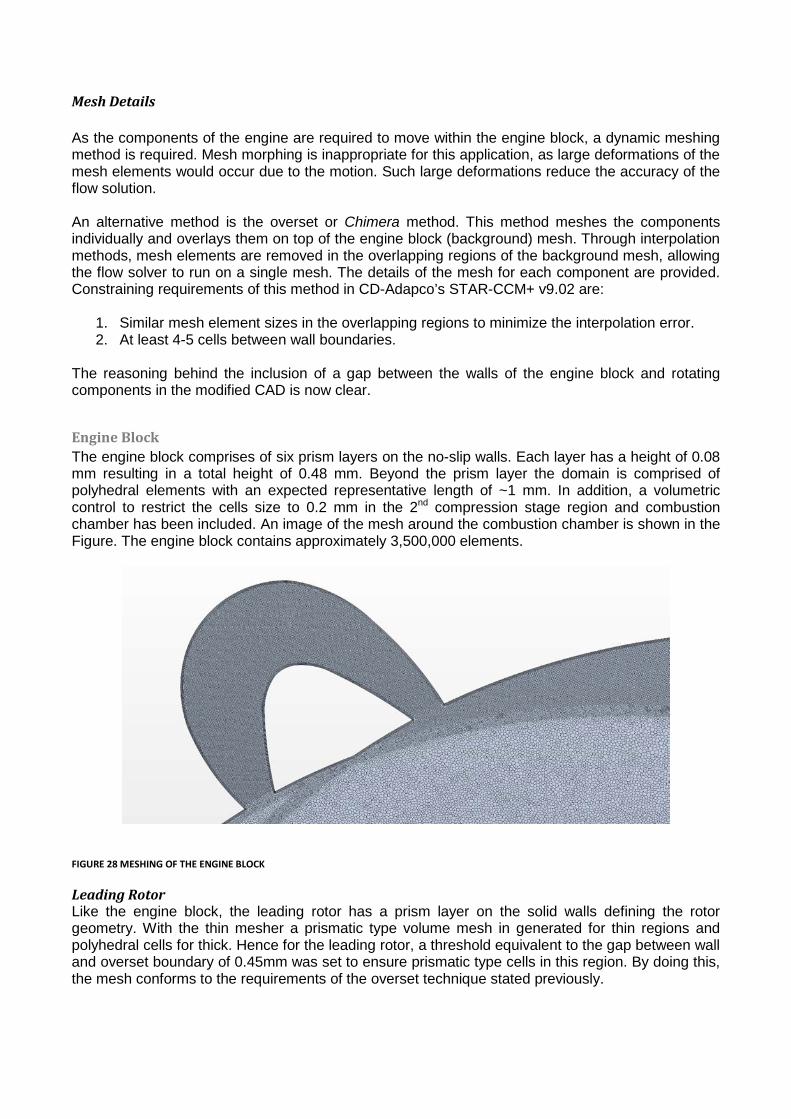
Engine Block The engine block comprises of six prism layers on the no-slip walls. Each layer has a height of 0.08 mm resulting in a total height of 0.48 mm. Beyond the prism layer the domain is comprised of polyhedral elements with an expected representative length of ~1 mm. In addition, a volumetric control to restrict the cells size to 0.2 mm in the 2nd compression stage region and combustion chamber has been included. An image of the mesh around the combustion chamber is shown in the Figure. The engine block contains approximately 3,500,000 elements.
FIGURE 28 MESHING OF THE ENGINE BLOCK
Leading Rotor Like the engine block, the leading rotor has a prism layer on the solid walls defining the rotor geometry. With the thin mesher a prismatic type volume mesh in generated for thin regions and polyhedral cells for thick. Hence for the leading rotor, a threshold equivalent to the gap between wall and overset boundary of 0.45mm was set to ensure prismatic type cells in this region. By doing this, the mesh conforms to the requirements of the overset technique stated previously.
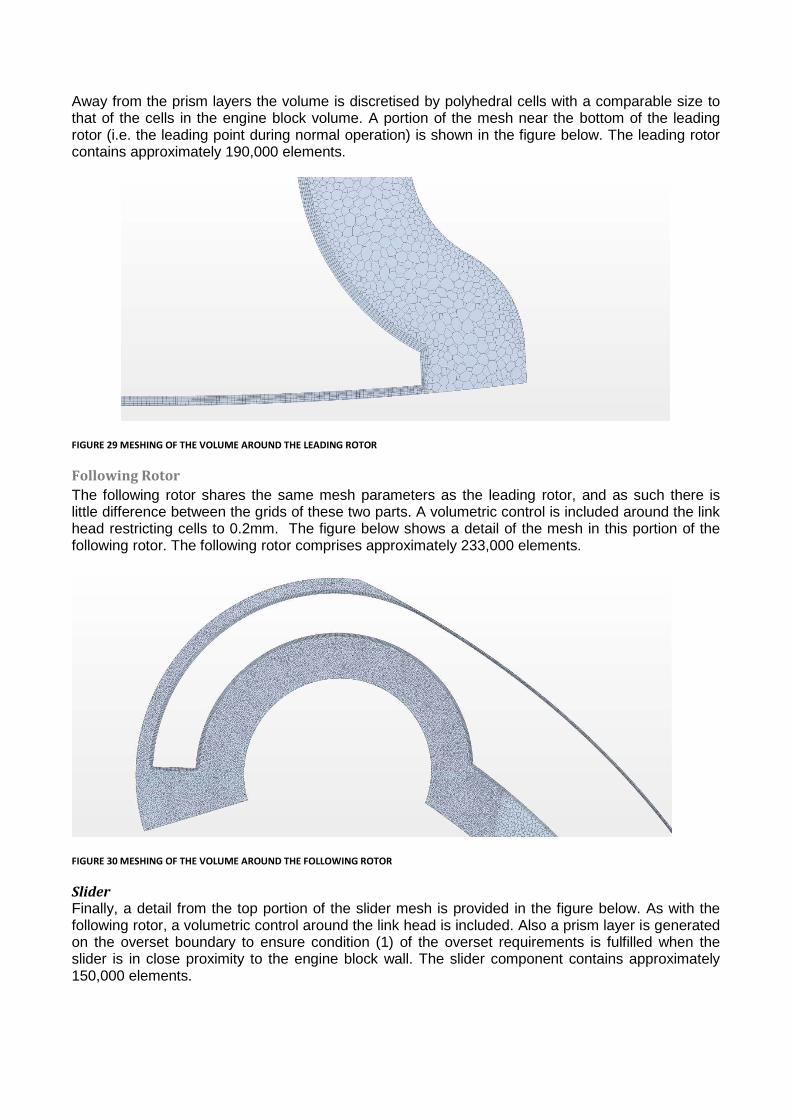
Away from the prism layers the volume is discretised by polyhedral cells with a comparable size to that of the cells in the engine block volume. A portion of the mesh near the bottom of the leading rotor (i.e. the leading point during normal operation) is shown in the figure below. The leading rotor contains approximately 190,000 elements.
FIGURE 29 MESHING OF THE VOLUME AROUND THE LEADING ROTOR
Following Rotor The following rotor shares the same mesh parameters as the leading rotor, and as such there is little difference between the grids of these two parts. A volumetric control is included around the link head restricting cells to 0.2mm. The figure below shows a detail of the mesh in this portion of the following rotor. The following rotor comprises approximately 233,000 elements.
FIGURE 30 MESHING OF THE VOLUME AROUND THE FOLLOWING ROTOR
Slider Finally, a detail from the top portion of the slider mesh is provided in the figure below. As with the following rotor, a volumetric control around the link head is included. Also a prism layer is generated on the overset boundary to ensure condition (1) of the overset requirements is fulfilled when the slider is in close proximity to the engine block wall. The slider component contains approximately 150,000 elements.
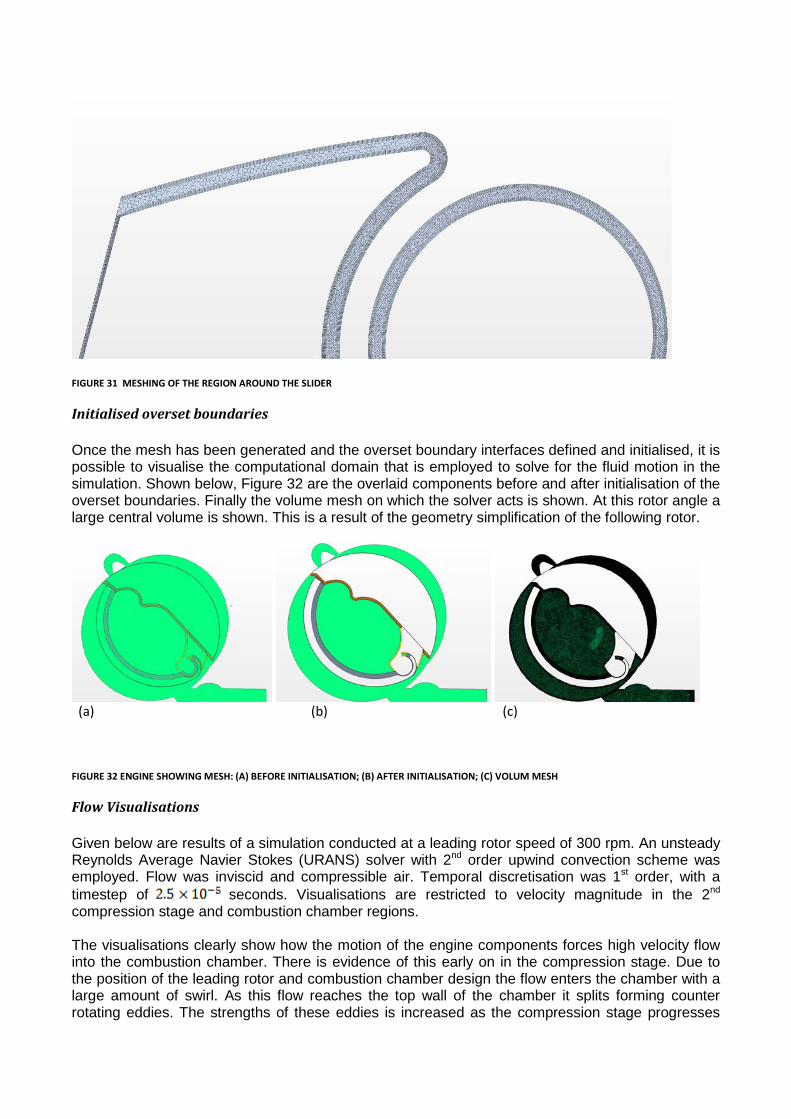
FIGURE 31 MESHING OF THE REGION AROUND THE SLIDER
Initialised overset boundaries Once the mesh has been generated and the overset boundary interfaces defined and initialised, it is possible to visualise the computational domain that is employed to solve for the fluid motion in the simulation. Shown below, Figure 32 are the overlaid components before and after initialisation of the overset boundaries. Finally the volume mesh on which the solver acts is shown. At this rotor angle a large central volume is shown. This is a result of the geometry simplification of the following rotor.
(a) (b) (c)
FIGURE 32 ENGINE SHOWING MESH: (A) BEFORE INITIALISATION; (B) AFTER INITIALISATION; (C) VOLUM MESH
Flow Visualisations Given below are results of a simulation conducted at a leading rotor speed of 300 rpm. An unsteady Reynolds Average Navier Stokes (URANS) solver with 2nd order upwind convection scheme was employed. Flow was inviscid and compressible air. Temporal discretisation was 1st order, with a timestep of seconds. Visualisations are restricted to velocity magnitude in the 2nd compression stage and combustion chamber regions. The visualisations clearly show how the motion of the engine components forces high velocity flow into the combustion chamber. There is evidence of this early on in the compression stage. Due to the position of the leading rotor and combustion chamber design the flow enters the chamber with a large amount of swirl. As this flow reaches the top wall of the chamber it splits forming counter rotating eddies. The strengths of these eddies is increased as the compression stage progresses
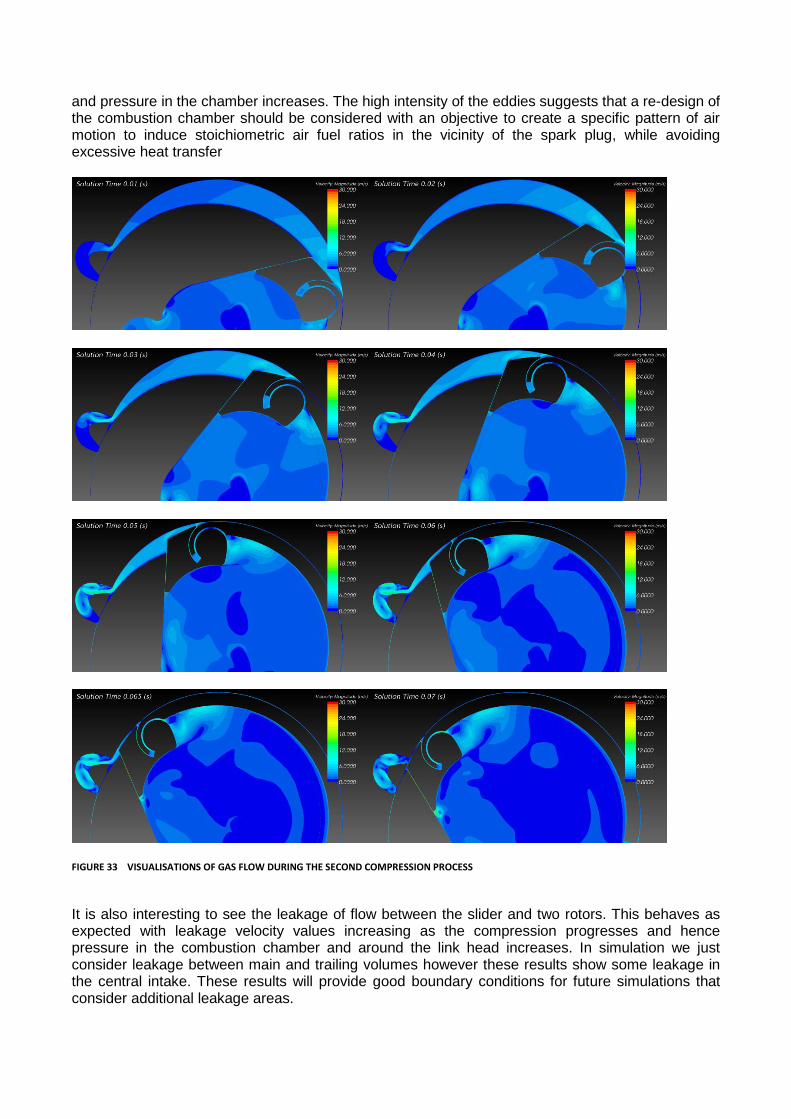
and pressure in the chamber increases. The high intensity of the eddies suggests that a re-design of the combustion chamber should be considered with an objective to create a specific pattern of air motion to induce stoichiometric air fuel ratios in the vicinity of the spark plug, while avoiding excessive heat transfer
FIGURE 33 VISUALISATIONS OF GAS FLOW DURING THE SECOND COMPRESSION PROCESS
It is also interesting to see the leakage of flow between the slider and two rotors. This behaves as expected with leakage velocity values increasing as the compression progresses and hence pressure in the combustion chamber and around the link head increases. In simulation we just consider leakage between main and trailing volumes however these results show some leakage in the central intake. These results will provide good boundary conditions for future simulations that consider additional leakage areas.

Future Work The next step would be to introduce turbulence modelling through higher order models such as Large Eddy Simulation (LES). There is also the potential to study multiphase flows, important for analysing the mixing of fuel with air in the combustion chamber for maximum efficiency or in order to achieve specified combustion goals.

Control System Implementation The control system implementation consists of two components – respectively a host and “AddOn” that provides the foundation controls for the engine. The host provides interfaces with respectively: (a) an external computer for programming purposes and (b) with instrumentation needed for assessment of the engine condition and calculation of control requirements. The host was originally proposed to be the Infineon PSK, a computer system developed for motorsport applications and development work. Later in the programme, the functions were transferred to a National Instruments cDAQ system. This section of the report is organised in the following sections: • Electronic hardware – the design requirements and the resulting electronic hardware that was
implemented to support the investigation of controls requirements. • System Description – how the hardware and software elements are integrated to give the
complete controls solution. • Systems software – the low level software elements needed to support the basic functions of the
control system • Interfaces – the connections to sensors, actuators and external systems that are required for
the test and development processes. • Calibration tool – the interfaces that have been implemented to allow a calibration support tool to
be used. • The development path that may be followed to continue to development of this system.
Electronic Hardware
Introduction The Infineon Powertrain Starter Kit (PSK) allows 12 standard electro-magnetic, low-current (1A) fuel injectors to be driven using conventional low-side drives. To support current Libralato engine development and prolong the life of the starter kit, it was necessary to be able to drive dual coil, high voltage solenoid injectors suitable for Gasoline Direct Injection (GDI) applications. It was therefore proposed to design an add-on module to allow such injectors to be interfaced to the existing kit. The add-on will be known as the “PSKInjAddOn ”.
As it was not known at the outset exactly what will be required, it was designed to include all possible facilities plus embrace the safety theme of the Aurix CPU. This includes safety monitor and reciprocal monitoring of the two devices.
AddOn System Requirements
Power Supply The PSKInjAddOn has the following minimum modes of operation for the given positive supply voltage ranges:
Range Min (V) Range Max (V) Minimum mode of operation
0 < 8.0 No operation, No Failure
>= 8.0 < 16.0 Normal Operation
>= 16.0 <22.0 Degraded Operation
>= 22.0 <40.0 No operation, No Failure
>= 40.0 - Failure allowed
FIGURE 34 MINIMUM MODES OF OPERATION

Temperature The PSKInjAddOn operates normally at normal laboratory ambient temperatures.
Other requirements No specific requirements were made in regard to humidity, sealing or vibration.
Hardware Requirements The basic hardware design requirements for the PSKInjAddOn are:
• The PSKInjAddOn shall provide 4 channels of injector drive. • The PSKInjAddOn shall interface to the existing injector outputs of the PSK without any
modification being required to the PSK. • The PSKInjAddOn shall only be powered when the PSK main power relay is energised. • The design of the PSKInjAddOn shall allow up to three such units to be added to a single
Powertrain Starter Kit. • The PSKInjAddOn shall support solenoid injector coil precharge by using two spare injector
outputs from the PSK as the BankA and BankB precharge enables. • The PSKInjAddOn shall connect to the PSK via a breakout from the existing user-defined wiring
harness. • The PSKInjAddOn shall be connected by the user to a suitable high-current ground close to the
power source. • The PSKInjAddOn shall derive its +12V supply from the PSK main power relay via the PSK sub-
harness Aux connector pin1 • The PSKInjAddOn shall include a TC275T microcontroller to allow remote configuration,
diagnostics and high pressure fuel pump control. • The PSKInjAddOn shall have a CAN interface with transceiver and suitable terminating resistor. • The PSKInjAddOn shall allow the monitoring of a ratio-metric analogue high pressure fuel pump
sensor via the microcontroller ADC. • The PSKInjAddOn shall provide a voltage feed to the high pressure fuel sensor of 5V that can
deliver 10mA.
Packaging The PSKInjAddOn shall be housed in a plastic or metal container to prevent dust contamination and accidental damage only.
Connectors The PSKInjAddOn shall use the 64-way Cinch ECU connector for all input and output signals.
Electronic Devices The PSKInjAddOn shall be based on the Infineon TLE6270R GDI injector driver.
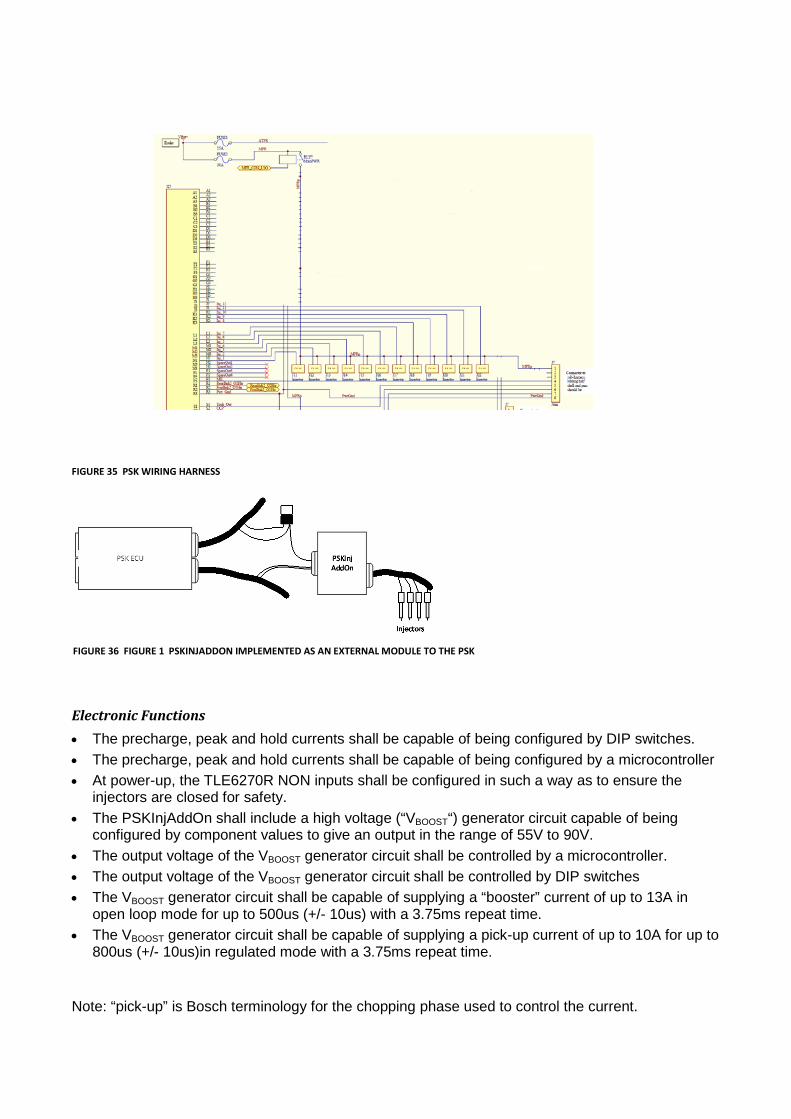
FIGURE 35 PSK WIRING HARNESS
Electronic Functions • The precharge, peak and hold currents shall be capable of being configured by DIP switches. • The precharge, peak and hold currents shall be capable of being configured by a microcontroller • At power-up, the TLE6270R NON inputs shall be configured in such a way as to ensure the
injectors are closed for safety. • The PSKInjAddOn shall include a high voltage (“VBOOST“) generator circuit capable of being
configured by component values to give an output in the range of 55V to 90V. • The output voltage of the VBOOST generator circuit shall be controlled by a microcontroller. • The output voltage of the VBOOST generator circuit shall be controlled by DIP switches • The VBOOST generator circuit shall be capable of supplying a “booster” current of up to 13A in
open loop mode for up to 500us (+/- 10us) with a 3.75ms repeat time. • The VBOOST generator circuit shall be capable of supplying a pick-up current of up to 10A for up to
800us (+/- 10us)in regulated mode with a 3.75ms repeat time.
Note: “pick-up” is Bosch terminology for the chopping phase used to control the current.
FIGURE 36 FIGURE 1 PSKINJADDON IMPLEMENTED AS AN EXTERNAL MODULE TO THE PSK

• The design of the VBOOST generator circuit shall have screening around the inductors, chopper FET and rectifier diode to reduce EM emissions.
• The CAN interface shall have opto-isolation between the microcontroller and the transceiver. • The microcontroller shall be able to monitor the injector current to an accuracy of 0.1A. • The PSKInjAddOn shall provide a 15A low-side drive device capable of PWM for a HDP5 high
pressure fuel pump. The PSKInjAddOn shall provide a means to measure the low-side drive output voltage to allow the detection of a short to ground.
• The PSKInjAddOn shall provide a high-side drive to drive a HP fuel pump • The high side drive shall have a built-in over-current detection facility that turns it off
automatically. • The high side drive shall have an output pin which gives the switch status to the microcontroller. • The high side drive shall have a pin which allows the output to be enabled or disabled by the
microcontroller • The microcontroller shall be able control the fuel pump drive current via PWM • The high side power driver to the fuel pump shall be capable of being enabled by the
microcontroller if no safety monitor is fitted. [safety measure] • The high side power driver to the fuel pump shall be enabled by the safety monitor SYSDIS_B
pin, if a safety monitor is fitted. [safety measure] • The microcontroller shall have an out-of-range voltage protected and buffered digital input signal
supplied from the PSK based on the crankshaft position. • The microcontroller shall have an out-of-range voltage protected and buffered digital input signal
from the PSK for fuel pump control (derived from a software requirement). • The microcontroller shall be able to measure the battery voltage to an accuracy of 0.1V.
(required for high pressure fuel pump driver) • The microcontroller shall be able to monitor the pressure in the high pressure fuel rail via an
ADC channel over a range of 0 – 200kPa and an accuracy of +/- 2kPa. • A Hall effect crankshaft position sensor shall be connected to the microcontroller via a suitable
input filter circuit to remove noise. • 5V range analog measurements (AREF = 5V)
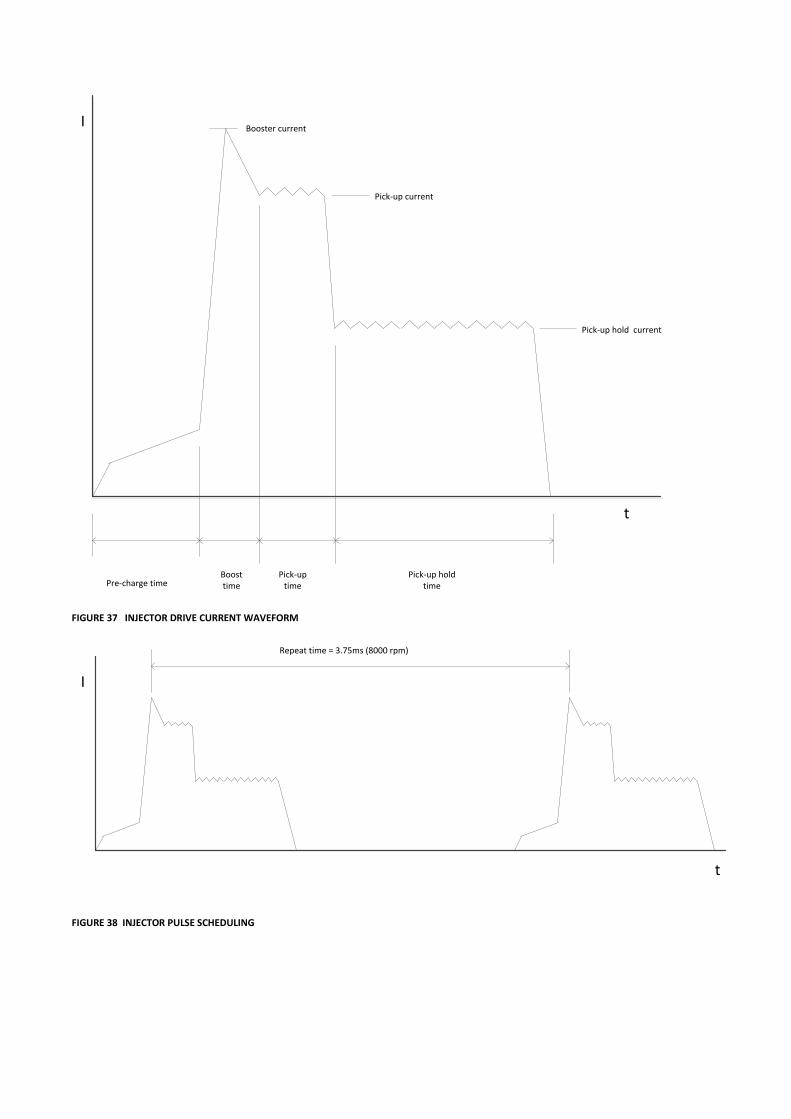
I
t
Pre-charge timeBoosttime
Pick-up time
Pick-up hold time
Booster current
Pick-up current
Pick-up hold current
FIGURE 37 INJECTOR DRIVE CURRENT WAVEFORM
t
I
Repeat time = 3.75ms (8000 rpm)
FIGURE 38 INJECTOR PULSE SCHEDULING

FIGURE 39 PSK ADD-ON BLOCK DIAGRAM
FIGURE 40 PSKINJADDON PCB
PSK
PSK Add-On
Injector control #4
Crank signal
Hall sensor crank signal
HDP5 controlIPre
Vboost Control
Vboost sample
IPeakIHold
Sig
GND
5V
CANVbatt
Injector precharge #2
TC275TA
DC
ADC
ADC
Ref
ADC
gnd
AD
CTI
M0_
0
XC2364B safety monitor
Input filter
HDP5 Driver
VBOOST
TLE6270RInj Driver
HS Drive
HS Status
HS Enable
LS Diagnostics
SysDis_B
Dual coil solenoid injectors
HDP5/MSV5 high pressurefuel pumpLS Drive
Fuel pressuresensor
Fuel Rail
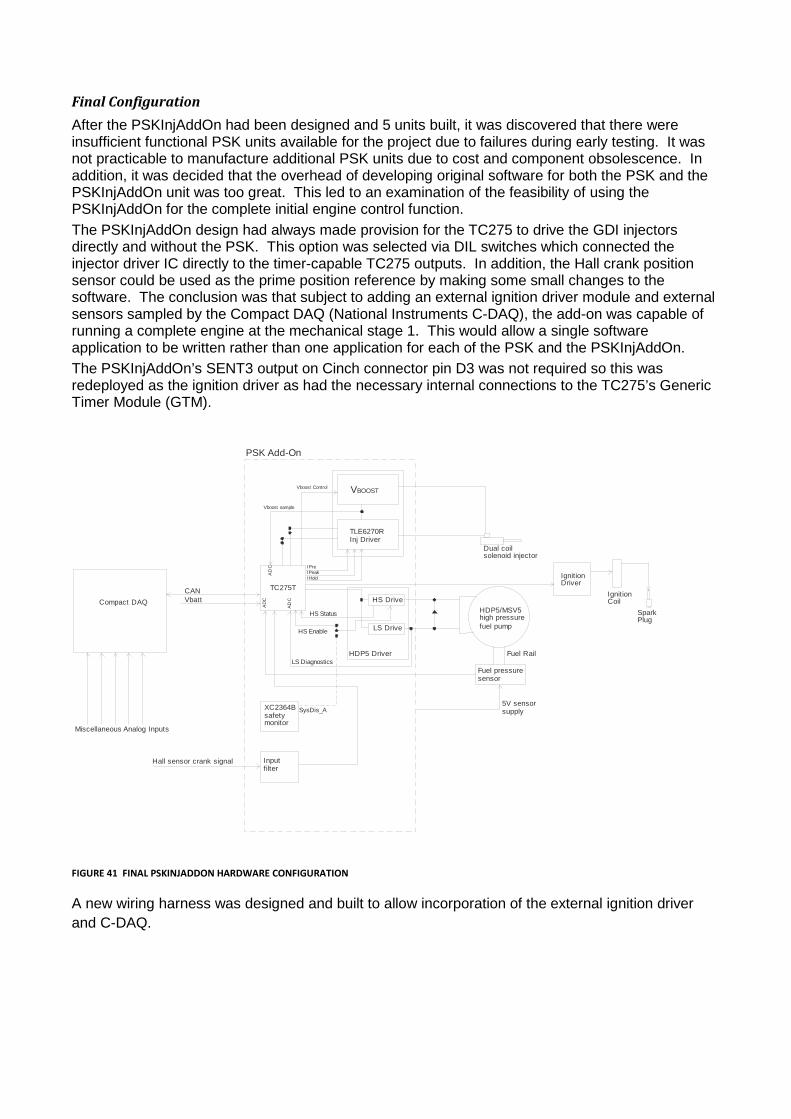
Final Configuration After the PSKInjAddOn had been designed and 5 units built, it was discovered that there were insufficient functional PSK units available for the project due to failures during early testing. It was not practicable to manufacture additional PSK units due to cost and component obsolescence. In addition, it was decided that the overhead of developing original software for both the PSK and the PSKInjAddOn unit was too great. This led to an examination of the feasibility of using the PSKInjAddOn for the complete initial engine control function. The PSKInjAddOn design had always made provision for the TC275 to drive the GDI injectors directly and without the PSK. This option was selected via DIL switches which connected the injector driver IC directly to the timer-capable TC275 outputs. In addition, the Hall crank position sensor could be used as the prime position reference by making some small changes to the software. The conclusion was that subject to adding an external ignition driver module and external sensors sampled by the Compact DAQ (National Instruments C-DAQ), the add-on was capable of running a complete engine at the mechanical stage 1. This would allow a single software application to be written rather than one application for each of the PSK and the PSKInjAddOn. The PSKInjAddOn’s SENT3 output on Cinch connector pin D3 was not required so this was redeployed as the ignition driver as had the necessary internal connections to the TC275’s Generic Timer Module (GTM).
PSK Add-On
Hall sensor crank signal
Miscellaneous Analog Inputs
IPre
Vboost Control
Vboost sample
IPeakIHold
CANVbatt
TC275T
ADC
ADC
ADC
XC2364B safety monitor
Input filter
HDP5 Driver
VBOOST
TLE6270RInj Driver
HS Drive
HS Status
HS Enable
LS Diagnostics
SysDis_A
Dual coil solenoid injector
HDP5/MSV5 high pressurefuel pumpLS Drive
Fuel pressuresensor
Fuel Rail
5V sensor supply
Ignition Driver
Compact DAQSparkPlug
IgnitionCoil
FIGURE 41 FINAL PSKINJADDON HARDWARE CONFIGURATION
A new wiring harness was designed and built to allow incorporation of the external ignition driver and C-DAQ.
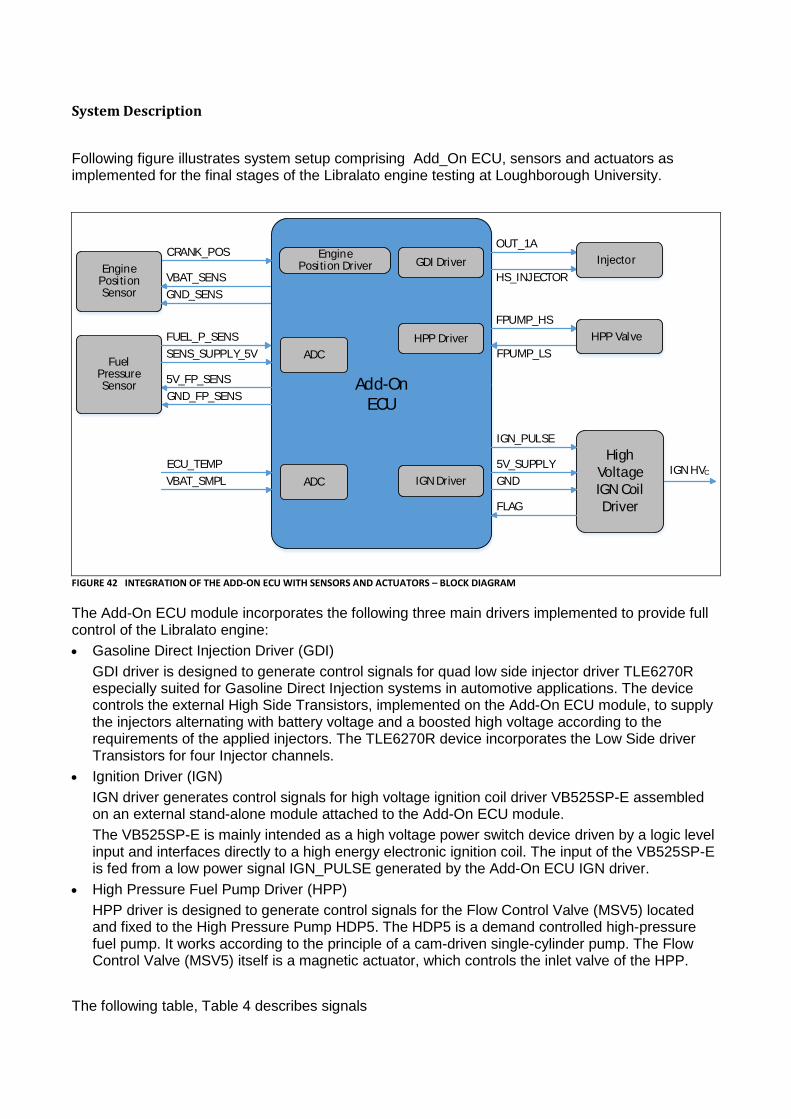
System Description
Following figure illustrates system setup comprising Add_On ECU, sensors and actuators as implemented for the final stages of the Libralato engine testing at Loughborough University.
Add-On ECU
High Voltage IGN Coil Driver
FPUMP_HS
FPUMP_LS
5V_FP_SENSGND_FP_SENS
OUT_1A
HS_INJECTORGDI Driver
HPP Driver
Fuel Pressure Sensor
FLAG
IGN_PULSE
5V_SUPPLYGND
Injector
IGN HVC
CRANK_POS
FUEL_P_SENS
IGN Driver
Engine Position Driver
VBAT_SMPLECU_TEMP
Engine Position Sensor
VBAT_SENSGND_SENS
SENS_SUPPLY_5V
ADC
ADCHPP Valve
FIGURE 42 INTEGRATION OF THE ADD-ON ECU WITH SENSORS AND ACTUATORS – BLOCK DIAGRAM
The Add-On ECU module incorporates the following three main drivers implemented to provide full control of the Libralato engine: • Gasoline Direct Injection Driver (GDI)
GDI driver is designed to generate control signals for quad low side injector driver TLE6270R especially suited for Gasoline Direct Injection systems in automotive applications. The device controls the external High Side Transistors, implemented on the Add-On ECU module, to supply the injectors alternating with battery voltage and a boosted high voltage according to the requirements of the applied injectors. The TLE6270R device incorporates the Low Side driver Transistors for four Injector channels.
• Ignition Driver (IGN) IGN driver generates control signals for high voltage ignition coil driver VB525SP-E assembled on an external stand-alone module attached to the Add-On ECU module. The VB525SP-E is mainly intended as a high voltage power switch device driven by a logic level input and interfaces directly to a high energy electronic ignition coil. The input of the VB525SP-E is fed from a low power signal IGN_PULSE generated by the Add-On ECU IGN driver.
• High Pressure Fuel Pump Driver (HPP) HPP driver is designed to generate control signals for the Flow Control Valve (MSV5) located and fixed to the High Pressure Pump HDP5. The HDP5 is a demand controlled high-pressure fuel pump. It works according to the principle of a cam-driven single-cylinder pump. The Flow Control Valve (MSV5) itself is a magnetic actuator, which controls the inlet valve of the HPP.
The following table, Table 4 describes signals
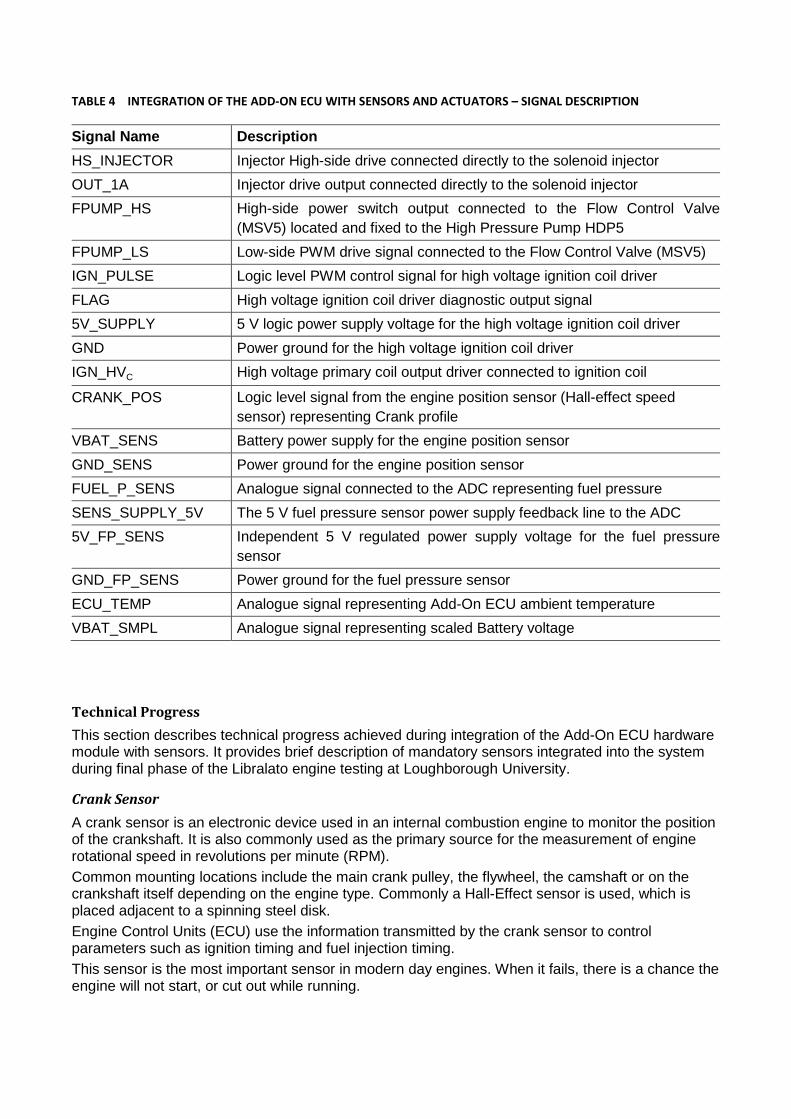
TABLE 4 INTEGRATION OF THE ADD-ON ECU WITH SENSORS AND ACTUATORS – SIGNAL DESCRIPTION
Signal Name Description HS_INJECTOR Injector High-side drive connected directly to the solenoid injector OUT_1A Injector drive output connected directly to the solenoid injector FPUMP_HS High-side power switch output connected to the Flow Control Valve
(MSV5) located and fixed to the High Pressure Pump HDP5 FPUMP_LS Low-side PWM drive signal connected to the Flow Control Valve (MSV5) IGN_PULSE Logic level PWM control signal for high voltage ignition coil driver FLAG High voltage ignition coil driver diagnostic output signal 5V_SUPPLY 5 V logic power supply voltage for the high voltage ignition coil driver GND Power ground for the high voltage ignition coil driver IGN_HVC High voltage primary coil output driver connected to ignition coil
CRANK_POS Logic level signal from the engine position sensor (Hall-effect speed sensor) representing Crank profile
VBAT_SENS Battery power supply for the engine position sensor GND_SENS Power ground for the engine position sensor FUEL_P_SENS Analogue signal connected to the ADC representing fuel pressure SENS_SUPPLY_5V The 5 V fuel pressure sensor power supply feedback line to the ADC 5V_FP_SENS Independent 5 V regulated power supply voltage for the fuel pressure
sensor GND_FP_SENS Power ground for the fuel pressure sensor ECU_TEMP Analogue signal representing Add-On ECU ambient temperature VBAT_SMPL Analogue signal representing scaled Battery voltage
Technical Progress This section describes technical progress achieved during integration of the Add-On ECU hardware module with sensors. It provides brief description of mandatory sensors integrated into the system during final phase of the Libralato engine testing at Loughborough University.
Crank Sensor A crank sensor is an electronic device used in an internal combustion engine to monitor the position of the crankshaft. It is also commonly used as the primary source for the measurement of engine rotational speed in revolutions per minute (RPM). Common mounting locations include the main crank pulley, the flywheel, the camshaft or on the crankshaft itself depending on the engine type. Commonly a Hall-Effect sensor is used, which is placed adjacent to a spinning steel disk. Engine Control Units (ECU) use the information transmitted by the crank sensor to control parameters such as ignition timing and fuel injection timing. This sensor is the most important sensor in modern day engines. When it fails, there is a chance the engine will not start, or cut out while running.

A Hall-Effect speed sensor HA-D 90 has been utilized as a Libralato engine position sensor. This sensor is designed for incremental measurement of rotational speed (e.g. camshaft, crankshaft or wheel speed). Due to the rotation of a ferromagnetic target wheel in front of the HA-D, the magnetic field is modulated at the place of the Hall probe. The HA-D 90 is no true-power-on sensor. It needs the falling edge of two teeth for correct working. After a time of 0.68 s without rotation of the detected wheel it needs again the falling edge of two teeth. The main feature and benefit of this sensor is a very good detection of the falling edge, due to a differential measuring method. For more details on HA-D 90 sensor including technical specification please refer to the Hall-Effect Speed Sensor HA-D 90 Data Sheet from Bosch. During Libralato engine testing the HA-D 90 is placed adjacent to the wheel, with 36-1 teeth, assembled to the Libralato engine drive shaft. Profile 36-1 describes the wheel with 35 teeth plus one missing tooth called “gap” tooth. For the proper operation the HA-D 90 sensor requires power supply in a range 5 to 18 V. Battery power supply has been connected to the sensor. Sensor signal designated as a CRANK_POS has been connected to the Add-On ECU. This signal is used by Engine Position Driver to determine engine position and engine rotational speed given in RPM. The engine position driver input circuit is illustrated in the following Figure, 43.
FIGURE 43 ENGINE POSITION DRIVER INPUT CIRCUIT
The engine position driver interacts with the higher software layer by using a set of callback functions. Each time when the gap tooth is detected event that triggers IfxVrs_gapEx callback function is generated. In this function engine speed is calculated first. Then the semaphore which determines the start of the new engine cycle is signaled. Subsequently, semaphores for the three main drivers GDI, IGN and HPP are signaled and main task functions for all three drivers are executed providing injection, ignition and HPP valve control signals for the new engine cycle.
Fuel Pressure Sensor The Bosch Pressure Sensor Fluid PSS-250R has been utilized for a fuel pressure measurement. This sensor is designed to measure the pressure of media in relation to the ambient pressure (e.g. gasoline, diesel, water, engine oil, transmission oil or air). The sensor is available for two different supply voltage ranges 4.75 V to 5.25 V and 8 V to 30 V. The sensor uses stainless steel measuring cells with piezo-resistive measuring bridges in thin layer technique, which are hermetically welded together with stainless steel pressure ports. This guarantees a complete media compatibility. The sensor has a protection for over voltage, reverse polarity and short circuit. It is not recommended to fix the sensor directly to the engine block in order to avoid undesired strong vibrations.

For more details on PSS-250R sensor including technical specification please refer to the Pressure Sensor Fluid PSS-250R Data Sheet. During Libralato engine testing the sensor was assembled to the high pressure fuel pump driven separately and locked to the engine rotation. PSS-250R sensor has a maximum pressure of 500 bar and generates an analog voltage output of 16 mV per bar on a ratio metric basis. This equates to 2.4 V at the expected operating pressure of 150bar, with a 5 V reference power supply. Given the useful 10-bit resolution of the TC275 ADC of 4.88 mV/bit, the best case pressure resolution will be 0.305 bar/bit. Following figure, 44 illustrates fuel pressure sensor input circuit.
FIGURE 44 FUEL PRESSURE SENSOR INPUT CIRCUIT
The sensor has an independent 5 V regulated power supply, derived from the TLF7368 voltage regulator Q_T1 output which is intended as a stable reference supply for analog sensors, as illustrated in the following figure.
FIGURE 45 FUEL PRESSURE SENSOR 5 V POWER SUPPLY
The 5V sensor supply has a feedback line to the ADC to allow the accuracy of the voltage to be monitored. By reading the 5V supply to the sensor via a separate channel, the output could be corrected using the following equation:
Pressure (kPa) = (5V * ADCreading) / (0.016 * ADCsupply) Here “5V” is the analog voltage reference used by the AURIX™ TC275 A, derived from the TLE7368 voltage regulator Q_LDO1 output. Fuel pressure reading provided by the sensor is used in closed loop control algorithm to calculate HPP control wave parameters. In particular PWM duty cycle for holding phase of the HPP driver waveform is controlled to maintain fuel pressure at the expected operating pressure of 150 bar.
ADC
ADC SENSOR

Application Layer The application layer consists of three software drivers implemented to provide control signals for three major functional units of the Add-On ECU hardware module used to control Libralato engine. Drivers and corresponding functional units are: • Gasoline Direct Injection (GDI) • Ignition (IGN) • High Pressure Fuel Pump (HPP)
Gasoline Direct Injection Driver GDI driver is designed to generate control signals for quad low side injector driver TLE6270R especially suited for Gasoline Direct Injection systems in automotive applications. The device controls the external High Side Transistors to supply the injectors alternating with battery voltage and a boosted high voltage according to the requirements of the applied injectors. The TLE6270R device incorporates the Low Side driver Transistors for four Injector channels. Figure 46 shows the application diagram of injection system implemented in the Add-On ECU.
FIGURE 46 TLE6270R APPLICATION DIAGRAM
Although in a case of Libralato engine only one injector is used, the GDI driver is implemented to support control of up to four solenoid injectors, allowing for the possible future expansion. Typical waveform diagram for one injector driver TLE6270R output control is shown in the following figure, Figure 47.
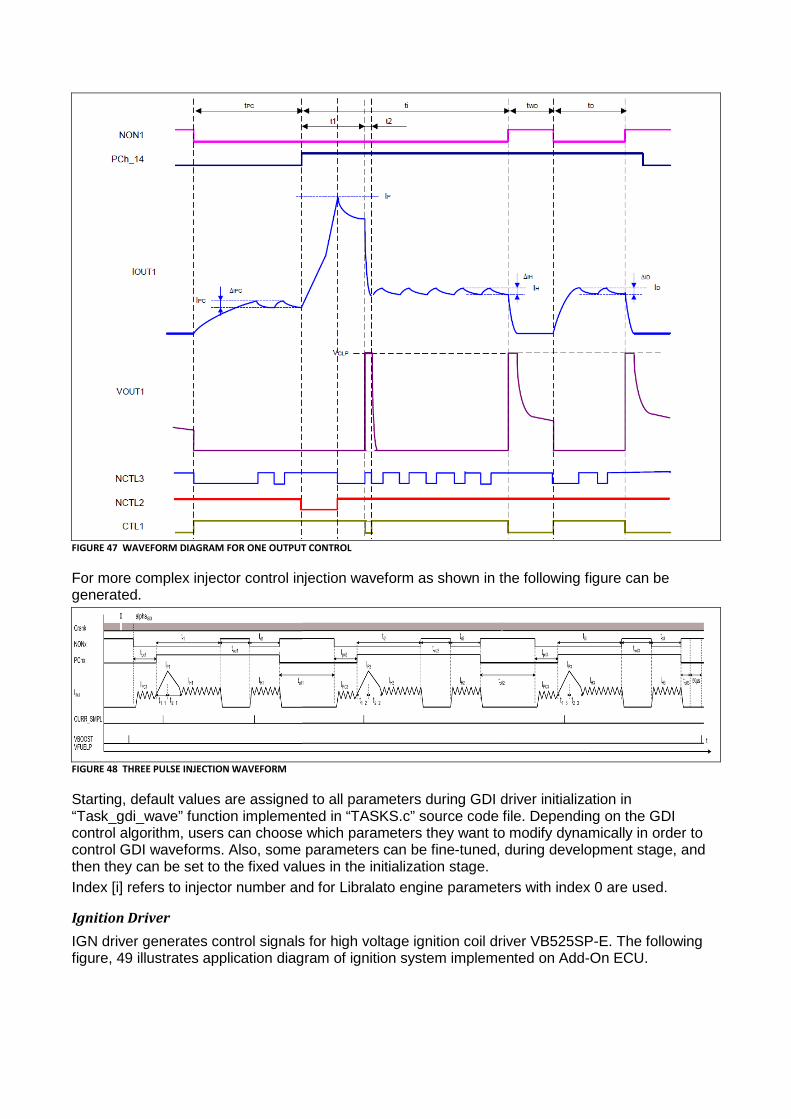
FIGURE 47 WAVEFORM DIAGRAM FOR ONE OUTPUT CONTROL
For more complex injector control injection waveform as shown in the following figure can be generated.
FIGURE 48 THREE PULSE INJECTION WAVEFORM
Starting, default values are assigned to all parameters during GDI driver initialization in “Task_gdi_wave” function implemented in “TASKS.c” source code file. Depending on the GDI control algorithm, users can choose which parameters they want to modify dynamically in order to control GDI waveforms. Also, some parameters can be fine-tuned, during development stage, and then they can be set to the fixed values in the initialization stage. Index [i] refers to injector number and for Libralato engine parameters with index 0 are used.
Ignition Driver IGN driver generates control signals for high voltage ignition coil driver VB525SP-E. The following figure, 49 illustrates application diagram of ignition system implemented on Add-On ECU.
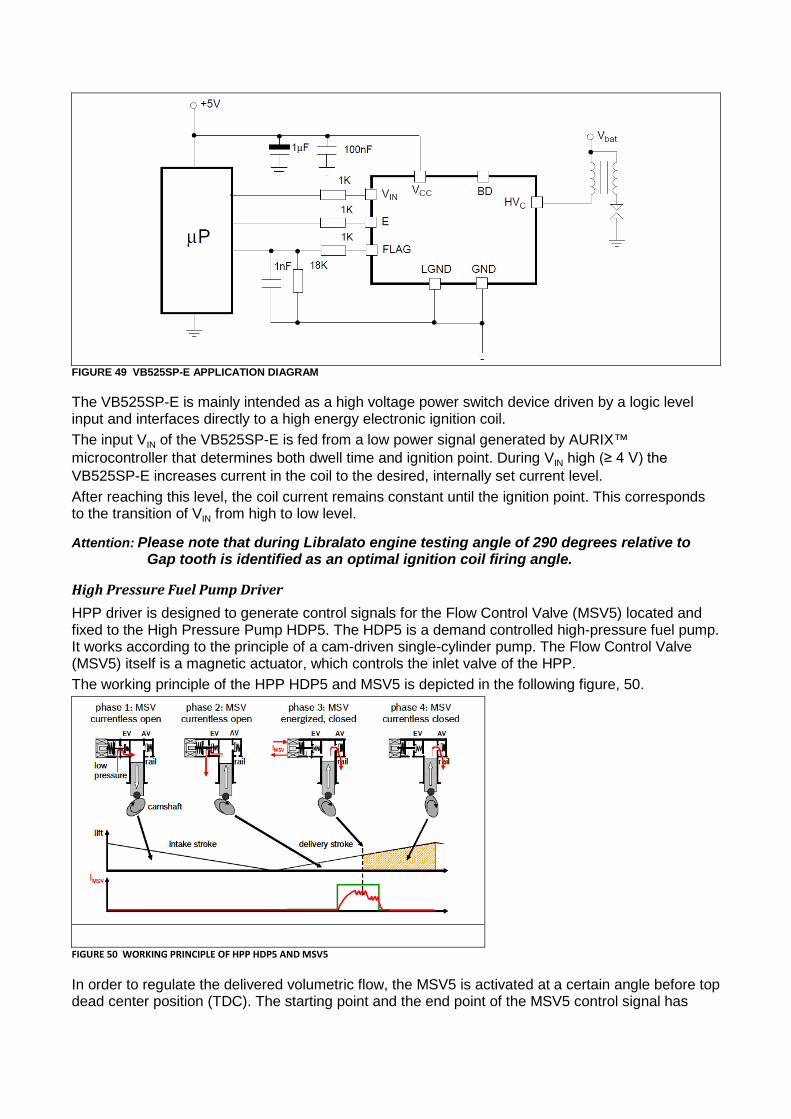
FIGURE 49 VB525SP-E APPLICATION DIAGRAM
The VB525SP-E is mainly intended as a high voltage power switch device driven by a logic level input and interfaces directly to a high energy electronic ignition coil. The input VIN of the VB525SP-E is fed from a low power signal generated by AURIX™ microcontroller that determines both dwell time and ignition point. During VIN high (≥ 4 V) the VB525SP-E increases current in the coil to the desired, internally set current level. After reaching this level, the coil current remains constant until the ignition point. This corresponds to the transition of VIN from high to low level.
Attention: Please note that during Libralato engine testing angle of 290 degrees relative to Gap tooth is identified as an optimal ignition coil firing angle.
High Pressure Fuel Pump Driver HPP driver is designed to generate control signals for the Flow Control Valve (MSV5) located and fixed to the High Pressure Pump HDP5. The HDP5 is a demand controlled high-pressure fuel pump. It works according to the principle of a cam-driven single-cylinder pump. The Flow Control Valve (MSV5) itself is a magnetic actuator, which controls the inlet valve of the HPP. The working principle of the HPP HDP5 and MSV5 is depicted in the following figure, 50.
FIGURE 50 WORKING PRINCIPLE OF HPP HDP5 AND MSV5
In order to regulate the delivered volumetric flow, the MSV5 is activated at a certain angle before top dead center position (TDC). The starting point and the end point of the MSV5 control signal has
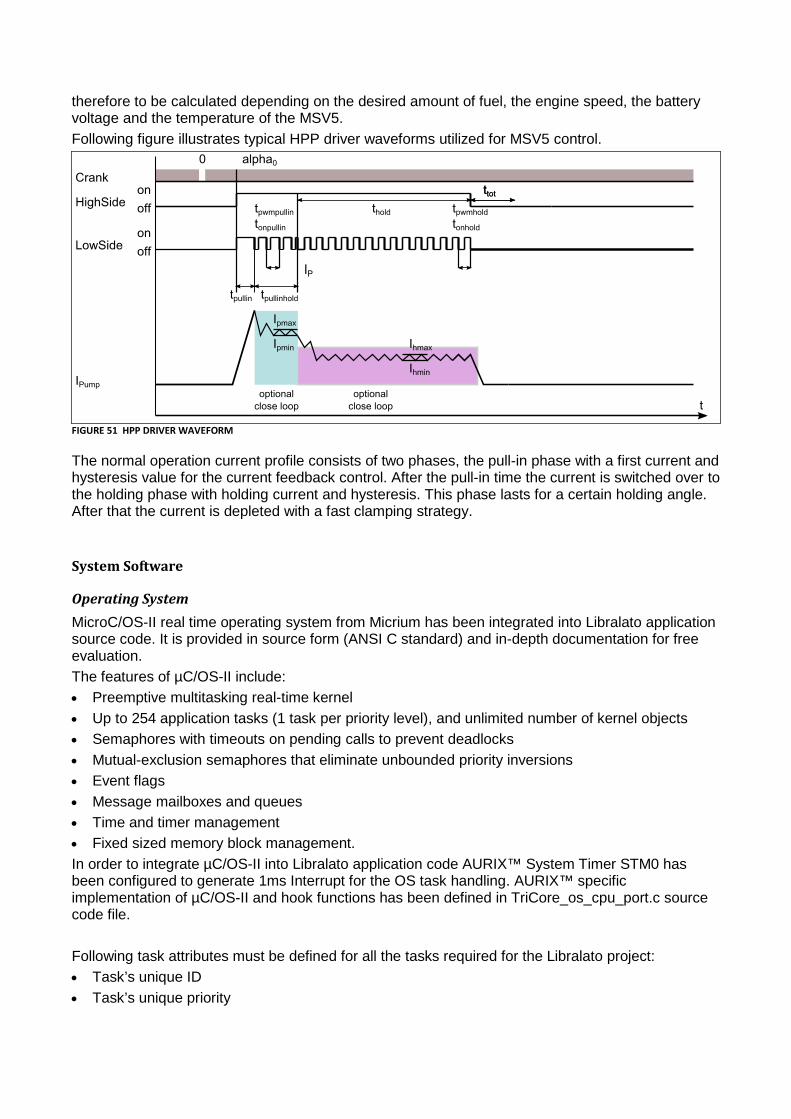
therefore to be calculated depending on the desired amount of fuel, the engine speed, the battery voltage and the temperature of the MSV5. Following figure illustrates typical HPP driver waveforms utilized for MSV5 control.
FIGURE 51 HPP DRIVER WAVEFORM
The normal operation current profile consists of two phases, the pull-in phase with a first current and hysteresis value for the current feedback control. After the pull-in time the current is switched over to the holding phase with holding current and hysteresis. This phase lasts for a certain holding angle. After that the current is depleted with a fast clamping strategy.
System Software
Operating System MicroC/OS-II real time operating system from Micrium has been integrated into Libralato application source code. It is provided in source form (ANSI C standard) and in-depth documentation for free evaluation. The features of µC/OS-II include: • Preemptive multitasking real-time kernel • Up to 254 application tasks (1 task per priority level), and unlimited number of kernel objects • Semaphores with timeouts on pending calls to prevent deadlocks • Mutual-exclusion semaphores that eliminate unbounded priority inversions • Event flags • Message mailboxes and queues • Time and timer management • Fixed sized memory block management. In order to integrate µC/OS-II into Libralato application code AURIX™ System Timer STM0 has been configured to generate 1ms Interrupt for the OS task handling. AURIX™ specific implementation of µC/OS-II and hook functions has been defined in TriCore_os_cpu_port.c source code file. Following task attributes must be defined for all the tasks required for the Libralato project: • Task’s unique ID • Task’s unique priority

• Task’s user stack area • Task’s semaphore (Pointer to event control block) Then, all the tasks must be created executing OSTaskCreateExt uC/OS-II function. Finally µC/OS-II core function OSStart must be invoked. This function is used to start the multitasking process which lets uC/OS-II manages all the tasks defined in the project. For details of the implementation please refer to the project source code files. µC/OS-II signals semaphores for all the tasks upon detection of the Gap tooth which determines the start of the new engine cycle.
Interrupt/Trap Management To keep a consistent CPU context it is necessary that interrupt/trap handling routines conform to the following rules: • Interrupt/trap vector code has to save the upper and lower CPU context. The upper context is
saved by the hardware but the lower context must be stored by a STLCX or BISR at the beginning of any exception code. This could be done best inside the interrupt/trap vector itself.
• Afterwards the interrupt handler function must be invoked by a CALL, CALLA or CALLI command (no jump or jump and link instruction).
This is the normal case if ISRs are written in C language.
Interfaces The AURIX™ MultiCAN+ module provides a communication interface which is fully compliant with CAN specification V2.0B (active) and to CAN FD ISO11898-1 FDIS version 2013, providing communication speed of up to 1 Mbit/s in standard CAN (ISO 11898-1:2003(E) mode. The MultiCAN+ module of AURIX™ TC27x microcontroller contains 4 independently operating CAN nodes with Full-CAN functionality that are able to exchange Data and Remote Frames via a gateway function. Each CAN node communicates over two pins (TXD and RXD). The device ports which are used for TXD and RXD may be individually configured. Several port configuration options are available to provide application-specific flexibility. Each CAN node can receive and transmit standard frames with 11-bit identifiers as well as extended frames with 29-bit identifiers. For Libralato project two CAN nodes have been utilized: • CAN node 1 for communication with Compact DAQ • CAN node 2 for communication with calibration tool
CAN Interface to Compact DAQ For all analogue sensor readings Compact DAQ (cDAQ) from National Instruments has been intended. CAN node 1 is configured as a communication interface between Add-On ECU and cDAQ. CAN message objects are configured for frame reception from cDAQ for each sensor individually. Sensors are organized in three groups and data structures are defined for each group.
CAN Interface to Calibration Tool Vector Informatik GmbH Universal Measurement and Calibration Protocol (XCP) device driver has been integrated into Libralato application source code, to enable calibration and fine tuning of selected parameters with Vector CANape tool. All IGN, GDI and HPP wave parameters defined in data structures TGDI_WAVE_PARAM, TIGN_WAVE_PARAM and THPP_WAVE_PARAM are available for calibration and fine tuning. These data structures are defined according to the Vector XCP device driver requirements to support calibration functionality. For details of the implementation please refer to the project source code files. CAN node 2 is configured as a communication interface between Add-On ECU and Vector CANape tool. For that purpose two CAN message objects are configured, one for frame reception from

Vector CANape tool with message ID 0x150 and one for frame transmission to Vector CANape tool with message ID 0x160.
Development Path A Simulink® model has been integrated into Libralato application source code and some basic functionality has been tested to verify integration strategy. In future development, full engine control should be implemented using Simulink model. Analogue sensor measurements, acquired from cDAQ, and calculated engine speed should be used as an input parameters. Simulink model should then calculate all angular and timing parameters required by GDI, IGN and HPP drivers to generate the corresponding waveforms.

Engine Test
Introduction The main purposes of this phase of experimental work was to investigate the behaviour of the Libralato engine, to achieve a better understanding of the main functions of the engine including lubrication, sealing and mechanical behaviour.
Tests consisted of running the engine with throttle open across a speed range starting up to 600 rpm. Above 600 rpm the out-of-balance forces were simply too great to risk damage to the mechanical structure of the test facility. Based on this experience the engine has been modified with a balancer shaft arrangement which at the conclusion of the project was awaiting further testing.
Principal measurements were made as follows:
Quantity Device Illustration
Speed Multi-tooth wheel with hall-effect sensor (for monitoring and control)
Speed Encoder (for pressure sensor measurements)
Cylinder pressure Kistler embedded sensor
Torque HBM T40B
Test Plan and Rationale Test planning was focussed on the need to provide data for evaluation of models and simulation codes and to provide data to help validate the dynamics modelling work conducted early in the programme.
The objectives of the cold test were respectively:
• Evaluate the engine cycle, acquiring compression pressure and torques. • Measure and characterise the torque noting any changes that result with engine operating
time • Observe and explain air flow to the engine
The objectives for the hot test were then:
• Fire the engine in a direct injection mode • Observe torque and cylinder pressure during the fired operation so as to be able to make
predictions.
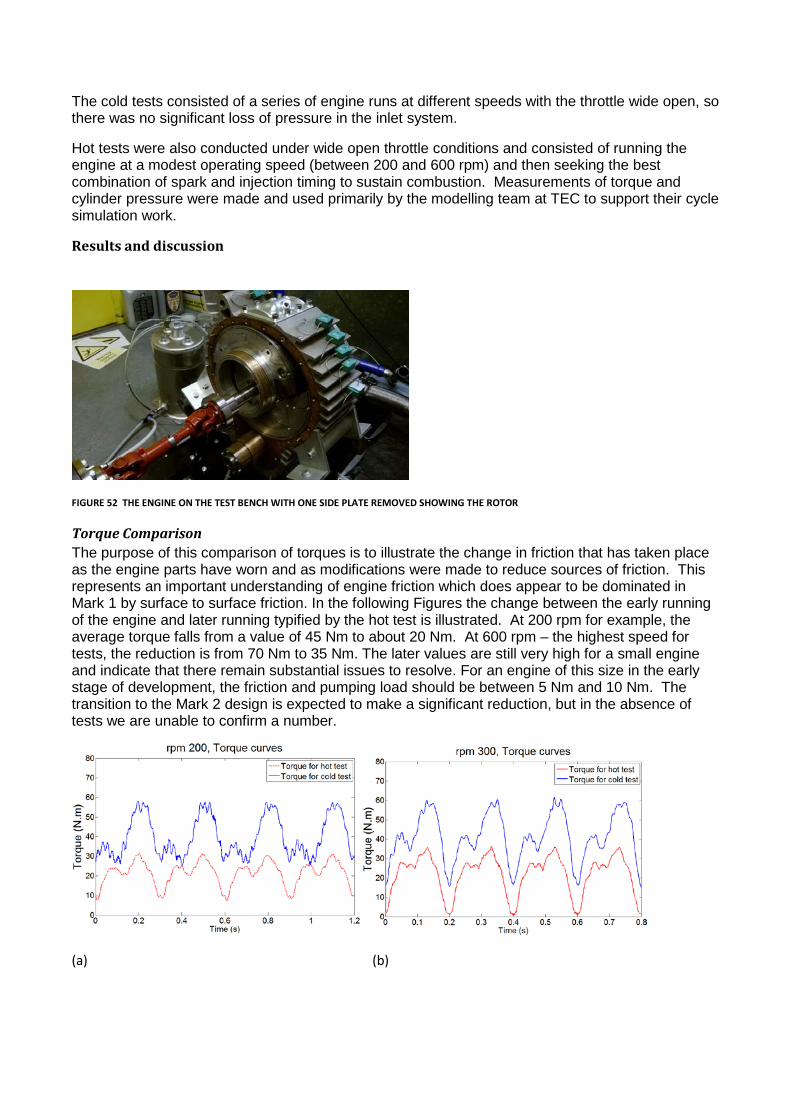
The cold tests consisted of a series of engine runs at different speeds with the throttle wide open, so there was no significant loss of pressure in the inlet system.
Hot tests were also conducted under wide open throttle conditions and consisted of running the engine at a modest operating speed (between 200 and 600 rpm) and then seeking the best combination of spark and injection timing to sustain combustion. Measurements of torque and cylinder pressure were made and used primarily by the modelling team at TEC to support their cycle simulation work.
Results and discussion
FIGURE 52 THE ENGINE ON THE TEST BENCH WITH ONE SIDE PLATE REMOVED SHOWING THE ROTOR
Torque Comparison The purpose of this comparison of torques is to illustrate the change in friction that has taken place as the engine parts have worn and as modifications were made to reduce sources of friction. This represents an important understanding of engine friction which does appear to be dominated in Mark 1 by surface to surface friction. In the following Figures the change between the early running of the engine and later running typified by the hot test is illustrated. At 200 rpm for example, the average torque falls from a value of 45 Nm to about 20 Nm. At 600 rpm – the highest speed for tests, the reduction is from 70 Nm to 35 Nm. The later values are still very high for a small engine and indicate that there remain substantial issues to resolve. For an engine of this size in the early stage of development, the friction and pumping load should be between 5 Nm and 10 Nm. The transition to the Mark 2 design is expected to make a significant reduction, but in the absence of tests we are unable to confirm a number.
(a) (b)
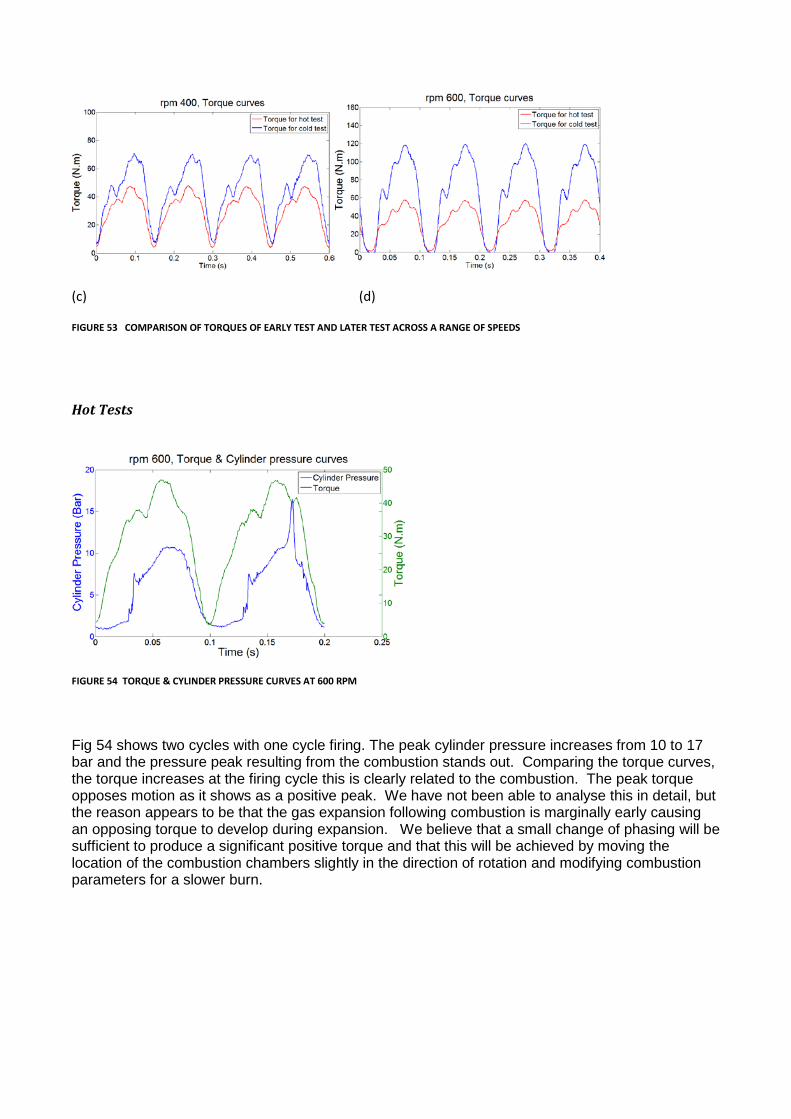
(c) (d)
FIGURE 53 COMPARISON OF TORQUES OF EARLY TEST AND LATER TEST ACROSS A RANGE OF SPEEDS
Hot Tests
FIGURE 54 TORQUE & CYLINDER PRESSURE CURVES AT 600 RPM
Fig 54 shows two cycles with one cycle firing. The peak cylinder pressure increases from 10 to 17 bar and the pressure peak resulting from the combustion stands out. Comparing the torque curves, the torque increases at the firing cycle this is clearly related to the combustion. The peak torque opposes motion as it shows as a positive peak. We have not been able to analyse this in detail, but the reason appears to be that the gas expansion following combustion is marginally early causing an opposing torque to develop during expansion. We believe that a small change of phasing will be sufficient to produce a significant positive torque and that this will be achieved by moving the location of the combustion chambers slightly in the direction of rotation and modifying combustion parameters for a slower burn.

FIGURE 55 TORQUE CURVE FOR HOT TEST 3
Fig 55 shows the torque reduction as the engine runs in firing mode at 600 rpm over a period of about 3 minutes. We can see one of the defining characteristics of the engine – that of smooth operation with very little variation in torque. The torque output which is dominated still by friction is being modified by the combustion torque. The progressively increasing temperature causes the average torque to diminish from about 28 Nm to about 22 Nm over this period. Several factors contribute to this phenomenon. The main reason should be the reduced friction. The main moving parts can run in an improved configuration and the severe local friction is reduced and the lubrication condition improved as the engine warms up.
(a) Two adjacent cycles – both firing (b) A succession of cycles – one without combustion
FIGURE 56 TORQUE & CYLINDER PRESSURE CURVES AT 400 RPM
Figure 56 shows a short period of engine running at firing conditions at 400 rpm. The firing cycles show a consistent pressure while friction torque continues to dominate. Figure 57 shows in a greater degree of detail the evolution of torque at each of the three test speeds. The increase in torque appears linear with speed suggesting that conventional frictional forces are generating the majority of the friction load. It appears from this Figure that inertia loads, while significant do not increase as rapidly as anticipated with the increase in engine speed. This is a good indication for the Mark 2 – in that the substantial reduction of inertia loads that will result from this new design may be well be sufficient to give the engine a self-running capability.
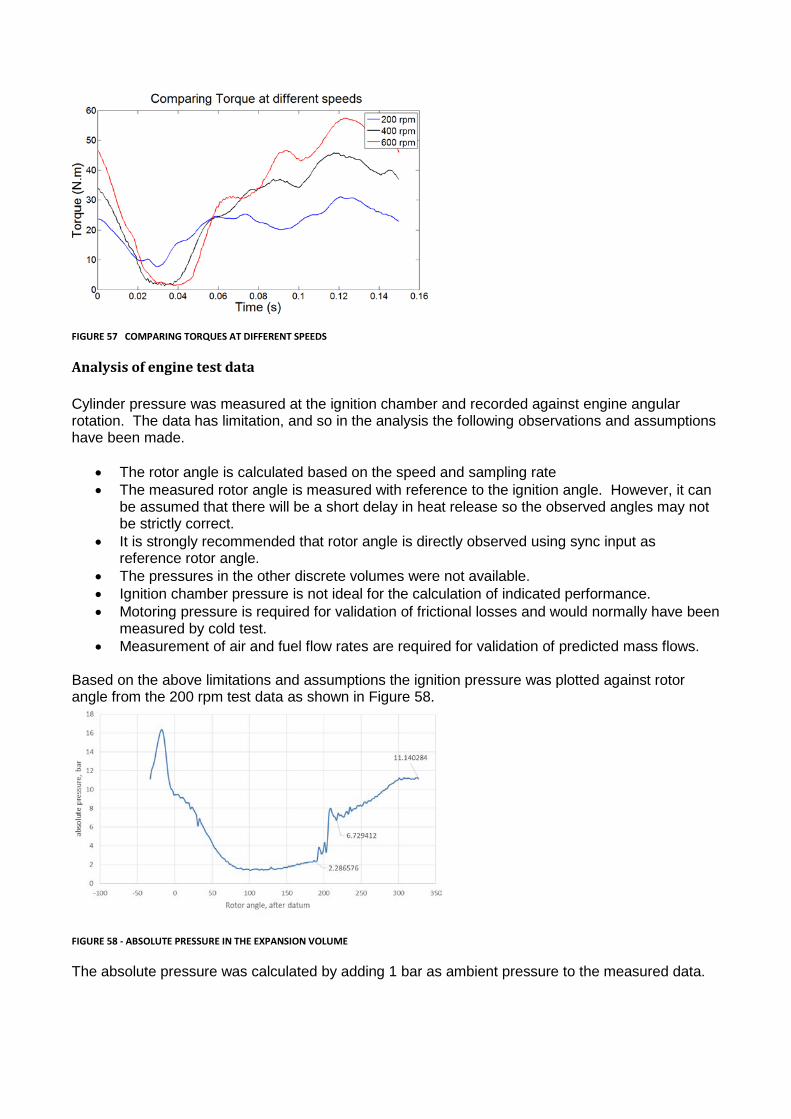
FIGURE 57 COMPARING TORQUES AT DIFFERENT SPEEDS
Analysis of engine test data Cylinder pressure was measured at the ignition chamber and recorded against engine angular rotation. The data has limitation, and so in the analysis the following observations and assumptions have been made.
• The rotor angle is calculated based on the speed and sampling rate • The measured rotor angle is measured with reference to the ignition angle. However, it can
be assumed that there will be a short delay in heat release so the observed angles may not be strictly correct.
• It is strongly recommended that rotor angle is directly observed using sync input as reference rotor angle.
• The pressures in the other discrete volumes were not available. • Ignition chamber pressure is not ideal for the calculation of indicated performance. • Motoring pressure is required for validation of frictional losses and would normally have been
measured by cold test. • Measurement of air and fuel flow rates are required for validation of predicted mass flows.
Based on the above limitations and assumptions the ignition pressure was plotted against rotor angle from the 200 rpm test data as shown in Figure 58.
FIGURE 58 - ABSOLUTE PRESSURE IN THE EXPANSION VOLUME
The absolute pressure was calculated by adding 1 bar as ambient pressure to the measured data.

The first point to note from this diagram is that the fixed pressure sensor in the ignition chamber is exposed to different volumes as the cycle progresses:
• At the start of the trace (around -33 degrees), the sensor is in the expansion volume and the spark plug fires. The pressure increases to a maximum of just over 16 bar and the expansion phase of the cycle begins and continues to the point where the exhaust port is exposed and the exhaust phase begins. This is at about +130 degrees. The expansion phase continues to approximately +180, when the absolute pressure is 2.29 bar.
• At this point, the compression rotor begins to expose the ignition chamber to the compression chamber and this occurs towards the end of the first stage compression. Once the compression rotor tip passes the second port to the ignition chamber, the sensor sees only the compression volume and 2nd stage compression begins, increasing the pressure from 2.29 bar absolute at the beginning of scavenge to 6.7 bar at around +220 degrees, the end of the first stage compression. (Note that first stage compression starts at +80 but is not visible to the pressure sensor until +180 degrees)
• From this point, the sensor experiences second stage compression until the power rotor tip passes the ignition chamber on its next revolution (the end of the trace). The absolute pressure at this point is about 11 bar.
It was noted that, while the measured compression pressure reached 6.73 bar at the start of the second stage compression (217⁰ rotor angle) which implies a compression ratio of 2.9:1 from 181⁰ to 217⁰, the volumes derived from CAD input data give a compression ratio of 1.25:1 between these two angles.
The second stage of compression of 11.14 bar as measured shows a compression ratio of 1.65:1 during second stage of compression but the volumes from the CAD data suggest a compression ratio of about 9:1 during the second stage of compression.
The flat region at the end of the compression phase is obviously due to leakages which need to be addressed by the next version design of the engine.
These test results clearly show that the volumes taken from CAD data are not compatible with the pressures measured.
The engine geometry that was used originally was based on the volume tables generated for the concept engine. However, it is recognized that the as-built engine that was tested had been significantly changed in terms of its internal geometry. The volume diagrams derived from the original data have therefore been modified to give predicted pressures which more closely match the measured test data.
These changes have been applied only in periods that either the compression or the expansion chamber is connected to ignition chamber since these are the only parts of the cycle for which the pressure sensor gathers data under the present test bed arrangement. The modified volumes are shown in following figures:
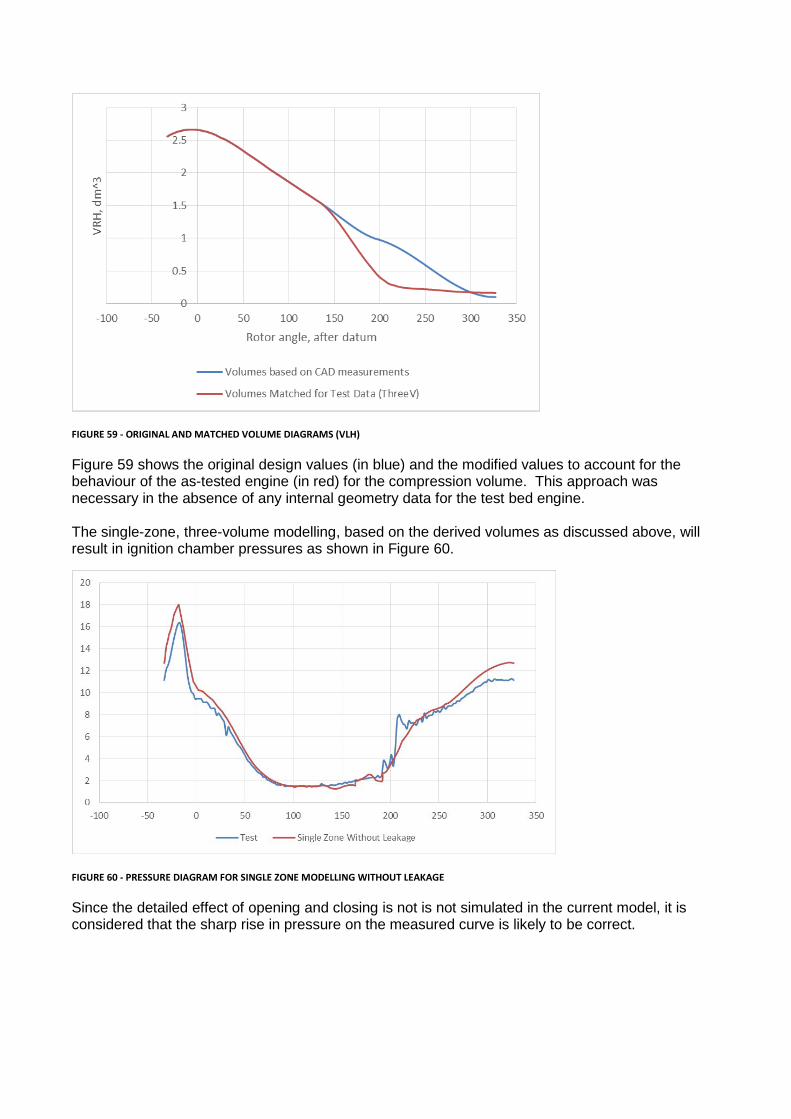
FIGURE 59 - ORIGINAL AND MATCHED VOLUME DIAGRAMS (VLH)
Figure 59 shows the original design values (in blue) and the modified values to account for the behaviour of the as-tested engine (in red) for the compression volume. This approach was necessary in the absence of any internal geometry data for the test bed engine. The single-zone, three-volume modelling, based on the derived volumes as discussed above, will result in ignition chamber pressures as shown in Figure 60.
FIGURE 60 - PRESSURE DIAGRAM FOR SINGLE ZONE MODELLING WITHOUT LEAKAGE
Since the detailed effect of opening and closing is not is not simulated in the current model, it is considered that the sharp rise in pressure on the measured curve is likely to be correct.

FIGURE 61 – PRESSURE CURVE FOR SINGLE ZONE MODEL WITH LEAKAGE
FIGURE 62– PRESSURE CURVE FOR SINGLE ZONE MODEL WITHOUT LEAKAGE
Figures 61 and 62 respectively show the effect of modelling leakage.
Discussion of test results For a number of reasons, the engine on test was unable to deliver the project rating of 25 kW (brake output) at 3000 r/min. As previously reported, many of the difficulties arose in the earlier stages of manufacturing and, as a consequence, the test programme could not be held to schedule. These delays, together with structural issues with the slider, meant that it was possible to test the engine at speeds up to 600 r/min. Given the limited time available the analysis time was focussed on simulating performance at the lowest speed test because experience suggested that 200 r/min was the most sensitive engine speed. If operation at this speed, where the engine is most sensitive in terms of performance, could

be simulated satisfactorily, it is anticipated that modelling higher speed performance would present fewer problems. Since the behaviour of the Libralato engine as tested was successfully modelled at 200 r/min by the new LECS program, using input data from CFD, both the LECS software and the CFD model can reasonably be considered to have been validated to a considerable degree and can be used further to investigate increases in power output for the Libralato engine or for other designs. Concerning the thermodynamic simulation and analysis:
1. Any model can only be as good as the data on which it is based. For example, volumes, events and flow areas must be verified prior to simulation if reliance is to be placed on the simulated output. Only then should parametric studies be carried out.
2. Because of the unique characteristics and behaviour of the Libralato concept, it is particularly important that the volumes of central intake, compression and expansion and ignition chambers.
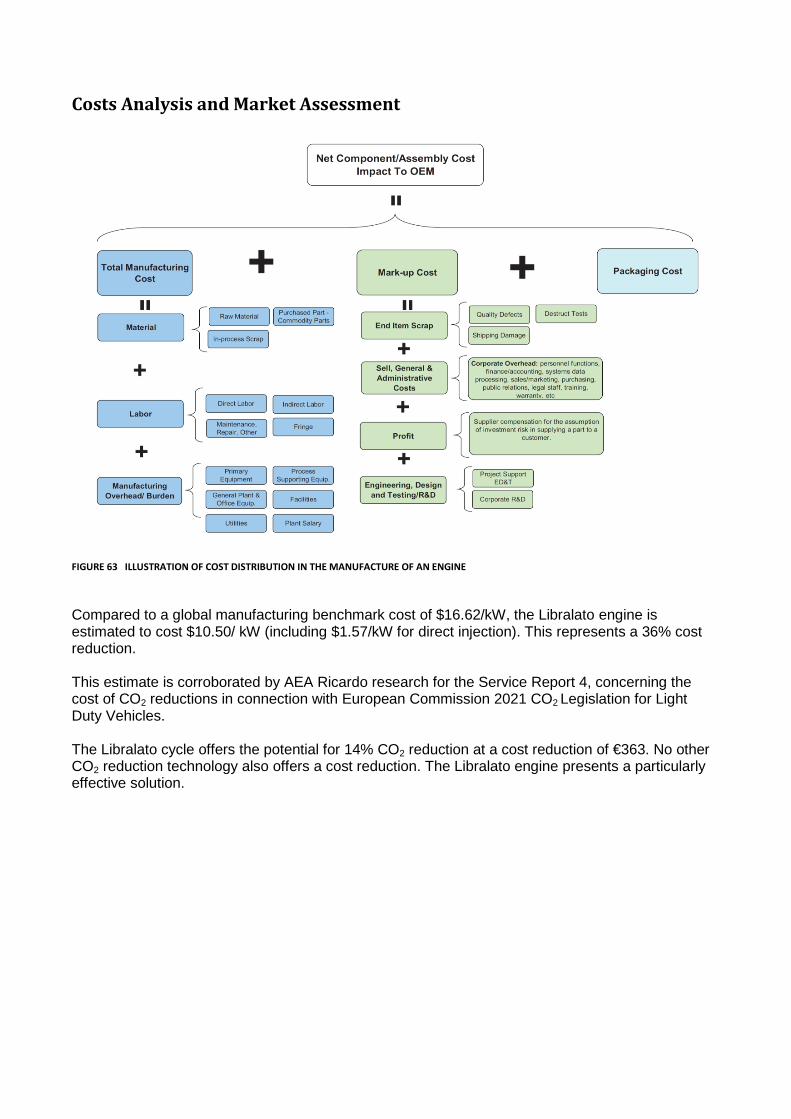
Costs Analysis and Market Assessment
FIGURE 63 ILLUSTRATION OF COST DISTRIBUTION IN THE MANUFACTURE OF AN ENGINE
Compared to a global manufacturing benchmark cost of $16.62/kW, the Libralato engine is estimated to cost $10.50/ kW (including $1.57/kW for direct injection). This represents a 36% cost reduction. This estimate is corroborated by AEA Ricardo research for the Service Report 4, concerning the cost of CO2 reductions in connection with European Commission 2021 CO2 Legislation for Light Duty Vehicles. The Libralato cycle offers the potential for 14% CO2 reduction at a cost reduction of €363. No other CO2 reduction technology also offers a cost reduction. The Libralato engine presents a particularly effective solution.
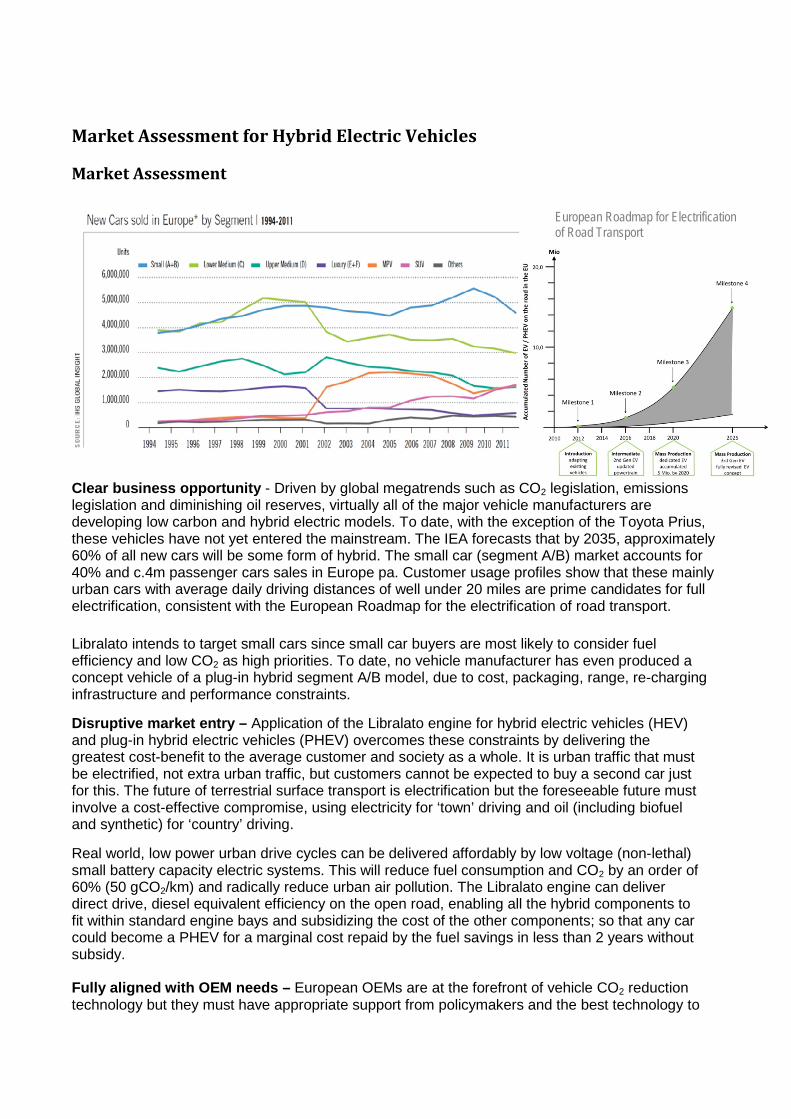
Market Assessment for Hybrid Electric Vehicles
Market Assessment
Clear business opportunity - Driven by global megatrends such as CO2 legislation, emissions legislation and diminishing oil reserves, virtually all of the major vehicle manufacturers are developing low carbon and hybrid electric models. To date, with the exception of the Toyota Prius, these vehicles have not yet entered the mainstream. The IEA forecasts that by 2035, approximately 60% of all new cars will be some form of hybrid. The small car (segment A/B) market accounts for 40% and c.4m passenger cars sales in Europe pa. Customer usage profiles show that these mainly urban cars with average daily driving distances of well under 20 miles are prime candidates for full electrification, consistent with the European Roadmap for the electrification of road transport. Libralato intends to target small cars since small car buyers are most likely to consider fuel efficiency and low CO2 as high priorities. To date, no vehicle manufacturer has even produced a concept vehicle of a plug-in hybrid segment A/B model, due to cost, packaging, range, re-charging infrastructure and performance constraints. Disruptive market entry – Application of the Libralato engine for hybrid electric vehicles (HEV) and plug-in hybrid electric vehicles (PHEV) overcomes these constraints by delivering the greatest cost-benefit to the average customer and society as a whole. It is urban traffic that must be electrified, not extra urban traffic, but customers cannot be expected to buy a second car just for this. The future of terrestrial surface transport is electrification but the foreseeable future must involve a cost-effective compromise, using electricity for ‘town’ driving and oil (including biofuel and synthetic) for ‘country’ driving. Real world, low power urban drive cycles can be delivered affordably by low voltage (non-lethal) small battery capacity electric systems. This will reduce fuel consumption and CO2 by an order of 60% (50 gCO2/km) and radically reduce urban air pollution. The Libralato engine can deliver direct drive, diesel equivalent efficiency on the open road, enabling all the hybrid components to fit within standard engine bays and subsidizing the cost of the other components; so that any car could become a PHEV for a marginal cost repaid by the fuel savings in less than 2 years without subsidy. Fully aligned with OEM needs – European OEMs are at the forefront of vehicle CO2 reduction technology but they must have appropriate support from policymakers and the best technology to
European Roadmap for Electrification of Road Transport

be successful in this highly competitive landscape. By comparison, the United States programmes for automotive technologies invest more than $500m (~€370m) per year, in addition to the ongoing $2.8bn (~€2.1bn) initiative to support industry in the crisis package introduced in 2009‐10. China has recently announced an RMB100bn (~€11bn) package of investment over ten years for new energy vehicles. EU legislation sets mandatory emission reduction targets for new cars to improve fuel economy and improve air quality. The fleet average to be achieved by all cars is 130gCO2/Km by 2015 (Euro 6) and 95g/Km by 2021 (Euro 7). The proportion of diesel engine passenger vehicles in Europe has reached over 50% in the last decade. However given the unsafe levels of diesel particulates in Europe and the fact that diesel particulates are now known to definitely cause cancer, this may change policy approaches and customer perceptions towards diesel engine vehicles. Diesel fuel could lose its current tax advantage in most of continental Europe and the Euro 6 and 7 emissions regulations are likely to require more expensive exhaust after-treatment technology. For these reasons, it is expected by the end of the decade diesel engines will begin to lose their dominance. The Libralato engine has the potential to gain market leadership in a new generation of gasoline hybrid electric vehicles because it enables the delivery of the no.1 priority of the European Transport White paper - achieve CO2 free urban [traffic] by 2030 - in a way that the average customer can afford without government subsidy. These unique selling points cannot be matched by conventional reciprocating engines and will be particularly attractive to European manufacturers since cars with emissions of <50g CO2/km qualify for ‘super credits’ counting as 2 cars towards fleet averages.
Conclusions and Observations The Libralato Engine remains at an early stage of its development and remains unproven in terms of fuel economy and emissions. However there have been a number of significant steps taken in this project that that represent the acquisition of new knowledge or the establishment of important aspects of the Libralato concept: • The engine design has been captured in the context of a modern CAE representation from which
manufacture is possible and in which tolerancing appropriate to an engine concept is included.
• The Mark 1 concept has been demonstrated to have a number of flaws which have been largely corrected by a reduction in the engine size and the inclusion of rolling element bearings. The resulting Mark 2 design would be implemented as a three rotor solution.
• A test facility for the Mark 1 engine proved to capable to support the basic operation of the Mark 1 design including a complex operating mode which required phasing of the exhaust valve and the high pressure fuel pump. This test design is unique in being to support the continuing development of the Libralato engine. Air flow measurement and emissions measurement for the exhaust flow were both in place for testing – but the status of the Mark 1 design was not sufficiently advanced.
• Test of the Mark 1 engine demonstrated that combustion supported by high pressure direct fuel injection of liquid fuel was possible. The control system is essential to maintain the coordination of fuel supply pressure and engine events. Combustion pressure measurements indicated that a reliable and stable combustion could be maintained even at low engine speeds – and this aspect of the engine’s operation is most encouraging.
• The phasing of combustion remains uncertain. The dynamic analysis based on the CAE model and the ADAMS dynamics analysis code suggests a positive torque following a normal combustion cycle. However during tests the developed torque was found to be negative. It appears that the development of torque is particularly sensitive to the phasing of combustion. This situation is analogous to what is found in a conventional internal combustion engine and will require a detailed investigation of phasing with a view to changing the combustion process timing and potentially the design of the combustion chamber.
• The Mark 2 design is complete and the manufacturing of parts had begun at the formal conclusion of the project. All other aspects of the project were prepared. The test rig had been designed to be able to accommodate the new engine, and the control system was in a state to run the engine with only minor adaptation of the control parameters required.
• A CFD process for understanding air motion in the engine during the compression process was identified and demonstrated high speed air flow in the combustion chamber. The intensity of flow is such that a review of the combustion chamber design is warranted.
One important lesson concerned the premise on which project was initiated. At the start of the project the inventor presented a CAE model that the team had confidently expected as the source of important design information. While the model was helpful it proved to be unable to support manufacturing because it was based on a number of manufacturing features that were not well matched to the manufacturing partner’s machine tools. At the start of the project too much time was spent on the manufacture of the first prototype and discussions about topics that were at that stage of the project unresolvable. It needed to first prototype manufactured in order to make the sensible decisions about where to proceed with the later designs.

Future Work
Mark 1 engine tests The UK Company, Engine Developments Ltd has made modifications to the Mark 1 engine to correct for the out of balance forces. Testing is currently scheduled at the Loughborough test facility under a new contract to conduct further tests to assess behaviour of the engine at higher speeds.
Mark 2 engine The first Mark 2 engine has been substantially been manufactured and the supply of bearings agreed with the supplier Schaeffler. The preparation of the engine would require 1-2 months of work before tests could be conducted. This is a clear next step in the development of the engine.
CFD analysis of internal engine conditions The next step would be to introduce turbulence modelling through higher order models such as Large Eddy Simulation (LES). There is also the potential to study multiphase flows, important for analysing the mixing of fuel with air in the combustion chamber for maximum efficiency or in order to achieve specified combustion goals.
Design of the Mark 3 version of the engine During the design process, we have already identified where even the new Mark 2 design could be improved. For example, in Mark 2 design, the air flow into the engine may be not enough for the combustion. Therefore a major design change could be made where air is introduced directly in to the compression chamber. Alternatively pressurised air could be introduced into the existing intake in the Mark 3 design. The combustion process needs to be properly considered in the new design with a more ordered pattern of air motion – with a degree of control over the motion air about a vertical axis. Combustion phasing remains a significant concern.
The slider remains a risk – subject to high forces and as a reciprocating device, difficult to lubricate. For the Mark 3 design a rolling element bearing for the slider is needed that further simplifying the lubrication function (although lubricant will still be needed for cooling).
The discussion of Mark 3 suggests that Mark 3 is developed as a development benchmark – allowing emissions and friction to be brought to acceptably low level. The step to Mark 4 is then one of controlling costs and making design changes to keep costs to a target level while retaining the fuel economy and emissions performance.

Use and dissemination of foreground
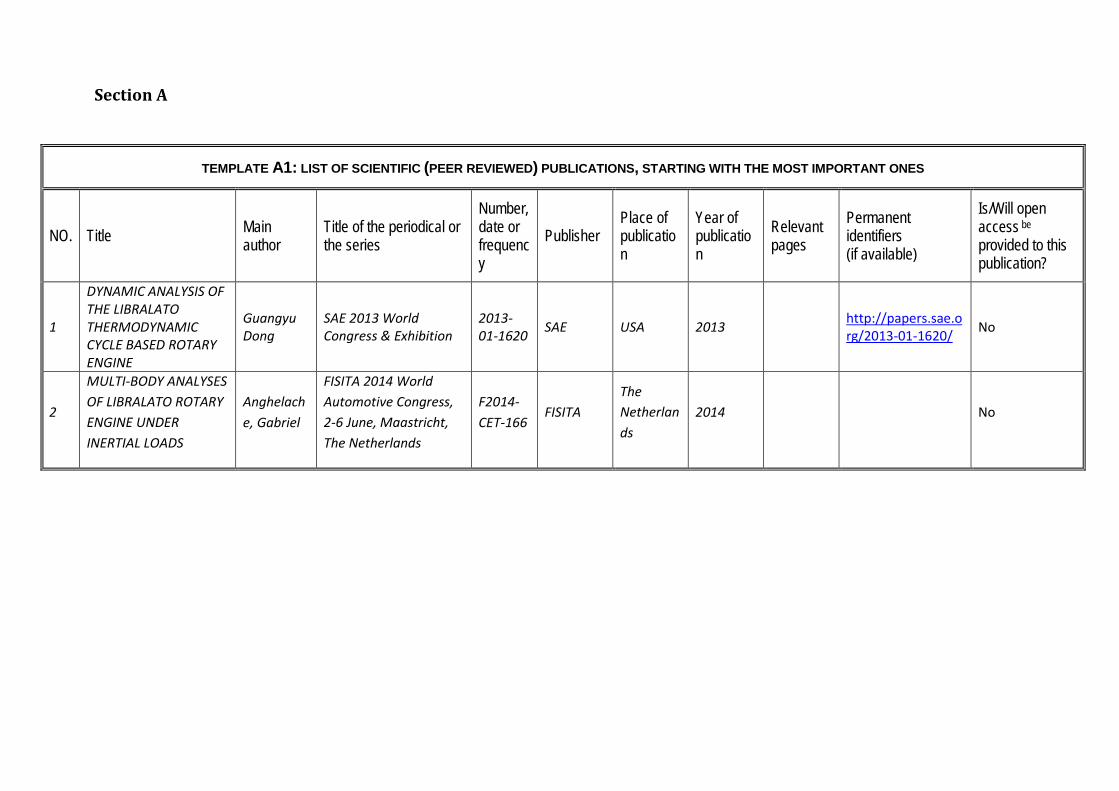
Section A
TEMPLATE A1: LIST OF SCIENTIFIC (PEER REVIEWED) PUBLICATIONS, STARTING WITH THE MOST IMPORTANT ONES
NO. Title Main author
Title of the periodical or the series
Number, date or frequency
Publisher Place of publication
Year of publication
Relevant pages
Permanent identifiers (if available)
Is/Will open access be provided to this publication?
1
DYNAMIC ANALYSIS OF THE LIBRALATO THERMODYNAMIC CYCLE BASED ROTARY ENGINE
Guangyu Dong
SAE 2013 World Congress & Exhibition
2013-01-1620 SAE USA 2013 http://papers.sae.o
rg/2013-01-1620/ No
2
MULTI-BODY ANALYSES OF LIBRALATO ROTARY ENGINE UNDER INERTIAL LOADS
Anghelache, Gabriel
FISITA 2014 World Automotive Congress, 2-6 June, Maastricht, The Netherlands
F2014-CET-166
FISITA The Netherlands
2014 No
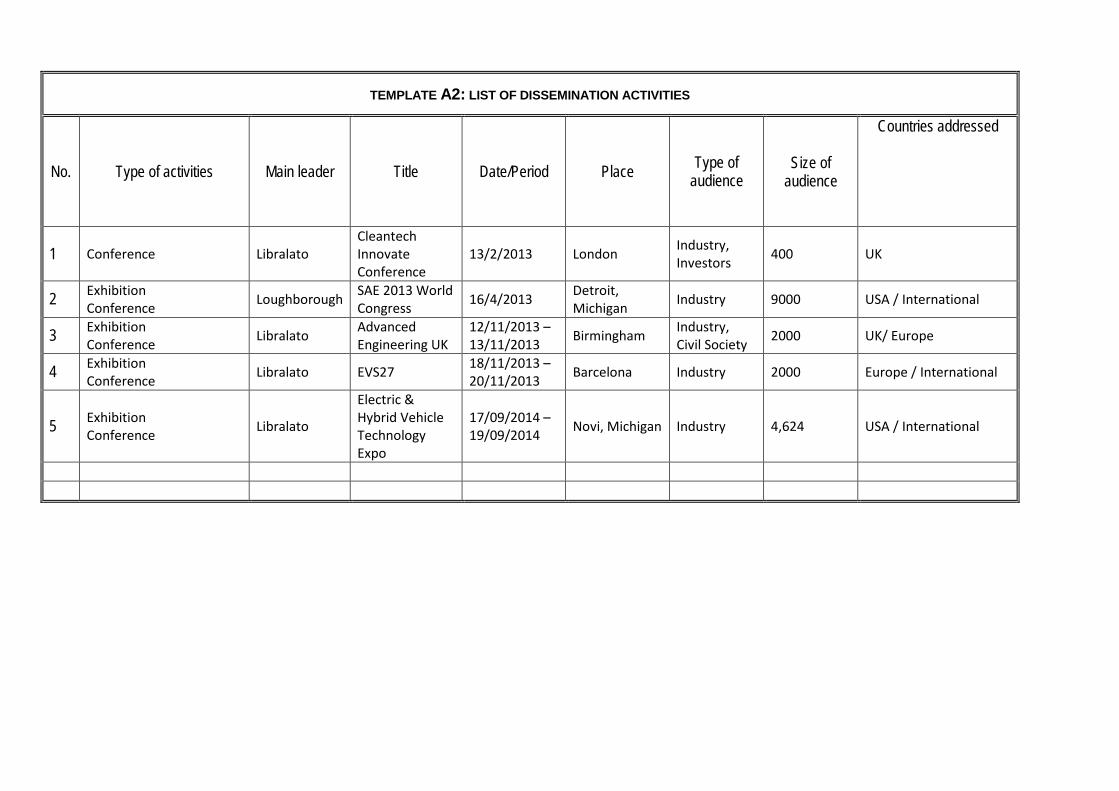
TEMPLATE A2: LIST OF DISSEMINATION ACTIVITIES
No. Type of activities Main leader Title Date/Period Place Type of audience
Size of audience
Countries addressed
1 Conference Libralato Cleantech Innovate Conference
13/2/2013 London Industry, Investors 400 UK
2 Exhibition Conference Loughborough SAE 2013 World
Congress 16/4/2013 Detroit, Michigan Industry 9000 USA / International
3 Exhibition Conference Libralato Advanced
Engineering UK 12/11/2013 – 13/11/2013 Birmingham Industry,
Civil Society 2000 UK/ Europe
4 Exhibition Conference Libralato EVS27 18/11/2013 –
20/11/2013 Barcelona Industry 2000 Europe / International
5 Exhibition Conference Libralato
Electric & Hybrid Vehicle Technology Expo
17/09/2014 – 19/09/2014 Novi, Michigan Industry 4,624 USA / International
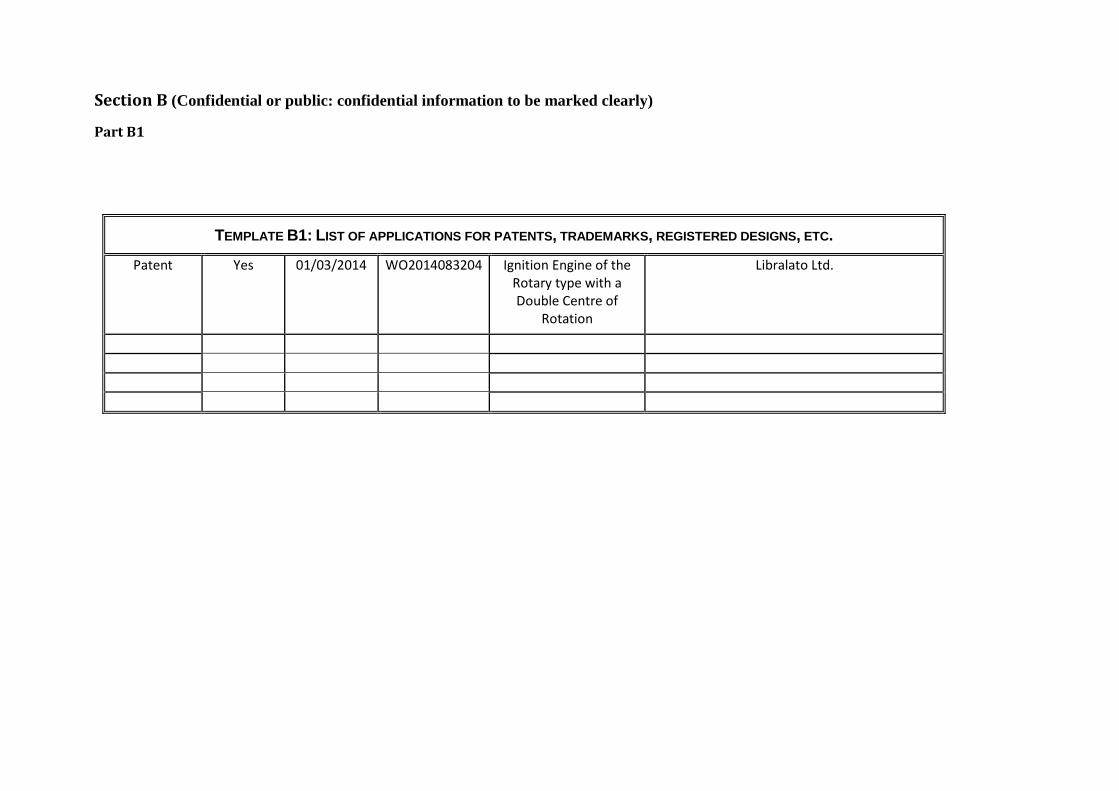
Section B (Confidential or public: confidential information to be marked clearly)
Part B1
TEMPLATE B1: LIST OF APPLICATIONS FOR PATENTS, TRADEMARKS, REGISTERED DESIGNS, ETC.
Patent Yes 01/03/2014 WO2014083204 Ignition Engine of the Rotary type with a Double Centre of
Rotation
Libralato Ltd.

Part B2
Type of Exploitable Foreground
Description of
exploitable foreground
Confidential Click on YES/NO
Foreseen embargo
date dd/mm/yyyy
Exploitable product(s) or measure(s)
Sector(s) of application
Timetable, commercial or any other use
Patents or other IPR exploitation (licences)
Owner & Other Beneficiary(s) involved
Commercial exploitation of R&D results
Libralato engine mechanical design / thermodynamic cycle
YES
05/06/14
Hybrid vehicles Direct drive vehicles
1. Road 2. Industrial 3. Marine
2017 2017 2017
Current patents: EP1540139B1 WO2014083204
Libralato Ltd. (owner) Tata Steel Productiv Ltd. ACEA members Mahindra & Mahindra
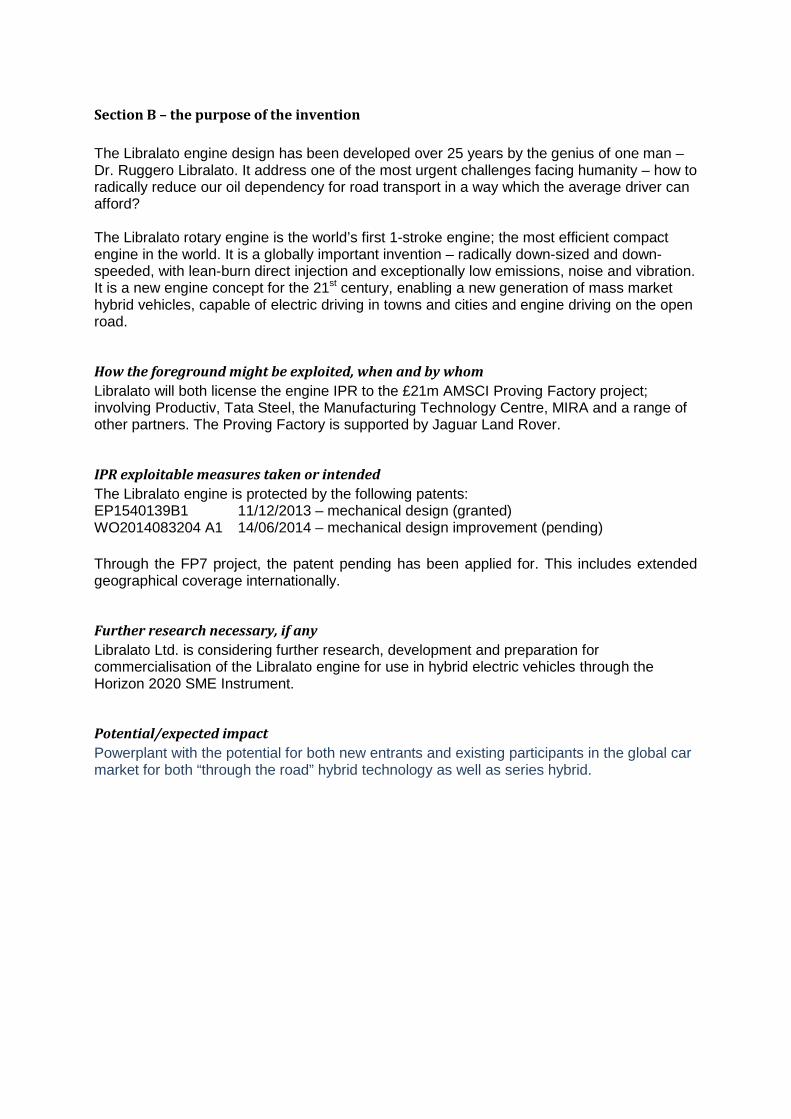
Section B – the purpose of the invention The Libralato engine design has been developed over 25 years by the genius of one man – Dr. Ruggero Libralato. It address one of the most urgent challenges facing humanity – how to radically reduce our oil dependency for road transport in a way which the average driver can afford? The Libralato rotary engine is the world’s first 1-stroke engine; the most efficient compact engine in the world. It is a globally important invention – radically down-sized and down-speeded, with lean-burn direct injection and exceptionally low emissions, noise and vibration. It is a new engine concept for the 21st century, enabling a new generation of mass market hybrid vehicles, capable of electric driving in towns and cities and engine driving on the open road.
How the foreground might be exploited, when and by whom Libralato will both license the engine IPR to the £21m AMSCI Proving Factory project; involving Productiv, Tata Steel, the Manufacturing Technology Centre, MIRA and a range of other partners. The Proving Factory is supported by Jaguar Land Rover.
IPR exploitable measures taken or intended The Libralato engine is protected by the following patents: EP1540139B1 11/12/2013 – mechanical design (granted) WO2014083204 A1 14/06/2014 – mechanical design improvement (pending) Through the FP7 project, the patent pending has been applied for. This includes extended geographical coverage internationally.
Further research necessary, if any Libralato Ltd. is considering further research, development and preparation for commercialisation of the Libralato engine for use in hybrid electric vehicles through the Horizon 2020 SME Instrument.
Potential/expected impact Powerplant with the potential for both new entrants and existing participants in the global car market for both “through the road” hybrid technology as well as series hybrid.
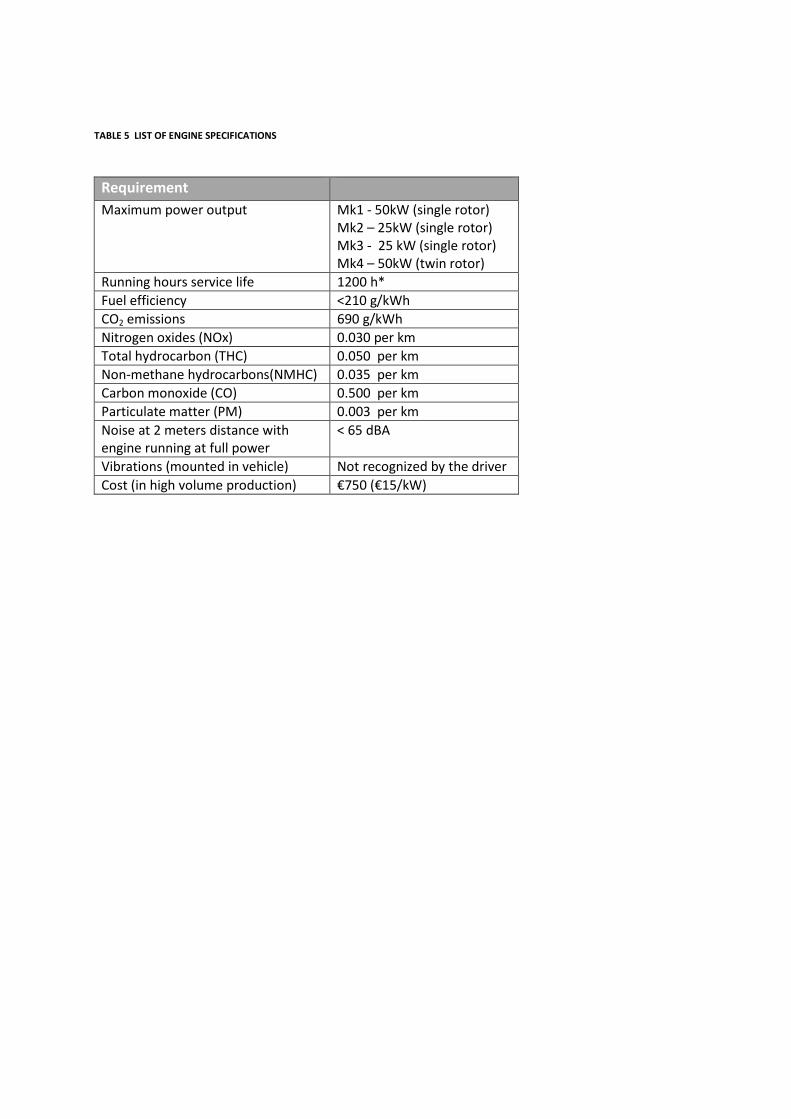
TABLE 5 LIST OF ENGINE SPECIFICATIONS
Requirement Maximum power output Mk1 - 50kW (single rotor)
Mk2 – 25kW (single rotor) Mk3 - 25 kW (single rotor) Mk4 – 50kW (twin rotor)
Running hours service life 1200 h* Fuel efficiency <210 g/kWh CO2 emissions 690 g/kWh Nitrogen oxides (NOx) 0.030 per km Total hydrocarbon (THC) 0.050 per km Non-methane hydrocarbons(NMHC) 0.035 per km Carbon monoxide (CO) 0.500 per km Particulate matter (PM) 0.003 per km Noise at 2 meters distance with engine running at full power
< 65 dBA
Vibrations (mounted in vehicle) Not recognized by the driver Cost (in high volume production) €750 (€15/kW)
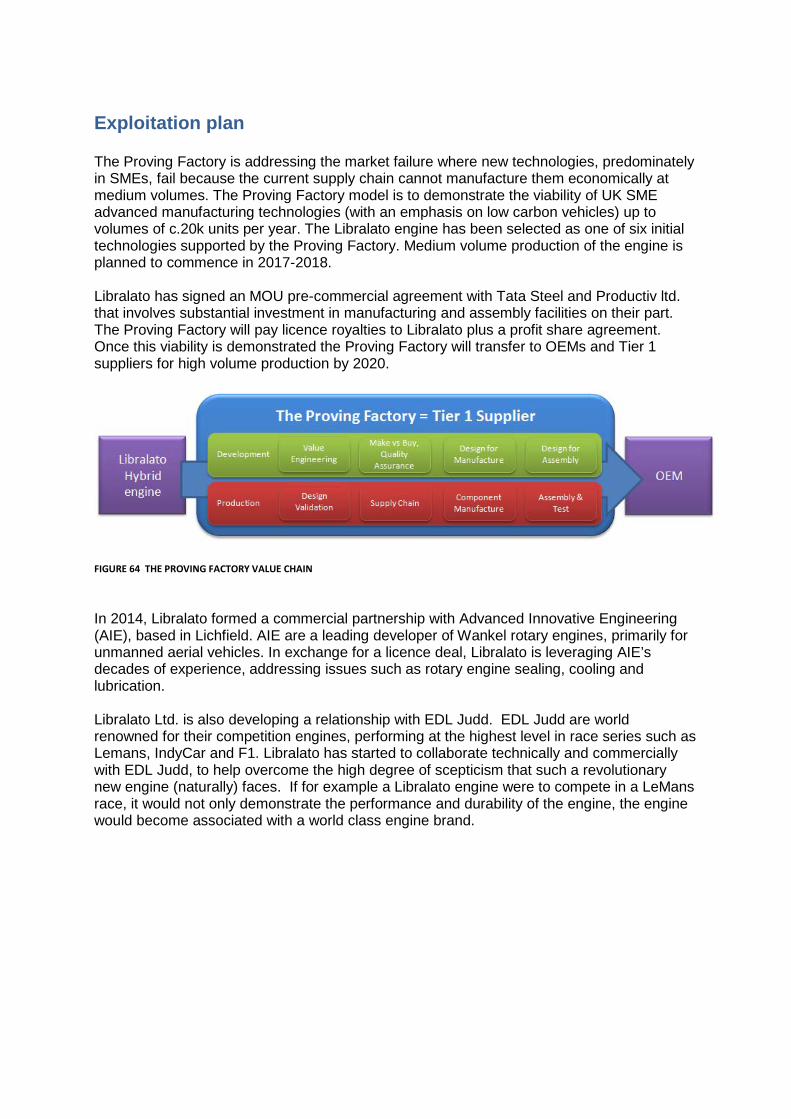
Exploitation plan The Proving Factory is addressing the market failure where new technologies, predominately in SMEs, fail because the current supply chain cannot manufacture them economically at medium volumes. The Proving Factory model is to demonstrate the viability of UK SME advanced manufacturing technologies (with an emphasis on low carbon vehicles) up to volumes of c.20k units per year. The Libralato engine has been selected as one of six initial technologies supported by the Proving Factory. Medium volume production of the engine is planned to commence in 2017-2018. Libralato has signed an MOU pre-commercial agreement with Tata Steel and Productiv ltd. that involves substantial investment in manufacturing and assembly facilities on their part. The Proving Factory will pay licence royalties to Libralato plus a profit share agreement. Once this viability is demonstrated the Proving Factory will transfer to OEMs and Tier 1 suppliers for high volume production by 2020.
FIGURE 64 THE PROVING FACTORY VALUE CHAIN
In 2014, Libralato formed a commercial partnership with Advanced Innovative Engineering (AIE), based in Lichfield. AIE are a leading developer of Wankel rotary engines, primarily for unmanned aerial vehicles. In exchange for a licence deal, Libralato is leveraging AIE’s decades of experience, addressing issues such as rotary engine sealing, cooling and lubrication. Libralato Ltd. is also developing a relationship with EDL Judd. EDL Judd are world renowned for their competition engines, performing at the highest level in race series such as Lemans, IndyCar and F1. Libralato has started to collaborate technically and commercially with EDL Judd, to help overcome the high degree of scepticism that such a revolutionary new engine (naturally) faces. If for example a Libralato engine were to compete in a LeMans race, it would not only demonstrate the performance and durability of the engine, the engine would become associated with a world class engine brand.

TABLE 6 SUMMARY OF THE PROGRESSION OF THE LIBRALATO ENGINE TECHNOLOGY
Libralato Engine Product Development & Production Time-scale
TRL
Technology Readiness MRL
Manufacturing Readiness
2014 FP7 project produced and tested Mk1 prototype
4 • The technology component and/or basic subsystem have been validated in the laboratory or test house environment.
• Requirements and interactions with relevant vehicle systems have been determined.
2 • Manufacturing concepts and feasibility have been determined and processes have been identified.
• Producibility assessments are underway and include advanced design for manufacturing considerations.
2015 TC48 project producing Mk3 prototype. Proving Factory undertaking Design for Manufacture and Assembly assessment.
5 • The technology component and/or basic subsystem have been validated in relevant environment, potentially through a mule or adapted current production vehicle.
• Basic technological components are integrated with reasonably realistic supporting elements so that the technology can be tested with equipment that can simulate and validate all system specifications within a laboratory, test house or test track setting with integrated components
• Design rules have been established. • Performance results demonstrate the
viability of the technology and confidence to select it for new vehicle programme consideration.
3 • A manufacturing proof-of-concept has been developed
• Analytical or laboratory experiments validate paper studies.
• Experimental hardware or processes have been created, but are not yet integrated or representative.
• Materials and/or processes have been characterised for manufacturability and availability.
• Initial manufacturing cost projections have been made.
• Supply chain requirements have been determined.
2016 TC48 demonstrator powertrain subjected to vehicle manufacturer validation testing. Proving Factory establishing series production capability.
6 • A model or prototype of the technology system or subsystem has been demonstrated as part of a vehicle that can simulate and validate all system specifications within a test house, test track or similar operational environment.
• Performance results validate the technology’s viability for a specific vehicle class.
4 • Series production requirements, such as in manufacturing technology development, have been identified.
• Processes to ensure manufacturability, producibility and quality are in place and are sufficient to produce demonstrators.
• Manufacturing risks have been identified for prototype build.
• Cost drivers have been confirmed. • Design concepts have been optimised
for production. • APQP processes have been scoped
and are initiated. 2017 OEM development contract followed by fleet testing. Start of specific vehicle development programme(s). Proving Factory opens.
7 • Multiple prototypes have been demonstrated in an operational, on-vehicle environment.
• The technology performs as required. • Limit testing and ultimate
performance characteristics are now determined.
• The technology is suitable to be incorporated into specific vehicle platform development programmes.
5 • Capability exists to produce prototype components in a production relevant environment.
• Critical technologies and components have been identified.
• Prototype materials, tooling and test equipment, as well as personnel skills have been demonstrated with components in a production relevant environment.
• FMEA and DFMA have been initiated.
2018 Libralato engine for hybrid electric vehicles production ready. Proving Factory production capable.
8 • Test and demonstration phases have been completed to customer’s satisfaction.
• The technology has been proven to work in its final form and under expected conditions.
• Performance has been validated, and confirmed.
6 • Capability exists to produce integrated system in a production relevant environment.
• The majority of manufacturing processes have been defined and characterised.
• Preliminary design of critical components has been completed.
• Prototype materials, tooling and test equipment, as well as personnel skills have been demonstrated on subsystems/ systems
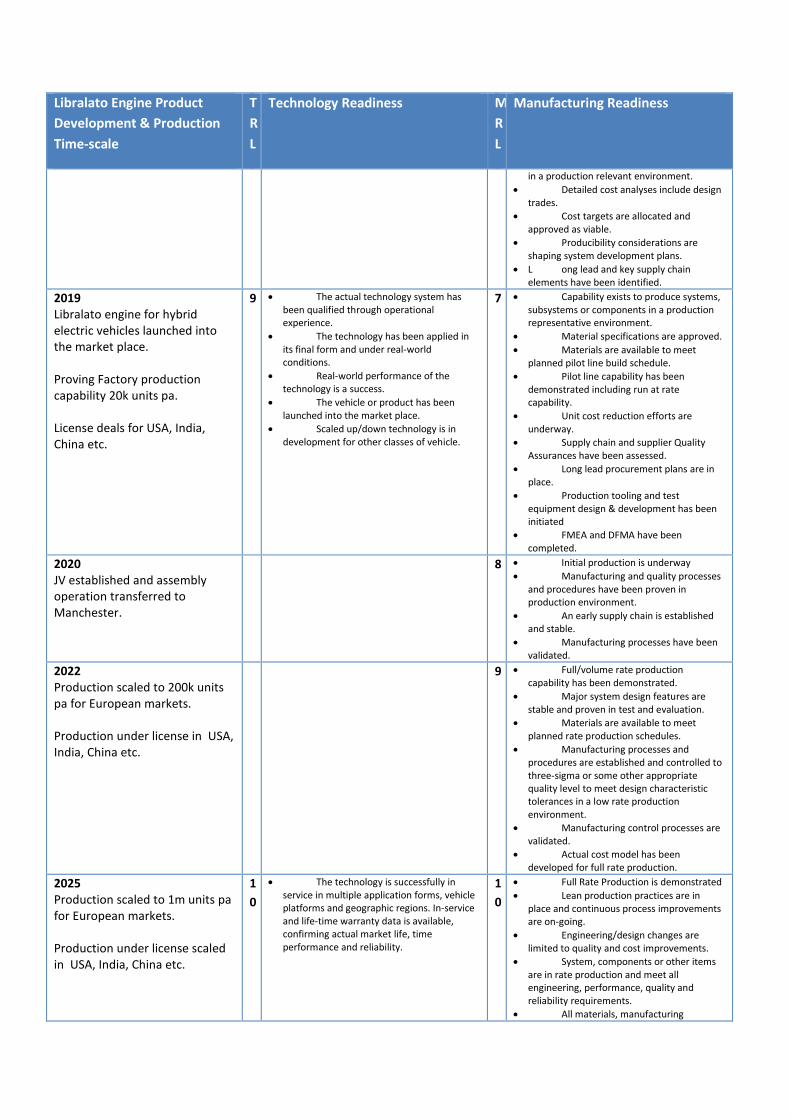
Libralato Engine Product Development & Production Time-scale
TRL
Technology Readiness MRL
Manufacturing Readiness
in a production relevant environment. • Detailed cost analyses include design
trades. • Cost targets are allocated and
approved as viable. • Producibility considerations are
shaping system development plans. • L ong lead and key supply chain
elements have been identified. 2019 Libralato engine for hybrid electric vehicles launched into the market place. Proving Factory production capability 20k units pa. License deals for USA, India, China etc.
9 • The actual technology system has been qualified through operational experience.
• The technology has been applied in its final form and under real-world conditions.
• Real-world performance of the technology is a success.
• The vehicle or product has been launched into the market place.
• Scaled up/down technology is in development for other classes of vehicle.
7 • Capability exists to produce systems, subsystems or components in a production representative environment.
• Material specifications are approved. • Materials are available to meet
planned pilot line build schedule. • Pilot line capability has been
demonstrated including run at rate capability.
• Unit cost reduction efforts are underway.
• Supply chain and supplier Quality Assurances have been assessed.
• Long lead procurement plans are in place.
• Production tooling and test equipment design & development has been initiated
• FMEA and DFMA have been completed.
2020 JV established and assembly operation transferred to Manchester.
8 • Initial production is underway • Manufacturing and quality processes
and procedures have been proven in production environment.
• An early supply chain is established and stable.
• Manufacturing processes have been validated.
2022 Production scaled to 200k units pa for European markets. Production under license in USA, India, China etc.
9 • Full/volume rate production capability has been demonstrated.
• Major system design features are stable and proven in test and evaluation.
• Materials are available to meet planned rate production schedules.
• Manufacturing processes and procedures are established and controlled to three-sigma or some other appropriate quality level to meet design characteristic tolerances in a low rate production environment.
• Manufacturing control processes are validated.
• Actual cost model has been developed for full rate production.
2025 Production scaled to 1m units pa for European markets. Production under license scaled in USA, India, China etc.
10
• The technology is successfully in service in multiple application forms, vehicle platforms and geographic regions. In-service and life-time warranty data is available, confirming actual market life, time performance and reliability.
10
• Full Rate Production is demonstrated • Lean production practices are in
place and continuous process improvements are on-going.
• Engineering/design changes are limited to quality and cost improvements.
• System, components or other items are in rate production and meet all engineering, performance, quality and reliability requirements.
• All materials, manufacturing

Libralato Engine Product Development & Production Time-scale
TRL
Technology Readiness MRL
Manufacturing Readiness
processes and procedures, inspection and test equipment are in production and controlled to six-sigma or some other appropriate quality level.
• Unit costs are at target levels and are applicable to multiple markets.
• The manufacturing capability is globally deployable.