EBS Annual Report 2010 - EBS d.a.c. · PDF fileGroup & Society Statement of Cash Flows 33 ......
104
Where Family Counts EBS Annual Report 2010 EBS. Helping families get on in life since 1935
-
Upload
phungxuyen -
Category
Documents
-
view
216 -
download
1
Transcript of EBS Annual Report 2010 - EBS d.a.c. · PDF fileGroup & Society Statement of Cash Flows 33 ......

Where Family Counts
EBS Annual Report 2010
EBS. Helping families get on in life since 1935

2
3
Contents
EBS Annual Report Chairman’s Review 4
Group Chief Executive’s Review 6
Financial Review 10
Board of Directors 16
EBS Group Management Team 18
Directors’ Report 19
Report of the Remuneration Committee 23
Statement of Directors’ Responsibilities 25
Independent Auditor’s Report 26
Accounts Group & Society Income Statement 30
Group & Society Statement of Other Comprehensive Income 31
Group & Society Statement of Financial Position 32
Group & Society Statement of Cash Flows 33
Statement of Changes in Shareholders’ Equity 34
Notes to Financial Statements 36

4
PHILIP WILLIAMSON, CHAIRMAN
OverviewIn 2010, Ireland experienced what may be considered its most difficult period in modern economic history. While it had been predicted that 2010 would be tough, it would have been impossible to foresee the extent of the challenges faced by the country, especially in the latter half of the year. The Irish financial crisis which began in 2008 had, by the end of 2010, become the subject of global headlines. A solution to the economic challenges faced by the country has naturally been the number one priority for the Government. Funding markets have been difficult throughout the year with wholesale markets effectively closed for Irish banks. In addition, rating agency actions taken at the Sovereign level have had an impact on all financial institutions including EBS. In the earlier part of the year most Irish banks would have been able to participate in the wholesale funding markets, however, the situation worsened in the second half of the year and, as a consequence, EBS in common with others now relies on other sources of funding from monetary authorities such as the European Central Bank and the Central Bank of Ireland. The Board and senior management of EBS remained focused on five key areas in 2010: serving our customers in our core mortgage and savings markets; strengthening our capital and funding position; risk management and regulatory compliance; managing our cost base; and the EBS sale process (including the EU restructuring plan). We believe these to be core to ensuring stability for the business and preparing it for the future. Progress on these areas is outlined in more detail in the Chief Executive’s Review.
Government SupportIn the 2009 annual report and at the 2010 AGM, we stated that EBS required €875m of capital to bring our core tier 1 ratio to 8%, as stipulated by the Central Bank. To date the Government has invested €875m in EBS. We are extremely grateful to the Minister for Finance and the Government for the support they have shown EBS over the last 12 months. CapitalThe Central Bank performed a Prudential Capital Assessment Review (PCAR) and a Prudential Liquidity Assessment Review (PLAR) during the first quarter of 2011. It was announced on 31 March 2011 that EBS requires a further €1.5bn of capital to meet the new capital requirements which will bring our core tier 1 ratio to c.22%. On 31 March 2011, the Minister for Finance confirmed that Irish domestic banks and building societies will be recapitalised to the levels required under the PCAR including, where appropriate, burden sharing with subordinated bondholders. Sale ProcessIt was confirmed by the National Treasury Management Agency on 30 March 2011 that the EBS sale process was terminated following a decision by the Minister. On 31 March 2011, the Minster for Finance announced the future banking landscape in Ireland and its intention to combine the operations of AIB and EBS to build a second pillar bank from the strengths of both institutions. The Society understands and accepts the Government’s need to reconfigure the banking system to support the economy and will play its part in rebuilding the sector. The Society acknowledges its clear new direction and we will work with AIB to maximise value and serve the needs of our customers. In the interim, EBS customers can continue to conduct all their business as normal with no change to their existing terms, conditions and relationships. We will update you in due course as further details emerge with regard to the formation of the “pillar” bank through the combination of AIB and EBS. EBS PerformanceNotwithstanding the difficult year and environment, our savings and mortgage business continued to perform strongly in the market and delivered an operating profit of €56.4m. The financial outcome at an operating level reflects this positive
Chairman’s Review

5
overall business performance, however the effect of further impairment charges in relation to previously written loans has resulted in the Group incurring a post tax loss of €589.6m for the year including the impact of NAMA. Excluding the impact of NAMA in 2010, the Group incurred a loss of €197.2m. While a loss position was forecast in our 2009 review, it is nonetheless a very disappointing result. We continued to support homebuyers throughout 2010 by providing €928m in new mortgages directly and €215m through mortgage brokers. The Society’s share of new residential mortgage advances increased to 24.1%, a 7% increase on 2009. A keen focus for the Society over the last twelve months has been our savings business. Our research shows that Ireland is fast becoming a nation of savers. We delivered strong results throughout 2010, holding our share of the savings market in an extremely competitive environment. 20% of all new savings in the Irish market in 2010 were placed with EBS; we now hold almost 10% of the entire market for savings. In 2010, EBS continued to develop contingent funding measures as funding markets remained very difficult. The focus on retail savings has been an important contributor in this regard. Talking to customersThe strength behind EBS’ understanding of our customers and their needs is due to the relationships that we have built with them locally and our engagement through a number of specific initiatives during the year. In 2010, our annual customer survey received over 6,000 responses and your feedback has been very positive. Through the survey, you advised us that we have improved communication with customers. This year we achieved our highest score to date for communication – 74%, which is an improvement of 5% over our first survey in 2008. As Chairman of the Society, I believe it is extremely important that we communicate effectively with customers and I look forward to further improvements in this area. CommunityOver the last 75 years, EBS has remained committed to the community and in 2010 we focused on strengthening the programmes that we have instituted over the years under our Corporate Social Responsibility (CSR) Programme – Positive Impact. 2011 is the European Year of the Volunteer and, with this in mind, the theme of volunteering is a central tenet within our suite of initiatives. Accordingly, for 2011, EBS has turned the focus of its partnership with the Simon Communities to supporting 20 full time volunteers on their training programme. EBS continued to support organisations, charities and groups working to improve the welfare of the local communities where our customers live. The EBS Community Fund remained a core initiative for 2010 with over 200 local groups supported through our grant giving programme. With a change to the format this year, we empowered communities and customers to vote and support their local cause. Gorey Community Social Services Council received the largest number of votes to be awarded a grant of €10,000. In total over 96,000 web votes were cast supporting 22 shortlisted community groups around the country.
EBS staff volunteered and participated throughout the year with Special Olympics, Barnados, The Simon Community and One Family. I am particularly proud that EBS staff achieved the highest level of organisational fundraising nationally in support of the ‘Movember’ initiative that raises money for prostate cancer. The National Adult Literacy Agency and EBS continued to tackle the issue of financial literacy and we made financial understanding more accessible through the development of our consumer online tool and website – www.makingcents.ie. In 2011 we hope to further develop the site to drive greater understanding of financial products amongst the general public.
Board of DirectorsThis year the EBS Board has remained thoroughly committed to working towards the rebuilding of the Irish financial services industry and to securing the future of EBS. The Board has worked well together and with senior management in meeting the Society’s priorities and will continue to do so in the future as the new landscape of financial services takes shape. Cathal Magee left the Board in 2010 after 8 years on the Board. I would like to take this opportunity to thank Cathal for his support and commitment to EBS over those years. EmployeesOur employees continue to demonstrate excellence in serving customers and the organisation. The excellent work that is carried out by so many dedicated employees through our network of offices around Ireland and in our head office is reflected by the loyal relationships that customers have with EBS. On behalf of the Board and our customers I would like to thank the management and employees for all their hard work and dedication. This should be further extended to our family of agents, their employees, and our business partners, all of whom play a critical role in delivering a great EBS experience. Outlook2010 will be remembered as a year of huge economic change in Ireland. During 2011, our focus will be on the successful formation of the “pillar” bank through the combination of AIB and EBS whilst also serving our customers, maintaining a clear focus on capital, liquidity, funding, regulatory compliance, prudent risk management and continuing to manage our cost base. The EBS Board will continue to guide and support the senior management team through this next phase in EBS, and I look forward to working closely with all stakeholders as the future takes shape. We will continue to keep customers updated as and when further details emerge. Finally, I would like to thank you for your continued support throughout 2010. PHILIP WILLIAMSONCHAIRMAN15 April 2011

6
OverviewSignificant developments over the last 12 months continue to shape the future of EBS and Irish banking. It has been a very challenging time for Irish banks, bank staff and the broader Irish population. I would have hoped for a more stable environment in 2010, however, on the economic and financial front, it has been a busy and eventful year with little in the way of good news. Consumer sentiment is down, there is significant unemployment and construction activity has declined even further.
The very survival of the indigenous banking sector in 2010 has required a continuation of significant Government support culminating in the negotiation of the €85bn EU/IMF aid package in November 2010 and the Government taking stakes in 5 domestic financial institutions, including EBS. The aid package is conditional on a fundamental restructuring of the Irish banking system including the reduction of the balance sheets of the domestic lenders. Before reviewing the financial results, I would like to outline the Government support given to EBS in 2010.
Irish Government SupportThe Irish Government and the Central Bank of Ireland have played critical roles in stabilising the financial sector since 2008 with a view to increasing confidence in Irish banking both at a domestic and international level. 2010 provided a greater challenge on this front than expected due to ongoing difficulties with funding which has meant that Government intervention in the banking system has been more extensive and costly than initially anticipated.
Government Capital InvestmentAt our Special General Meeting in December 2009, voting members were given the opportunity to approve changes in EBS’s Rules to allow the Minister for Finance to provide capital to the Society. These changes were overwhelmingly endorsed with the result that recapitalisation of EBS by the Government took place in the first half of 2010 with the issuance of €100m of Special Investment Shares (SIS) and a €250m Promissory Note. A further €525m of capital was subsequently invested by way of SIS in December which brought the total Government investment at the end of 2010 to €875m. We are extremely grateful to the Minister for Finance and the Government for the support given to EBS. Regulatory Capital Requirements In early 2010, the Central Bank announced an increase in the minimum core tier 1 ratio requirement for Irish banks and building societies from 4% to 8%. The Central Bank then conducted an extensive assessment of the capital requirement for the Society as part of an industry-wide review, and concluded that EBS would need an additional €875m of capital to be in place at the end of 2010 to meet the base case target of 8%. In late November, as part of the EU/IMF aid package, the Central Bank prescribed a further increase in the core tier 1 ratio to 12%, and notified EBS that additional capital of €438m would be required by the end of February 2011. However, on 9 February 2011, the Minister for Finance announced that the capital injection into all Irish banks including EBS would be postponed until after the general election on 25 February. A liability management exercise undertaken by EBS in February 2011 raised approximately €136m of capital. In December 2010, the Central Bank announced that in the first quarter of 2011 it would conduct a further review of the capital adequacy of domestic banks (PCAR), and that a new liquidity framework (involving, amongst other things, maximum loan to deposit ratios) (PLAR) would be implemented. The results of this review were published by the Central Bank on 31 March 2011. The Central Bank announced that EBS requires €1.2bn of capital to meet the new target core tier 1 capital ratio of 10.5% under the PCAR base case and 6% under the stress case on the basis of the combined results of the PCAR and PLAR assumptions and
FERGUS MURPHY, GROUP CHIEF EXECUTIVE
Group Chief Executive’s Review
7
three year projected provisions estimates from Blackrock (the consultants appointed by the Central Bank in relation to the PCAR/PLAR processes), before the addition of a conservative capital buffer. The capital buffer is €0.3bn with €0.1bn representing equity and €0.2bn representing contingent capital. This brings the total capital requirement for EBS under the PCAR to €1.5bn. The Central Bank has indicated that capital must be raised by 31 July 2011. The Minister for Finance also confirmed that Irish domestic banks and building societies will be recapitalised to the levels required under the PCAR including, where appropriate, burden sharing with subordinated bondholders. National Asset Management Agency (NAMA)Throughout 2010, the successful transfer of assets in a timely manner to NAMA has been a priority for the organisation with significant internal resources dedicated to the project. Five tranches of assets totalling €836.4m were transferred to NAMA during 2010, representing 178 obligors with a total realised loss on sale of these assets of €275.6m. NAMA have requested the transfer of further commercial and associated assets with a nominal value of approximately €65m which we expect to complete shortly. This will conclude the transfer by EBS of all land and development and associated assets requested by NAMA. However NAMA may seek the transfer of further loans as they complete their due diligence on loan portfolios transferred by other participating institutions. Group Financial Results2010 was a very difficult year financially for EBS with a €589.6m loss after tax for the Group. The primary driver for this is the loss on assets being transferred to NAMA and continued impairments on non-NAMA assets. At the end of 2010, EBS had provisions coverage of 10.9% on the remaining commercial book and 2.0% (200 basis points) on the residential book. At an operating level (income before impairment losses and taxation) the business reported a profit of €56.4m. Key results include: • Income before impairment losses and taxation down 41% to €56.4m. • Net Interest Margin (NIM) has reduced from 72bps to 63bps. • Total loan impairment losses and provisions of €665.6m including €392.4m for NAMA loans with a €273.2m charge against the other loan books. • Non interest income (before Government Guarantee Scheme charges) up 4% to €9.5m.
• Profit on debt buy backs and sale of financial assets of €8.5m. • Administrative expenses up 2.7% to €84.4m, principally as a result of increased regulatory charges, legal and consultancy fees in relation to risk and regulatory compliance, all of which are non-controllable together with restructuring costs which will result in future cost savings. Excluding these non- controllable costs, administrative expenses are down 4.1% on 2009 and 19.6% since 2008.
• Costs-to-mean-assets-ratio at 0.45% is an improvement on the 2009 outcome of 0.46%. • Cost to Income ratio increased to 61.6% due to reduced income levels in 2010. • €1.1bn in gross new lending, c.€0.9bn of which was residential lending through the Society and c.€0.2bn of which was through our wholly-owned subsidiary, Haven Mortgages Limited. • €532m of net new retail savings, representing c.20% market share. • Over 55,000 savings accounts opened. • Loan to deposit ratio of 174.9% (excluding held for sale assets), 175.3% (including held for sale assets).
• Core tier 1 ratio of 8.4%, tier 1 capital ratio of 9.2% and total capital ratio of 12.4%. • Deterioration in the asset quality of our residential book, with home loan arrears greater than 3 months at 8.4% at the end of December 2010. Focus in 2010In 2010, in addition to managing our core businesses and strengthening our competitive position in those markets, we focused on five key areas to help stabilise the Society and secure our future position: • Serving our customers in our core mortgage and savings markets. • Strengthening our capital and funding position. • Risk management and regulatory compliance. • Managing our cost base. • EBS sale process (including EU restructuring plan).
Serving our Customers in our Core Mortgageand Savings Markets Despite the difficult environment in 2010, we demonstrated the strength of the EBS brand promise to customers by continuing to deliver a range of compelling and competitive mortgage and savings products. The nature of competition in both areas of our business was intense. This was particularly so in the retail savings market as more competitors sought to get a share of the Irish consumer’s savings. Our rates remained consistently in the top quartile providing excellent value to existing customers whilst also attracting new customers to the Society. I believe EBS demonstrated real relevance for Irish consumers in 2010, by continuing to provide value, superior service and support to customers. MortgagesWe provided €928m in new mortgages directly to customers in 2010 and a further €215m through mortgage brokers. As a demonstration of our commitment to homebuyers, we continued to host seminars nationwide for First and Second Time Buyers, maintaining a strong presence at home exhibitions around the country. In 2010, one in three people purchasing a property

8
for the first time chose EBS. In addition, EBS’ arrears support team has been working alongside and supporting those customers who have found it difficult to meet their financial commitments, helping them through a very difficult time and process. During 2010, EBS remained open for business in the mortgage marketplace and the Society’s share of new residential mortgage advances increased to 24.1%, a 7% increase on 2009, mainly as a result of competitors either exiting or reducing their focus on the market. However, as funding pressures increased especially in the second half of the year, EBS tightened its credit criteria for mortgages.
Savings and Insurance In 2010, the main challenge for Irish banks was funding, accordingly we focused on growing our retail deposit base to assist in creating a more stable funding base for EBS. Being a major provider of savings products in the Irish market is consistent with our heritage as an institution which actively encouraged homeowners to save with us prior to purchasing their first home. Economic uncertainty coupled with heightened risk aversion among savers, has been a catalyst for significant growth in precautionary saving resulting in an overall increase in the volume of deposits nationally. This was clearly evidenced during our ‘National Savings Week’ campaign which attracted record inflows despite intense competition from other product providers. EBS performed very well with 55,000 new savings accounts opened with the Society in 2010 and 8,000 new regular savers with the Society through our Family Savings Account. Our savings balances increased with new inflows in excess of €532m, which represented some 20% of all new inflows in the Irish market. While we have attracted many new customers, indications are that our existing customer base remains satisfied with the overall value we offer since retention rates for savings customers remain very strong. Statistics show that households are now saving almost one eighth of their disposable income and the net savings rate of 12.3% represents a significant increase over the last number of years. This bodes well for the future of our retail deposit business and our share of the domestic savings market. Other products in our range also performed well. With a significant sales effort supporting it, our stand alone home insurance performance yielded stronger than expected results; however, continued turbulence in financial markets have presented challenges for our equity-based product sales. Margins Mortgage pricing (relative to base rates) in Ireland remained well below that of our European counterparts in 2010 and we have had to adjust our pricing to reflect that and the continued high funding costs. EBS’s NIM, like other banks, continued to be under pressure from increased funding costs including the cost of the Government Guarantee Scheme. The NIM has reduced from 72bps to 63bps this year, notwithstanding mortgage price increases during the year. Like all of our competitors, in order to ensure ongoing viability we will continue to evaluate pricing of our mortgage products taking cognisance of our cost of funding, EBS’s competitive position, European Central Bank
average pricing and the impact of potential rate increases on our customers.
Strengthening our Capital and Funding Position Capital and stable funding are of paramount importance to the Society and, to this end, we have received invaluable support and commitment from the Government. Our capital position was strengthened through the €875m of capital contributed by Government in 2010 and will be further strengthened in 2011. Funding for Irish financial institutions was difficult throughout 2010 with rating agency actions on the Sovereign impacting on the ability to raise funding even with the benefit of the Government guarantee which has meant significant reliance on monetary authorities such as the European Central Bank and Central Bank of Ireland. It has been a challenging time, however, significant achievements such as a liability management exercise in 2010 which generated c.€90m of capital, the successful issuance of a €1bn 5 year Government guaranteed bond and the implementation of various liquidity-generating and contingency funding measures, helped to alleviate funding pressure throughout 2010. Irish banks were able to participate in the wholesale funding markets in the first half of 2010. However, uncertainty in the Eurozone and in particular in Greece, meant that from April onwards the wholesale funding markets closed to Irish financial institutions. Consequently, all Irish banks renewed their efforts to retain and attract as much customer funding as possible. Building on the success of 2009, EBS continued its retail customer savings campaign and secured inflows of €532m in 2010. This was achieved despite rating agency downgrades of the Sovereign and the financial institutions, including EBS. The continued inaccessibility to wholesale funding means that, towards the end of 2010, EBS increased its reliance on funding from monetary authorities. Risk Management and Regulatory Compliance At EBS, the functions of Risk, Regulatory Compliance and Credit have been key focus areas over the last 12 months. The EBS Group Risk Appetite Statement explicitly sets out the organisation’s risk appetite in each area of our business. The key risks in terms of capital, funding and credit have been intensively managed throughout the year. Improvements have also been made in the areas of risk management, internal control and governance during the year. These included the separation of the Risk and Credit functions and the appointment of an interim Chief Credit Officer. EBS has also increased resources in Risk and Regulatory Compliance. All of these areas will continue to be a key focus in 2011 with further improvements planned in this regard.

9
Credit management has been a priority for the Society during the year. EBS took a leadership position in proposing improvements in the industry code with respect to the treatment of customers experiencing financial difficulties. We have also implemented a number of the key recommendations of the Expert Working Group on Mortgage Arrears, which published their findings in late 2010, including the establishment of an Arrears Support Unit within EBS and the development of a communications framework around the Mortgage Arrears Resolution Process. During the year, as pressure on funding continued, EBS continued to tighten credit criteria with mortgage volumes in 2011 much reduced from 2010.
Arrears greater than 90 days but not impaired, increased to 6.8% at end December 2010 up from 4.8% at end 2009, as borrowers continued to face financial pressures. EBS will continue to work constructively with borrowers in financial difficulty. Although the default rate continues to rise, the increase in early arrears has remained relatively flat. We increased impairments for residential mortgages from 71bps to 200bps at the end of 2010. Managing our Cost BaseAdministrative costs increased in 2010 by 2.7%. The cost increase, however, was a result of increased regulatory changes together with improvements in risk management and regulatory compliance with additional resources hired into these areas. In addition, restructuring costs were incurred in 2010 which will result in further cost savings. If these costs are excluded, administrative costs are down 4.1% on 2009. EBS introduced a cost reduction programme in 2008. Excluding non-controllable costs, EBS has reduced costs by 19.6% in the 3 years 2008 – 2010. We will continue to focus on identifying means to reduce costs in the organsation in 2011. EBS Sale Process A formal open market sale process commenced for EBS in early summer 2010 with four bidders conducting due diligence. I am very pleased that EBS attracted credible bids despite the very difficult macro-economic environment and, in part, I believe this is testament to the hard work and high calibre of the EBS team coupled with proactive support from Government. However, it was confirmed by the National Treasury Management Agency on 30 March 2011 that the EBS sale process was terminated following a decision by the Minister for Finance. On 31 March 2011, the Minster for Finance announced the future banking landscape in Ireland and its intention to combine the operations of AIB and EBS to build a second pillar bank from the strengths of both institutions. We look forward to working with AIB in the future to build a strong bank through the combination of both organisations.
Employee and Network EngagementI am delighted that the most recent customer survey indicated that satisfaction ratings with the EBS Branch service increased year on year. This is a superb achievement by all staff given the continued difficulties in the sector over the last 12 months. We continue to develop and improve our skills and knowledge in the organisation and, in 2010, almost 900 staff attended courses and training through our continuous professional development and qualified financial advisor programmes. In 2011, we intend to further develop our skills in the area of arrears support as we upskill front line employees to support customers who find themselves in financial difficulty. This initiative aligns with the recommendations set out by the Expert Working Group on Mortgage Arrears. EBS was named as one of the top twenty places to work in Ireland in the 2010 Great Place to Work survey – a remarkable achievement given the extreme difficulties the sector is going through. I am delighted to say that EBS employees and those in our extended Agency network have once again delivered an outstanding experience to our customers. I am extremely grateful for the effort put in by all and very proud of the work they do. Outlook Having gone through a very difficult period in 2008 and 2009, the Irish economy showed some signs of stabilising towards the end of 2010 with GDP expected to have contracted by c.0.25% for the full year. The EU/IMF aid package coupled with the austerity measures in the budget means that 2011 is likely to be another challenging year for the economy. The mortgage market is expected to be around €5.9bn for 2011, slightly up on 2010, but still low as a result of lower levels of completions and weakened demand. It is expected that house prices will level off this year resulting in a peak to trough adjustment of approximately 50%. It is predicted that it will be 2012 before our economy starts to recover in earnest. Set against this background, for 2011, our priorities will be on the successful formation of the “pillar” bank through the combination of AIB and EBS for the benefit of all our stakeholders, managing our capital, funding and credit risks as efficiently as possible, continued focus on risk management and regulatory compliance and continuing to provide competitive mortgages and savings products to families around Ireland. Thank you all for your business in 2010.
FERGUS MURPHYGROUP CHIEF EXECUTIVE15 April 2011

10
EMER FINNAN, FINANCE DIRECTOR
Financial Review
Overall ResultsThis has been an exceptionally difficult and disappointing year for EBS, the Irish banking sector and Ireland. During this period, however, EBS has remained focused on our 5 key objectives as outlined in the Chairman’s and Chief Executive’s Reviews. The financial performance of the Society was very unsatisfactory with the Group reporting a loss after taxation of €589.6m. This loss is after impairments and losses on NAMA loans of €392.4m and impairment of financial assets and loans and advances to customers of €284.6m. 67% of the loss for the year was due to loans transferring to NAMA. EBS reported an operating profit (before impairments and loss on transfer to NAMA) of €56.4m down from the €95.6m achieved in 2009, mainly due to increased charges under the Credit Institutions (Eligible Liabilities Guarantee) Scheme (ELG), higher funding costs and reduced Treasury gains. Operationally, our retail savings business performed well with strong retail deposit inflows of €532m. We were also an active player in a much reduced residential property market with a market share of new business of 24.1% in 2010. We have made significant progress in re-pricing our back book loan portfolio in order to ensure that we have an acceptable net interest margin going forward given the high costs of both retail and wholesale funding. We are also keeping our new business pricing under review and are seeing strong improvements in this area. In 2010, €836.4m of assets (before impairment provisions) transferred to NAMA at an average discount of 60.4%, resulting in a loss of €275.6m after release of provisions held. Impairment charges on loans and advances held for sale to NAMA during the year amounted to €116.8m. A further €65.6m of assets are expected to transfer to NAMA in the first half of 2011 for which EBS has made an impairment provision on an incurred loss basis which is consistent with the net proceeds on disposal.
Impairment charges in respect of loans and advances to customers not transferring to NAMA amounted to €273.2m (2009: €197.4m) reflecting the increased level of arrears and the reduction in underlying asset values. Impairment coverage now represents 200 basis points (bps) on residential assets and 10.9% on term debt. Funding markets were very difficult in 2010 for all Irish financial institutions, including EBS, due to rating agency actions at both a Sovereign and institution level. We successfully issued a €1bn 5 year Government guaranteed bond in February 2010 and attracted an additional €0.5bn in retail deposits by year end. In addition, we utilised a number of liquidity generating and contingency funding arrangements to enable us to access further funding from monetary authorities. We have strengthened our capital base in 2010 in the form of €625m of Special Investment Shares (SIS) and a Promissory Note of €250m issued by the Minister for Finance. We are very grateful for this capital investment by the Government. The Central Bank conducted an initial Prudential Capital Assessment Review (PCAR) in March 2010 and determined that EBS required €875m in capital by 31 December 2010 to achieve a core tier 1 ratio of 8%. Subsequently as part of the EU/IMF agreement, it was determined that Irish banks should have sufficient capital in 2011 to achieve a target core tier 1 ratio of 12%. As part of this process it was determined that EBS required an additional €438m of capital. A further PCAR and Prudential Liquidity Assessment Review (PLAR) exercise was conducted in Q1 2011. The total capital requirement for EBS is an additional €1.5bn (in addition to the €875m already received). The Minister for Finance has confirmed that this capital will be made available including, where appropriate, burden sharing with subordinated bondholders.

11
Income StatementOperating Profit is €56.4m compared to €95.6m in 2009. The income reduction in 2010 is partially due to 2009 benefiting from gains in the Treasury division arising from debt buyback and asset disposal exercises of €34.2m compared to €8.5m for 2010, higher Government Guarantee charges in 2010 of €40.2m compared to €7.9m in 2009 and higher retail and wholesale funding costs. Net Interest IncomeNet interest income is down by 16%Net interest income for the year is €130.3m compared to €154.9m in 2009. The net interest margin (including charges under the ELG scheme) was 0.63% compared to 0.72% for 2009. The 9 basis points reduction is due to • Increased cost under the ELG Scheme representing a decrease of 17bps; •Increased cost of retail funding representing a decrease of 18bps;•Increased wholesale funding costs representing a decrease of 8bps; offset by • An increase in front and back book lending margins representing an increase of 28bps; and•A reduction in interest payable on capital funds due to a dividend stopper on non-controlling interests representing an increase of 6bps. The significant and sustained increases in the cost of retail and wholesale funding during the year were key drivers for the increase in the standard variable mortgage rate by 60bps in both May and August 2010. EBS endeavoured to defer such increases for as long as possible but the ongoing downward pressure on business margins required us to increase standard variable mortgage rates. Non Interest Income and Other IncomeReduction in one-off income leads to non interest income and other income reduction of €15.9mNon interest income and other income for 2010 is €22.5m compared to €38.4m in 2009. Fees and commissions income is broadly in line with 2009 with the exception of the charge under the Credit Institutions (Financial Support) Scheme (CIFS) of €5.6m, which ceased in September 2010 (2009: €7.9m).
Profit on the sale and repurchase of securities was €8.5m for the year which compares to €34.2m in 2009. EBS realised one-off income from reducing the size of its fixed income bond portfolio and changing the mix to include more higher yielding Irish Government guaranteed bonds. This exercise began in 2009 and was completed in 2010. Other operating income of €10.1m compares to €3.0m in 2009. The €7.1m increase is mainly due to the settlement of an insurance claim. Operating ExpensesAdministrative expenses in 2010 are €84.4m compared to €82.2m in 2009. The increase on 2009 is due to a number of non-controllable costs such as increased regulatory charges, legal and consultancy fees in relation to regulation, risk and compliance and restructuring costs that will lead to future cost savings. Excluding these non-controllable items, our administrative costs are down 4.1% on 2009. Staff numbers and core operating costs continued to fall during the year as we continue to see the benefits from the strategic costs savings programme. We remain committed to having the right cost base to support our strategic goals and, for the third year running, no executive or manager bonus awards were made. Property impairment costs were €2.3m compared to €5.3m for 2009 reflecting the continued reduction in the value of EBS owned properties. Our cost to income ratio (excluding impairment of property) increased from 47.8% to 61.6% mainly due to reduced income levels. The cost-to-mean-assets-ratio which is not influenced by one-off income movements was 0.45% compared to 0.46% for 2009. Loss before taxationNAMA Losses and Loan Impairment Provisions of €665.6m results in a loss before tax of €620.6mThe reported loss before tax of €620.6m is mainly attributable to the losses and impairments incurred on loans transferred to and held for sale to NAMA of €392.4m and impairments on the non-NAMA residential and commercial books of €273.2m. With regard to the remaining book, we believe it is appropriate to take additional impairment charges at this stage to provide robust coverage to ensure we are in a better position to move forward.

12
Loss on Loans Sold to and Held for Sale to NAMA €m
Nominal Value of Loans transferring to NAMA (902.0)
Nominal Value of Consideration – 372.5
NAMA Bonds (2010 €331m, expected 2011 €41.5m)
Costs incurred and fair value adjustment on NAMA Bonds (31.5)
(2010 €27.9m, expected 2011 €3.6m)
Total Loss on loans transferring to NAMA (561.0)
Release of Loan Impairment Provisions held 168.6
Loss & Impairment Charge on Loans transferring to NAMA (392.4)
Income Statement breakdown
Loss on transfer of loans and advances held for sale to NAMA (275.6)
Provisions for impairment on loans and advances held for sale (116.8)
(392.4)
Loss on transfer of assets to NAMAAs part of our participation in NAMA, loans with a nominal value of €836.4m (before impairment provisions) were transferred in 2010 at a discount of 60.4%. NAMA has requested further transfers of loans of approximately €65m. EBS has already transferred all land and development and associated exposures to NAMA. These numbers may change if further assets are requested to be acquired by NAMA. In the first half of 2011, the final transfer of loans with a nominal value of approximately €65m is expected to be completed; no further material loss on this transfer is expected to arise due to provisions being recognised on an incurred loss basis taking into consideration the expected net proceeds on sale. The total loss including expenses and fair value adjustments is expected to be €561m (before release of provisions). The total loss (after release of provisions) is expected to be €392m.
A summary of the cumulative loss in 2010 on loans transferred and transferring to NAMA is set out below:
Impairment Charge on Assets Held for Sale to NAMALoans held for sale at 31 December 2010 amount to €65.6m. These continue to be assessed for impairment and the charge taken is on an incurred loss basis which is consistent with the net proceeds on disposal.
The detailed breakdown of the charge and stock provisions is set out below.
1 The percentages are based on the year end loan book value2 This charge was included in loans and advances to customers in 2009 as these loans were only designated as held for sale to NAMA on 31 December 2009
See Note 16 to the Accounts (Loans and Advances held-for-sale to NAMA) for full details of movements in the provisions balance.
Impairment Charge on financial assetsAs part of normal banking operations, financial institutions lend to each other using a number of different types of instruments – certificates of deposit, bonds, deposits, etc. to facilitate liquidity management and funding. EBS has approximately €2.6bn in balances of such assets at December 2010. As part of our treasury risk management processes, EBS’s exposures to market counterparties are assessed for impairment on a regular basis. In light of the increased risk of counterparties engaging in liability management exercises, we believe that an impairment provision
Held for 2010 2009 Sale Assets €m1 % €m2 % Charges
Land & Development - - 50.9 10.1
Associated 116.8 - 32.5 8.0
Total 116.8 - 83.4 9.1
2010 2009 €m % €m %
Provisions
Land & Development 0.5 41.7 121.7 24.1
Associated 27.2 42.2 40.5 9.9
Total 27.7 42.2 162.2 17.8
Book Non Book Non Performing Performing
€m % €m %
Book Performance
Land & Development 1.2 100.0 505.6 52.0
Associated 64.4 50.0 407.2 22.7
Total 65.6 50.8 912.8 39.1
13
of €11.4m is required at this time.
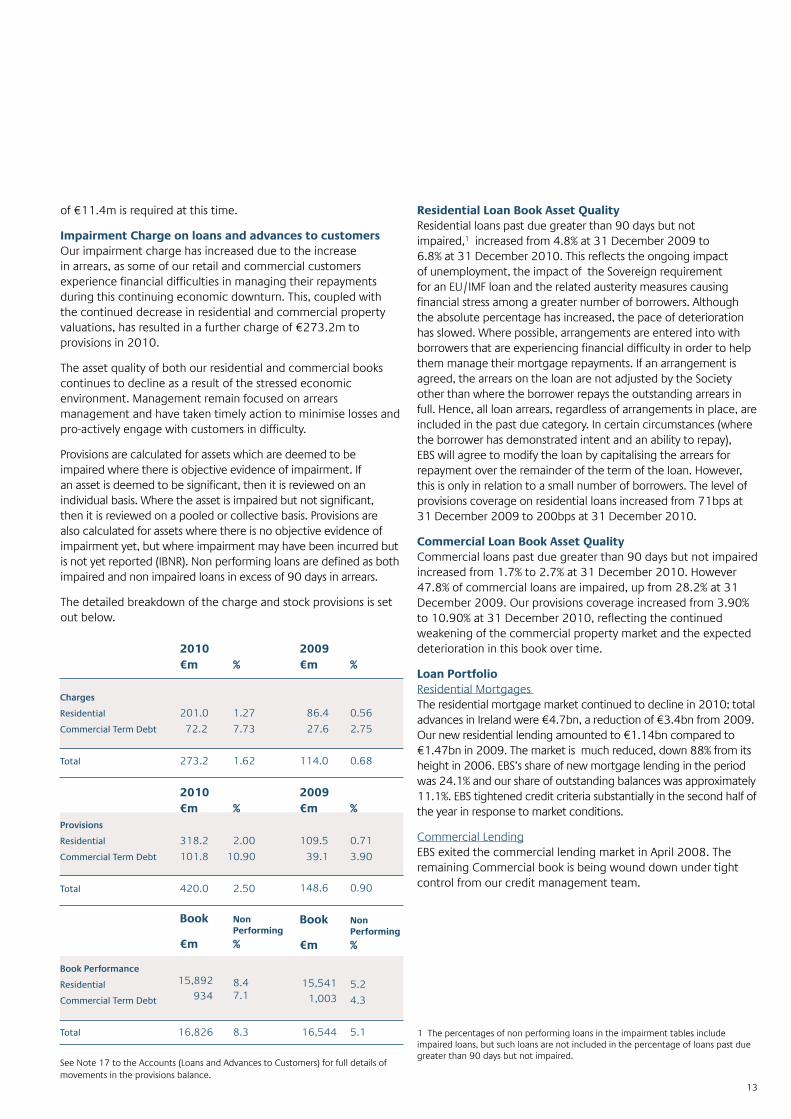
Impairment Charge on loans and advances to customersOur impairment charge has increased due to the increase in arrears, as some of our retail and commercial customers experience financial difficulties in managing their repayments during this continuing economic downturn. This, coupled with the continued decrease in residential and commercial property valuations, has resulted in a further charge of €273.2m to provisions in 2010. The asset quality of both our residential and commercial books continues to decline as a result of the stressed economic environment. Management remain focused on arrears management and have taken timely action to minimise losses and pro-actively engage with customers in difficulty. Provisions are calculated for assets which are deemed to be impaired where there is objective evidence of impairment. If an asset is deemed to be significant, then it is reviewed on an individual basis. Where the asset is impaired but not significant, then it is reviewed on a pooled or collective basis. Provisions are also calculated for assets where there is no objective evidence of impairment yet, but where impairment may have been incurred but is not yet reported (IBNR). Non performing loans are defined as both impaired and non impaired loans in excess of 90 days in arrears. The detailed breakdown of the charge and stock provisions is set out below.
Residential Loan Book Asset QualityResidential loans past due greater than 90 days but not impaired,1 increased from 4.8% at 31 December 2009 to 6.8% at 31 December 2010. This reflects the ongoing impact of unemployment, the impact of the Sovereign requirement for an EU/IMF loan and the related austerity measures causing financial stress among a greater number of borrowers. Although the absolute percentage has increased, the pace of deterioration has slowed. Where possible, arrangements are entered into with borrowers that are experiencing financial difficulty in order to help them manage their mortgage repayments. If an arrangement is agreed, the arrears on the loan are not adjusted by the Society other than where the borrower repays the outstanding arrears in full. Hence, all loan arrears, regardless of arrangements in place, are included in the past due category. In certain circumstances (where the borrower has demonstrated intent and an ability to repay), EBS will agree to modify the loan by capitalising the arrears for repayment over the remainder of the term of the loan. However, this is only in relation to a small number of borrowers. The level of provisions coverage on residential loans increased from 71bps at 31 December 2009 to 200bps at 31 December 2010. Commercial Loan Book Asset QualityCommercial loans past due greater than 90 days but not impaired increased from 1.7% to 2.7% at 31 December 2010. However 47.8% of commercial loans are impaired, up from 28.2% at 31 December 2009. Our provisions coverage increased from 3.90% to 10.90% at 31 December 2010, reflecting the continued weakening of the commercial property market and the expected deterioration in this book over time. Loan PortfolioResidential Mortgages The residential mortgage market continued to decline in 2010; total advances in Ireland were €4.7bn, a reduction of €3.4bn from 2009. Our new residential lending amounted to €1.14bn compared to €1.47bn in 2009. The market is much reduced, down 88% from its height in 2006. EBS’s share of new mortgage lending in the period was 24.1% and our share of outstanding balances was approximately 11.1%. EBS tightened credit criteria substantially in the second half of the year in response to market conditions. Commercial LendingEBS exited the commercial lending market in April 2008. The remaining Commercial book is being wound down under tight control from our credit management team.
Charges
Residential
Commercial Term Debt
Total
Provisions
Residential
Commercial Term Debt
Total
Book Performance
Residential
Commercial Term Debt
Total
2010 €m %
201.0 1.27
72.2 7.73
273.2 1.62
2010 €m %
318.2 2.00
101.8 10.90
420.0 2.50
Book Non Performing
€m % 8.4 7.1
8.3
2009 €m %
86.4 0.56
27.6 2.75
114.0 0.68
2009 €m %
109.5 0.71
39.1 3.90
148.6 0.90 Book Non Performing
€m %
5.2
4.3
5.1
See Note 17 to the Accounts (Loans and Advances to Customers) for full details of movements in the provisions balance.
1 The percentages of non performing loans in the impairment tables include impaired loans, but such loans are not included in the percentage of loans past due greater than 90 days but not impaired.
15,892
16,826
93415,541
16,544
1,003
14
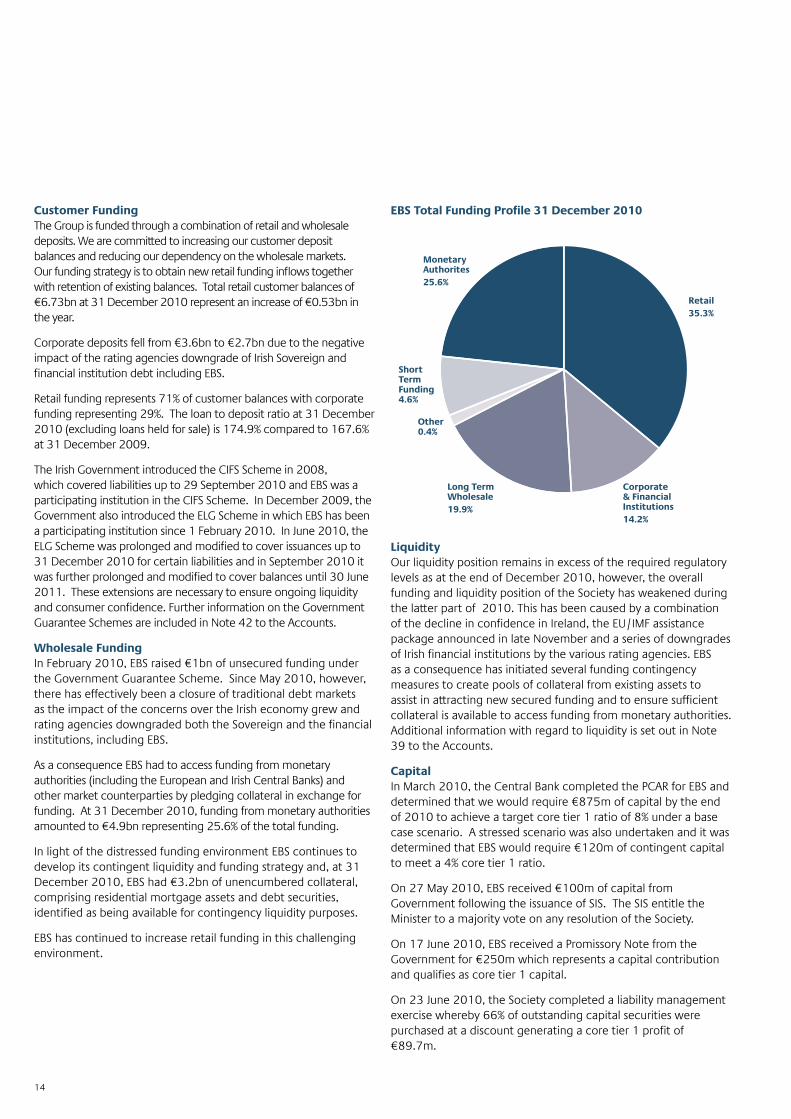
Customer FundingThe Group is funded through a combination of retail and wholesale deposits. We are committed to increasing our customer deposit balances and reducing our dependency on the wholesale markets. Our funding strategy is to obtain new retail funding inflows together with retention of existing balances. Total retail customer balances of €6.73bn at 31 December 2010 represent an increase of €0.53bn in the year. Corporate deposits fell from €3.6bn to €2.7bn due to the negative impact of the rating agencies downgrade of Irish Sovereign and financial institution debt including EBS. Retail funding represents 71% of customer balances with corporate funding representing 29%. The loan to deposit ratio at 31 December 2010 (excluding loans held for sale) is 174.9% compared to 167.6% at 31 December 2009. The Irish Government introduced the CIFS Scheme in 2008, which covered liabilities up to 29 September 2010 and EBS was a participating institution in the CIFS Scheme. In December 2009, the Government also introduced the ELG Scheme in which EBS has been a participating institution since 1 February 2010. In June 2010, the ELG Scheme was prolonged and modified to cover issuances up to 31 December 2010 for certain liabilities and in September 2010 it was further prolonged and modified to cover balances until 30 June 2011. These extensions are necessary to ensure ongoing liquidity and consumer confidence. Further information on the Government Guarantee Schemes are included in Note 42 to the Accounts. Wholesale FundingIn February 2010, EBS raised €1bn of unsecured funding under the Government Guarantee Scheme. Since May 2010, however, there has effectively been a closure of traditional debt markets as the impact of the concerns over the Irish economy grew and rating agencies downgraded both the Sovereign and the financial institutions, including EBS. As a consequence EBS had to access funding from monetary authorities (including the European and Irish Central Banks) and other market counterparties by pledging collateral in exchange for funding. At 31 December 2010, funding from monetary authorities amounted to €4.9bn representing 25.6% of the total funding. In light of the distressed funding environment EBS continues to develop its contingent liquidity and funding strategy and, at 31 December 2010, EBS had €3.2bn of unencumbered collateral, comprising residential mortgage assets and debt securities, identified as being available for contingency liquidity purposes. EBS has continued to increase retail funding in this challenging environment.
EBS Total Funding Profile 31 December 2010 LiquidityOur liquidity position remains in excess of the required regulatory levels as at the end of December 2010, however, the overall funding and liquidity position of the Society has weakened during the latter part of 2010. This has been caused by a combination of the decline in confidence in Ireland, the EU/IMF assistance package announced in late November and a series of downgrades of Irish financial institutions by the various rating agencies. EBS as a consequence has initiated several funding contingency measures to create pools of collateral from existing assets to assist in attracting new secured funding and to ensure sufficient collateral is available to access funding from monetary authorities. Additional information with regard to liquidity is set out in Note 39 to the Accounts. CapitalIn March 2010, the Central Bank completed the PCAR for EBS and determined that we would require €875m of capital by the end of 2010 to achieve a target core tier 1 ratio of 8% under a base case scenario. A stressed scenario was also undertaken and it was determined that EBS would require €120m of contingent capital to meet a 4% core tier 1 ratio. On 27 May 2010, EBS received €100m of capital from Government following the issuance of SIS. The SIS entitle the Minister to a majority vote on any resolution of the Society. On 17 June 2010, EBS received a Promissory Note from the Government for €250m which represents a capital contribution and qualifies as core tier 1 capital. On 23 June 2010, the Society completed a liability management exercise whereby 66% of outstanding capital securities were purchased at a discount generating a core tier 1 profit of €89.7m.
Retail 35.3%
Corporate & FinancialInstitutions 14.2%
Long Term Wholesale 19.9%
Other0.4%
Short Term Funding4.6%
Monetary Authorites 25.6%
15
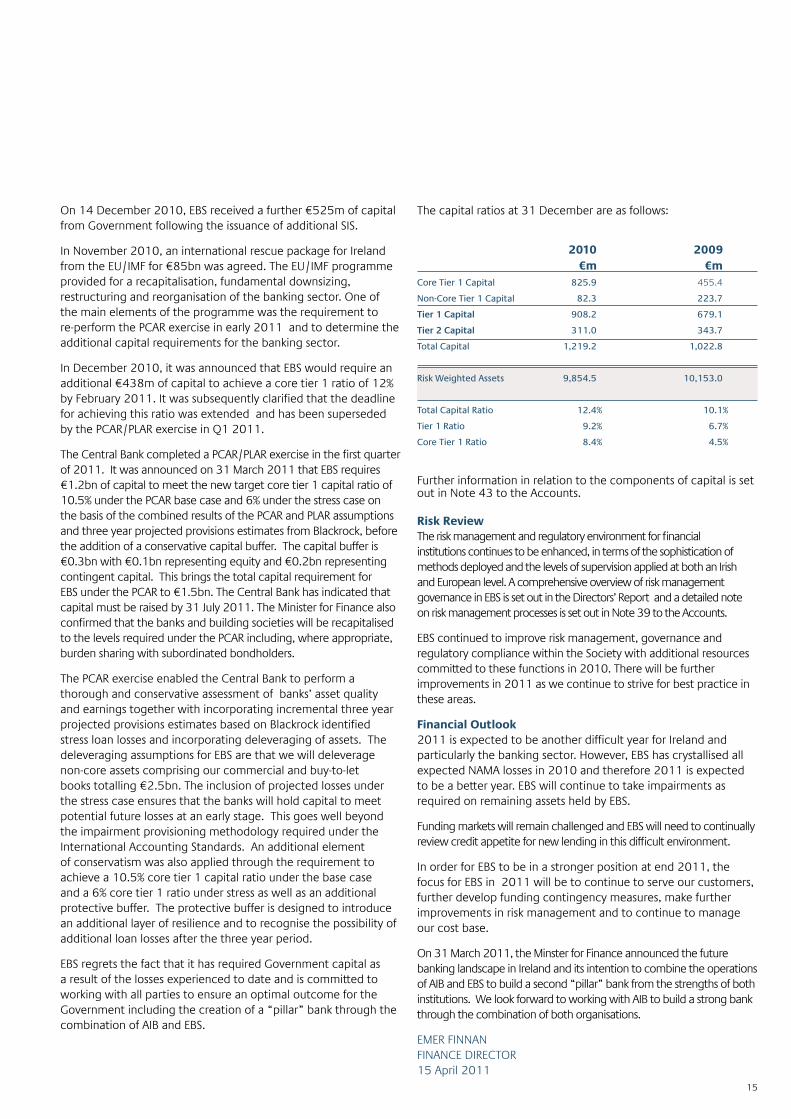
On 14 December 2010, EBS received a further €525m of capital from Government following the issuance of additional SIS. In November 2010, an international rescue package for Ireland from the EU/IMF for €85bn was agreed. The EU/IMF programme provided for a recapitalisation, fundamental downsizing, restructuring and reorganisation of the banking sector. One of the main elements of the programme was the requirement to re-perform the PCAR exercise in early 2011 and to determine the additional capital requirements for the banking sector. In December 2010, it was announced that EBS would require an additional €438m of capital to achieve a core tier 1 ratio of 12% by February 2011. It was subsequently clarified that the deadline for achieving this ratio was extended and has been superseded by the PCAR/PLAR exercise in Q1 2011. The Central Bank completed a PCAR/PLAR exercise in the first quarter of 2011. It was announced on 31 March 2011 that EBS requires €1.2bn of capital to meet the new target core tier 1 capital ratio of 10.5% under the PCAR base case and 6% under the stress case on the basis of the combined results of the PCAR and PLAR assumptions and three year projected provisions estimates from Blackrock, before the addition of a conservative capital buffer. The capital buffer is €0.3bn with €0.1bn representing equity and €0.2bn representing contingent capital. This brings the total capital requirement for EBS under the PCAR to €1.5bn. The Central Bank has indicated that capital must be raised by 31 July 2011. The Minister for Finance also confirmed that the banks and building societies will be recapitalised to the levels required under the PCAR including, where appropriate, burden sharing with subordinated bondholders. The PCAR exercise enabled the Central Bank to perform a thorough and conservative assessment of banks’ asset quality and earnings together with incorporating incremental three year projected provisions estimates based on Blackrock identified stress loan losses and incorporating deleveraging of assets. The deleveraging assumptions for EBS are that we will deleverage non-core assets comprising our commercial and buy-to-let books totalling €2.5bn. The inclusion of projected losses under the stress case ensures that the banks will hold capital to meet potential future losses at an early stage. This goes well beyond the impairment provisioning methodology required under the International Accounting Standards. An additional element of conservatism was also applied through the requirement to achieve a 10.5% core tier 1 capital ratio under the base case and a 6% core tier 1 ratio under stress as well as an additional protective buffer. The protective buffer is designed to introduce an additional layer of resilience and to recognise the possibility of additional loan losses after the three year period. EBS regrets the fact that it has required Government capital as a result of the losses experienced to date and is committed to working with all parties to ensure an optimal outcome for the Government including the creation of a “pillar” bank through the combination of AIB and EBS.
The capital ratios at 31 December are as follows:
Risk ReviewThe risk management and regulatory environment for financial institutions continues to be enhanced, in terms of the sophistication of methods deployed and the levels of supervision applied at both an Irish and European level. A comprehensive overview of risk management governance in EBS is set out in the Directors’ Report and a detailed note on risk management processes is set out in Note 39 to the Accounts. EBS continued to improve risk management, governance and regulatory compliance within the Society with additional resources committed to these functions in 2010. There will be further improvements in 2011 as we continue to strive for best practice in these areas. Financial Outlook2011 is expected to be another difficult year for Ireland and particularly the banking sector. However, EBS has crystallised all expected NAMA losses in 2010 and therefore 2011 is expected to be a better year. EBS will continue to take impairments as required on remaining assets held by EBS. Funding markets will remain challenged and EBS will need to continually review credit appetite for new lending in this difficult environment. In order for EBS to be in a stronger position at end 2011, the focus for EBS in 2011 will be to continue to serve our customers, further develop funding contingency measures, make further improvements in risk management and to continue to manage our cost base. On 31 March 2011, the Minster for Finance announced the future banking landscape in Ireland and its intention to combine the operations of AIB and EBS to build a second “pillar” bank from the strengths of both institutions. We look forward to working with AIB to build a strong bank through the combination of both organisations. EMER FINNAN FINANCE DIRECTOR15 April 2011
Core Tier 1 Capital
Non-Core Tier 1 Capital
Tier 1 Capital
Tier 2 Capital
Total Capital
Risk Weighted Assets
Total Capital Ratio
Tier 1 Ratio
Core Tier 1 Ratio
2010 €m 825.9
82.3
908.2
311.0
1,219.2
9,854.5
12.4%
9.2%
8.4%
2009 €m
455.4
223.7
679.1
343.7
1,022.8
10,153.0
10.1%
6.7%
4.5%
Further information in relation to the components of capital is set out in Note 43 to the Accounts.

16
Board of Directors
EMER FINNAN BComm, FCAExecutive Director (Age 42)Appointed Executive Director in July 2007 and Finance Director in February 2010. Emer has over 20 years experience in financial services. Prior to joining EBS Emer worked as a Director with NCB Corporate Finance with responsibility for financial services and advised on a large number of financial services transactions. Before that Emer worked with ABN AMRO and Citibank in Corporate Finance in London, again specialising in financial services transactions. Emer trained as a Chartered Accountant with KPMG. She also spent a number of years on the Board of the RTÉ Authority. Emer has executive responsibility for finance, strategy and legal. Principal other directorships:Dublin Port Company, Haven Mortgages Ltd., EBS Mortgage Finance. BARBARA PATTON MBS, FMIINon-Executive and Senior Independent Director (Age 50)Appointed Non-Executive Director in 2002. Barbara worked in the financial services industry for 13 years, firstly with AIB Capital Markets and then with Irish Permanent plc. Barbara is now an independent consultant specialising in Executive Coaching and Services Marketing in the SME sector. Principal other directorships:An Post National Lottery Company, Social Innovations Foundation Ireland Limited. JIM RUANE PhD, M.Agr.SC, B.Agr.SC, FIBNon-Executive Director (Age 66)Appointed Non-Executive Director in 2007. Jim has over 29 years experience in financial services. He began his working career as an economist and has held senior management positions in a number of financial and accounting services firms and manufacturing companies, including, KPMG, Bank of Ireland Group and John Deere & Co. He was appointed by the Government to the Higher Education Authority in 2007. Principal other directorships:Key Capital Private Limited, Haven Mortgages Ltd., Royal Victoria Eye & Ear Hospital, nSpire Re Ltd., DIT Foundation, Scottish Re (Dublin) Ltd., Ace Bermuda International Insurance (Ireland) Ltd., Ace Bermuda International Reinsurance (Ireland) Ltd., Allianz Global Life Ltd., Pensa Advisers Ltd., Whitcas (Ireland) Ltd., MFXchange (Ireland) Ltd.
ETHNA TINNEY BA (Mod), LRAMNon-Executive Director (Age 56)Appointed Non-Executive Director in 2000 and again in 2008. Ethna is a producer with RTÉ lyric fm, the music and arts radio station and has extensive experience in the field of classical music as an artist, teacher, producer and entrepreneur. Principal other directorships:None. PHILIP WILLIAMSON CBE, BA (Econ) Hons, ACIB (FCIB), PMD, Hon Doctorate Business AdminNon-Executive Chairman (Age 63)Appointed Non-Executive Director in 2007, after retiring from the Board of the UK Nationwide Building Society, the world’s largest building society. Philip joined Nationwide in 1991 and went on to become Corporate Development Director, Marketing and Commercial Director and Retail Operations Director, before being appointed CEO in 2002. Prior to Nationwide he held a variety of senior executive roles at Lloyds Bank plc and was a Director of UK Land plc. Philip is currently Chairman of Investors in People (UK). He is a past President of the European Mortgage Federation and also held the position of Chairman of the UK Building Societies Association. Principal other directorships:Investors in People UK. PAT McCANN H.N.D. Business Studies, FIHINon-Executive Director (Age 59)Appointed Non-Executive Director in 2007. Pat was Chief Executive of Jurys Doyle Hotel Group plc until his retirement from that position in June 2006. He had worked for the Group since 1989 in various roles. He is Chief Executive of Dalata Ltd., the holding company for the Maldron Hotels Group and is a non-executive Director on a number of other boards. Principal other directorships:Dalata Ltd., Greencore Group plc, The Irish Heart Foundation, Sanjay Ltd., Joe McCann Menswear Ltd., Palms Consulting Ltd.
EMER FINNAN, BARBARA PATTON, JIM RUANE ETHNA TINNEY, PHILIP WILLIAMSON, PAT McCANN

17
LIAM MULVIHILL BA, H DIP. (Hons), M ED. HISTORYNon-Executive Director (Age 64)Appointed Non-Executive Director in 2007. Liam was Director General of the GAA from 1979 to 2008. He worked as a primary school teacher and later as a school’s inspector before accepting the post of Director General. He also filled various roles with State Bodies throughout his career including the RTÉ Authority, Bord na Gaeilge, the Irish Sports Council and was a member of the board of the Sports Campus Ireland project at Abbottstown. Liam oversaw the era of live television sponsorship and the commercial mobilisation of the GAA and was a central figure in bringing the new Croke Park concept from genesis to fruition. Principal other directorships:Foras na Gaeilge, The Irish Diaspora Centre Ltd. LINDA O’SHEA FARREN BCL (Hons.), Solicitor, Attorney-at-LawNon-Executive Director (Age 50)Appointed Non-Executive Director in 2009. After qualifying as a Solicitor and Attorney-at-Law in the mid-1980s, Linda worked in the New York and London offices of leading international law firm Debevoise & Plimpton. On her return to Ireland, in the mid-1990s, she worked as an investment banker with KBFSI/Irish Intercontinental Bank until she was appointed Programme Manager & Adviser to the Minister for Justice. Following this government appointment, Linda worked as Director of Legal and Corporate Affairs with the Irish Wheelchair Association until setting up her own solicitor’s practice in corporate law. In addition to being a member of the NUI Senate, she is a member of its Finance Committee and Chair of its Audit and Risk Committee. Principal other directorships:Senate of the National University of Ireland, Board of KBC Music in Great Irish Houses. ANTHONY SPOLLEN FCANon-Executive Director (Age 65)Appointed Non-Executive Director in 2009. Anthony is former Financial Controller of Ireland’s largest Merchant Bank (A.I.I.B.) and former Head of Internal Audit at Ireland’s largest banking group, AIB. He is an Internal Audit Consultant and an advisor on Corporate Development and is the author of “Corporate Fraud, the danger from within” (Oak Tree Press). He is a member of the Audit Committee of the Property Registration Authority (previously known as the Land Registry).
Principal other directorships:None. MARTIN DONNELLANNon-Executive Director (Age 62)Appointed Non-Executive Director in 2009. Martin is a retired Assistant Commissioner of An Garda Síochána where he served for over 40 years. During his career he received numerous commendations for outstanding bravery and professionalism and has worked on fact finding missions with the United Nations. Principal other directorships:Manguard Plus Ltd. FERGUS MURPHY BSc (Mgmt), MA, DABS, AMCT, FIBIGroup Chief Executive (Age 47)Appointed Group Chief Executive in January 2008. Fergus was previously CEO ACCBank plc and CEO Rabobank Asia. Prior to that he was Global Treasurer and Global Head Investment Book Rabobank International, and Managing Director Rabobank Ireland plc. Fergus commenced his career in Irish Intercontinental Bank and spent five years with Banque National de Paris (BNP) as a derivatives trader. He is Chairman of Financial Services Ireland (FSI). Principal other directorships:Haven Mortgages Ltd., EBS Mortgage Finance, IBEC Ltd. ANN RIORDANNon-Executive Director (Age 63)Appointed Non-Executive Director in 2009. Ann held senior executive roles in the I.T. sector in the UK and Ireland prior to setting up Microsoft Ireland in 1990. Having built the business and the brand successfully in Ireland she retired from Microsoft in 2001. She has served on the Information Society Steering Committee and the Irish Council for Science, Technology & Innovation. She is currently President of the Institute of Directors in Ireland, Chairman of the Dublin Regional Tourism Authority and the National Standards Authority of Ireland. Principal other directorships:Institute of Directors in Ireland, Tourism Ireland Ltd., National Standards Authority of Ireland, Dublin Regional Tourism Authority, UCD Michael Smurfit Graduate Business School.
LIAM MULVIHILL, LINDA O’SHEA FARREN, ANTHONY SPOLLEN MARTIN DONNELLAN, FERGUS MURPHY, ANN RIORDAN

18
Group Management Team FERGUS MURPHYBSc (Mgmt), MA, DABS, AMCT, FIBIGROUP CHIEF [email protected] FIDELMA CLARKEBA (Econ) Hons, M Litt (Econ)CHIEF RISK [email protected] AUDREY COLLINS FCAHEAD OF [email protected] DARA DEERING BSc (Mgmt), MBADIRECTOR, MEMBERSHIP [email protected] EMER FINNANBComm, FCAFINANCE [email protected] DES FITZGERALDDipMgt, MBA, CDir, FIBI, FSIIDIRECTOR, [email protected] DAVE KEENANBA, MBA, FIB, FCIPDDIRECTOR, PEOPLE, OPERATIONS,IT AND [email protected] TOM McALEESEBA (Mod), FCA, AICPA, FIBICHIEF CREDIT [email protected]
Senior Executives ROBERT BREE BComm, [email protected] HELEN DOOLEY LLBLEGAL & COMPANY [email protected] GRANT HOURIGAN BComm CAINTERNAL AUDIT & [email protected] BERNADETTE HURLEY BA HonsCUSTOMER [email protected] CIARAN MORGANMBS, FCIPD, BEd (Hons)HUMAN [email protected] GERRY MURRAY [email protected] BRIAN NUGENT BAAF, [email protected] AIDAN POWER BCommMARKETING & CUSTOMER [email protected] OWEN PURCELL BComm, FIBRETAIL [email protected] DAVID YEATES MSc, MBAINFORMATION [email protected]
EBS Group Management Team

19
The Directors present their Report and the Audited Accounts for the year ended 31 December 2010. Business ReviewThe Chairman’s Review, the Group Chief Executive’s Review and the Financial Review are set out on pages 4 to 15 which collectively provide an overview of the business of the Society and its subsidiaries during 2010, an update on the current environment and the outlook for 2011. Material Risks and Uncertainties and Going Concern Basis of Preparation In determining the appropriateness of adopting the going concern basis of preparation for the Group’s financial statements, the Directors have taken into consideration the economic, political and market risks and uncertainties currently impacting Irish financial institutions and the Group. In particular these relate to challenges in terms of liquidity, funding and capital. Having regard to these risks and uncertainties, and the steps taken by the Group to address them, the Directors are satisfied that it continues to be appropriate to prepare the Group’s financial statements on a going concern basis. Going Concern Basis of PreparationThe financial statements have been prepared on a going concern basis. In making its assessment of the Group’s ability to continue as a going concern, the Board of Directors have taken into consideration the material risks and uncertainties that could impact the Group’s ability to continue as a going concern including those relating to:
•The period over which the Irish economy recovers from the current crisis.• The implementation by the Irish Government of the joint EU/ IMF programme for Ireland.•The impact of actions taken by the Minister for Finance on financial stability grounds under the Credit Institutions (Stabilisation) Act 2010.•The Group’s access to liquidity and funding and the continued availability of the Eurosystem and Central Bank of Ireland financing.• The ability of the Group to meet its targeted regulatory ratios under PCAR and to raise additional required capital.•The ability of the Group to dispose of assets to meet PLAR targets set by the Central Bank of Ireland.
In assessing the going concern basis of preparation of the financial statements, the Board have considered each of the above mentioned risks and uncertainties. Having considered the risks and uncertainties, the Board of Directors believe it is appropriate to prepare the accounts on the going concern basis as a result of the following:
• the Government investment of €875m in EBS during 2010;•the stated intention of the Government to recapitalise the Group to a 10.5% core tier 1 ratio under the base case and 6% under the stress case on the basis of the combined results of the PCAR assumptions and three year projected provisions estimates from Blackrock, before the addition of a conservative capital buffer;•the ability of the Group to deleverage non–core assets;•the continued availability of the Eurosystem and Central Bank of
Ireland financing to enable the Group to meet its immediate and estimated funding requirements for the next year; and• the intention to continue the business and operations of EBS going forward with the objective of preserving value.
Further detail on the risks and uncertainties and going concern basis of preparation can be found in Note 1(c) to the Accounts.
Events Since The Year End•PCAR/PLAR: The PCAR/PLAR exercise was completed in the first quarter of 2011 and it was determined that EBS required €1.5bn of additional capital. The Minister for Finance has stated that this will be made available including, where appropriate, burden sharing with subordinated bondholders.•NAMA: EBS is due to transfer further loans to NAMA during 2011 of approximately €65m. EBS has fully provided for the losses on these assets in the 2010 accounts.•Sale Process: The Minister for Finance announced on 31 March 2011 that there would be a combination of AIB and EBS to form a second “pillar” bank.•LME: The Group undertook a liability management exercise in the first quarter of 2011 which generated a gain of c. €136m.
Subsidiary CompaniesEBS Mortgage Finance (EBSMF) and Haven Mortgages Limited (Haven) are the principal trading subsidiaries of the Society. Both companies are wholly-owned by the Society. EBSMF is a covered bond bank which enables EBS to access liquidity and funding using mortgages as security whilst Haven provides mortgages through the broker intermediary network in Ireland.
DirectorsThe Board consists of twelve Directors of whom ten are Non-Executive Directors and two are full-time executives of the Society. One Director has retired since the publication of the last Annual Report and Accounts, namely Cathal Magee. In line with best corporate governance practice, Ethna Tinney will resign from the Board at the 2011 Annual General Meeting after nine years of service. Details of all Board Directors are set out on pages 16 and 17. The Secretary to the Board is Helen Dooley.
Ann Riordan and Tony Spollen were appointed Non-Executive Directors on 8 January 2009 as nominees of the Minister for Finance under the Irish Government’s Credit Institutions (Financial Support) Scheme 2008 (S.I. No. 411 of 2008). Under the terms of the Government’s investment in EBS by way of SIS, Ms. Riordan and Mr. Spollen are not required to stand for election or re-election by members and, accordingly, are not considered independent within the meaning of the UK Corporate Governance Code1.
The Board has determined that all other Non-Executive Directors are independent in character and judgement and free from any business or other relationship with EBS that could affect their judgement. The Chairman, on appointment, was considered independent within the meaning of the UK Corporate Governance Code.
ContractsThere have been no contracts or arrangements with EBS or its subsidiaries in which a Director of EBS was materially interested and which were significant in relation to the Society’s business.
Directors’ Report
1 The Corporate Governance Code June 2010 issued by the UK Financial Reporting Council

20
Corporate GovernanceEBS is subject to the Central Bank of Ireland’s Corporate Governance Code (Central Bank Code)1 which was introduced on 1 January 2011 and imposes minimum core standards upon all credit institutions licensed by the Central Bank. EBS has been designated a major credit institution by the Central Bank and therefore is obliged to comply with certain additional requirements of the Central Bank Code. The Board’s policy is to comply with the highest standards of Corporate Governance as set out in the Central Bank Code and EBS will be required to submit a compliance statement to the Central Bank at the end of 2011 confirming compliance with the Central Bank Code during 2011. It is also the Board’s policy to accord with the principles of the UK Corporate Governance Code.
Role of the BoardThe Board is responsible to the members and other stakeholders for the overall governance and performance of the Society. In discharging this responsibility, its role is to decide on the strategic direction of the Society, set values and standards and review the effectiveness of management in running the business and achieving the goals it has set.
Matters Reserved for the BoardThe day to day responsibility for the Society’s business rests with management, however, changes to strategy, governance, the risk management framework and material policies require Board approval. Board approval is also required for significant capital expenditure, material transactions and large credit exposures. A detailed schedule of Matters Reserved for the Board forms part of the Board Manual, showing clearly what matters require Board approval. This has recently been updated in conjunction with the Society’s implementation of the Central Bank Code.
Board MeetingsThe Board meets on a scheduled basis and generally once a month, but additional meetings are held at other times as required. The Board met on thirteen occasions in 2010. Written reports, containing a review of business activities, risks and future prospects, are circulated prior to Board meetings. Members of senior management attend, where appropriate, for discussions on their areas of responsibility. A full range of business and strategic issues are considered by the Directors at these meetings, and Directors question, seek additional information and raise any issues that are of concern to them to make informed decisions.
Board CommitteesThere are four permanent sub-committees of the Board (Audit & Compliance, Nomination & Corporate Governance, Remuneration and Risk) which were established to consider certain aspects of business, governance and control in detail. The membership of all committees is reviewed from time to time and the last such review took place in July 2010. Each committee has its own Terms of Reference which are also regularly reviewed. Each committee reports to the Board through its chair at the next scheduled Board meeting after the committee meeting. Reports cover any matters that in the opinion of the committee should be brought to the attention of the Board and any recommendations requiring Board approval and/or action. The key responsibilities of each committee are set out on pages 20 and 21. The full Terms of Reference of these committees may be downloaded from the Society’s website on www.ebs.ie (follow the link under the Corporate Governance section in About Us).
Audit & Compliance CommitteeThis committee is responsible for monitoring the integrity of the financial statements and internal control systems. The committee also assesses the effectiveness of the internal audit and regulatory compliance functions, as well as the independence and objectivity of the external auditors. The committee makes recommendations regarding the appointment, remuneration and terms of engagement of the external auditors. It also makes recommendations regarding the provision of non-audit services by the external auditors. The committee met on six occasions in 2010.
Nomination & Corporate Governance CommitteeThe Nomination & Corporate Governance Committee is responsible for considering issue with regard to the constitution of the Board and all issues in relation to corporate governance and for making recommendations to the Board on these matters. The committee met on five occasions in 2010.
Remuneration CommitteeThe Remuneration Committee is responsible for approving all material remuneration decisions of the Society including the remuneration of the Executive Directors and other senior management. The committee is also responsible for setting performance objectives for the Group Chief Executive and Management Team and for reviewing the Group Chief Executive’s and Management Team’s performance semi-annually, as well as reviewing senior management succession planning. The committee met on six occasions in 2010.
Risk CommitteeThe Board Risk Committee is responsible for identifying, evaluating and monitoring significant risks and opportunities associated with the achievement of EBS’ strategic goals and objectives. The committee makes recommendations in relation to how material risks should be managed, i.e., through prevention, elimination, mitigation, insurance or a combination of these options. It also recommends enhancements to the operation and/or reporting of risk management to the Board where appropriate. The committee assesses the quality, adequacy, resources, scope and nature of the work of the risk function in particular, and the risk management framework in general, of EBS. The committee met on six occasions in 2010.
1 The Central Bank of Ireland’s Corporate Governance Code for Credit Institutions and Insurance Undertakings 2010

21
Transactions CommitteeThe Transactions Committee was dissolved by the Board in July 2010. Prior to this, it was responsible for reviewing and approving documentation in relation to major transactions to be entered into by the Society, such as the Society’s debt programmes. The committee met twice in 2010.
Haven BoardThe Board of Haven monitors the strategy, governance and control of Haven and approves large credit exposures. The Board comprises seven Directors of whom one is an Executive Director, two are Group Executive Directors, one is a Group Non-Executive Director and three are members of Group Management. The Board met on five occasions in 2010.
EBS Mortgage Finance BoardThe Board of EBS Mortgage Finance oversees the governance and control of the covered bond bank, monitors the transfer of assets from EBS Building Society to the bank, approves the issuance of covered bonds and ensures that all laws and regulations in relation to the Asset Covered Securities Act 2001 (as amended) are met. The Board comprises eight Directors; two are Group Executive Directors, two are Independent Non-Executive Directors and four are members of Group Management. The Board met on six occasions in 2010.
Performance Evaluation of the BoardAn evaluation of Board performance is undertaken annually. In 2010, this evaluation was facilitated by an external, independent consultant whose findings were presented to the Board for consideration. Arising from this, follow up actions are agreed and monitored. In 2010, the Chairman also conducted a review of the performance of each Director.
Risk ManagementThe Board of Directors is responsible for the effective management of risks and opportunities and for the system of internal control in the Society and its subsidiaries. Risk is defined as failure to maximise opportunities or capitalise on corporate strengths or failure to foresee or manage events which result in unnecessary material financial loss or damage to the Society’s reputation.
The Society operates a continuous risk management process which identifies and evaluates the key risks facing the Society and its subsidiaries. This process includes an assessment of the effectiveness of internal control, it was in place for the full year under review up to the date of approval of the Accounts, and it accords with the UK Corporate Governance Code.
Risk management facilitates the effectiveness and efficiency of operations, helps ensure the reliability of internal and external reporting and assists in compliance with applicable laws and regulations. The Society operates in a dynamic business environment and, as a result, the risks it faces are continually changing. This was particularly the case over the past year. The system of internal control is designed to ensure that there is thorough and regular evaluation of the nature and extent of risks and the ability of the Society to react accordingly, rather than to eliminate risk. This is done through a process of identification, measurement, monitoring and reporting, which
provides reasonable, but not absolute, assurance against material misstatement or loss.
The Board reviews the effectiveness of the system of internal control on a continuous basis, and is supported in this by the work of two of its sub-committees, namely the Board Risk Committee and the Board Audit & Compliance Committee. The Board Risk Committee supports the Board in identifying potential risks to the strategic objectives of the Society and evaluating the risk management policies and practices which are in place to reduce the likelihood of the risk occurring and/or minimise the impact in the case that the risk event did occur. The Chief Risk Officer has a dotted reporting line to the Chair of the Board Risk Committee. The Board is responsible for setting the risk appetite of the Society. On an ongoing basis, the Board evaluates risk, risk trends and monitors adherence with approved risk limits.
The Board Audit & Compliance Committee supports the Board in reviewing, inter alia, existing internal control mechanisms to assess whether they are performing effectively. Internal Audit provides independent assurance in relation to the effectiveness of the system of internal control to the Board through the Board Audit & Compliance Committee. The Head of Internal Audit reports directly to the Chair of the Board Audit & Compliance Committee. The Compliance and Risk functions also make regular reports to the committee.
It is the role of the Society’s management to implement the Board’s risk appetite as set out in the Risk Appetite Statement and in policies on risk and control. It is also recognised that all employees in the Society and its subsidiaries have responsibility for internal control as part of their accountability for achieving objectives. Employee education and ongoing development programmes are designed to ensure that employees are competent to operate and monitor the system of internal control.
The risk management framework in operation in the Society is set out in detail in Note 39 to the Accounts.
Safety of Employees and CustomersThe Society’s policy is to maintain a safe place and system of work. During 2010, the Society continued to promote a culture of health and safety amongst employees. Key initiatives in 2010 included 2 Tiger Raid desktop exercises, updating of Personal Security & Tiger Raid procedures throughout the year, completion of Hazard Risk Assessments for EBS Branches, introduction of an Anti-Bullying Policy, updating of the Health & Safety Manuals to ensure adherence with relevant legislation and responding to Health & Safety Inspections undertaken by the HSA of a number of our network offices. The Health & Safety Committee met on four occasions in 2010 and reviewed the Health & Safety Policy and adherence to that Policy in 2010.
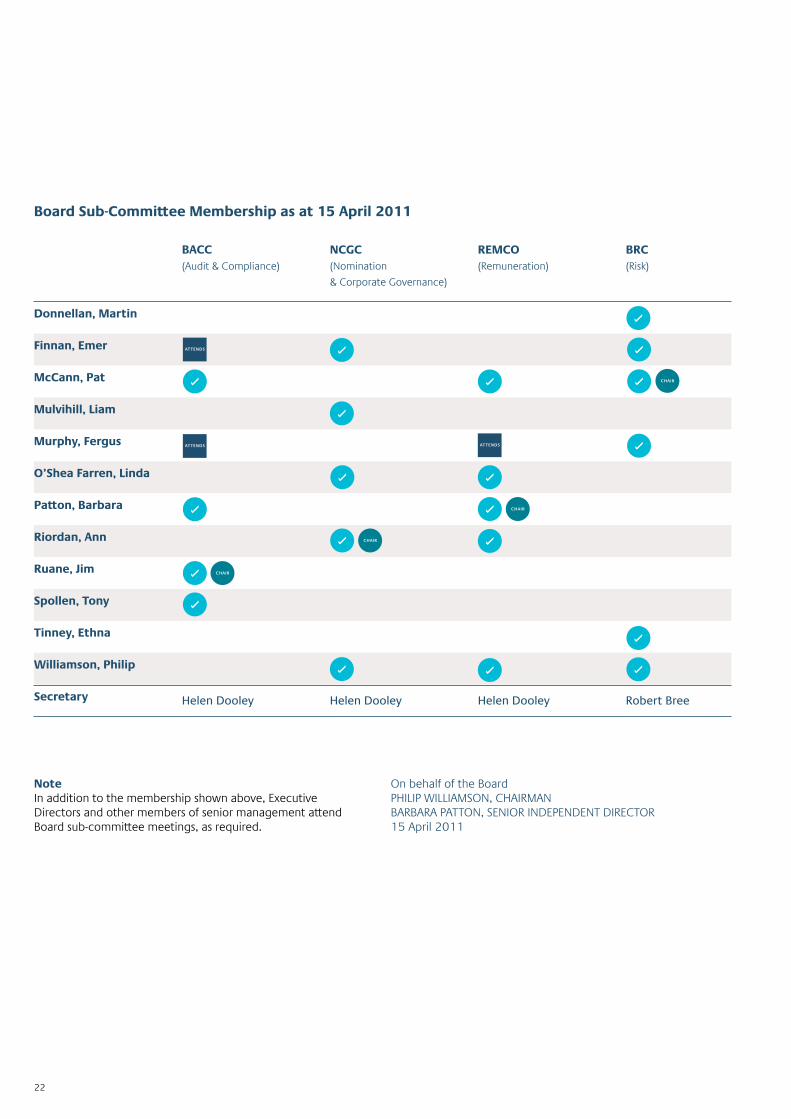
22
Donnellan, Martin Finnan, Emer
McCann, Pat
Mulvihill, Liam
Murphy, Fergus O’Shea Farren, Linda Patton, Barbara Riordan, Ann Ruane, Jim Spollen, Tony Tinney, Ethna Williamson, Philip Secretary
BACC(Audit & Compliance)
Helen Dooley
NCGC(Nomination
& Corporate Governance)
Helen Dooley
REMCO(Remuneration)
Helen Dooley
BRC(Risk)
Robert Bree
Board Sub-Committee Membership as at 15 April 2011
CHAIR
ATTENDS
ATTENDS
CHAIR
ATTENDS
CHAIR
CHAIR
Note In addition to the membership shown above, Executive Directors and other members of senior management attend Board sub-committee meetings, as required.
On behalf of the BoardPHILIP WILLIAMSON, CHAIRMANBARBARA PATTON, SENIOR INDEPENDENT DIRECTOR15 April 2011
23
In 2010, the Remuneration Committee was made up of the following Non-Executive Directors: Barbara Patton (Chair), Linda O’Shea Farren (who joined the Committee in September 2010), Ann Riordan and Philip Williamson. The Group Chief Executive and the Director – People, Operations, IT and Communications normally attend, except when their own performance reviews and remuneration are being discussed. The Committee considers all aspects of remuneration paid to senior executives and makes recommendations to the Board on remuneration policy and succession planning. It also approves, on behalf of the Board, the specific remuneration of all Executive Directors and members of the Management Team. The Committee has a minimum of four scheduled meetings a year and met on five occasions in 2010. It is the policy of the Committee to engage external independent consultants to advise the Committee on appropriate remuneration policy for senior executives. Remuneration PolicyThe Society continued the suspension of management bonuses and general pay increases in 2010. Therefore it was decided not to conduct the normal independent external review of executive remuneration in 2010 until the CRD1 III and CEBS2 Guidelines on remuneration have been assessed and implemented.
Remuneration Package for Executive DirectorsThe remuneration package for Executives comprises the following elements: • Base Salary – This is paid monthly and set at a level to recognise the role and responsibilities carried out by the individual. Base salary levels are reviewed annually by the Remuneration Committee. • A Performance Related Annual Bonus Plan – This bonus is suspended for the duration of the Government Guarantee Scheme. • Long Term Incentive Plan (LTIP) – This bonus is suspended for the duration of the Government Guarantee Scheme.
• Pension Plan – There are currently no Executive Directors in the Defined Benefit Pension Plan. The Society makes payments to personal defined contribution schemes on behalf of Fergus Murphy and Emer Finnan. No service contract exists between the Society and any Director which provides for a notice period of greater than one year.
Report of the Remuneration Committee
1 Capital Requirements Directive 2 Committee of European Banking Supervisors (now the European Banking Authority)

24
NAME
Fergus Murphy Emer Finnan1
Alan Merriman 2
Tony Moroney 3
SALARY
2010 2009
380.0 465.0
275.0 238.6
613.2
591.3
ANNUAL BONUS 2010 2009
– –
– –
BENEFITS
2010 2009
53.4 40.8
35.3 31.8
16.5
23.8
TOTAL SHORT TERM BENEFITS
2010 2009
433.4 505.8 310.3 270.4
629.7
615.1
LONG TERM INCENTIVE 2010 2009
– –
– –
TOTAL 2010 2009
433.4 505.8
310.3 270.4
629.7
615.1
Executive Director Remuneration 2010
1 Emer Finnan was appointed Finance Director by the Board in 2009, received regulatory approval in February 2010, and her salary was increased to reflect the new role.2 Alan Merriman ceased to be a Director of EBS Building Society on 10 March 2009.3 Tony Moroney retired as a Director of EBS Building Society on 29 May 2009. He remained a Director of a subsidiary (Haven Mortgages Ltd.) until 9 September 2009 and his remuneration until that date is included above.
Benefits provided to the Executive Directors were the provision of car allowances, contributions to health insurance, subsidised home loans and club subscriptions. Subsidised home loans to Executive Directors are on the same terms and conditions as loans to other eligible EBS management and staff. Executive Directors do not receive any additional reward for their work as members of the EBS Board of Directors.
The two Executive Directors have personal defined contribution pension schemes. In 2010, €242,292 was paid to a defined contribution scheme on behalf of Fergus Murphy, and €69,000 was paid on behalf of Emer Finnan.
BARBARA PATTONCHAIR REMUNERATION COMMITTEE15 April 2011
2010 Non-Executive Director RemunerationThe Committee also recommends to the Board the level of fees for Non-Executive Directors. The remuneration of the Non-Executive Directors in 2010 is set out below:
Philip Williamson 1
(Chairman)
Martin Donnellan Pat McCann Liam Mulvihill
Linda O’Shea Farren Barbara Patton Ann Riordan Jim Ruane Anthony Spollen Ethna Tinney Mark Moran 2
Cathal Magee 3 Total
2010 €’000
109
29
29
29
29
29
29
36
29
29
-
21
398.0
2009 €’000
80.5
15.7
37.5
37.5
15.7
37.5
37.5
52.0
37.5
37.5
45.4
46.5
480.9
1 Philip Williamson was Chairman for the full year in 20102 Mark Moran left the Board on 31 May 2009 3 Cathal Magee left the Board on 31 July 2010
(Chair of Audit & Compliance Committee)

25
Statement of Directors’ Responsibilities
The Building Societies Act 1989 (as amended) requires the Directors to prepare financial statements for each financial year which give a true and fair view of the state of affairs of the Society and the Group and of the income and expenditure and cash flow statement of the Society and the Group for that period. The Directors have prepared the financial statements in accordance with International Financial Reporting Standards (IFRS) and IFRIC Interpretations endorsed by the European Union and with those parts of the Buildings Societies Act applicable to organisations reporting under IFRS.
In preparing these financial statements, the Directors are required to: • Select suitable accounting policies and then apply them consistently; • Make judgements and estimates that are reasonable and prudent; and
• Prepare the financial statements on a going concern basis unless it is inappropriate to presume that the Society and the Group will continue in business. The Directors are responsible for keeping proper accounting records which disclose with reasonable accuracy at any time the financial position of the Society and the Group and which enables them to ensure that the financial statements comply with the Building Societies Act. They are also responsible for safeguarding the assets of the Society and of the Group and for taking reasonable steps for the prevention and detection of fraud and other irregularities.
26
Independent Auditor’s Report to the Members of EBS Building Society
We have audited the Group and Society financial statements (the ‘‘financial statements’’) of EBS Building Society for the year ended 31 December 2010, which comprise the Group and Society Income Statements, the Group and Society Statements of Comprehensive Income, the Group and Society Statements of Financial Position, the Group and Society Statements of Cash Flows, the Group and Society Statements of Changes in Shareholders’ Equity and the related Notes 1 to 47. These financial statements have been prepared under the accounting policies set out therein. This report is made solely to the Society’s Members, as a body, in accordance with section 88(1) of the Building Societies Act 1989 (as amended). Our audit work has been undertaken so that we might state to the Society’s Members those matters we are required to state to them in an auditor’s report and for no other purpose. To the fullest extent permitted by law, we do not accept or assume responsibility to anyone other than the Society and the Society’s Members as a body, for our audit work, for this report, or for the opinions we have formed. Respective responsibilities of Directors and AuditorThe statement of Directors’ responsibilities on page 25 sets out the Directors’ responsibilities for preparing the Directors’ Report and the Group and Society financial statements in accordance with applicable Irish law and International Financial Reporting Standards (IFRS’s) as adopted by the European Union (EU). Our responsibility is to audit the financial statements in accordance with relevant legal and regulatory requirements and International Standards on Auditing (UK and Ireland). We report to you our opinion as to whether the financial statements give a true and fair view in accordance with IFRS’s adopted by the EU and have been properly prepared in accordance with the Building Societies Act 1989 (as amended). We also report to you, in our opinion, whether proper books of account have been kept by the Society; whether proper returns have been received from branches and agents not visited by us; and whether the information given in the Directors’ Report is consistent with the financial statements.
In addition, we state whether we have obtained all the information and explanations necessary for the purposes of our audit, and whether the Group and Society financial statements are in agreement with the books of account. We also report to you if, in our opinion, any information specified by law regarding Directors’ remuneration and Directors’ transactions is not disclosed and, where practicable, include such information in our report. We read the other information contained within the Annual Report and Accounts and consider whether it is consistent with the audited financial statements. The other information comprises only the Chairman’s Review, the Chief Executive’s Review, the Finance Director’s Review, the Directors’ Report and the Report of the Remuneration Committee and consider implications for our report if we become aware of any apparent misstatements within it. Our responsibilities do not extend to any other information. Basis of audit opinionWe conducted our audit in accordance with International Standards on Auditing (UK and Ireland) issued by the Auditing Practices Board. An audit includes examination, on a test basis, of evidence relevant to the amounts and disclosures in the financial statements. It also includes an assessment of the significant estimates and judgments made by the Directors in the preparation of the financial statements, and of whether the accounting policies are appropriate to the Group’s and Society’s circumstances, consistently applied and adequately disclosed. We planned and performed our audit so as to obtain all the information and explanations which we considered necessary in order to provide us with sufficient evidence to give reasonable assurance that the financial statements are free from material misstatement, whether caused by fraud or other irregularity or error. In forming our opinion we also evaluated the overall adequacy of the presentation of information in the financial statements. OpinionIn our opinion: • the financial statements give a true and fair view, in accordance with IFRS’s as adopted by the EU, of the state of the Group’s and Society’s affairs as at 31 December 2010 and of the Group and Society’s loss for the year then ended;
• the financial statements have been properly prepared in accordance with the Building Societies Act 1989 (as amended). Emphasis of matter – going concernIn forming our opinion on these financial statements, which is not qualified, we have considered the adequacy of the disclosures in the Basis of Preparation in Note 1 to the financial statements. These disclosures set out a number of material economic, political and market risks and uncertainties that impact the Irish banking system which may cast significant doubt upon the Group and Society’s ability to continue as a going concern. These include the Group and Society’s continuing ability to access funding from the Eurosystem and the Central Bank of Ireland to meet its liquidity requirements and its ability to raise additional capital to meet its required regulatory capital ratios.

27
These matters, together with the options available to the Group and Society, have been considered by the Directors in concluding that it is appropriate to prepare the financial statements on a going concern basis. Other mattersWe have obtained all the information and explanations which we considered necessary for the purposes of our audit. In our opinion proper books of account have been kept by the Society and proper returns have been received from the branches and agents of the Society not visited by us. The financial statements of the Society are in agreement with the books of account and the aforementioned returns.
In our opinion the information given in the Directors’ Report is consistent with the financial statements. KPMGChartered Accountants,Registered Auditor,1 Harbourmaster Place,IFSC,Dublin 1. 15 April 2011


Accounts

30
Group and Society Income Statement
Society Group
2010 2009 Notes 2010 2009 €m €m €m €m
731.8 888.8 Interest income 3 751.9 835.3 (662.8) (783.5) Interest expense 3 (621.6) (680.4)
69.0 105.3 Net Interest Income 130.3 154.9 14.5 13.9 Fees and commissions receivable 4 14.5 13.9 (9.5) (12.7) Fees and commissions payable 4 (10.6) (12.7)
5.0 1.2 Non Interest Income 3.9 1.2 8.5 17.3 Profit on sale / repurchase of securities 5 8.5 34.2 (31.0) - Loss on sale of loans and advances to subsidiaries 9 - - 16.1 8.6 Other operating income 6 10.1 3.0
67.6 132.4 Total operating income 152.8 193.3 (80.1) (76.2) Administrative expenses 7 (84.4) (82.2) (4.6) (4.9) Amortisation of intangible assets 20 (5.3) (5.6) (4.0) (3.3) Depreciation of property, plant and equipment 19 (4.4) (4.6) (2.3) (5.3) Impairment of property 19 (2.3) (5.3)
(91.0) (89.7) Total operating expenses 7 (96.4) (97.7) (23.4) 42.7 Operating(loss)profitbeforeimpairmentlossesandtaxation 56.4 95.6 (275.6) - Loss on transfer of loans and advances held-for-sale to NAMA 10 (275.6) - (116.8) - Provisions for impairment of loans and advances held-for-sale to NAMA 16 (116.8) - (11.4) 2.5 Provisions for impairment of available-for-sale financial assets 13 (11.4) 2.5 (234.7) (176.7) Provisions for impairment of loans and advances to customers 17 (273.2) (197.4) (45.2) - Provisions for impairment of shares in Group undertakings 18 - -
(683.7) (174.2) Impairment losses (677.0) (194.9) (707.1) (131.5) Operatinglossbeforetaxation (620.6) (99.3) 31.3 24.0 Taxation 8 31.0 20.5
(675.8) (107.5) Loss for the year (589.6) (78.8)
Philip Williamson, ChairmanFergus Murphy, Group Chief ExecutiveEmer Finnan, Finance Director
The loss for the year is wholly attributable to the equity holders of the Group.
The notes on pages 36 to 101 form part of these financial statements
For the year ended 31 December 2010

31
Society Group
2010 2009 Notes 2010 2009 €m €m €m €m
(675.8) (107.5) Loss for the year (589.6) (78.8)
Other comprehensive (loss) income, net of taxation 26.8 (8.0) Netmovementincashflowhedgereserve 8 26.8 (8.0) (497.9) 30.9 Net movement in available-for-sale reserve 8 (181.2) 49.7 (0.2) (8.3) Net movement in revaluation reserve 8 (0.2) (8.3) (3.6) 17.7 Netactuarial(loss)gainonretirementbenefits 8 (3.6) 17.7
(474.9) 32.3 Other comprehensive (loss) income for the year, net of taxation (158.2) 51.1 (1,150.7) (75.2) Total comprehensive loss for the year (747.8) (27.7)
Philip Williamson, ChairmanFergus Murphy, Group Chief ExecutiveEmer Finnan, Finance Director
The notes on pages 36 to 101 form part of these financial statements
Group and Society Statement of Other Comprehensive Income
For the year ended 31 December 2010

32
Society Group
2010 2009 Notes 2010 2009 €m €m €m €m
Philip Williamson, ChairmanFergus Murphy, Group Chief ExecutiveEmer Finnan, Finance Director
The notes on pages 36 to 101 form part of these financial statements
Group and Society Statement of Financial Position
At 31 December 2010
Assets 236.2 180.6 Cash and balances with central banks 11 250.2 196.5 82.5 93.1 Derivative financial instruments 38 58.4 50.0 37.9 750.6 Loans and advances held-for-sale to NAMA 16 37.9 750.6 3,943.2 3,972.2 Available-for-sale financial assets 13 2,575.2 2,924.8 305.9 - NAMA senior bonds 14 305.9 - 2,981.3 3,717.4 Loans and advances to credit institutions 15 180.8 957.7 10,865.9 11,659.8 Loans and advances to customers 17 16,472.9 16,473.5 4.5 4.5 Current taxation asset 21 4.5 4.7 82.3 31.5 Deferred taxation asset 22 82.4 28.9 74.2 58.0 Other assets 23 63.9 55.2 17.7 19.9 Intangible assets 20 21.9 24.8 345.5 267.5 Shares in Group undertakings 18 - - 32.2 37.9 Property, plant and equipment 19 32.9 38.9
19,009.3 20,793.0 Total assets 20,086.9 21,505.6 Liabilities 4,880.0 2,500.0 Deposits by central banks 24 4,880.0 2,500.0 1,139.6 2,183.9 Deposits by credit institutions 25 876.2 1,933.9 10,621.3 11,082.8 Customer accounts 26 9,420.8 9,830.2 155.2 193.6 Derivative financial instruments 38 136.4 163.9 11.6 11.5 Current taxation liabilities 28 11.6 11.6 302.3 319.7 Other liabilities 30 256.2 293.8 1,567.7 3,895.5 Debt securities in issue 27 3,568.0 5,889.8 0.3 0.2 Deferred taxation liabilities 29 9.8 9.7 17.4 17.0 Retirement benefit liabilities 31 17.4 17.0 218.2 215.2 Subordinated liabilities 34 218.2 215.2
18,913.6 20,419.4 Totalliabilities 19,394.6 20,865.1 Shareholders’equity 623.7 - Special investment shares 32 623.7 - 249.1 - Capital contribution 33 249.1 - 0.1 0.3 Revaluation reserve 0.1 0.3 (520.6) (22.7) Available-for-sale reserve (185.1) (3.9) (38.1) (64.9) Cash flow hedge reserve (38.1) (64.9) (218.5) 460.9 General reserve (39.7) 463.8
95.7 373.6 Shareholders’equity 610.0 395.3 - - Non controlling interests 35 82.3 245.2
19,009.3 20,793.0 Totalliabilitiesandshareholders’equity 20,086.9 21,505.6

33
Society Group
2010 2009 Notes 2010 2009 €m €m €m €m
Cashflowsfromoperatingactivities (675.8) (107.5) Loss for the year (589.6) (78.8) Adjustmentsfor: 4.0 3.3 Depreciation of property, plant and equipment 19 4.4 4.6 4.6 4.9 Amortisation of intangibles 20 5.3 5.6 362.9 174.2 Provisions for impairment of financial assets 13,17 401.4 194.9 2.3 5.3 Impairment of property 2.3 5.3 275.6 - Loss on disposal of loans and advances held-for-sale to NAMA 275.6 - 45.2 - Provisions for impairment of shares in Group undertakings 18 - - 2.3 4.0 Pension expense 2.4 4.0 (4.0) (36.7) Fair value movement on hedging derivatives 3 2.0 (3.8) (23.8) (13.5) Fair value movement on hedged items (37.9) 13.9 (31.3) (24.0) Income tax credit 8 (31.0) (20.5) 5.7 6.8 Interest expense on subordinated liabilities 5.7 6.8
(32.3) 16.8 Operatingincomebeforechangesinworkingcapitalandprovisions 40.6 132.0 588.1 (113.9) Net decrease (increase) in loans and advances to credit institutions 478.2 (117.0) 0.2 (0.1) Net (increase) decrease in mandatory reserve balance 0.3 (0.1) 553.2 1,010.6 Net decrease (increase) in loans and advances to customers (278.6) (443.0) 14.5 - Net decrease in held-for-sale financial assets to NAMA 14.5 - (16.2) 54.9 Net (increase) decrease in other assets (8.7) 12.4 2,380.0 1,197.0 Net increase in deposits from central banks 2,380.0 1,197.0 (1,040.9) (2,867.0) Net (decrease) in deposits from credit institutions (1,054.3) (2,867.0) (461.7) (301.7) Net (decrease) increase in amounts due to customers (409.6) (295.0) (42.9) (34.9) Increase (decrease) in other liabilities (87.5) (31.4) - 0.1 Other non cash movements (0.1) (0.3) 10.2 (6.9) Effect of exchange translations and other adjustments 10.2 (6.8)
1,952.2 (1,045.1) Cash(usedin)generatedfromoperationsbeforetaxation 1,085.0 (2,419.2) 0.7 0.2 Income taxes refunded 0.1 0.3
1,952.9 (1,044.9) Netcashgeneratedfrom(usedin)operatingactivities 1,085.1 (2,418.9)
Cashflowsfrominvestingactivities (0.9) (4.5) Purchase of property, plant and equipment 19 (1.0) (4.3) (2.4) (3.3) Purchase of intangible assets 20 (2.4) (3.5) 0.1 - Proceeds from disposal of property, plant and equipment 0.1 4.0 (123.2) (100.0) Investments in subsidiaries 18 - - - 85.3 Net decrease (increase) in held-to-maturity financial assets - 85.3 (136.3) 338.4 Net decrease (increase) in available-for-sale financial assets 526.9 (114.2)
(262.7) 315.9 Netcashinflow(outflow)frominvestingactivities 523.6 (32.7)
Cashflowsfromfinancingactivities 1,025.0 2,720.0 Issuance of debt securities 1,025.0 3,761.3 623.7 - Issuance of special investment shares 623.7 - (3,330.5) (1,389.5) Redemption of debt securities (3,328.4) (1,544.6) - - Cost of redemption of non controlling interests (73.2) - (5.7) (6.8) Interest expense on subordinated liabilities (5.7) (6.8)
(1,687.5) 1,323.7 Netcashinflow(outflow)fromfinancingactivities (1,758.6) 2,209.9
2.7 594.7 Netincrease(decrease)incashandcashequivalents (149.9) (241.7) 3,425.6 2,830.9 Cash and cash equivalents at 1 January 791.7 1,033.4
3,428.3 3,425.6 Cashandcashequivalentsat31December 12 641.8 791.7
The notes on pages 36 to 101 form part of these financial statements
Group and Society Statement of Cash Flows
For the year ended 31 December 2010
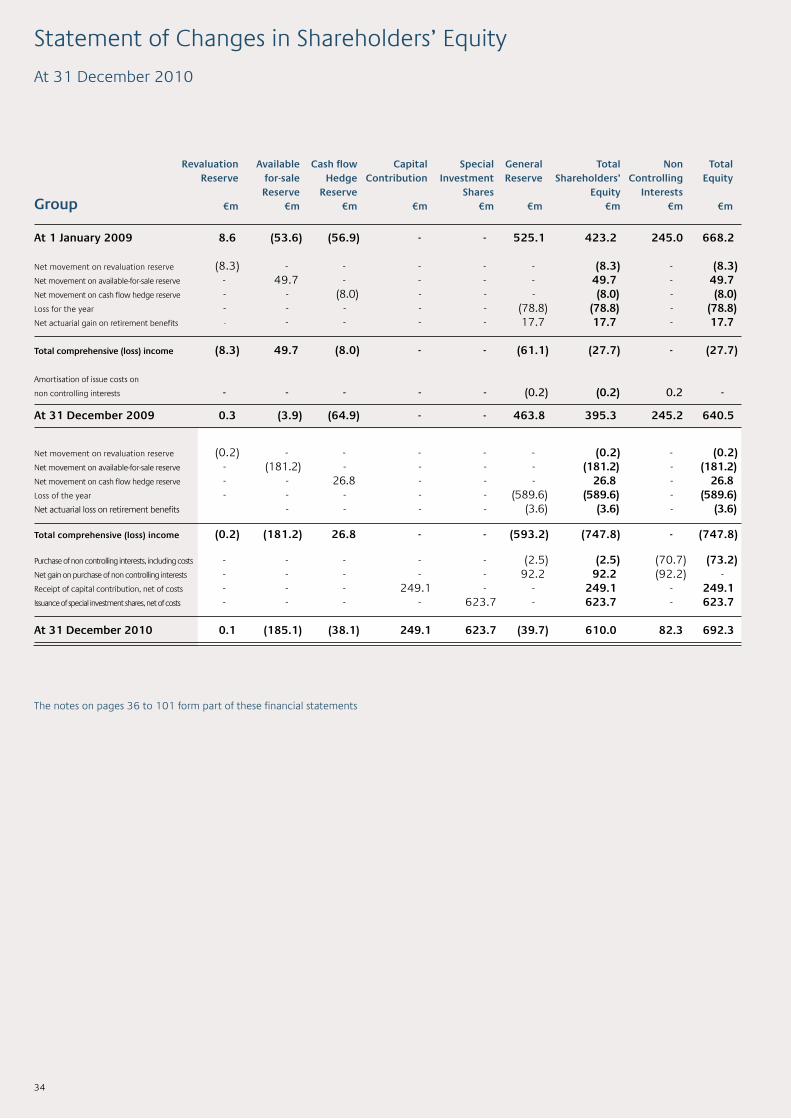
34
The notes on pages 36 to 101 form part of these financial statements
Statement of Changes in Shareholders’ Equity
At 31 December 2010
At 1 January 2009 8.6 (53.6) (56.9) - - 525.1 423.2 245.0 668.2 Net movement on revaluation reserve (8.3) - - - - - (8.3) - (8.3) Net movement on available-for-sale reserve - 49.7 - - - - 49.7 - 49.7 Net movement on cash flow hedge reserve - - (8.0) - - - (8.0) - (8.0) Loss for the year - - - - - (78.8) (78.8) - (78.8) Net actuarial gain on retirement benefits - - - - - 17.7 17.7 - 17.7
Total comprehensive (loss) income (8.3) 49.7 (8.0) - - (61.1) (27.7) - (27.7) Amortisation of issue costs on
non controlling interests - - - - - (0.2) (0.2) 0.2 -
At31December2009 0.3 (3.9) (64.9) - - 463.8 395.3 245.2 640.5
Net movement on revaluation reserve (0.2) - - - - - (0.2) - (0.2) Net movement on available-for-sale reserve - (181.2) - - - - (181.2) - (181.2) Net movement on cash flow hedge reserve - - 26.8 - - - 26.8 - 26.8 Loss of the year - - - - - (589.6) (589.6) - (589.6) Net actuarial loss on retirement benefits - - - - (3.6) (3.6) - (3.6)
Total comprehensive (loss) income (0.2) (181.2) 26.8 - - (593.2) (747.8) - (747.8) Purchase of non controlling interests, including costs - - - - - (2.5) (2.5) (70.7) (73.2) Net gain on purchase of non controlling interests - - - - - 92.2 92.2 (92.2) - Receipt of capital contribution, net of costs - - - 249.1 - - 249.1 - 249.1 Issuance of special investment shares, net of costs - - - - 623.7 - 623.7 - 623.7
At31December2010 0.1 (185.1) (38.1) 249.1 623.7 (39.7) 610.0 82.3 692.3
Group
Revaluation Available Cashflow Capital Special General Total Non Total Reserve for-sale Hedge Contribution Investment Reserve Shareholders’ Controlling Equity Reserve Reserve Shares Equity Interests €m €m €m €m €m €m €m €m €m
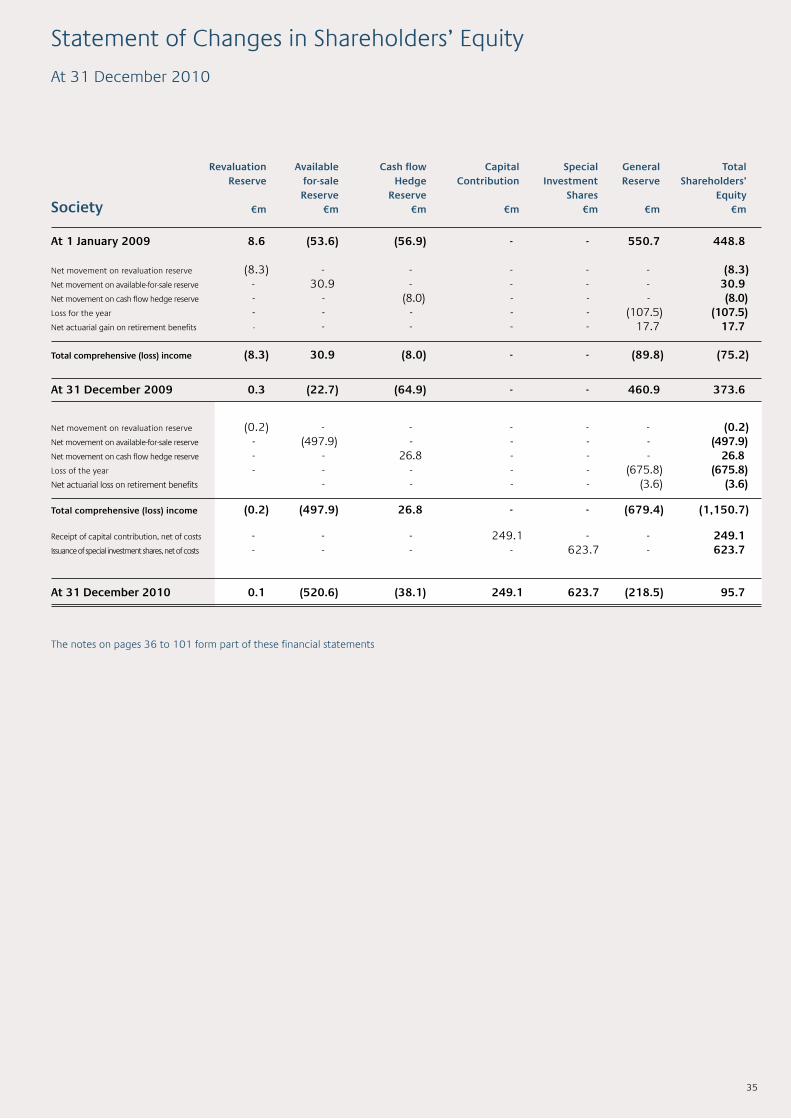
At 1 January 2009 8.6 (53.6) (56.9) - - 550.7 448.8 Net movement on revaluation reserve (8.3) - - - - - (8.3) Net movement on available-for-sale reserve - 30.9 - - - - 30.9 Net movement on cash flow hedge reserve - - (8.0) - - - (8.0) Loss for the year - - - - - (107.5) (107.5) Net actuarial gain on retirement benefits - - - - - 17.7 17.7
Total comprehensive (loss) income (8.3) 30.9 (8.0) - - (89.8) (75.2)
At31December2009 0.3 (22.7) (64.9) - - 460.9 373.6
Net movement on revaluation reserve (0.2) - - - - - (0.2) Net movement on available-for-sale reserve - (497.9) - - - - (497.9) Net movement on cash flow hedge reserve - - 26.8 - - - 26.8 Loss of the year - - - - - (675.8) (675.8) Net actuarial loss on retirement benefits - - - - (3.6) (3.6)
Total comprehensive (loss) income (0.2) (497.9) 26.8 - - (679.4) (1,150.7) Receipt of capital contribution, net of costs - - - 249.1 - - 249.1 Issuance of special investment shares, net of costs - - - - 623.7 - 623.7
At31December2010 0.1 (520.6) (38.1) 249.1 623.7 (218.5) 95.7
35
The notes on pages 36 to 101 form part of these financial statements
Statement of Changes in Shareholders’ Equity
At 31 December 2010
Revaluation Available Cashflow Capital Special General Total Reserve for-sale Hedge Contribution Investment Reserve Shareholders’ Reserve Reserve Shares Equity €m €m €m €m €m €m €m Society
36
1. ACCOUNTING POLICIES (a) Corporate information The Group consists of EBS Building Society (the ‘Society’) a building society registered and domiciled in the Republic of Ireland and its subsidiaries. The principal activities of the Group are described in note 2. The financial statements have been drawn up in accordance with the Building Societies Act 1989 (as amended) and the European Communities (Credit Institutions: Accounts) Regulations, 1992 as amended by the European Communities (International Financial Reporting Standards and Miscellaneous Amendments) Regulations 2005 which implemented the EU Directive on annual accounts of financial institutions. (b) Statement of compliance The financial statements have been prepared in accordance with International Financial Reporting Standards and International Financial Reporting Interpretations Committee as issued by the International Accounting Standards Board and adopted by the European Union (IFRS). The financial statements also comply with those parts of the Building Societies Act 1989 (as amended) applicable to organisations reporting under IFRS and the Statutory Instrument No: 220 – European Communities (Statutory Audits) (Directive 2006/43/EC), transposed in 2010. (c) Basis of preparation The financial statements have been prepared on an historical cost basis, except for freehold properties, available-for-sale financial assets and derivative contracts all of which are measured at fair value. The carrying value of recognised assets and liabilities that are hedged are adjusted to record changes in the fair value attributable to the risks that are being hedged. The financial statements are prepared in euro (‘€’) and all values are rounded to the nearest one hundred thousand (€0.1m) except where otherwise indicated. The preparation of financial statements in conformity with IFRS requires management to make judgements, estimates and assumptions that affect the application of policies and reported amounts of assets and liabilities, income and expenses. The estimates and associated assumptions are based on historical experience and various other factors that are believed to be reasonable under the circumstances, the results of which form the basis of making the judgements about carrying values of assets and liabilities that are not readily apparent from other sources. Actual results may differ from these estimates. The estimates and underlying assumptions are reviewed on an ongoing basis. Revisions to accounting estimates are recognised in the period in which the estimate is revised if the revision affects only that period, or in the period of the revision and future periods if the revision affects both current and future periods. The impairment provisioning methodology is regularly reviewed in light of the changing economic environment. During the year the rates of expected repossession given default were amended in addition to assumptions for unemployment and GDP. The critical accounting judgements and estimates set out below in note 1(d) have been applied consistently to all periods presented in these consolidated financial statements. These have also been applied consistently by Group entities.
MaterialRisksandUncertainties andGoingConcernBasisofPreparation In determining the appropriateness of adopting the going concern basis of preparation for the Group’s financial statements, the Directors have taken into consideration the economic, political and market risks and uncertainties currently impacting Irish financial institutions and the Group. In particular these relate to challenges in terms of liquidity, funding and capital. Having regard to these risks and uncertainties, and the steps taken by the Group to address them, the Directors are satisfied that it continues to be appropriate to prepare the Group’s financial statements on a going concern basis. In the current year the Directors have considered the following risks and uncertainties: (1) Economic Environment The Group is exposed to the inherent risk arising from the macro economic conditions in Ireland. The challenges presented by the Irish economy throughout 2010 significantly and adversely affected the Group’s financial performance in the current year and presents significant risks and challenges for the foreseeable future. Demand for property (both residential and commercial) has remained weak and is at very low levels as demonstrated by the size of the overall mortgage market for residential property in 2010 of approximately €5.8bn. Both commercial and residential property prices continued to fall in 2010 and further deterioration could adversely affect the Group’s financial results going forward as it impacts provisioning and capital. (2) Government Policy Risks Given the current economic environment in Ireland the Group is also exposed to government policy risk. (3) JointEU-IMFProgrammeforIreland On 28 November 2010 the European Union (‘EU’) and the International Monetary Fund (‘IMF’) agreed to provide an €85bn programme (‘the Programme’) of support for Ireland. The Programme is designed to facilitate the return of the Irish economy to sustainable growth and a properly functioning banking system focussed on supporting the recovery of the economy. Up to €35bn will be made available to the banking system for immediate recapitalisation and a further €25bn will be available on a contingency basis. The Programme has two elements, the first deals with bank restructuring and re-organisation and the second deals with fiscal policy and structural reform. The Programme for recovery of the banking system is expected to be an intensification of the measures already adopted by the Government. The Programme provides for the recapitalisation, fundamental downsizing, restructuring and re-organisation of the banking sector in Ireland. (4) CreditInstitutions(Stabilisation)Act2010 The Credit Institutions (Stabilisation) Act 2010 provides the legislative basis for the re-organisation and restructuring of the Irish banking system agreed in the Programme. The Act applies to Banks, Building Societies and Credit Unions who have received financial support from the State. The Act provides broad powers to the Minister for Finance (in consultation with the Governor of the Central Bank of Ireland) to act on financial stability grounds to effect the restructuring actions and recapitalisation measures envisaged in the Programme. This allows the Minister to take the actions required to bring about a domestic retail bank system that is proportionate to and focussed on the Irish economy.
Notes to the Financial Statements 31 December 2010
37
(5) Liquidity,Credit,FundingandOtherRisks Like all financial institutions the Group is subject to significant liquidity, credit, funding, capital, operational and other risks. There has been a more significant increase in liquidity and funding risks over the past year, which reflect factors that are specific to the Irish banking industry. The Group’s ability to access market funding has significantly weakened during the year. The Group’s access to and cost of borrowing is influenced by its credit ratings. Both Irish Sovereign and Financial Institution downgrades, including that of EBS, have limited the Group’s ability to access the capital markets and therefore impacted funding plans. During 2010 EBS initiated several funding contingency measures to create pools of collateral from existing assets to assist in accessing secured funding from both market counterparties and Monetary Authorities. While the Government Guarantee Schemes put in place in 2008 and 2010 have eased the liquidity challenge, there continues to be significant ongoing liquidity pressures for the Group and the Irish banking system generally. These challenges gave rise to liquidity breaches in December 2010 and further breaches in 2011. Any further reduction in the Group’s credit ratings could adversely affect access to liquidity and cost of funding and have a negative impact on the Group’s financial condition. (6) Reliance on Monetary Authority The continued deterioration of the Irish economy throughout 2010, the EU/IMF bailout package, the Sovereign and Financial Institutions downgrades, a continued lack of market access and the loss of deposits in the Irish banking sector generally have created very significant funding challenges for Irish Financial Institutions, including EBS. As a consequence, Financial Institutions have increased borrowings from Monetary Authorities including the European Central Bank and the Central Bank of Ireland. At 31 December 2010 the Group had €3.4bn of collateralised funding from the ECB and €1.5bn of collateralised funding from the Central Bank of Ireland. (7) Capital The Group is required by the Central Bank to maintain adequate capital and the Group is subject to the risk of having insufficient capital resources to meet minimum regulatory capital requirements. In addition, those minimum regulatory capital requirements may increase in the future and the Central Bank may change the manner in which it applies its existing regulatory requirements as evidenced through the PCAR 2011 process. Any failure by the Group to maintain its minimum regulatory capital ratios could have a material adverse impact on the Group. The Building Societies Act was amended in 2009 to enable the Minister to provide capital to a building society in the form of Special Investment Shares (SIS). In addition, in December 2009, EBS held a Special General Meeting (SGM) for members to vote on changing the Society’s rules to allow the issue of these shares and the customers voted in favour of this proposal. The SIS constitutes Core Tier 1 capital of the Society. The Central Bank conducted an initial Prudential Capital Assessment Review (‘PCAR’) in March 2010 and determined that EBS required €875m in capital by 31 December 2010 to achieve a Core Tier 1 ratio of 8%. During 2010 the Society received €625m in the form of SIS and €250m in the form of a capital contribution bringing the total capital from Government to €875m.
The SIS conveys significant rights to the Minister in recognition of the capital contribution the Government provided through investing in the shares. The SIS essentially grants the Minister majority voting rights in the Society. The Government’s recapitalisation of the Society by €875m in the form of a capital contribution and SIS was to bring the Society in line with the Central Bank’s revised regulatory Core Tier 1 minimum of 8% by December 2010. In addition as part of the EU/IMF agreement it was determined that Irish Banks should have sufficient capital in 2011 to achieve a target Core Tier 1 ratio of 12%. Following this agreement it was announced that EBS would require an additional €438m of capital in order to achieve the target Core Tier 1 ratio of 12%. In January 2011 the Central Bank initiated a Financial Measures Programme, which incorporated a PCAR and Prudential Liquidity Assessment Review (‘PLAR’). Under the PCAR the Central Bank determined that Irish Banks are required to achieve a 10.5% Core Tier 1 ratio under the Base Case and 6% under the Stress Case. On 31 March 2011, the Minister for Finance confirmed that the Banks will be recapitalised to the levels required under the PCAR, including where appropriate burden sharing with subordinated bondholders. (8) PCARandPLAR The PCAR and PLAR reviews are a key component of the Joint EU/IMF Programme which are designed to identify measures to reform the Irish banking system to facilitate a move towards a smaller more proportionate banking system. The PCAR exercise enabled the Central Bank to perform a thorough and conservative assessment of Banks’ asset quality and earnings together with incorporating incremental three year projected provisions estimates based on Blackrock identified stress loan losses. The inclusion of projected losses under the Stress Case ensures that the Banks will hold capital to meet potential future losses at an early stage. This goes well beyond the impairment provisioning methodology required under the International Accounting Standards. An additional element of conservatism was also applied through the requirement to achieve a 10.5% Core Tier 1 capital ratio under Base and a 6% Core Tier 1 ratio under Stress as well as an additional protective buffer. The protective buffer is designed to introduce an additional layer of resilience and to recognise the possibility of additional loan losses after the three year period. The PLAR exercise outlines the measures to be implemented to steadily deleverage the banking system and reduce reliance on the funding from Monetary Authorities. The PLAR exercise established a target funding and loan to deposit ratio for the aggregate domestic banking system, including EBS, of 122.5% and consequently in order to reach the targeted ratio EBS is required to deleverage €2.5bn of non-core assets (comprising the commercial and buy-to-let books) over the period to 2013. It was announced on 31 March 2011 that EBS requires €1.2bn of capital to meet the new target Core Tier 1 capital ratio of 10.5% under Base and 6% under Stress on the basis of the combined results of the PCAR assumptions and three year projected provisions estimates from Blackrock, before the addition of a conservative capital buffer. The additional capital buffer of €0.3bn was determined with €0.1bn representing equity and €0.2bn representing contingent capital. This brings the total capital requirement for EBS under the PCAR to €1.5bn. On 31 March 2011, the Minister for Finance confirmed that the Banks will be recapitalised to the levels required under the PCAR, including where appropriate burden sharing with subordinated bondholders. The Central Bank has indicated that capital must be raised by 31 July 2011.
Notes to the Financial Statements 31 December 2010
38
1. ACCOUNTING POLICIES (cont’d) (c) Basis of preparation (cont’d) (9) Sale Process EBS was engaged in a sale process throughout 2010 following the submission of the EU restructuring plan in May 2010. It was confirmed by the National Treasury Management Agency on 30 March 2011 that the sale process was terminated following a decision by the Minister. On 31 March 2011, the Minister for Finance announced the future banking landscape in Ireland and its intention to combine the operations of EBS and AIB to build a second pillar bank from the strengths of both institutions. Going Concern Basis of Preparation The financial statements have been prepared on a going concern basis. In making its assessment of the Group’s ability to continue as a going concern, the Board of Directors have taken into consideration the material risks and uncertainties that could impact the Group’s ability to continue as a going concern including those relating to:• The period over which the Irish economy recovers from the current crisis.• The implementation by the Irish Government of the joint EU/ IMF programme for Ireland.• The impact of actions taken by the Minister for Finance on financial stability grounds under the Credit Institutions (Stabilisation) Act 2010.• The Group’s access to liquidity and funding and the continued availability of the Eurosystem and Central Bank of Ireland financing.• The ability of the Group to meets its targeted regulatory ratios under PCAR and to raise additional required capital.• The ability of the Group to dispose of assets to meet PLAR targets set by the Central Bank of Ireland. In assessing the going concern basis of preparation of the financial statements the Board have considered each of the above mentioned risks and uncertainties. Having considered the risks and uncertainties the Board of Directors believe it is appropriate to prepare the accounts on the going concern basis as a result of the following: • The Government investment of €875m in EBS during 2010;• The stated intention of the Government to recapitalise the Group to a 10.5% Core Tier 1 ratio under the Base Case and 6% under the Stress Case on the basis of the combined results of the PCAR assumptions and three year projected provisions estimates from Blackrock, before the addition of a conservative capital buffer, including where appropriate burden sharing with subordinated bondholders;• The ability of the Group to deleverage non-core assets;• The continued availability of the Eurosystem and Central Bank of Ireland financing to enable the Group to meets its immediate and estimated funding requirements for the next year; and• The intention to continue the business and operations of EBS going forward with the objective of preserving value. (d) Critical accounting judgements and estimates The Group’s financial statements have been prepared in accordance with IFRS. In preparing these accounts, management is required to select suitable accounting policies and make judgements and estimates that are reasonable and prudent. Full details of the significant accounting policies are set out below.
The Group believes that, of its significant accounting policies and estimation techniques, the following may involve a higher degree of judgement and complexity. (1)Impairmentlossesonloansandadvances The Group lends money by means of secured residential and commercial lending. Where there is a risk that the Group will not receive full repayment of the amount advanced, provisions are made in the financial statements to reduce the carrying value of loans and advances to the amount expected to be recovered. Management reviews the Group’s loan portfolios to assess impairment at least quarterly. Impairment loss calculations involve the estimation of future cash flows of loans and advances based on observable data at the reporting date and historical loss experience for assets with similar credit risk characteristics. These calculations are undertaken on either a portfolio basis or separately for individually significant exposures. In applying the portfolio basis the Group makes use of various modelling techniques which are specific to different portfolio types. The estimation of credit losses is inherently uncertain and depends on many factors such as unemployment, GDP, house price movements, collateral values, cash flows, structural changes within industries and other external factors. These assessments are made using a combination of specific reviews, statistical techniques based on previous loan loss experience and management’s judgement. Certain aspects of this process may require estimation, such as the amounts and timing of future cash flows and the assessment of the realisable value of collateral held. A number of loans are classified as held-for-sale to NAMA following notification by NAMA that they intended to acquire additional loans in 2011. In assessing the level of impairment provision required in respect of these loans we have applied the incurred cost model under IAS 39 for loan impairment provisioning. In addition on the basis that a constructive obligation exists under IAS 37 Provisions, Contingent Liabilities and Contingent Assets, an additional provision is required to reflect the likely net proceeds on disposal. The Group considers that the provisions for loan impairments at 31 December 2010 were adequate and in accordance with IRFS based on information available at that time. However, actual losses may differ as a result of changes in collateral values, the timing and amounts of cash flows or other economic events. (2)Employeebenefits The Group operates a number of defined benefit pension schemes. In determining the actual pension cost, the actuarial value of the assets and liabilities of the scheme are calculated. This involves modelling their future growth and requires management, with the advice of an external actuary, to make assumptions as to price inflation, dividend growth, salary and pension increases, return on investments and employee mortality. There are acceptable ranges in which these estimates can validly fall. The impact on the results for the period and financial position could be materially different if alternative assumptions were used. Further details are contained in note 31. (3) Effective interest rate Interest income and expense are recognised in the income statement for all interest-bearing financial instruments using the effective interest method.
Notes to the Financial Statements 31 December 2010
39
The effective interest method is a method of calculating the amortised cost of a financial asset or liability (or group of assets and liabilities) and of allocating the interest income or interest expense over the relevant period. The effective interest rate at origination is the rate that exactly discounts the expected future cash payments or receipts through the expected life of the financial instrument, or when appropriate, a shorter period, to the net carrying amount of the financial asset or financial liability. The application of the method has the effect of recognising income (and expense) receivable (or payable) on the instrument evenly in proportion to the amount outstanding over the period to maturity or repayment. In calculating the effective interest rate, the Group estimates cash flows (using projections based on its experience of customers’ behaviour) considering all contractual terms of the financial instrument but excluding future credit losses. The effective interest calculation takes into account all fees, including those for early redemption, and commissions paid or received between parties to the contract that are an integral part of the effective interest rate, transaction costs and all other premiums and discounts. All costs associated with mortgage incentive schemes are included in the effective interest calculation. Fees and commissions payable to third parties in connection with lending arrangements, where these are direct and incremental costs related to the issue of a financial instrument, are included in interest income as part of the effective interest rate. This critical accounting policy is assessed on an annual basis and any changes are charged / credited to the income statement. (4) Corporation taxes The Group is subject to corporation taxes in two jurisdictions. Estimates are required in determining the provision for income taxes. There are transactions and calculations for which the ultimate tax determination is uncertain at the reporting date. Where the final tax outcome of these matters is different from the amounts that were initially recorded, such differences will impact the income tax and deferred tax provisions in that period. (5)Deferredtaxation IAS 12 provides that a deferred tax asset can be recognised to the extent that it is probable that future taxable profits will be available against which the deferred tax asset can be utilised. The composition of the deferred tax asset in the Group and Society includes deferred tax on the AFS reserve, cashflow hedge reserve, retirement benefit, revaluation of properties and current year losses. The deferred tax asset on available-for-sale assets and cash flow hedge reserve moves in line with market prices and therefore can fluctuate year on year. The deferred tax asset on retirement benefits fluctuates in line with the movements in the value of the pension fund deficit. An increase in asset values with no movement in liabilities would reduce the deferred tax asset. In assessing the recoverability of all deferred tax assets, management considers whether the deferred tax assets will be realised. The ultimate realisation of deferred tax assets is dependent on future taxable profits. Management considers projected future taxable income from its 5 year business plans and beyond in making that assessment. Where there are available profits against which the deferred tax can be utilised, a provision is made.
(6)Determinationoffairvalueoffinancialinstruments The financial instruments on the statement of financial position subject to fair valuing in the Group and Society include available-for-sale financial assets, derivatives and hedged items in a fair value hedge relationship. The best evidence of fair value is an observable market price in an active market. Where available management uses active and observable market prices for fair valuing its available-for-sale financial assets. The absence of quoted prices increases reliance on valuation techniques and requires the use of judgement. The judgement includes assessing unobservable market data, determining the cash flows, identifying a risk free discount rate and applying a credit spread. All valuation techniques applied are based on some market data and are subject to review and approval. (7)NAMAseniorbondsdesignationandvaluation The basis for measurement, interest recognition and impairment of NAMA senior bonds are the same as those for all loans and receivables (see accounting policy numbers (h), (n) and (r)). As there is no active market for the NAMA senior bonds, accordingly, the fair value on initial recognition was determined using a valuation technique.The absence of quoted prices in an active market required increased use of management judgement in the estimation of fair value. This judgement included, but was not limited to: evaluating available market information; determining the cash flows generated by the instruments; identifying a risk free discount rate and applying an appropriate credit spread. The valuation technique and critical assumptions used were subject to internal review and approval. While EBS believes its estimate of fair value is appropriate, the use of different measurements, valuation techniques or assumptions could give rise to the NAMA senior bonds being measured at a different valuation at initial recognition, with a consequent impact on the income statement. (e) Basis of consolidation The Group financial statements comprise the accounts of EBS Building Society and its subsidiaries as at 31 December each year. The financial statements of subsidiaries are prepared for the same reporting year as the parent and using the same accounting policies. (1)Subsidiariesandspecialpurposeentities Subsidiaries are entities controlled by the Society. Control exists when the Society has the power directly or indirectly, to govern the financial and operating policies of an entity so as to obtain benefits from its activities. In assessing control, potential voting rights that presently are exercisable or convertible are taken into account. The financial statements of subsidiaries are included in the consolidated financial statements from the date that control commences until the date that control ceases. Investments in subsidiaries are accounted for at lower of cost or net realisable value and are assessed for impairment annually. Non controlling interests represent the portion of profit or loss and net assets not owned directly or indirectly by the Group and are presented separately in the consolidated statement of financial position.
Notes to the Financial Statements 31 December 2010

40
1. ACCOUNTING POLICIES (cont’d) (e) Basis of consolidation (cont’d) The financial statements of special purpose entities are also included in the consolidated financial statements when the substance of the relationship between the entity and the Group indicates that the entity is controlled by the Group. In accordance with Standing Interpretations Committee (SIC) 12, the Group continues to recognise the securitised assets as loans and advances to customers on the statement of financial position and income from securitised assets continues to be recognised as Group income. (2)Transactionseliminatedonconsolidation All intergroup balances and any unrealised gains and losses or income and expenses arising from intragroup transactions are eliminated in preparing the consolidated financial statements. (f) Derivative financial instruments The Group uses derivative financial instruments to hedge its exposure to foreign exchange and interest rate risks. In accordance with its treasury policy, the Group does not hold or issue derivative financial instruments for trading purposes. Derivative financial instruments are recognised initially at fair value. Subsequent to initial recognition, derivative financial instruments are stated at fair value. The gain or loss on remeasurement to fair value is recognised immediately in the income statement. However, where derivatives qualify for hedge accounting, recognition of any resultant gain or loss depends on the nature of the hedge relationship. The Society does factor its’ own credit risk into the valuation of derivatives however the effect of this risk is minimal due to the various credit support annexes (CSAs) in place for the Societies derivatives. The fair value of derivative financial instruments is the estimated amount that the Group would receive or pay to terminate the instrument at the year end. Interest rate swaps are valued by calculating the net present value of the cash flows over the life of the swap, cross currency interest rate swaps are calculated using the same method with an additional foreign exchange element which is the difference between current, forward and contract exchange rates. All derivatives are carried as assets when the fair value is positive and as liabilities when the fair value is negative. Embeddedderivatives Some hybrid contracts contain both a derivative and a non- derivative component. In such cases, the derivative component is termed an embedded derivative. Where the economic characteristics and risks of embedded derivatives are not closely related to those of the host contract, and the hybrid contract itself is not carried at fair value through the income statement, the embedded derivative is treated as a separate derivative, and reported at fair value with gains and losses being recognised in the income statement. (g) Hedging The Group documents, at the inception of the transaction, the relationship between hedging instruments and hedged items, as well as its risk management objective and strategy for undertaking various hedge transactions. The Group also documents its assessment, both at hedge inception and on an ongoing basis, of whether the derivatives that are used in hedging transactions are highly effective in offsetting changes in fair values or cash flows of
hedged items. A hedge is regarded as highly effective if the changes in fair value or cash flows attributable to the hedged risk during the period for which the hedge is designated are expected to offset in a range of 80% to 125%. (1)Fairvaluehedges Changes in the fair value of derivatives that are designated and qualify as fair value hedges are recorded in the income statement, together with any changes in the fair value of the hedged asset or liability that are attributable to the hedged risk. If the hedging instrument expires or is sold, terminated or exercised, or where the hedge no longer meets the criteria for hedge accounting, the hedge relationship is terminated. For hedged items recorded at amortised cost, the difference between the carrying value of the hedged item on termination and the face value is amortised over the remaining term of the original hedge using the effective interest rate method. If the hedged item is derecognised, the unamortised fair value adjustment is recognised immediately in the income statement. (2)Cashflowhedges Where a derivative financial instrument is designated as a hedge of the variability in cash flows of a recognised asset or liability, or a highly probable forecast transaction, the effective part of any gain or loss on the derivative financial instrument is recognised directly in other comprehensive income (OCI). If a hedge of a forecasted transaction subsequently results in the recognition of a financial asset or a financial liability, the associated gains and losses that were recognised directly in OCI are reclassified into the income statement in the same period or periods during which the asset acquired or liability assumed affect the income statement (i.e. when interest income or expense is recognised). For other cash flow hedges, the associated cumulative gain or loss is removed from OCI and recognised in the income statement in the same period or periods during which the hedged forecast transaction affects profit or loss. The ineffective part of any gain or loss is recognised immediately in the income statement. Amounts accumulated in OCI are recycled to the income statement in the periods in which the hedged item will affect the income statement. When a hedging instrument expires or is sold, terminated or exercised, or the Group revokes designation of the hedge relationship but the hedged forecast transaction is still expected to occur, the cumulative gain or loss at that point remains in OCI and is recognised when the transaction occurs. If the hedged transaction is no longer expected to take place, the cumulative unrealised gain or loss recognised in OCI is recognised immediately in the income statement. (h) Financial assets (1)Classification The Group classifies its financial assets in the following categories: financial assets at fair value through the income statement; loans and receivables; loans and advances held-for-sale; and available-for-sale financial assets. Management determines the classification of its investments at initial recognition. (i) Financial assets at fair value through the income statement A financial asset is classified in this category if acquired principally for the purpose of selling in the short term or if so designated by management. Derivatives are included in this category unless they meet the requirements to be designated as hedges. The designation policy was applied on a basis consistent with 2009.
Notes to the Financial Statements 31 December 2010

41
(ii)Loansandreceivables Loans and receivables are non-derivative financial assets with fixed or determinable payments that are not quoted in an active market. They arise when the Group provides loans directly to a customer or a bank counterparty with no intention of trading the loan. (iii)Loansandadvancesheld-for-sale A non-current asset or a group of assets containing a non-current asset (a disposal group) is classified as held-for-sale if its carrying amount will be recovered principally through sale rather than through continuing use, it is available for immediate sale and sale is highly probable within one year. No reclassifications are made in respect of prior periods. (iv)Available-for-salefinancialassets Available-for-sale financial assets are those intended to be held for an indefinite period of time, which may be sold in response to needs for liquidity or changes in interest rates, exchange rates or equity prices. (2)Recognitionoffinancialassets Purchases and sales of financial assets at fair value through the income statement, held-to-maturity and available-for-sale are recognised on a trade date basis– this is the date on which the Group purchases or sells the asset. Loans are recognised when funds are advanced to borrowers. Financial assets are initially recognised at cost being the fair value of the consideration given plus transaction costs for all financial assets not carried at fair value through the income statement. Financial assets are derecognised when the rights to receive cash flows from the financial assets have expired or where the Group has transferred substantially all risks and rewards of ownership. (3)Measurementoffinancialassets Available-for-sale financial assets and financial assets designated at fair value through the income statement are subsequently carried at fair value. Loans and receivables and held-to-maturity investments are carried at amortised cost using the effective interest method. Gains and losses arising from changes in the fair value of the ‘financial assets designated at fair value through the income statement’ category are recognised in the income statement in the period in which they arise. Gains and losses arising from changes in the fair value of available-for-sale financial assets other than for foreign exchange are recognised directly in Other comprehensive income in the available for sale reserve, until the financial asset is derecognised, collected or otherwise disposed of or until the asset is determined to be impaired, at which time the cumulative gain or loss previously recognised in Other comprehensive income is included in the income statement. Interest calculated using the effective interest method is recognised in the income statement. The fair values of quoted investments in active markets are based on current bid prices. If the market for a financial asset is not active (and for unlisted securities), the Group establishes fair value by using valuation techniques. These include the use of recent arm’s length transactions, discounted cash flow analysis, option pricing models and other valuation techniques commonly used by market participants. Loans and receivables and loans and advances held-for-sale assets are carried at amortised cost using the effective interest method and assessed for impairment as set out in note 1(n). Amortised cost is calculated by taking into account any discount or premium on acquisition over the period to maturity. Gains and losses are recognised in the income statement when the financial assets are derecognised or impaired as well as through the amortisation process.
(4)Loansandreceivablesrenegotiated Arrangements are entered into with borrowers that are experiencing financial difficulty to help them manage their mortgage repayments. Where an arrangement is agreed, the arrears on the loan are not adjusted by the Society other than where the borrower repays the outstanding arrears in full. Hence, all loan arrears, regardless of arrangements in place, are included in the past due category. In certain, circumstances (where the borrower has demonstrated intent and an ability to repay), EBS will agree to capitalise arrears for repayment over the remainder of the term of the loan. The loans continue to be subject to an individual or collective impairment assessment, calculated using the loan’s original effective interest rate. (i) Financial liabilities Financial liabilities are recognised initially at fair value, being their issue proceeds (fair value of consideration received) net of transaction costs incurred. Financial liabilities are subsequently stated at amortised cost; any difference between proceeds net of transaction costs and the redemption value is recognised in the income statement over the period of the borrowings using the effective interest method. The portion of a financial liability that is designated as a hedged item within a fair value hedge is accounted for at fair value and movements go through the income statement. A financial liability is derecognised when the obligation under the liability is discharged, cancelled or expires. (j) Segmental reporting An operating segment is a component of the Group that engages in business activities from which it earns revenues and incurs expenses, including revenues and expenses that relate to transactions with any of the Group’s other components, whose operating results are reviewed regularly by the chief operating decision maker to make decisions about resources allocated to each segment and assess its performance, and for which discrete financial information is available. The only operating segment is the Group. (k) Property, plant and equipment Buildings are initially recognised at cost and subsequently revalued annually to open market values by independent valuers. Office equipment and motor vehicles are stated at cost and deemed cost less accumulated depreciation and any impairment losses. Certain items of property, plant and equipment that had been revalued to fair value on or prior to 1 January 2005, the date of transition to IFRS, are measured on the basis of deemed cost, being the revalued amount at the date of that revaluation. Where parts of an item of property, plant and equipment have different useful lives, they are accounted for as separate items of property, plant and equipment. Freehold land is not depreciated. Depreciation on other assets is calculated using the straight-line method to allocate their cost less the residual value over the estimated useful lives of the assets as follows: Land Not depreciated Buildings Depreciated as part of revaluation Fixtures and fittings, equipment and motor vehicles 10% - 33% per annum Asset useful lives and residual values are reviewed annually. Assets are reviewed for impairment whenever events or changes in circumstances indicate the carrying value may not be recoverable. An impairment loss is recognised in the
Notes to the Financial Statements 31 December 2010

42
1. ACCOUNTING POLICIES (cont’d) (k) Property, plant and equipment (cont’d) income statement whenever the carrying amount exceeds its recoverable amount. Gains and losses on disposal, being the difference between proceeds and the carrying amount, are included in the income statement within other income or operating expenses in the year the asset is derecognised. (l) Leases (1) Group as lessee Payments made under operating leases are recognised in the income statement on a straight-line basis over the term of the lease. Lease incentives received are recognised in the income statement as an integral part of the total lease expense. All payments under operating lease contracts are charged to operating expenses in the year in which the expenditure is incurred. When an operating lease is terminated before the lease period has expired, any payment required to be made to the lessor by way of penalty is recognised as an expense in the period in which termination takes place. (2) Group as lessor Leases where the Group does not transfer substantially all the risks and benefits of ownership of the asset are classified as operating leases. The Group earns rental income on properties leased as operating leases. (m) Taxation (1) Current tax Current tax on profits is recognised as an expense based on the applicable tax rates enacted or substantively enacted at the year end, and any adjustments to tax payable in respect of previous years. (2)Deferredtax Deferred tax is provided using the liability method on taxable temporary differences at the year end between the carrying amounts of assets and liabilities for financial reporting purposes and the amounts used for taxation purposes. The amount of deferred tax provided is based on the expected manner of realisation or settlement of the carrying amount of assets and liabilities, using tax rates enacted or substantively enacted at the year end that are expected to apply when the related deferred tax asset is realised or deferred tax liability is settled. The following temporary differences are not recognised: the initial recognition of assets or liabilities that affect neither accounting nor taxable profit and differences relating to investments in subsidiaries to the extent that they will probably not reverse in the foreseeable future. A deferred tax asset is recognised only to the extent that it is probable that future taxable profits will be available against which the asset can be utilised. Deferred tax assets are reduced to the extent that it is no longer probable that the related tax benefit will be realised. Deferred tax relating to items recognised in other comprehensive income are not recognised in the income statement, but are recognised in OCI.
(n) Impairment of financial assets (i)Assetscarriedatamortisedcost The Group assesses at each reporting date whether there is objective evidence that a financial asset or group of financial assets is impaired. A financial asset or a group of financial assets is impaired and impairment costs are incurred if, and only if, there is objective evidence of impairment as a result of one or more events that occurred after the initial recognition of the asset (a ‘loss event’) and that loss event (or events) has an impact on the estimated future cash flows of the financial asset or group of financial assets that can be reliably estimated. Objective evidence that a financial asset or group of assets is impaired includes observable data that comes to the attention of the Group about the following loss events: (i) significant financial difficulty of the issuer or obligor; or (ii) a breach of contract, such as a default or delinquency in interest or principal payments; or (iii) the Group granting to the borrower, for economic or legal reasons relating to the borrower’s financial difficulty, a concession that the lender would not otherwise consider; or (iv) it is becoming probable that the borrower will enter bankruptcy or other financial reorganisation; or (v) the disappearance of an active market for that financial asset because of financial difficulties; or (vi) adverse changes in the payment status of Group’s borrowers; or (vii) national or local economic conditions that correlate with defaults on the assets of the Group. The Group first assesses whether objective evidence of impairments exists individually for financial assets that are individually significant, and collectively for financial assets that are not individually significant. If the Group determines that no objective evidence of impairment exists for an individually assessed financial asset, whether significant or not, it includes the asset in a group of financial assets with similar credit risk characteristics and collectively assesses them for impairment. Assets that are individually assessed for impairment and for which an impairment loss is or continues to be recognised are not included in a collective assessment of impairment. If there is objective evidence that an impairment loss on loans and receivables or held-to-maturity financial assets carried at amortised cost has been incurred, the amount of the loss is measured as the difference between the asset’s carrying amount and the present value of estimated future cash flows (excluding future credit losses that have not been incurred) discounted at the financial asset’s original effective interest rate. The carrying amount of the asset is reduced and the amount of the loss is recognised in the income statement. If a loan or held-to-maturity financial asset has a variable interest rate, the discount rate for measuring any impairment loss is the current effective interest rate determined under the contract. The calculation of the present value of the estimated future cash flows of a collateralised financial asset reflects the cash flows that may result from foreclosure less costs for obtaining and selling the collateral, whether or not foreclosure is probable. For the purposes of a collective evaluation of impairment, financial assets are grouped on the basis of similar credit risk characteristics (i.e. on the basis of the Group’s grading process that considers asset type, industry, geographical location, collateral type, past-due status and other relevant factors). Those characteristics are relevant to the estimation of future cash flows for groups of such assets by being indicative of the debtor’s
Notes to the Financial Statements 31 December 2010

43
ability to pay all amounts due according to the contractual terms of the assets being evaluated. Future cash flows in a group of financial assets that are collectively evaluated for impairment are estimated on the basis of the contractual cash flows of the assets in the Group and historical loss experience for assets with credit risk characteristics similar to those in the Group. Historical loss experience is adjusted on the basis of current observable data to reflect the effects of current conditions that did not affect the period on which the historical loss experience is based and to remove the effects of conditions in the historical period that do not currently exist. Estimates of changes in future cash flows for groups of assets should reflect and be directionally consistent with changes in related observable data from period to period (for example, changes in unemployment rates, property prices, payment status, or other factors indicative of changes in the probability of losses in the Group and their magnitude). The methodology and assumptions used for estimating future cash flows are reviewed regularly by the Group to reduce any differences between loss estimates and actual loss experience. When a loan is uncollectible, it is written off against the related provision for loan impairment. Such loans are written off after all the necessary procedures have been completed and the amount of the loss has been determined. Subsequent recoveries of amounts previously written off decrease the amount of the provision for loan impairment in the income statement. If, in a subsequent period, the amount of the impairment loss decreases and the decrease can be related objectively to an event occurring after the impairment was recognised (such as an improvement in the debtor’s credit rating), the previously recognised impairment loss is reversed through the income statement. Impairment provisions in respect of loans and advances held-for-sale to NAMA are charged to the income statement from the date the loans were classified as held-for-sale. (2)Assetscarriedatfairvalue The Group assesses at each reporting date whether there is objective evidence that a financial asset or a group of financial assets is impaired. If any such evidence exists for available-for-sale financial assets, the cumulative loss – measured as the difference between the acquisition cost and the current fair value, less any impairment loss on that financial asset previously recognised in the income statement – is removed from other comprehensive income and recognised in the income statement. If, in a subsequent period, the fair value of a debt instrument classified as available-for-sale increases and the increase can be objectively related to an event occurring after the impairment loss was recognised in the income statement, the impairment loss is reversed through the income statement. (o) Sale and repurchase agreements Securities sold subject to repurchase agreements (repos) are retained on the statement of financial position and only reclassified as pledged assets when the transferee has the right by contract or custom to sell or pledge the collateral; the counterparty liability is included in deposits by credit institutions or customer accounts, as appropriate. (p) Employee benefits (1)Definedbenefitpensionplans The Group operates three defined benefit plans, all of which require contributions to be made to separately administered funds. The Group’s net obligation in respect of defined benefit pension plans is calculated separately for each plan by estimating the amount of future benefits that employees have earned in
return for their service in the current and prior periods; that benefit is discounted to determine its present value, and the fair value of any plan assets is deducted. The discount rate is the yield at year end on AA corporate bonds that have maturity dates approximating to the terms of the Group’s obligations. The calculation is performed annually by a qualified actuary using the projected unit credit actuarial valuation method. Actuarial gains and losses arising from changes in actuarial assumptions or from experience adjustments are charged or credited to the income statement in the year in which the gains / losses occur. When the benefits of a plan are improved, the portion of the increased benefit relating to past service by employees is recognised as an expense in the income statement in the year in which the improvement is granted. (2)Definedcontributionpensionplans The Group also operates defined contribution pension plans. A defined contribution plan is a pension plan under which the Group pays fixed contributions into a fund and has no legal or constructive obligations to pay any further contributions. The contributions payable to a defined contribution plan are in proportion to the services rendered by the employees and are recorded under operating expenses. (q) Provisions A provision is recognised in the statement of financial position when the Group has a present obligation (legal or constructive) as a result of a past event, and it is probable that an outflow of economic benefits will be required to settle the obligation. If the effect is material, provisions are determined by discounting the expected future cash flows at a pre-tax rate that reflects current market assessments of the time value of money and, where appropriate, the risks specific to the liability. When discounting is used, the increase in the provision due to the passage of time is recognised as a borrowing cost. (r) Revenue recognition (1)Interestincomeandexpense Interest income and expense are recognised in the income statement for all interest bearing financial instruments using the effective interest method. The effective interest rate method is a method of calculating the amortised cost of a financial asset or liability and of allocating the interest income or expense over the relevant period from origination. (2)Feesandcommissionincome Fees and commission which represents a return for services provided or risks borne are credited to income, over the period during which the service is performed or the risk is borne, as appropriate. (3) Rental income Rental income from properties is recognised in the income statement on a straight-line basis over the term of the lease. Lease incentives granted are recognised as an integral part of their total rental income. (s) Intangible assetsCosts associated with maintaining computer software programmes are recognised as an expense as incurred. Costs that are directly associated with identifiable and unique software products controlled by the Group and which are expected to generate economic benefits exceeding costs beyond one year, are recognised as intangible assets. Direct costs include costs of materials and services used or consumed in generating the
Notes to the Financial Statements 31 December 2010

44
1. ACCOUNTING POLICIES (cont’d) (s) Intangible assets (cont’d) intangible asset and costs of employee benefits arising from the generation of the intangible asset. Expenditure which enhances or extends the performance of computer software programmes beyond their original specifications is recognised as a capital improvement and added to the original cost of the software. Computer software development costs recognised as assets are amortised using the straight-line method over their useful lives, between 3 and 10 years. The amortisation expense is recognised in the income statement in operating expenses. In addition to the capitalisation of internally generated computer software, purchased software that does not form an integral part of the related hardware is also capitalised and amortised using the straight-line method over their useful lives, between 3 and 10 years. Computer software that does form an integral part of the related hardware is capitalised as office equipment in property, plant and equipment. The computer software is reviewed for impairment whenever events or changes in circumstances indicate that the carrying amount may not be recoverable. An asset’s carrying amount is written down immediately to its recoverable amount if the asset’s carrying amount is greater than its estimated recoverable amount. The estimated recoverable amount is the higher of the asset’s fair value less costs to sell or value in use. (t) Cash and cash equivalentsFor the purposes of the cash flow statement, cash and cash equivalents comprise cash and non-restricted balances with central banks, short-term liquid instruments that are readily convertible into known amounts of cash and which are subject to an insignificant risk of changes in value and which have a remaining maturity of three months or less. These include items such as treasury bills and other eligible bills, loans and advances to banks and short-term government securities. (u) Foreign currency transactions The functional and presentation currency of the Society and its subsidiaries is euro. Transactions in foreign currencies are translated at the foreign exchange rate ruling at the date of the transaction. Monetary assets and liabilities denominated in foreign currencies at year end are translated to euro at the foreign exchange rate ruling at that date. Foreign exchange differences arising on translation are recognised in the income statement. Non-monetary assets and liabilities that are measured in terms of historical cost in a foreign currency are translated using the exchange rate at the date of the transaction. Non-monetary assets and liabilities denominated in foreign currencies that are stated at fair value are translated to euro at foreign exchange rates ruling at the dates the fair value was determined.
(v) Off-setting financial instruments Financial assets and liabilities are offset and the net amount is reported in the statement of financial position when there is a legally enforceable right to offset the recognised amounts and there is an intention to settle on a net basis, or realise the asset and settle the liability simultaneously. (w) Reserves Revaluation reserve: The revaluation reserve represents unrealised gains on revaluation of property. Available for Sale Reserve: The available for sale reserve includes the cumulative net change in the fair value of available-for-sale investments, excluding impairment losses, until the investment is derecognised. Cashflow Hedge Reserve: The cash flow hedge reserve comprises the effective portion of the cumulative net change in the fair value of cash flow hedging instruments related to hedged transactions that have not yet affected the income statement. General Reserve: The general reserve represents the retained profits or losses for the business and any actuarial gains or losses on the pension schemes. Capital Contribution: The capital contribution represents the proceeds from the Promissory Note issued by the Government net of costs. Special Investment Shares: The Special Investment Shares represent the proceeds net of issuance costs from the issue of perpetual Special Investment Shares to the Minister for Finance. (x) Adoption of new accounting standards As of 1 January 2010, the Society adopted the amendments to IAS 39 Financial Instruments: Eligible hedged items, IAS 27 (revised) Consolidated and separate financial statements, IFRS 3 (revised) Business combinations and IFRIC 17 Distribution of non cash assets to owners. The impact of these is included in the financial statements where relevant. (y) New standards and interpretations not applied During the year, the IASB and IFRIC have issued a number of new accounting standards and interpretations with an effective date after the date of these financial statements including: International Accounting Standards (IAS / IFRSs) Effective date Extinguishing financial liabilities IFRIC 19 01-Jul-10 with equity instruments Prepayments of a minimum IFRIC 14 01-Jan-11 funding requirement (amendment) Improvements to IFRSs Related party disclosures IAS 24 01-Jan-11 Consolidated and separate IAS 27 01-Jan-11 financial statements Financial instruments IFRS 9 01-Jan-13 (not yet endorsed) Deferred tax: Recovery of IAS 12 01-Jan-12 underlying assets (not yet endorsed)
Notes to the Financial Statements 31 December 2010
IAS 24: Related party disclosure. The definition of a related party has been clarified to simplify the identification of related party relationships, particularly in relation to significant influence and joint control. A partial exemption from the disclosures has been included for the Government and Government-related entities. For these entities the general disclosures requirements of IAS 24 will not apply. Instead, alternative disclosures will be included. The Group has elected to early adopt the partial exemption for the Government and Government-related entities in these consolidated financial statements. The Directors do not anticipate that the adoption of these standards and interpretations (with the exception of IFRS 9 which is yet to be endorsed) will have a material impact on the Group’s financial statements in the period of initial application. We will assess the impact of IFRS 9 when it is endorsed. (z) Comparatives The 2009 comparatives incorporate minor reclassifications made to the notes to the accounts following a review of the 2009 financial statements, to aid comparisons with other lenders. Amounts reported for the prior year have been reclassified in relation to interest income and interest expense. This affects the income statement only and net interest income does not change.
2. REPORTING BY BUSINESS SEGMENTS AND GEOGRAPHICAL LOCATION For management and reporting purposes the Group’s activities are organised in one reportable segment based on the information provided internally to the chief operating decision maker. The chief operating decision maker is considered to be the Group Board of Directors. The principal activities of the Group involve the provision of mortgage lending, savings, investments and insurance arrangement services to customers.
45
Notes to the Financial Statements 31 December 2010
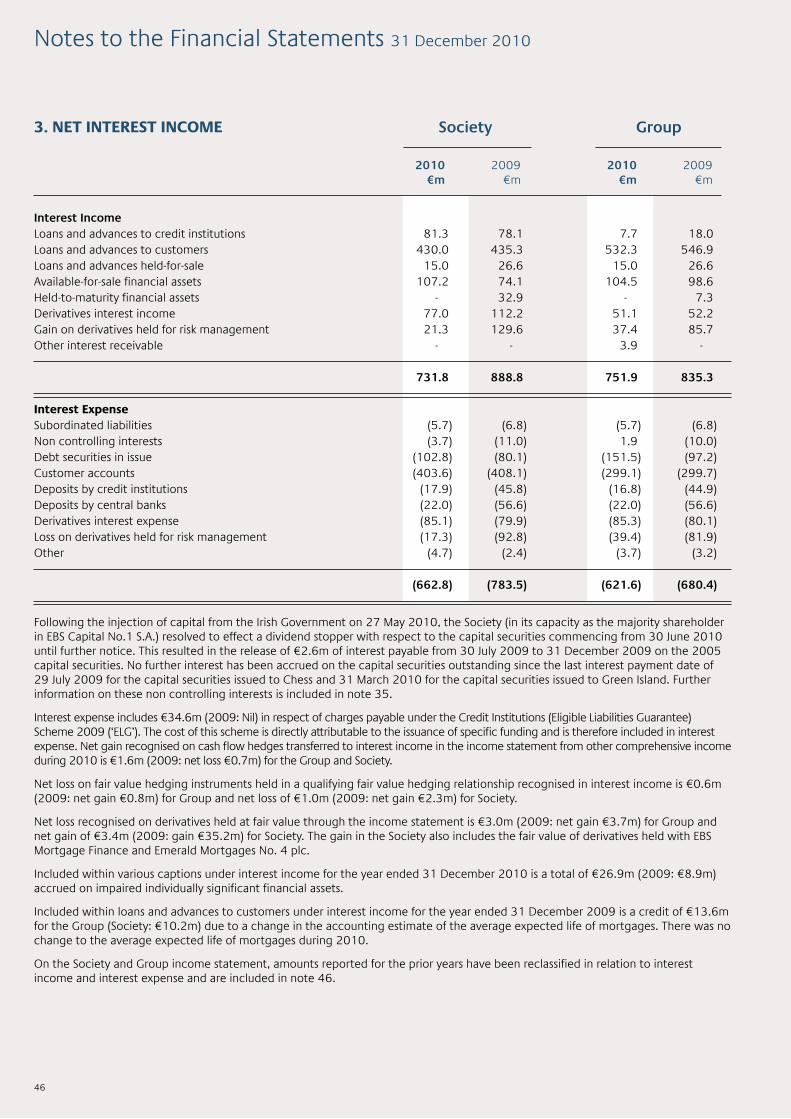
Interest Income Loans and advances to credit institutions 81.3 78.1 7.7 18.0 Loans and advances to customers 430.0 435.3 532.3 546.9 Loans and advances held-for-sale 15.0 26.6 15.0 26.6 Available-for-sale financial assets 107.2 74.1 104.5 98.6 Held-to-maturity financial assets - 32.9 - 7.3 Derivatives interest income 77.0 112.2 51.1 52.2 Gain on derivatives held for risk management 21.3 129.6 37.4 85.7 Other interest receivable - - 3.9 -
731.8 888.8 751.9 835.3
Interest Expense Subordinated liabilities (5.7) (6.8) (5.7) (6.8) Non controlling interests (3.7) (11.0) 1.9 (10.0) Debt securities in issue (102.8) (80.1) (151.5) (97.2) Customer accounts (403.6) (408.1) (299.1) (299.7) Deposits by credit institutions (17.9) (45.8) (16.8) (44.9) Deposits by central banks (22.0) (56.6) (22.0) (56.6) Derivatives interest expense (85.1) (79.9) (85.3) (80.1) Loss on derivatives held for risk management (17.3) (92.8) (39.4) (81.9) Other (4.7) (2.4) (3.7) (3.2)
(662.8) (783.5) (621.6) (680.4)
46
3. NET INTEREST INCOME Society Group
2010 2009 €m €m
2010 2009 €m €m
Following the injection of capital from the Irish Government on 27 May 2010, the Society (in its capacity as the majority shareholder in EBS Capital No.1 S.A.) resolved to effect a dividend stopper with respect to the capital securities commencing from 30 June 2010 until further notice. This resulted in the release of €2.6m of interest payable from 30 July 2009 to 31 December 2009 on the 2005 capital securities. No further interest has been accrued on the capital securities outstanding since the last interest payment date of 29 July 2009 for the capital securities issued to Chess and 31 March 2010 for the capital securities issued to Green Island. Further information on these non controlling interests is included in note 35. Interest expense includes €34.6m (2009: Nil) in respect of charges payable under the Credit Institutions (Eligible Liabilities Guarantee) Scheme 2009 (‘ELG’). The cost of this scheme is directly attributable to the issuance of specific funding and is therefore included in interest expense. Net gain recognised on cash flow hedges transferred to interest income in the income statement from other comprehensive income during 2010 is €1.6m (2009: net loss €0.7m) for the Group and Society. Net loss on fair value hedging instruments held in a qualifying fair value hedging relationship recognised in interest income is €0.6m (2009: net gain €0.8m) for Group and net loss of €1.0m (2009: net gain €2.3m) for Society. Net loss recognised on derivatives held at fair value through the income statement is €3.0m (2009: net gain €3.7m) for Group and net gain of €3.4m (2009: gain €35.2m) for Society. The gain in the Society also includes the fair value of derivatives held with EBS Mortgage Finance and Emerald Mortgages No. 4 plc. Included within various captions under interest income for the year ended 31 December 2010 is a total of €26.9m (2009: €8.9m) accrued on impaired individually significant financial assets. Included within loans and advances to customers under interest income for the year ended 31 December 2009 is a credit of €13.6m for the Group (Society: €10.2m) due to a change in the accounting estimate of the average expected life of mortgages. There was no change to the average expected life of mortgages during 2010. On the Society and Group income statement, amounts reported for the prior years have been reclassified in relation to interest income and interest expense and are included in note 46.
Notes to the Financial Statements 31 December 2010

Feesandcommissionsreceivable Insurance commission income 10.0 10.3 10.0 10.3 Investment management commission income 4.2 3.3 4.2 3.3 Personal loan and credit card income 0.3 0.3 0.3 0.3
14.5 13.9 14.5 13.9
Feesandcommissionspayable Insurance commission expense (3.8) (3.7) (3.8) (3.7) Investment management commission expense (1.2) (1.1) (1.2) (1.1) Government guarantee scheme (4.5) (7.9) (5.6) (7.9)
(9.5) (12.7) (10.6) (12.7)
Gain on disposal of securities 8.2 11.4 8.2 11.4 Gain on repurchase of debt securities in issue 0.3 5.9 0.3 22.8
8.5 17.3 8.5 34.2
47
4. NON INTEREST INCOME
5. PROFIT ON SALE / REPURCHASE OF SECURITIES
Society
Society
Group
Group
2010 2009 €m €m
2010 2009 €m €m
2010 2009 €m €m
2010 2009 €m €m
Government Guarantee Scheme charges for the Group and Society relate to charges payable under the Credit Institutions (Financial Support) Scheme 2008 (‘CIFS’) and are included in fees and commissions payable as they are not directly attributable to specific funding programs. The Government Guarantee Schemes are referred to in note 42 under related party transactions. Investment management commission income relates to fees earned by the Group and Society on investment advisory services provided to its customers.
During 2010, Securities held in the available-for-sale portfolio were sold giving rise to a gain of €8.2m (2009: €11.4m). Debt securities repurchased during 2010 included medium term notes issued by the Group. The overall gain is the difference between the carrying value of the debt securities at the date of repurchase and the total consideration paid including transaction costs and amounts to €0.3m (2009: €22.8m). The table below sets out the type and nominal value of the debt repurchased.
Notes to the Financial Statements 31 December 2010

48
EMTN EMTN series 068 - - 10.0 - EMTN series 070 - - 15.0 - EMTN series 092 - - 6.0 2.0 EMTN series 100 19.0 0.3 77.3 3.9 EMTN series 152 - - 4.4 - EMTN series 153 - - 1.8 - Securitisedbonds Emerald 4 - - 87.9 16.9
19.0 0.3 202.4 22.8
EMTN EMTN series 068 - - 10.0 - EMTN series 070 - - 15.0 - EMTN series 092 - - 6.0 2.0 EMTN series 100 19.0 0.3 77.3 3.9 EMTN series 152 - - 4.4 - EMTN series 153 - - 1.8 - Securitisedbonds Emerald 4 - - 87.9 -
19.0 0.3 202.4 5.9
Society
Group
2010 2010 €m €m Nominal Gain
2010 2010 €m €m Nominal Gain
2009 2009 €m €m Nominal Gain
2009 2009 €m €m Nominal Gain
Securitised bonds bought back in 2009 are accounted for under IAS 39 and meet the requirement to be treated as an extinguishment of the original securities issued.
5. PROFIT ON SALE / REPURCHASE OF SECURITIES (cont’d)
Notes to the Financial Statements 31 December 2010
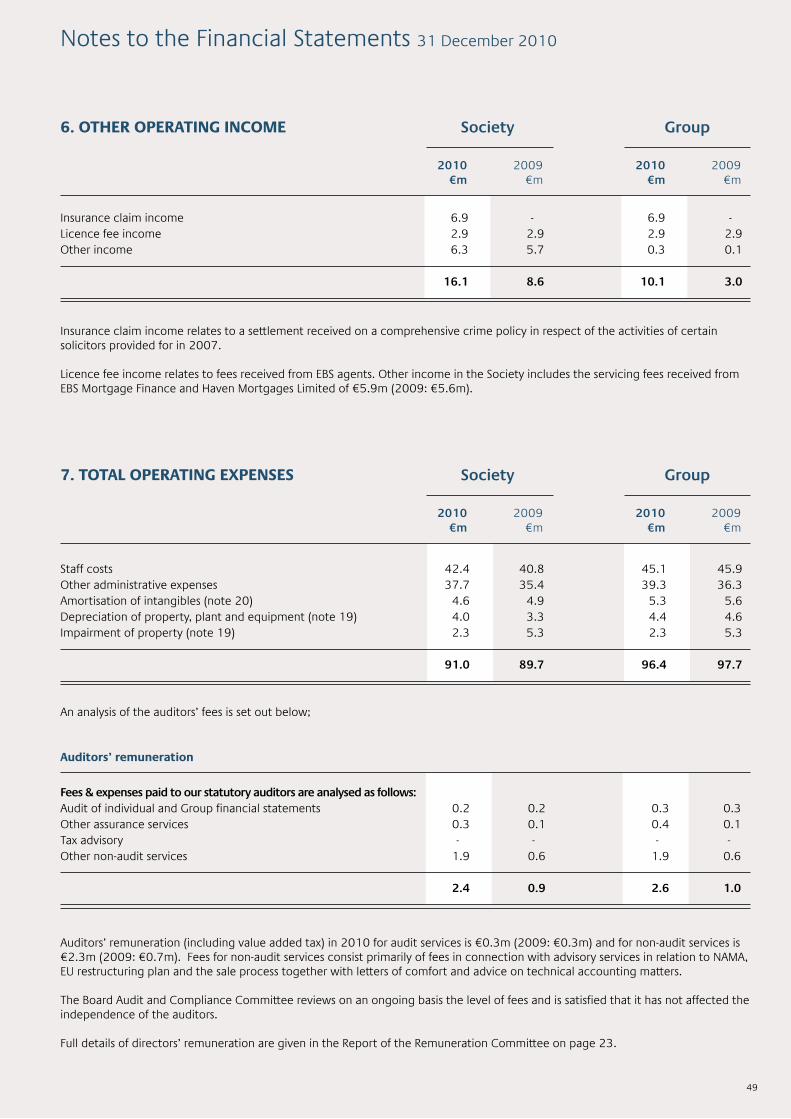
49
Insurance claim income 6.9 - 6.9 - Licence fee income 2.9 2.9 2.9 2.9 Other income 6.3 5.7 0.3 0.1
16.1 8.6 10.1 3.0
Staff costs 42.4 40.8 45.1 45.9 Other administrative expenses 37.7 35.4 39.3 36.3 Amortisation of intangibles (note 20) 4.6 4.9 5.3 5.6 Depreciation of property, plant and equipment (note 19) 4.0 3.3 4.4 4.6 Impairment of property (note 19) 2.3 5.3 2.3 5.3
91.0 89.7 96.4 97.7
Fees&expensespaidtoourstatutoryauditorsareanalysedasfollows: Audit of individual and Group financial statements 0.2 0.2 0.3 0.3 Other assurance services 0.3 0.1 0.4 0.1 Tax advisory - - - - Other non-audit services 1.9 0.6 1.9 0.6
2.4 0.9 2.6 1.0
6. OTHER OPERATING INCOME
7. TOTAL OPERATING EXPENSES
Auditors’ remuneration
Society
Society
Group
Group
2010 2009 €m €m
2010 2009 €m €m
2010 2009 €m €m
2010 2009 €m €m
Insurance claim income relates to a settlement received on a comprehensive crime policy in respect of the activities of certain solicitors provided for in 2007. Licence fee income relates to fees received from EBS agents. Other income in the Society includes the servicing fees received from EBS Mortgage Finance and Haven Mortgages Limited of €5.9m (2009: €5.6m).
Auditors’ remuneration (including value added tax) in 2010 for audit services is €0.3m (2009: €0.3m) and for non-audit services is €2.3m (2009: €0.7m). Fees for non-audit services consist primarily of fees in connection with advisory services in relation to NAMA, EU restructuring plan and the sale process together with letters of comfort and advice on technical accounting matters. The Board Audit and Compliance Committee reviews on an ongoing basis the level of fees and is satisfied that it has not affected the independence of the auditors. Full details of directors’ remuneration are given in the Report of the Remuneration Committee on page 23.
An analysis of the auditors’ fees is set out below;
Notes to the Financial Statements 31 December 2010
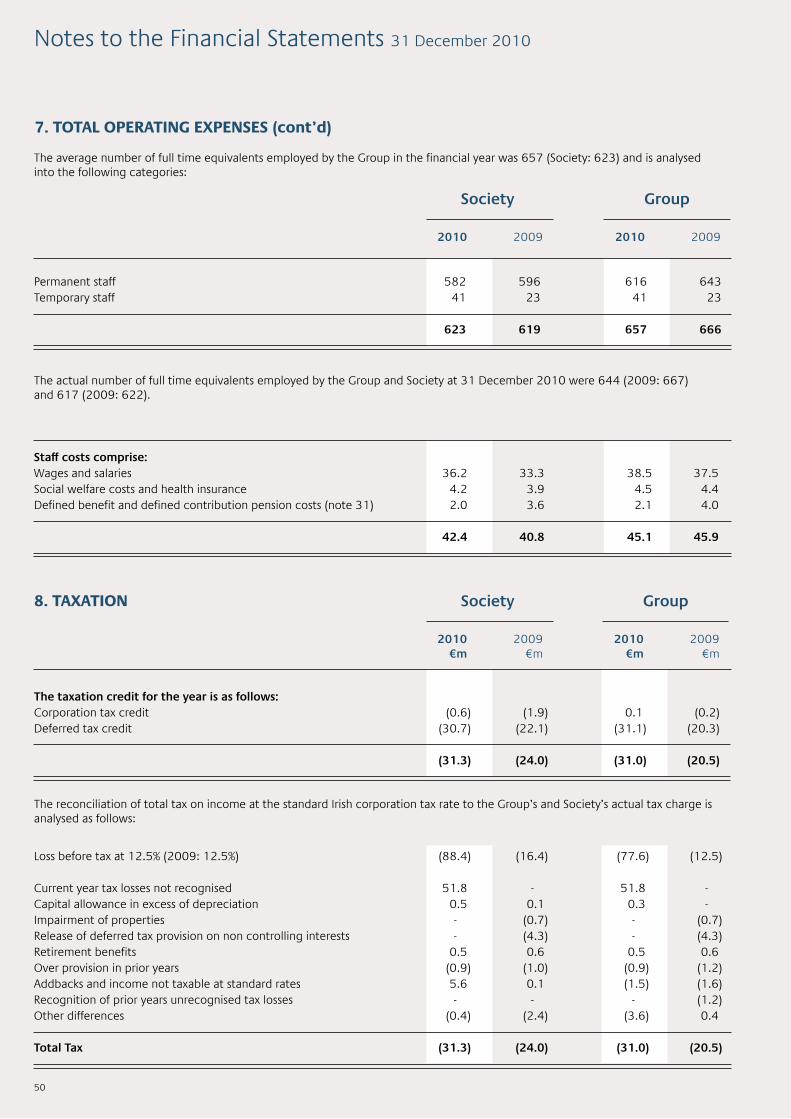
50
Permanent staff 582 596 616 643 Temporary staff 41 23 41 23
623 619 657 666
Society Group
2010 2009 2010 2009
The average number of full time equivalents employed by the Group in the financial year was 657 (Society: 623) and is analysed into the following categories:
Staffcostscomprise: Wages and salaries 36.2 33.3 38.5 37.5 Social welfare costs and health insurance 4.2 3.9 4.5 4.4 Defined benefit and defined contribution pension costs (note 31) 2.0 3.6 2.1 4.0 42.4 40.8 45.1 45.9
The actual number of full time equivalents employed by the Group and Society at 31 December 2010 were 644 (2009: 667) and 617 (2009: 622).
Loss before tax at 12.5% (2009: 12.5%) (88.4) (16.4) (77.6) (12.5) Current year tax losses not recognised 51.8 - 51.8 - Capital allowance in excess of depreciation 0.5 0.1 0.3 - Impairment of properties - (0.7) - (0.7) Release of deferred tax provision on non controlling interests - (4.3) - (4.3) Retirement benefits 0.5 0.6 0.5 0.6 Over provision in prior years (0.9) (1.0) (0.9) (1.2) Addbacks and income not taxable at standard rates 5.6 0.1 (1.5) (1.6) Recognition of prior years unrecognised tax losses - - - (1.2) Other differences (0.4) (2.4) (3.6) 0.4
Total Tax (31.3) (24.0) (31.0) (20.5)
Thetaxationcreditfortheyearisasfollows: Corporation tax credit (0.6) (1.9) 0.1 (0.2) Deferred tax credit (30.7) (22.1) (31.1) (20.3)
(31.3) (24.0) (31.0) (20.5)
8. TAXATION Society Group
2010 2009 €m €m
2010 2009 €m €m
The reconciliation of total tax on income at the standard Irish corporation tax rate to the Group’s and Society’s actual tax charge is analysed as follows:
7. TOTAL OPERATING EXPENSES (cont’d)
Notes to the Financial Statements 31 December 2010

51
Group
Society
Cash flow hedge reserve 30.7 (3.9) 26.8 (9.2) 1.2 (8.0) Available-for-sale reserve (207.0) 25.8 (181.2) 56.7 (7.0) 49.7 Revaluation reserve (0.2) - (0.2) (9.3) 1.0 (8.3) Net actuarial (loss) gain on retirement benefits (4.2) 0.6 (3.6) 20.2 (2.5) 17.7
(180.7) 22.5 (158.2) 58.4 (7.3) 51.1
Cash flow hedge reserve 30.7 (3.9) 26.8 (9.2) 1.2 (8.0) Available-for-sale reserve (521.1) 23.2 (497.9) 35.3 (4.4) 30.9 Revaluation reserve (0.2) - (0.2) (9.3) 1.0 (8.3) Net actuarial (loss) gain on retirement benefits (4.2) 0.6 (3.6) 20.2 (2.5) 17.7
(494.8) 19.9 (474.9) 37.0 (4.7) 32.3
Income Tax recognised in other comprehensive income
2010 2009
Before Tax Tax (expense) benefit €m €m
Before Tax €m
Tax Net of Tax (expense) benefit €m €m
Loss on sale of loans and advances to subsidiaries (31.0) - - -
(31.0) - - -
9. LOSS ON SALE OF LOANS AND ADVANCES TO SUBSIDIARIES
Society Group
2010 2009 €m €m
2010 2009 €m €m
In May 2010, EBS Building Society sold nominal €833.2m of loans to EBS Mortgage Finance (the covered bond bank). The loans were sold at fair value as this transaction does not meet the requirement for the sale of a business as defined in “IFRS 3 – Business combinations” and therefore the transaction is accounted for as the sale of a group of assets under “IAS 39 – Financial Instruments: Recognition and Measurement”. The loss on sale amounts to €31.0m and is reflected in the Society’s income statement in 2010.
In the absence of quoted market prices, a valuation technique using reasonable assumptions was used to determine fair value. This loss eliminates on Group consolidation.
Notes to the Financial Statements 31 December 2010
Net of Tax €m
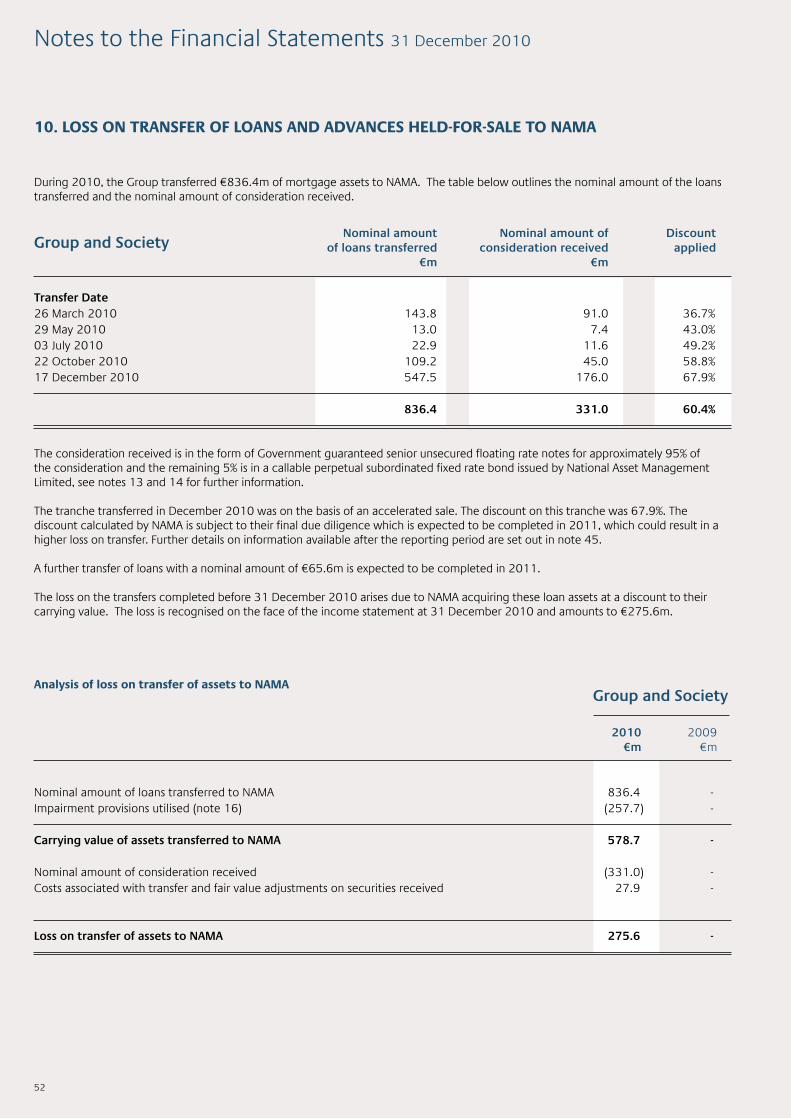
GroupandSociety
2010 2009 €m €m
52
GroupandSociety
Transfer Date 26 March 2010 143.8 91.0 36.7% 29 May 2010 13.0 7.4 43.0% 03 July 2010 22.9 11.6 49.2% 22 October 2010 109.2 45.0 58.8% 17 December 2010 547.5 176.0 67.9%
836.4 331.0 60.4%
10. LOSS ON TRANSFER OF LOANS AND ADVANCES HELD-FOR-SALE TO NAMA
Nominal amount ofloanstransferred
€m
Nominal amount of considerationreceived
€m
Discount applied
During 2010, the Group transferred €836.4m of mortgage assets to NAMA. The table below outlines the nominal amount of the loans transferred and the nominal amount of consideration received.
The consideration received is in the form of Government guaranteed senior unsecured floating rate notes for approximately 95% of the consideration and the remaining 5% is in a callable perpetual subordinated fixed rate bond issued by National Asset Management Limited, see notes 13 and 14 for further information. The tranche transferred in December 2010 was on the basis of an accelerated sale. The discount on this tranche was 67.9%. The discount calculated by NAMA is subject to their final due diligence which is expected to be completed in 2011, which could result in a higher loss on transfer. Further details on information available after the reporting period are set out in note 45. A further transfer of loans with a nominal amount of €65.6m is expected to be completed in 2011. The loss on the transfers completed before 31 December 2010 arises due to NAMA acquiring these loan assets at a discount to their carrying value. The loss is recognised on the face of the income statement at 31 December 2010 and amounts to €275.6m.
Nominal amount of loans transferred to NAMA 836.4 - Impairment provisions utilised (note 16) (257.7) -
CarryingvalueofassetstransferredtoNAMA 578.7 - Nominal amount of consideration received (331.0) - Costs associated with transfer and fair value adjustments on securities received 27.9 -
Loss on transfer of assets to NAMA 275.6 -
Analysis of loss on transfer of assets to NAMA
Notes to the Financial Statements 31 December 2010

53
Cash in hand 4.8 4.6 4.8 4.6 Balances with Central Banks other than mandatory reserve deposits 212.1 156.5 226.1 172.3
Includedincashandcashequivalents 216.9 161.1 230.9 176.9 Mandatory reserve deposits with Central Bank 19.3 19.5 19.3 19.6
TotalcashandbalanceswithCentralBanks 236.2 180.6 250.2 196.5
Forthepurposeofthecashflowstatementthecashandcash equivalentscomprisethefollowing: Cash and balances with Central Banks 216.9 161.1 230.9 176.9 Available-for-sale financial assets 303.4 208.5 303.4 208.5 Loans and advances to credit institutions 2,908.0 3,056.0 107.5 406.3
3,428.3 3,425.6 641.8 791.7
Government bills 221.0 208.3 221.0 208.3 Debt securities 3,508.7 3,763.9 2,140.8 2,716.5 Promissory Note 205.8 - 205.8 - Equity securities 7.7 - 7.7 -
3,943.2 3,972.2 2,575.2 2,924.8
11. CASH AND BALANCES WITH CENTRAL BANKS
12. CASH AND CASH EQUIVALENTS
13. AVAILABLE-FOR-SALE FINANCIAL ASSETS
Society
Society
Society
Group
Group
Group
2010 2009 €m €m
2010 2009 €m €m
2010 2009 €m €m
2010 2009 €m €m
2010 2009 €m €m
2010 2009 €m €m
Mandatory reserve deposits are not available for use in the Group’s day-to-day operations.
Cash and cash equivalents include balances with residual maturities of less than 3 months and, balances with central bank, exclude the mandatory reserve deposits. Restricted cash amounts to €73.3m (2009: €119.8m) which relates to cash held under agreements with swap counterparties.
Equity securities comprise the fair value of callable perpetual fixed rate bonds received as consideration from NAMA for the transfer of assets. Information on the Promissory Note is included in note 33.
Notes to the Financial Statements 31 December 2010
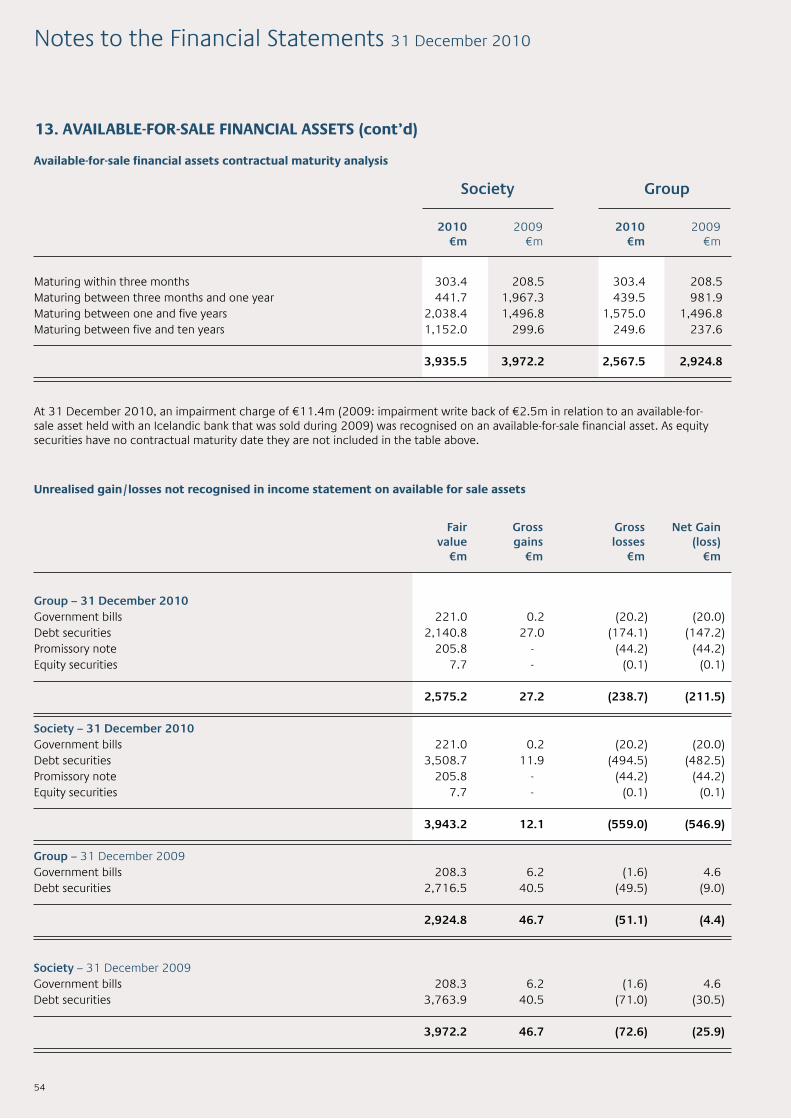
Group–31December2010 Government bills 221.0 0.2 (20.2) (20.0) Debt securities 2,140.8 27.0 (174.1) (147.2) Promissory note 205.8 - (44.2) (44.2) Equity securities 7.7 - (0.1) (0.1)
2,575.2 27.2 (238.7) (211.5)
Society–31December2010 Government bills 221.0 0.2 (20.2) (20.0) Debt securities 3,508.7 11.9 (494.5) (482.5) Promissory note 205.8 - (44.2) (44.2) Equity securities 7.7 - (0.1) (0.1)
3,943.2 12.1 (559.0) (546.9)
Group – 31 December 2009 Government bills 208.3 6.2 (1.6) 4.6 Debt securities 2,716.5 40.5 (49.5) (9.0) 2,924.8 46.7 (51.1) (4.4)
Society – 31 December 2009 Government bills 208.3 6.2 (1.6) 4.6 Debt securities 3,763.9 40.5 (71.0) (30.5)
3,972.2 46.7 (72.6) (25.9)
54
Maturing within three months 303.4 208.5 303.4 208.5 Maturing between three months and one year 441.7 1,967.3 439.5 981.9 Maturing between one and five years 2,038.4 1,496.8 1,575.0 1,496.8 Maturing between five and ten years 1,152.0 299.6 249.6 237.6
3,935.5 3,972.2 2,567.5 2,924.8
Available-for-sale financial assets contractual maturity analysis
Unrealised gain/losses not recognised in income statement on available for sale assets
Society Group
2010 2009 €m €m
Fair Gross value gains €m €m
2010 2009 €m €m
Gross Net Gain losses (loss) €m €m
At 31 December 2010, an impairment charge of €11.4m (2009: impairment write back of €2.5m in relation to an available-for-sale asset held with an Icelandic bank that was sold during 2009) was recognised on an available-for-sale financial asset. As equity securities have no contractual maturity date they are not included in the table above.
13. AVAILABLE-FOR-SALE FINANCIAL ASSETS (cont’d)
Notes to the Financial Statements 31 December 2010
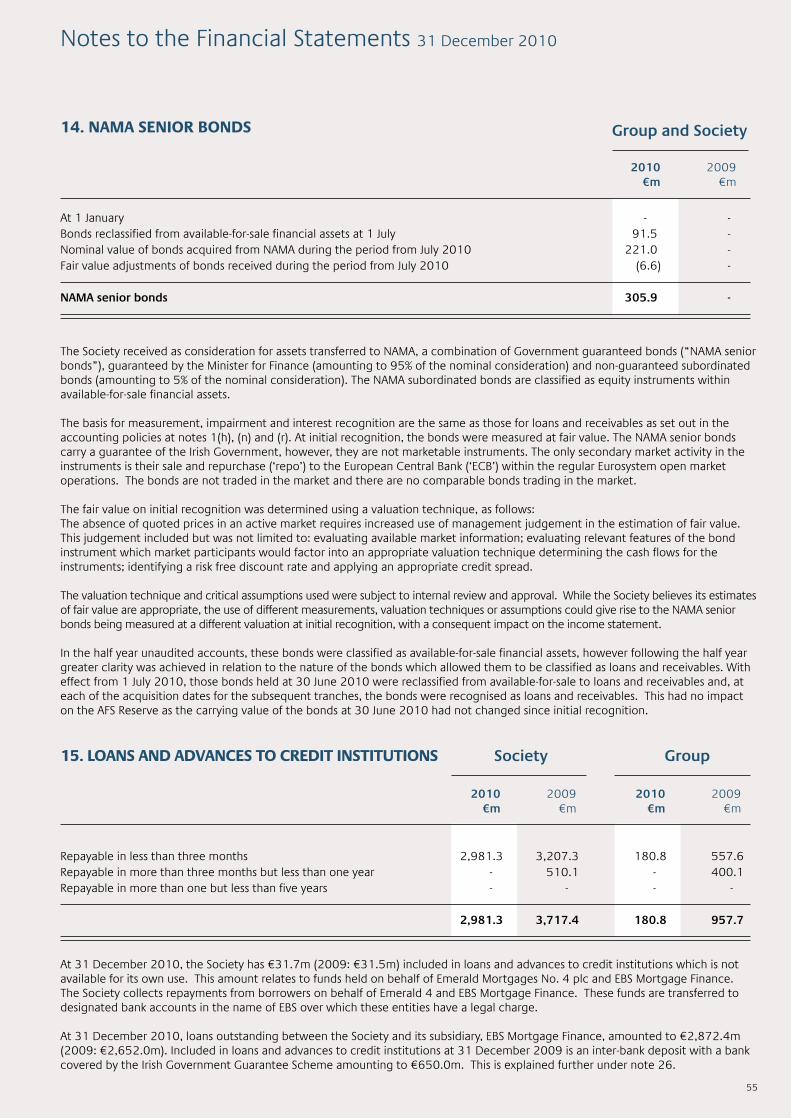
GroupandSociety
2010 2009 €m €m
55
14. NAMA SENIOR BONDS
At 1 January - - Bonds reclassified from available-for-sale financial assets at 1 July 91.5 - Nominal value of bonds acquired from NAMA during the period from July 2010 221.0 - Fair value adjustments of bonds received during the period from July 2010 (6.6) - NAMAseniorbonds 305.9 -
The Society received as consideration for assets transferred to NAMA, a combination of Government guaranteed bonds (“NAMA senior bonds”), guaranteed by the Minister for Finance (amounting to 95% of the nominal consideration) and non-guaranteed subordinated bonds (amounting to 5% of the nominal consideration). The NAMA subordinated bonds are classified as equity instruments within available-for-sale financial assets. The basis for measurement, impairment and interest recognition are the same as those for loans and receivables as set out in the accounting policies at notes 1(h), (n) and (r). At initial recognition, the bonds were measured at fair value. The NAMA senior bonds carry a guarantee of the Irish Government, however, they are not marketable instruments. The only secondary market activity in the instruments is their sale and repurchase (‘repo’) to the European Central Bank (‘ECB’) within the regular Eurosystem open market operations. The bonds are not traded in the market and there are no comparable bonds trading in the market. The fair value on initial recognition was determined using a valuation technique, as follows:The absence of quoted prices in an active market requires increased use of management judgement in the estimation of fair value. This judgement included but was not limited to: evaluating available market information; evaluating relevant features of the bond instrument which market participants would factor into an appropriate valuation technique determining the cash flows for the instruments; identifying a risk free discount rate and applying an appropriate credit spread. The valuation technique and critical assumptions used were subject to internal review and approval. While the Society believes its estimates of fair value are appropriate, the use of different measurements, valuation techniques or assumptions could give rise to the NAMA senior bonds being measured at a different valuation at initial recognition, with a consequent impact on the income statement. In the half year unaudited accounts, these bonds were classified as available-for-sale financial assets, however following the half year greater clarity was achieved in relation to the nature of the bonds which allowed them to be classified as loans and receivables. With effect from 1 July 2010, those bonds held at 30 June 2010 were reclassified from available-for-sale to loans and receivables and, at each of the acquisition dates for the subsequent tranches, the bonds were recognised as loans and receivables. This had no impact on the AFS Reserve as the carrying value of the bonds at 30 June 2010 had not changed since initial recognition.
Repayable in less than three months 2,981.3 3,207.3 180.8 557.6 Repayable in more than three months but less than one year - 510.1 - 400.1 Repayable in more than one but less than five years - - - -
2,981.3 3,717.4 180.8 957.7
15. LOANS AND ADVANCES TO CREDIT INSTITUTIONS Society Group
2010 2009 €m €m
2010 2009 €m €m
At 31 December 2010, the Society has €31.7m (2009: €31.5m) included in loans and advances to credit institutions which is not available for its own use. This amount relates to funds held on behalf of Emerald Mortgages No. 4 plc and EBS Mortgage Finance. The Society collects repayments from borrowers on behalf of Emerald 4 and EBS Mortgage Finance. These funds are transferred to designated bank accounts in the name of EBS over which these entities have a legal charge. At 31 December 2010, loans outstanding between the Society and its subsidiary, EBS Mortgage Finance, amounted to €2,872.4m (2009: €2,652.0m). Included in loans and advances to credit institutions at 31 December 2009 is an inter-bank deposit with a bank covered by the Irish Government Guarantee Scheme amounting to €650.0m. This is explained further under note 26.
Notes to the Financial Statements 31 December 2010

GroupandSociety
2010 2009 €m €m
GroupandSociety
2010 2009 €m €m
56
16. LOANS AND ADVANCES HELD-FOR-SALE TO NAMA
Loans and Advances held-for-sale to NAMA - Analysis by Contractual Maturity
At 1 January 750.6 - Transfer (to) from loans and advances to customers (10.8) 912.8 Transfer from provision for loan impairments (note 17) (6.4) (162.2) Impairment provisions utilised (note 10) 257.7 - Charge for impairment of loans and advances held-for-sale to NAMA (116.8) - Nominal value of loans transferred to NAMA (836.4) -
Loansandadvancesheld-for-saletoNAMA 37.9 750.6
Repayable in less than three months - 246.6 Repayable in more than three months but less than one year 4.4 200.0 Repayable in more than one but less than five years 5.2 150.4 Repayable in more than five years 56.0 315.8
Totalloansandadvancesheld-for-saletoNAMAbeforeprovisions 65.6 912.8 Less provision for loan impairments (27.7) (162.2)
Totalloansandadvanceheld-for-saletoNAMA 37.9 750.6
The Irish Government set up an asset relief scheme (‘the scheme’) in 2009 under the auspices of the National Asset Management Agency (‘NAMA’) in Ireland. The legislative basis for NAMA is the National Asset Management Agency Act 2009 which came into operation on 21 December 2009. The scheme was approved by the European Commission on 26 February 2010. EBS is a participating institution in the scheme. Those assets that are to transfer to NAMA are included in a held-for-sale category under IFRS and are set out below.The loans comprise land and development, residential and commercial exposures. NAMA will pay for these loans on the basis of valuations carried out by advisors in accordance with the pre-defined approved methodology. We expect to incur a loss on the transfer of these loans as a result of the difference between the carrying value of the assets transferred and the net fair value of the consideration received. The final amount of loans to be transferred together with the final discount is not known with certainty. This will only be known on completion of the transfers to NAMA. We have a constructive obligation to transfer loans to NAMA and we have determined the impairment provision based on an incurred loss model under IAS 39 taking into consideration the expected net proceeds on sales. During the year, held-for-sale assets with a nominal value of €836.4m were transferred to NAMA at an average discount of 60.4%. Further information in relation to this transfer is included in note 10. In 2010, net €10.8m of loans were reclassified to loans and advances to customers from loans and advances held-for-sale to NAMA as these assets are now not expected to transfer to NAMA. During the year an impairment charge of €116.8m was recognised in respect of loans in this category.
Notes to the Financial Statements 31 December 2010

GroupandSociety
2010 2009 €m €m
57
Loans and Advances held-for-sale to NAMA - Analysis by sector
Home loans - 10.6 Retail Buy to let - 6.3 Commercial Buy to Let 9.3 199.9
TotalResidential 9.3 216.8 Commercial 55.1 190.4 Development Finance 1.2 505.6
TotalLoansandadvancestocustomerbeforeprovisions 65.6 912.8 Less provision for loan impairments (27.7) (162.2)
Totalloansandadvanceheld-for-saletoNAMA 37.9 750.6
Provision for loan impairments on loans and advances held-for-sale to NAMA
IndividualProvisionforloanimpairments At 1 January 142.6 - Charge for impairment losses 102.0 - Transfer from loans and advances to customers (note 17) 10.8 142.6 Impairment provisions utilised (227.7) -
27.7 142.6
Collective provision for loan impairments At 1 January 19.6 - Charge for impairment losses 14.8 - Transfer (to) from loans and advances to customers (note 17) (4.4) 19.6 Impairment provision utilised (30.0) -
- 19.6
Totalprovisionforloanimpairmentsheld-for-saletoNAMA 27.7 162.2
Notes to the Financial Statements 31 December 2010
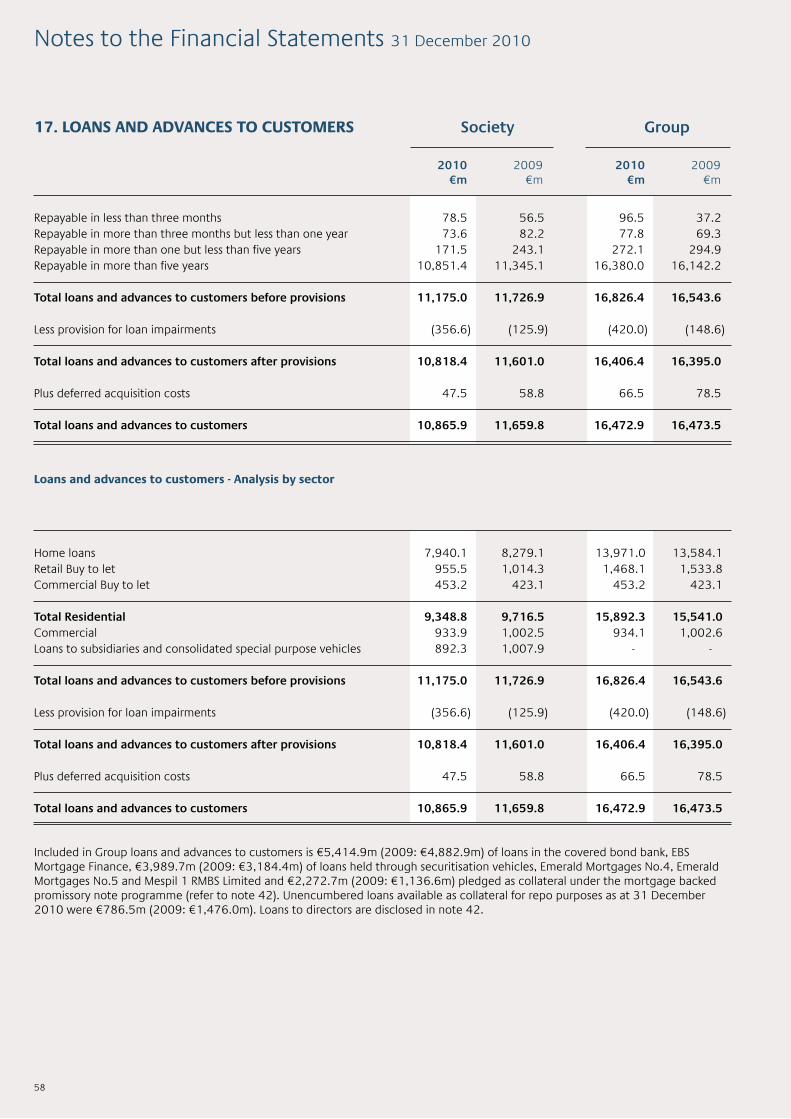
58
Repayable in less than three months 78.5 56.5 96.5 37.2 Repayable in more than three months but less than one year 73.6 82.2 77.8 69.3 Repayable in more than one but less than five years 171.5 243.1 272.1 294.9 Repayable in more than five years 10,851.4 11,345.1 16,380.0 16,142.2
Totalloansandadvancestocustomersbeforeprovisions 11,175.0 11,726.9 16,826.4 16,543.6 Less provision for loan impairments (356.6) (125.9) (420.0) (148.6)
Totalloansandadvancestocustomersafterprovisions 10,818.4 11,601.0 16,406.4 16,395.0 Plus deferred acquisition costs 47.5 58.8 66.5 78.5
Totalloansandadvancestocustomers 10,865.9 11,659.8 16,472.9 16,473.5
Home loans 7,940.1 8,279.1 13,971.0 13,584.1 Retail Buy to let 955.5 1,014.3 1,468.1 1,533.8 Commercial Buy to let 453.2 423.1 453.2 423.1
TotalResidential 9,348.8 9,716.5 15,892.3 15,541.0 Commercial 933.9 1,002.5 934.1 1,002.6 Loans to subsidiaries and consolidated special purpose vehicles 892.3 1,007.9 - -
Totalloansandadvancestocustomersbeforeprovisions 11,175.0 11,726.9 16,826.4 16,543.6 Less provision for loan impairments (356.6) (125.9) (420.0) (148.6)
Totalloansandadvancestocustomersafterprovisions 10,818.4 11,601.0 16,406.4 16,395.0 Plus deferred acquisition costs 47.5 58.8 66.5 78.5
Totalloansandadvancestocustomers 10,865.9 11,659.8 16,472.9 16,473.5
17. LOANS AND ADVANCES TO CUSTOMERS
Loans and advances to customers - Analysis by sector
Society Group
2010 2009 €m €m
2010 2009 €m €m
Included in Group loans and advances to customers is €5,414.9m (2009: €4,882.9m) of loans in the covered bond bank, EBS Mortgage Finance, €3,989.7m (2009: €3,184.4m) of loans held through securitisation vehicles, Emerald Mortgages No.4, Emerald Mortgages No.5 and Mespil 1 RMBS Limited and €2,272.7m (2009: €1,136.6m) pledged as collateral under the mortgage backed promissory note programme (refer to note 42). Unencumbered loans available as collateral for repo purposes as at 31 December 2010 were €786.5m (2009: €1,476.0m). Loans to directors are disclosed in note 42.
Notes to the Financial Statements 31 December 2010

59
Provisions for Loan impairments Society Group
2010 2009 €m €m
2010 2009 €m €m
Commercial consists of commercial term debt loans and residential consists of home loans, retail and commercial buy-to-let loans. The impairment charge recognised in the Group income statement for loans and advances to customers of €273.2m (Society: €239.2m) is based on the total charges above of €278.2m net of a €5.0m (Society: €4.5m) settlement received from Genworth in respect of mortgage indemnity insurance on a pool of loans which were greater than 6 months in arrears.
Notes to the Financial Statements 31 December 2010
Individualprovisionforloanimpairments At 1 January 42.6 70.0 44.4 70.0 Charge for impairment losses Loans and advances held-for-sale - 81.3 - 81.3 Commercial assets 66.4 14.8 66.4 14.9 Residential assets 99.0 19.5 109.7 21.2 Total charge for impairment losses 165.4 165.4 115.6 115.6 176.1 176.1 117.4 117.4 Transfer to Loans and advances held-for-sale to NAMA (note 16) (10.8) (142.6) (10.8) (142.6) Loans and advances written back (off) 0.3 (0.4) 0.3 (0.4)
At31December 197.5 42.6 210.0 44.4
Collective provision for loan impairments At 1 January 83.3 42.7 104.2 43.8 Charge for impairment losses Loans and advances held-for-sale - 2.1 - 2.1 Commercial assets 5.8 12.7 5.8 12.7 Residential assets 68.0 46.3 96.3 65.2 Total charge for impairment losses 73.8 73.8 61.1 61.1 102.1 102.1 80.0 80.0 Transfer to and from Loans and advances held-for-sale to NAMA (note 16) 4.4 (19.6) 4.4 (19.6) Loans and advances written off (0.8) - (0.7) - Transfer of impairment to subsidiary (1.6) (0.9) - - At31December 159.1 83.3 210.0 104.2
Totalprovisionforloanimpairmentsat31December 356.6 125.9 420.0 148.6
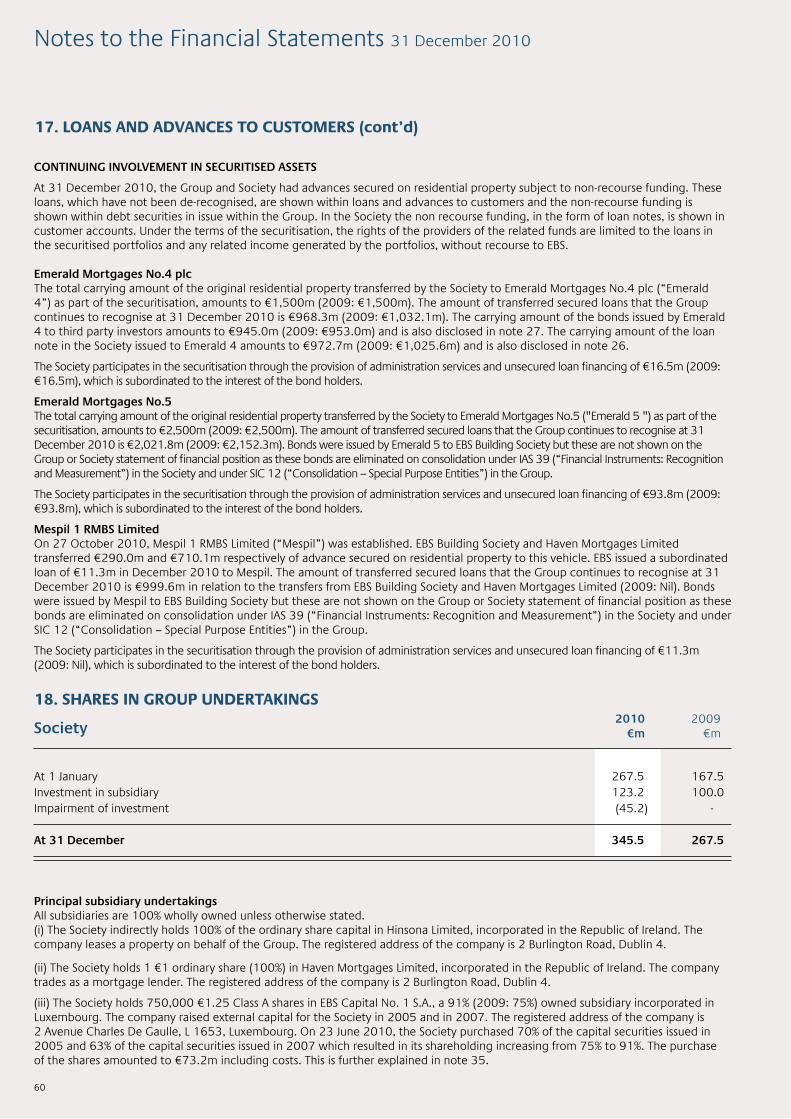
CONTINUING INVOLVEMENT IN SECURITISED ASSETS At 31 December 2010, the Group and Society had advances secured on residential property subject to non-recourse funding. These loans, which have not been de-recognised, are shown within loans and advances to customers and the non-recourse funding is shown within debt securities in issue within the Group. In the Society the non recourse funding, in the form of loan notes, is shown in customer accounts. Under the terms of the securitisation, the rights of the providers of the related funds are limited to the loans in the securitised portfolios and any related income generated by the portfolios, without recourse to EBS. EmeraldMortgagesNo.4plcThe total carrying amount of the original residential property transferred by the Society to Emerald Mortgages No.4 plc (“Emerald 4”) as part of the securitisation, amounts to €1,500m (2009: €1,500m). The amount of transferred secured loans that the Group continues to recognise at 31 December 2010 is €968.3m (2009: €1,032.1m). The carrying amount of the bonds issued by Emerald 4 to third party investors amounts to €945.0m (2009: €953.0m) and is also disclosed in note 27. The carrying amount of the loan note in the Society issued to Emerald 4 amounts to €972.7m (2009: €1,025.6m) and is also disclosed in note 26.
The Society participates in the securitisation through the provision of administration services and unsecured loan financing of €16.5m (2009: €16.5m), which is subordinated to the interest of the bond holders. EmeraldMortgagesNo.5The total carrying amount of the original residential property transferred by the Society to Emerald Mortgages No.5 ("Emerald 5 ") as part of the securitisation, amounts to €2,500m (2009: €2,500m). The amount of transferred secured loans that the Group continues to recognise at 31 December 2010 is €2,021.8m (2009: €2,152.3m). Bonds were issued by Emerald 5 to EBS Building Society but these are not shown on the Group or Society statement of financial position as these bonds are eliminated on consolidation under IAS 39 (“Financial Instruments: Recognition and Measurement”) in the Society and under SIC 12 (“Consolidation – Special Purpose Entities”) in the Group.
The Society participates in the securitisation through the provision of administration services and unsecured loan financing of €93.8m (2009: €93.8m), which is subordinated to the interest of the bond holders. Mespil1RMBSLimitedOn 27 October 2010, Mespil 1 RMBS Limited (“Mespil”) was established. EBS Building Society and Haven Mortgages Limited transferred €290.0m and €710.1m respectively of advance secured on residential property to this vehicle. EBS issued a subordinated loan of €11.3m in December 2010 to Mespil. The amount of transferred secured loans that the Group continues to recognise at 31 December 2010 is €999.6m in relation to the transfers from EBS Building Society and Haven Mortgages Limited (2009: Nil). Bonds were issued by Mespil to EBS Building Society but these are not shown on the Group or Society statement of financial position as these bonds are eliminated on consolidation under IAS 39 (“Financial Instruments: Recognition and Measurement”) in the Society and under SIC 12 (“Consolidation – Special Purpose Entities”) in the Group.
The Society participates in the securitisation through the provision of administration services and unsecured loan financing of €11.3m (2009: Nil), which is subordinated to the interest of the bond holders.
18. SHARES IN GROUP UNDERTAKINGS
Society
At 1 January 267.5 167.5 Investment in subsidiary 123.2 100.0 Impairment of investment (45.2) - At31December 345.5 267.5
2010 2009 €m €m
Principalsubsidiaryundertakings All subsidiaries are 100% wholly owned unless otherwise stated.(i) The Society indirectly holds 100% of the ordinary share capital in Hinsona Limited, incorporated in the Republic of Ireland. The company leases a property on behalf of the Group. The registered address of the company is 2 Burlington Road, Dublin 4. (ii) The Society holds 1 €1 ordinary share (100%) in Haven Mortgages Limited, incorporated in the Republic of Ireland. The company trades as a mortgage lender. The registered address of the company is 2 Burlington Road, Dublin 4. (iii) The Society holds 750,000 €1.25 Class A shares in EBS Capital No. 1 S.A., a 91% (2009: 75%) owned subsidiary incorporated in Luxembourg. The company raised external capital for the Society in 2005 and in 2007. The registered address of the company is 2 Avenue Charles De Gaulle, L 1653, Luxembourg. On 23 June 2010, the Society purchased 70% of the capital securities issued in 2005 and 63% of the capital securities issued in 2007 which resulted in its shareholding increasing from 75% to 91%. The purchase of the shares amounted to €73.2m including costs. This is further explained in note 35.
60
17. LOANS AND ADVANCES TO CUSTOMERS (cont’d)
Notes to the Financial Statements 31 December 2010

19. PROPERTY, PLANT AND EQUIPMENT
(iv) The Society holds 316,540,000 (2009: 266,540,000) €1 ordinary shares (100%) in EBS Mortgage Finance incorporated in the Republic of Ireland on 30 October 2008 and regulated as a designated credit institution. EBS Mortgage Finance does not sell mortgage loans directly to the public. Instead it has an origination agreement with the Society whereby the Society continues to sell mortgage loans directly to the public and subsequently sells these loans to EBS Mortgage Finance for an appropriate consideration. The registered address of the company is 2 Burlington Road, Dublin 4. On 28 April 2010 additional capital of €50.0m was issued by EBS Mortgage Finance to the Society. The Society assessed its investments in Group undertakings for impairment at 31 December 2010 in accordance with IAS 36 - Impairment of Assets. The carrying value is compared to the recoverable amount, which is the higher of value in use or fair value less costs to sell. The value in use being the amount by which the Society’s share of the future cash flows expected to be generated exceeds the carrying value for each investment with the exception of the investment in EBS Capital No. 1 S.A. The carrying value before impairment of the Society’s investment in EBS Capital No.1 S.A. at 31 December 2010 was €74.2m being Class A shares of €1.0m acquired in July 2005 and October 2007 and Class B shares (capital securities) of €73.2m acquired in June 2010. The market value of these capital securities has declined significantly since June 2010 and on 2 February 2011 Haven Mortgages Limited a wholly owned subsidiary of EBS Building Society made an offer to purchase the capital securities at a price of €175 for each €1,000 nominal and the average take up rate was 45% of outstanding capital securities held outside the Group. As there is no active market for these securities and as the Group is in receipt of state aid from the Irish Government no dividends can be paid to the holders of the securities. As there is no expectation that the reduction in the fair value of the capital securities held by EBS Building Society is other than permanent, an impairment provision of €45.2m is recognised in the Society’s income statement. This impairment charge does not effect the Group position as it is eliminated on consolidation.
Group
Cost or Valuation At 1 January 18.9 48.1 67.0 31.9 48.5 80.4 Additions - 1.0 1.0 - 4.3 4.3 Disposals - (0.2) (0.2) (0.2) (4.7) (4.9) Transfers - - - - - - Impairment deficit charged to reserves (0.2) - (0.2) (7.5) - (7.5) Impairment deficit charged to income (2.3) - (2.3) (5.3) - (5.3)
At31December 16.4 48.9 65.3 18.9 48.1 67.0
AccumulatedDepreciation At 1 January - 28.1 28.1 - 24.4 24.4 Charge for year - 4.4 4.4 - 4.6 4.6 Disposals - (0.1) (0.1) - (0.9) (0.9) At31December - 32.4 32.4 - 28.1 28.1 Netbookamountsat31December 16.4 16.5 32.9 18.9 20.0 38.9
2010 2009
Landand Fixtures Total buildings &fittings, equipment& motor vechicles €m €m €m
Land and Fixtures Total buildings & fittings, equipment & motor vechicles €m €m €m
61
Notes to the Financial Statements 31 December 2010
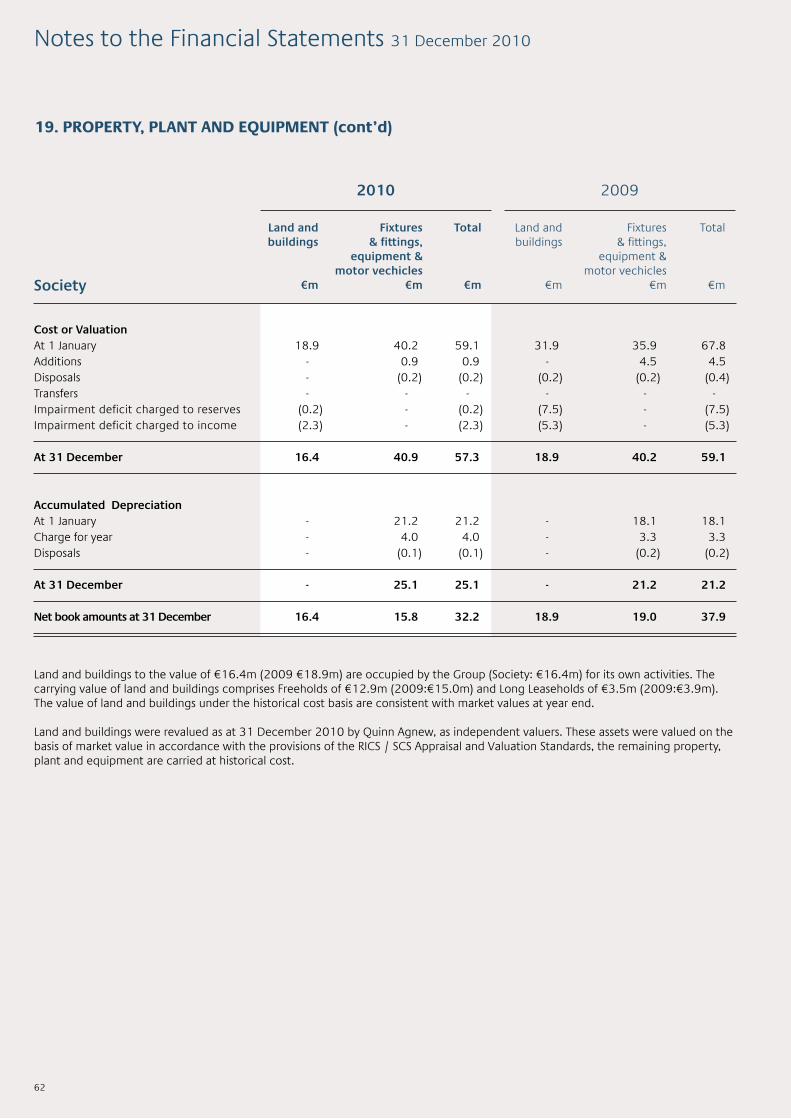
Land and buildings to the value of €16.4m (2009 €18.9m) are occupied by the Group (Society: €16.4m) for its own activities. The carrying value of land and buildings comprises Freeholds of €12.9m (2009:€15.0m) and Long Leaseholds of €3.5m (2009:€3.9m). The value of land and buildings under the historical cost basis are consistent with market values at year end. Land and buildings were revalued as at 31 December 2010 by Quinn Agnew, as independent valuers. These assets were valued on the basis of market value in accordance with the provisions of the RICS / SCS Appraisal and Valuation Standards, the remaining property, plant and equipment are carried at historical cost.
62
19. PROPERTY, PLANT AND EQUIPMENT (cont’d)
Notes to the Financial Statements 31 December 2010
Society
Cost or Valuation At 1 January 18.9 40.2 59.1 31.9 35.9 67.8 Additions - 0.9 0.9 - 4.5 4.5 Disposals - (0.2) (0.2) (0.2) (0.2) (0.4) Transfers - - - - - - Impairment deficit charged to reserves (0.2) - (0.2) (7.5) - (7.5) Impairment deficit charged to income (2.3) - (2.3) (5.3) - (5.3)
At31December 16.4 40.9 57.3 18.9 40.2 59.1
AccumulatedDepreciation At 1 January - 21.2 21.2 - 18.1 18.1 Charge for year - 4.0 4.0 - 3.3 3.3 Disposals - (0.1) (0.1) - (0.2) (0.2)
At31December - 25.1 25.1 - 21.2 21.2
Netbookamountsat31December 16.4 15.8 32.2 18.9 19.0 37.9
2010 2009
Landand Fixtures Total buildings &fittings, equipment& motor vechicles €m €m €m
Land and Fixtures Total buildings & fittings, equipment & motor vechicles €m €m €m
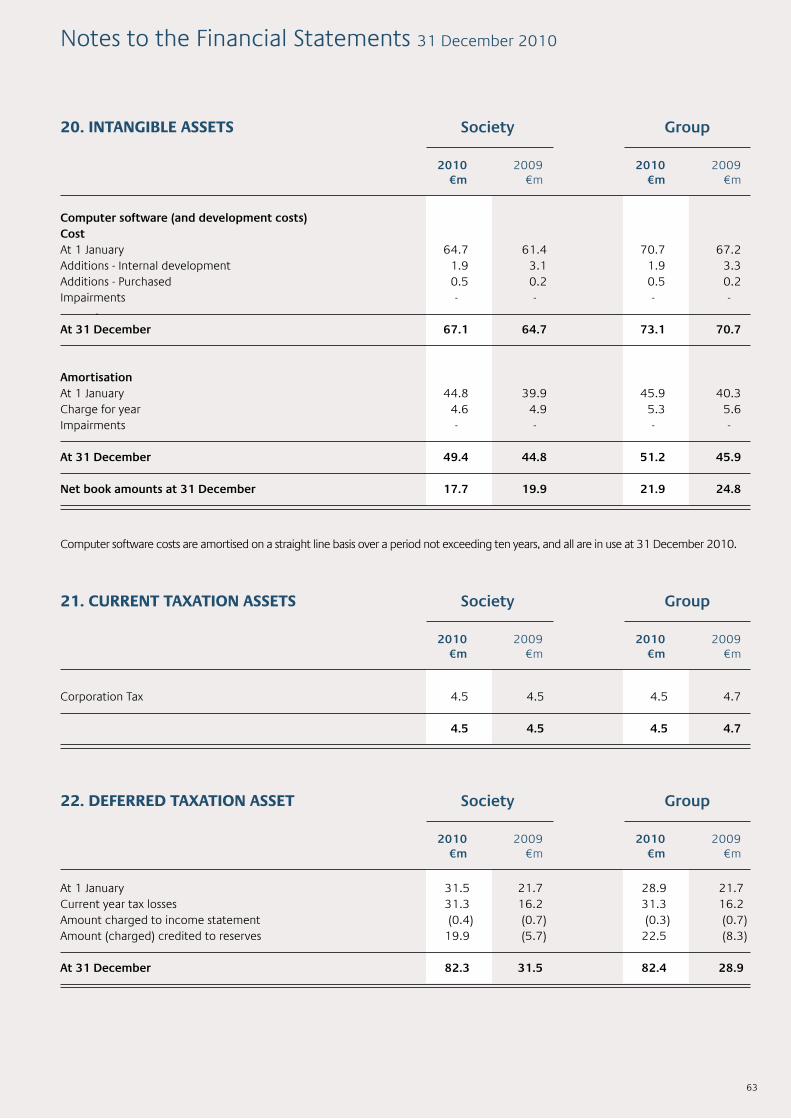
Computer software costs are amortised on a straight line basis over a period not exceeding ten years, and all are in use at 31 December 2010.
Computersoftware(anddevelopmentcosts) Cost At 1 January 64.7 61.4 70.7 67.2 Additions - Internal development 1.9 3.1 1.9 3.3 Additions - Purchased 0.5 0.2 0.5 0.2 Impairments - - - - - At31December 67.1 64.7 73.1 70.7 Amortisation At 1 January 44.8 39.9 45.9 40.3 Charge for year 4.6 4.9 5.3 5.6 Impairments - - - -
At31December 49.4 44.8 51.2 45.9 Netbookamountsat31December 17.7 19.9 21.9 24.8
Corporation Tax 4.5 4.5 4.5 4.7
4.5 4.5 4.5 4.7
At 1 January 31.5 21.7 28.9 21.7 Current year tax losses 31.3 16.2 31.3 16.2 Amount charged to income statement (0.4) (0.7) (0.3) (0.7) Amount (charged) credited to reserves 19.9 (5.7) 22.5 (8.3)
At31December 82.3 31.5 82.4 28.9
20. INTANGIBLE ASSETS
21. CURRENT TAXATION ASSETS
22. DEFERRED TAXATION ASSET
Society
Society
Society
Group
Group
Group
2010 2009 €m €m
2010 2009 €m €m
2010 2009 €m €m
2010 2009 €m €m
2010 2009 €m €m
2010 2009 €m €m
63
Notes to the Financial Statements 31 December 2010

The amounts provided in relation to deferred tax assets are as follows:
Deferred tax relating to unutilised tax losses and deductible temporary differences are recognised if it is probable that they can be offset against future taxable profits.
At 31 December 2010, deferred tax assets on tax losses and other temporary differences totalled €82.4m for the Group (2009: €28.9m) and €82.3m for the Society (2009: €31.5m). The most significant element of this arises due to corporation tax losses in the Society and their utilisation is dependent on future taxable profits. The Directors have considered the assumptions underlying the recoverability of the deferred tax assets based on future taxable profits and concluded that there is a reasonable basis for projecting that future taxable profits will be available against which to offset the deferred tax asset.
Retirement benefits 2.2 2.1 2.2 2.1 Available-for-sale financial assets 26.4 3.2 26.4 0.6 Cashflow hedge reserve 5.4 9.3 5.4 9.3 Impairment of properties 0.7 0.7 0.7 0.7 Tax losses recognised 47.6 16.2 47.6 16.2 Other temporary differences - - 0.1 - 82.3 31.5 82.4 28.9
Society Group
2010 2009 €m €m
2010 2009 €m €m
Interest accrued 57.9 39.5 46.6 37.6 Other 16.3 18.5 17.3 17.6 74.2 58.0 63.9 55.2
23. OTHER ASSETS
24. DEPOSITS BY CENTRAL BANKS - CONTRACTUAL MATURITY ANALYSIS
Society Group
2010 2009 €m €m
2010 2009 €m €m
Repayable in less than three months 4,880.0 1,600.0 4,880.0 1,600.0 Repayable in more than three months but less than one year - 900.0 - 900.0
4,880.0 2,500.0 4,880.0 2,500.0
Society Group
2010 2009 €m €m
2010 2009 €m €m
64
Other assets comprises accrued interest, deferred income and prepayments of administrative expenses.
22. DEFERRED TAXATION ASSET (cont’d)
Notes to the Financial Statements 31 December 2010
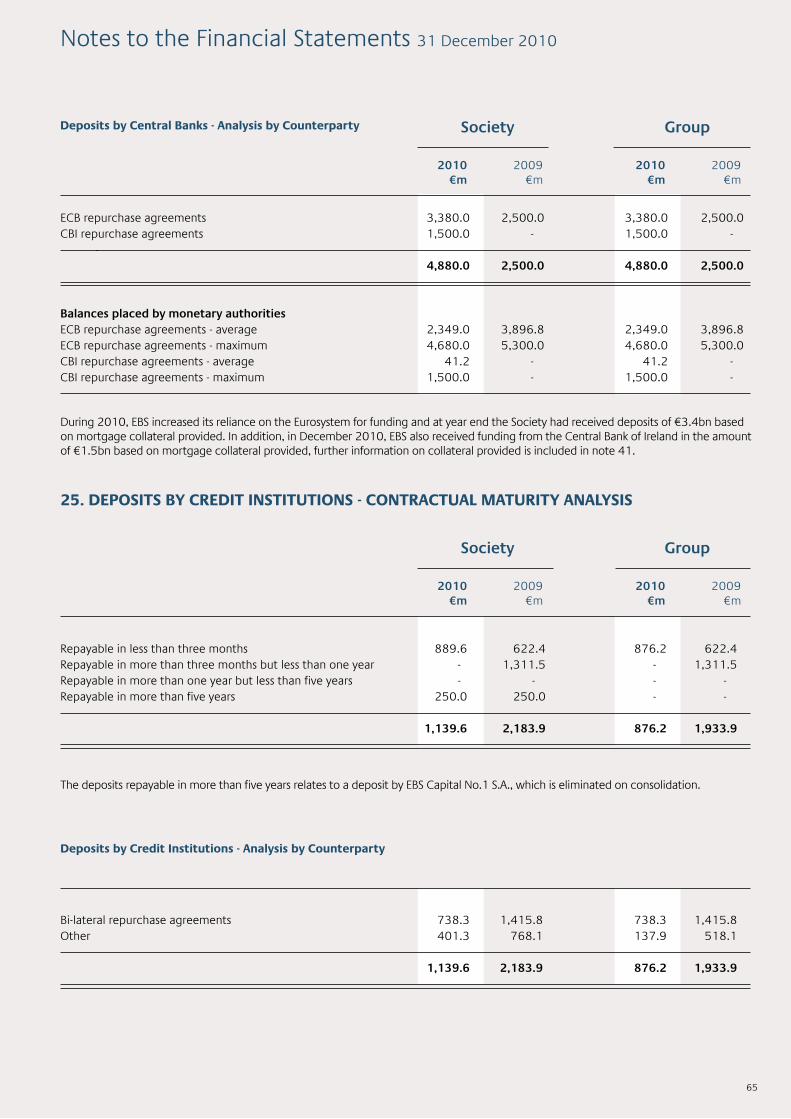
During 2010, EBS increased its reliance on the Eurosystem for funding and at year end the Society had received deposits of €3.4bn based on mortgage collateral provided. In addition, in December 2010, EBS also received funding from the Central Bank of Ireland in the amount of €1.5bn based on mortgage collateral provided, further information on collateral provided is included in note 41.
The deposits repayable in more than five years relates to a deposit by EBS Capital No.1 S.A., which is eliminated on consolidation.
Repayable in less than three months 889.6 622.4 876.2 622.4 Repayable in more than three months but less than one year - 1,311.5 - 1,311.5 Repayable in more than one year but less than five years - - - - Repayable in more than five years 250.0 250.0 - - 1,139.6 2,183.9 876.2 1,933.9
25. DEPOSITS BY CREDIT INSTITUTIONS - CONTRACTUAL MATURITY ANALYSIS
Society Group
2010 2009 €m €m
2010 2009 €m €m
ECB repurchase agreements 3,380.0 2,500.0 3,380.0 2,500.0 CBI repurchase agreements 1,500.0 - 1,500.0 - - 4,880.0 2,500.0 4,880.0 2,500.0 Balancesplacedbymonetaryauthorities ECB repurchase agreements - average 2,349.0 3,896.8 2,349.0 3,896.8 ECB repurchase agreements - maximum 4,680.0 5,300.0 4,680.0 5,300.0 CBI repurchase agreements - average 41.2 - 41.2 - CBI repurchase agreements - maximum 1,500.0 - 1,500.0 -
Deposits by Central Banks - Analysis by Counterparty Society Group
2010 2009 €m €m
2010 2009 €m €m
Bi-lateral repurchase agreements 738.3 1,415.8 738.3 1,415.8 Other 401.3 768.1 137.9 518.1 1,139.6 2,183.9 876.2 1,933.9
Deposits by Credit Institutions - Analysis by Counterparty
65
Notes to the Financial Statements 31 December 2010
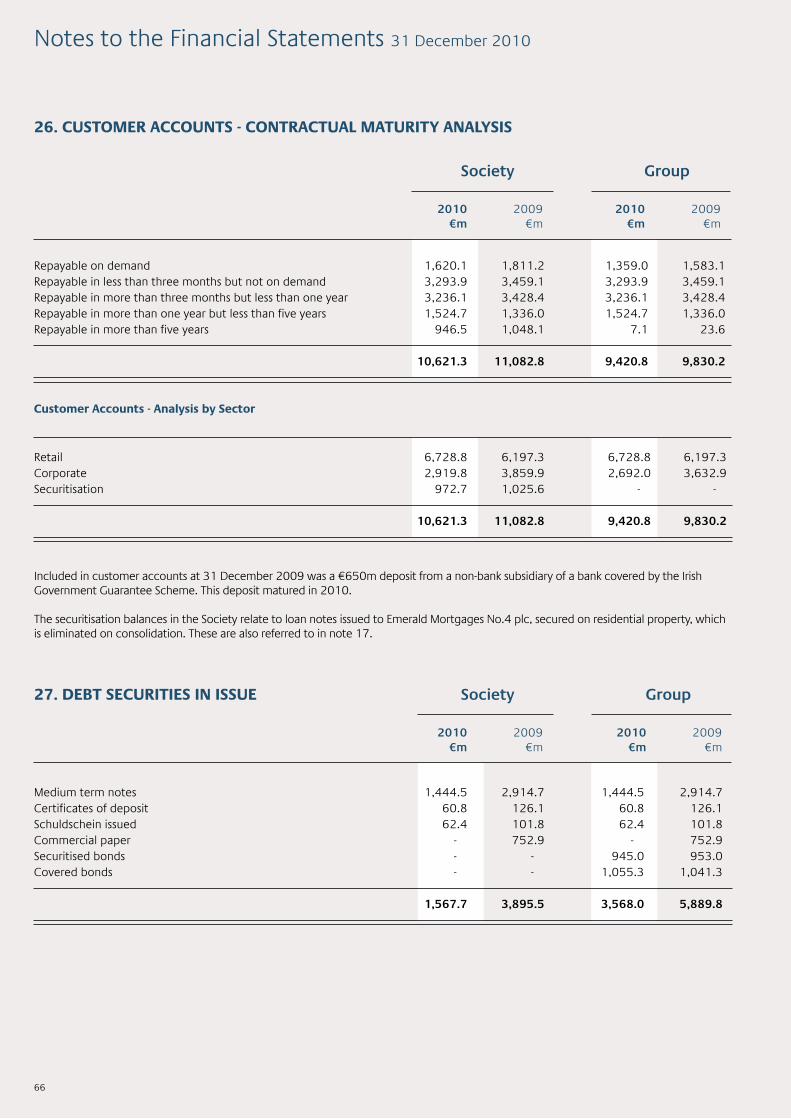
Repayable on demand 1,620.1 1,811.2 1,359.0 1,583.1 Repayable in less than three months but not on demand 3,293.9 3,459.1 3,293.9 3,459.1 Repayable in more than three months but less than one year 3,236.1 3,428.4 3,236.1 3,428.4 Repayable in more than one year but less than five years 1,524.7 1,336.0 1,524.7 1,336.0 Repayable in more than five years 946.5 1,048.1 7.1 23.6
10,621.3 11,082.8 9,420.8 9,830.2
Medium term notes 1,444.5 2,914.7 1,444.5 2,914.7 Certificates of deposit 60.8 126.1 60.8 126.1 Schuldschein issued 62.4 101.8 62.4 101.8 Commercial paper - 752.9 - 752.9 Securitised bonds - - 945.0 953.0 Covered bonds - - 1,055.3 1,041.3 1,567.7 3,895.5 3,568.0 5,889.8
26. CUSTOMER ACCOUNTS - CONTRACTUAL MATURITY ANALYSIS
27. DEBT SECURITIES IN ISSUE
Society
Society
Group
Group
2010 2009 €m €m
2010 2009 €m €m
2010 2009 €m €m
2010 2009 €m €m
Retail 6,728.8 6,197.3 6,728.8 6,197.3 Corporate 2,919.8 3,859.9 2,692.0 3,632.9 Securitisation 972.7 1,025.6 - -
10,621.3 11,082.8 9,420.8 9,830.2
Customer Accounts - Analysis by Sector
Included in customer accounts at 31 December 2009 was a €650m deposit from a non-bank subsidiary of a bank covered by the Irish Government Guarantee Scheme. This deposit matured in 2010. The securitisation balances in the Society relate to loan notes issued to Emerald Mortgages No.4 plc, secured on residential property, which is eliminated on consolidation. These are also referred to in note 17.
66
Notes to the Financial Statements 31 December 2010
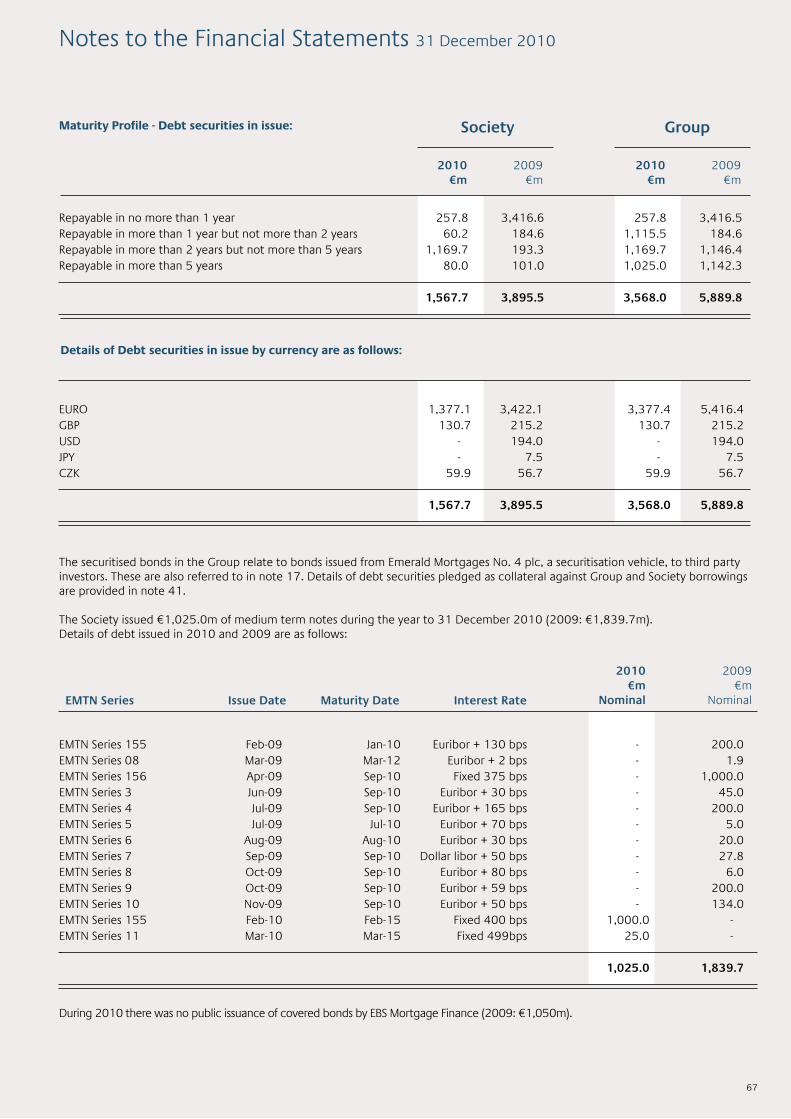
The securitised bonds in the Group relate to bonds issued from Emerald Mortgages No. 4 plc, a securitisation vehicle, to third party investors. These are also referred to in note 17. Details of debt securities pledged as collateral against Group and Society borrowings are provided in note 41. The Society issued €1,025.0m of medium term notes during the year to 31 December 2010 (2009: €1,839.7m). Details of debt issued in 2010 and 2009 are as follows:
During 2010 there was no public issuance of covered bonds by EBS Mortgage Finance (2009: €1,050m).
Repayable in no more than 1 year 257.8 3,416.6 257.8 3,416.5 Repayable in more than 1 year but not more than 2 years 60.2 184.6 1,115.5 184.6 Repayable in more than 2 years but not more than 5 years 1,169.7 193.3 1,169.7 1,146.4 Repayable in more than 5 years 80.0 101.0 1,025.0 1,142.3 1,567.7 3,895.5 3,568.0 5,889.8
EURO 1,377.1 3,422.1 3,377.4 5,416.4 GBP 130.7 215.2 130.7 215.2 USD - 194.0 - 194.0 JPY - 7.5 - 7.5 CZK 59.9 56.7 59.9 56.7
1,567.7 3,895.5 3,568.0 5,889.8
EMTN Series 155 Feb-09 Jan-10 Euribor + 130 bps - 200.0 EMTN Series 08 Mar-09 Mar-12 Euribor + 2 bps - 1.9 EMTN Series 156 Apr-09 Sep-10 Fixed 375 bps - 1,000.0 EMTN Series 3 Jun-09 Sep-10 Euribor + 30 bps - 45.0 EMTN Series 4 Jul-09 Sep-10 Euribor + 165 bps - 200.0 EMTN Series 5 Jul-09 Jul-10 Euribor + 70 bps - 5.0 EMTN Series 6 Aug-09 Aug-10 Euribor + 30 bps - 20.0 EMTN Series 7 Sep-09 Sep-10 Dollar libor + 50 bps - 27.8 EMTN Series 8 Oct-09 Sep-10 Euribor + 80 bps - 6.0 EMTN Series 9 Oct-09 Sep-10 Euribor + 59 bps - 200.0 EMTN Series 10 Nov-09 Sep-10 Euribor + 50 bps - 134.0 EMTN Series 155 Feb-10 Feb-15 Fixed 400 bps 1,000.0 - EMTN Series 11 Mar-10 Mar-15 Fixed 499bps 25.0 - - 1,025.0 1,839.7
Maturity Profile - Debt securities in issue:
Details of Debt securities in issue by currency are as follows:
Society Group
2010 2009 €m €m
2010 2009 €m €m
67
EMTN Series Issue Date Maturity Date Interest Rate
2010 €m
Nominal
2009 €m
Nominal
Notes to the Financial Statements 31 December 2010

Other taxes 11.6 11.5 11.6 11.6
11.6 11.5 11.6 11.6
Interest accrued 231.0 261.6 219.6 268.9 Other accruals 71.3 58.1 36.6 24.9
302.3 319.7 256.2 293.8
At 1 January 0.2 5.8 9.7 13.2 Transfer to current taxation Amount (credited) charged to the income statement 0.1 (4.6) (0.2) (2.8) Amount charged to other assets - - 0.3 0.3 Amount charged (credited) to reserves - (1.0) - (1.0)
At31December 0.3 0.2 9.8 9.7
Theamountsprovidedfordeferredtaxareasfollows: Capital allowances in excess of depreciation 0.3 0.2 8.2 7.7 Impairment of properties - - - - Non controlling interest - - - - Other temporary differences - - 1.6 2.0
0.3 0.2 9.8 9.7
28. CURRENT TAX LIABILITIES
30. OTHER LIABILITIES
29. DEFERRED TAXATION LIABILITY
Society
Society
Society
Group
Group
Group
2010 2009 €m €m
2010 2009 €m €m
2010 2009 €m €m
2010 2009 €m €m
2010 2009 €m €m
2010 2009 €m €m
Other liabilities comprises interest payable, Government Guarantee Scheme charges and accruals in respect of administrative expenses. Also included in other accruals for the Group and Society at 31 December 2010 is an amount of €1.8m in relation to NAMA servicing liabilities (2009: Nil).
68
Notes to the Financial Statements 31 December 2010

31. EMPLOYEE BENEFITS
GroupandSociety
Definedcontributionschemes The assets of the schemes are held separately from those of the Group. The total cost charged to the income statement in staff costs in the Group is €0.7m (2009: €0.4m) and in the Society is €0.7m (2009: €0.4m). These represent contributions payable to these plans by the Group and Society. Definedbenefitschemes The Group operates a number of defined benefit pension schemes. The assets of the schemes are held separately from those of the Group and all schemes are funded. The charge to the Group is €1.4m (2009: €3.6m) and to the Society is €1.3m (2009: €3.2m). The amounts recognised in the statement of financial position are determined as follows:
Present value of pension obligations (129.9) (111.5) Fair value of plan assets 112.5 94.5 Liabilityinthestatementoffinancialposition (17.4) (17.0)
Movementinthepresentvalueofpensionobligations: At 1 January (111.5) (111.8) Current service costs (1.3) (2.2) Interest cost (6.8) (6.5)Past service costs (0.1) (0.1) Participants’ contributions (2.1) (1.6) Actuarial (losses) gains (10.6) 8.1 Benefits paid from plan 2.3 2.3 Premia paid 0.2 0.3
At31December (129.9) (111.5)
Movementinthefairvalueofplanassets: At 1 January 94.5 73.1 Expected return on plan assets 6.8 5.2 Employer contributions 5.3 5.7 Participants’ contributions 2.1 1.6 Actuarial gains 6.3 11.5 Benefits paid from plan (2.3) (2.3) Premia paid (0.2) (0.3)
At31December 112.5 94.5 Theamountsrecognisedintheincomestatementareasfollows: Defined benefit schemes - - Current service costs (1.3) (2.2) Past service costs (0.1) (0.1) Interest cost (6.8) (6.5) Future expected return on plan assets 6.8 5.2 Totalexpenses(includedinstaffcosts) (1.4) (3.6)
Pension plan assets The fair value of the pension plan assets 112.5 94.5 The actual return on pension plan assets 13.1 16.7
2010 2009 €m €m
69
Notes to the Financial Statements 31 December 2010

Rate of inflation 2.00% 2.00% Discount rate 5.60% 6.00% Expected long term return on plan assets 7.03% 6.98% Future salary increases 3.00% 3.25% Future pension increases 2.00% 2.00%
2010 2009
GroupandSociety
The expected rates of return on individual asset classes are estimated using current and projected economic and market factors. The principal actuarial assumptions used for calculating the pension obligations were as follows:
Contributions are determined in accordance with the advice of Mercer, using the projected unit credit method. The most recent valuations were carried out as of 1 January 2008 and showed that the actuarial value of the schemes’ assets represented 90% of the benefits that had accrued to members after allowing for expected future increases in earnings. The actuarial reports are available for inspection by members of the scheme and are not available for public inspection. None of the pension plans’ assets are invested in the Society’s or Group’s own financial instruments. The main post retirement mortality assumptions used at 31 December 2010 were 108% PNML00 with age rating -1 for active, deferred members and pensioners, with future mortality improvements for active and deferred members. On this basis the life expectancy for a male pensioner aged 65 at 31 December 2010 was 22.8 years (2009: 21.6 years) and for a female pensioner aged 65 years was 24.4 years (2009: 24.7 years). Based on the assumed mortality improvements in 15 years time the life expectancy for a male pensioner aged 65 years will have increased to 25 years (2009: 22.7 years) and for a female pensioner then aged 65 years will have increased to 26.2 years (2009: 25.7 years). There are inherent uncertainties around the financial assumptions adopted in calculating the actuarial valuation of the pension schemes. An increase or decrease in the discount rate of 20 basis points would reduce or increase the scheme liabilities by 4.6%. The contributions to be paid in 2011 are estimated to be €5.0m. The death in service premiums in 2011 are estimated to be €0.3m.
70
Asset Category Equity securities 74.9% 8.1% 74.1% 8.1% Debt securities 24.2% 4.0% 25.5% 4.0% Real estate and other 0.6% 7.1% - 7.3% Others 0.3% 2.0% 0.4% 2.5%
Total 100.0% 7.0% 100.0% 7.0%
Pension Plan Assets at 31 December
2010
GroupandSociety
2009
Group and Society
Percentage Future ofplan expected assets return on plan assets
Percentage Future of plan expected assets return on plan assets
31. EMPLOYEE BENEFITS (cont’d)
Notes to the Financial Statements 31 December 2010
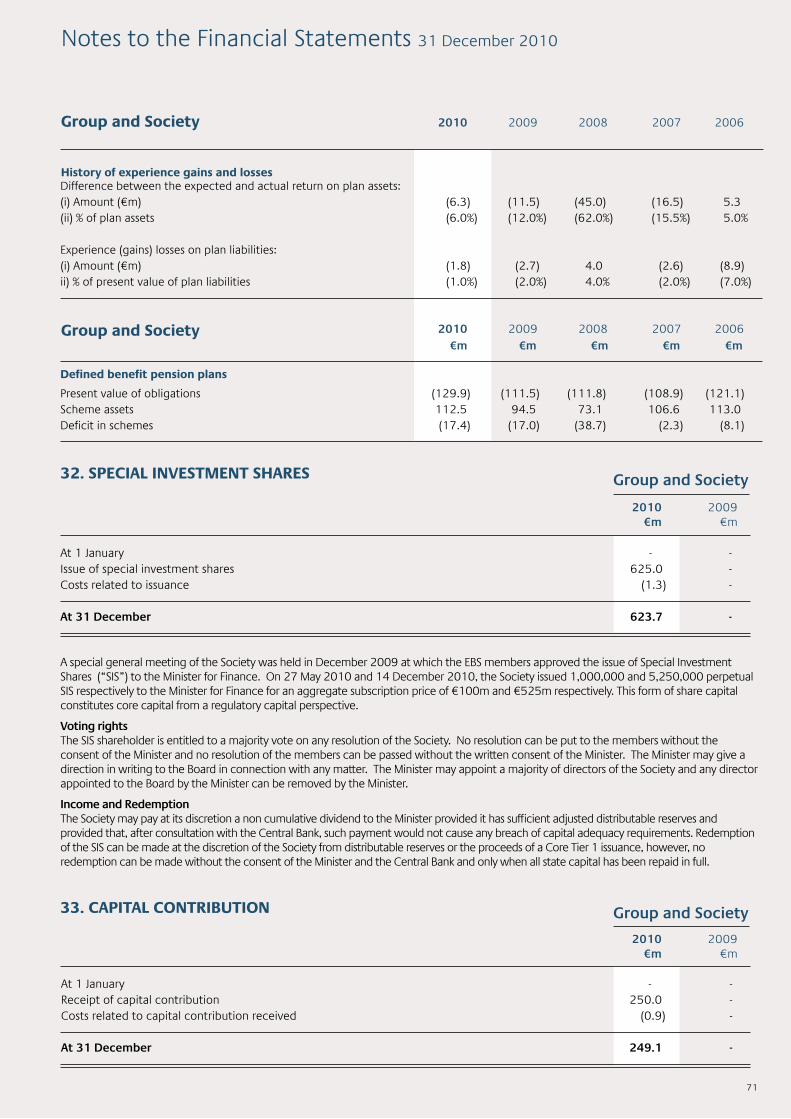
GroupandSociety
2010 2009 €m €m
GroupandSociety
2010 2009 €m €m
A special general meeting of the Society was held in December 2009 at which the EBS members approved the issue of Special Investment Shares (“SIS”) to the Minister for Finance. On 27 May 2010 and 14 December 2010, the Society issued 1,000,000 and 5,250,000 perpetual SIS respectively to the Minister for Finance for an aggregate subscription price of €100m and €525m respectively. This form of share capital constitutes core capital from a regulatory capital perspective. Voting rightsThe SIS shareholder is entitled to a majority vote on any resolution of the Society. No resolution can be put to the members without the consent of the Minister and no resolution of the members can be passed without the written consent of the Minister. The Minister may give a direction in writing to the Board in connection with any matter. The Minister may appoint a majority of directors of the Society and any director appointed to the Board by the Minister can be removed by the Minister. IncomeandRedemptionThe Society may pay at its discretion a non cumulative dividend to the Minister provided it has sufficient adjusted distributable reserves and provided that, after consultation with the Central Bank, such payment would not cause any breach of capital adequacy requirements. Redemption of the SIS can be made at the discretion of the Society from distributable reserves or the proceeds of a Core Tier 1 issuance, however, no redemption can be made without the consent of the Minister and the Central Bank and only when all state capital has been repaid in full.
32. SPECIAL INVESTMENT SHARES
33. CAPITAL CONTRIBUTION
At 1 January - - Issue of special investment shares 625.0 - Costs related to issuance (1.3) -
At31December 623.7 -
At 1 January - - Receipt of capital contribution 250.0 - Costs related to capital contribution received (0.9) -
At31December 249.1 -
71
Difference between the expected and actual return on plan assets: (i) Amount (€m) (6.3) (11.5) (45.0) (16.5) 5.3 (ii) % of plan assets (6.0%) (12.0%) (62.0%) (15.5%) 5.0% Experience (gains) losses on plan liabilities: (i) Amount (€m) (1.8) (2.7) 4.0 (2.6) (8.9) ii) % of present value of plan liabilities (1.0%) (2.0%) 4.0% (2.0%) (7.0%)
€m €m €m €m €m
Present value of obligations (129.9) (111.5) (111.8) (108.9) (121.1) Scheme assets 112.5 94.5 73.1 106.6 113.0 Deficit in schemes (17.4) (17.0) (38.7) (2.3) (8.1)
History of experience gains and losses
Defined benefit pension plans
Group and Society
Group and Society
2010
2010
2009
2009
2008
2008
2007
2007
2006
2006
Notes to the Financial Statements 31 December 2010
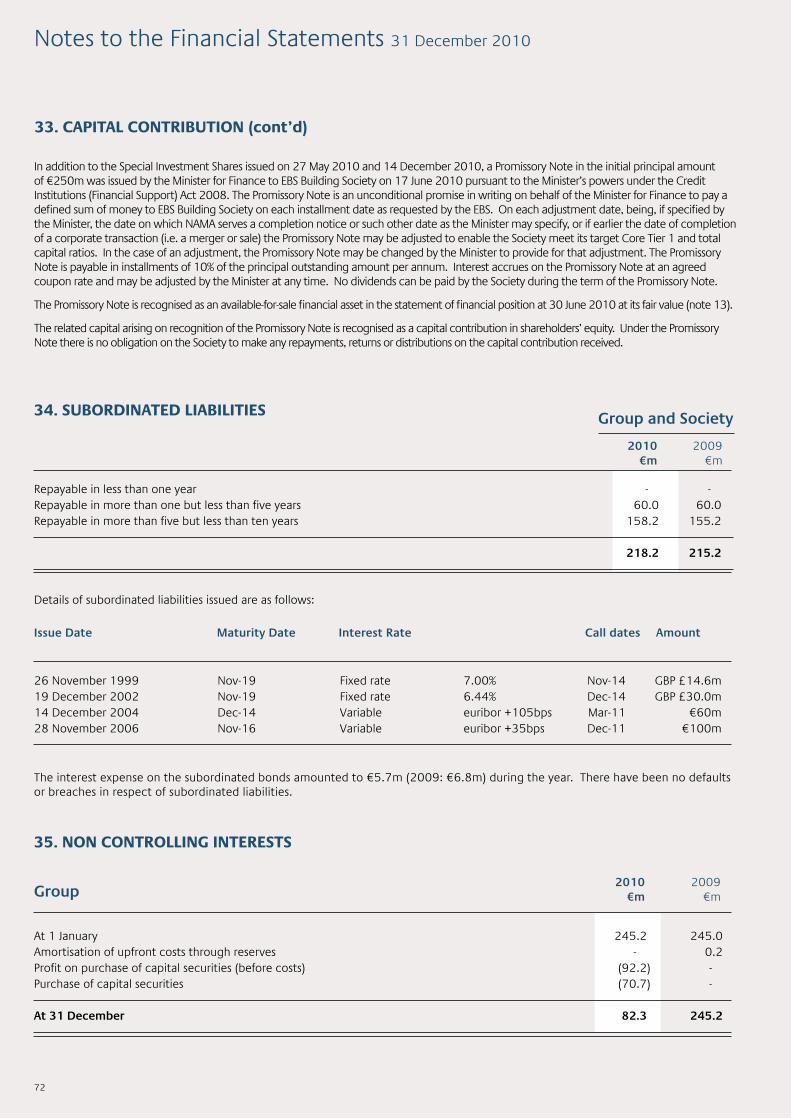
GroupandSociety
2010 2009 €m €m
In addition to the Special Investment Shares issued on 27 May 2010 and 14 December 2010, a Promissory Note in the initial principal amount of €250m was issued by the Minister for Finance to EBS Building Society on 17 June 2010 pursuant to the Minister’s powers under the Credit Institutions (Financial Support) Act 2008. The Promissory Note is an unconditional promise in writing on behalf of the Minister for Finance to pay a defined sum of money to EBS Building Society on each installment date as requested by the EBS. On each adjustment date, being, if specified by the Minister, the date on which NAMA serves a completion notice or such other date as the Minister may specify, or if earlier the date of completion of a corporate transaction (i.e. a merger or sale) the Promissory Note may be adjusted to enable the Society meet its target Core Tier 1 and total capital ratios. In the case of an adjustment, the Promissory Note may be changed by the Minister to provide for that adjustment. The Promissory Note is payable in installments of 10% of the principal outstanding amount per annum. Interest accrues on the Promissory Note at an agreed coupon rate and may be adjusted by the Minister at any time. No dividends can be paid by the Society during the term of the Promissory Note. The Promissory Note is recognised as an available-for-sale financial asset in the statement of financial position at 30 June 2010 at its fair value (note 13). The related capital arising on recognition of the Promissory Note is recognised as a capital contribution in shareholders’ equity. Under the Promissory Note there is no obligation on the Society to make any repayments, returns or distributions on the capital contribution received.
The interest expense on the subordinated bonds amounted to €5.7m (2009: €6.8m) during the year. There have been no defaults or breaches in respect of subordinated liabilities.
34. SUBORDINATED LIABILITIES
35. NON CONTROLLING INTERESTS
Group
Repayable in less than one year - - Repayable in more than one but less than five years 60.0 60.0 Repayable in more than five but less than ten years 158.2 155.2 218.2 215.2
26 November 1999 Nov-19 Fixed rate 7.00% Nov-14 GBP £14.6m 19 December 2002 Nov-19 Fixed rate 6.44% Dec-14 GBP £30.0m 14 December 2004 Dec-14 Variable euribor +105bps Mar-11 €60m 28 November 2006 Nov-16 Variable euribor +35bps Dec-11 €100m
At 1 January 245.2 245.0 Amortisation of upfront costs through reserves - 0.2 Profit on purchase of capital securities (before costs) (92.2) - Purchase of capital securities (70.7) -
At31December 82.3 245.2
2010 2009 €m €m
72
Issue Date Maturity Date Interest Rate Calldates Amount
33. CAPITAL CONTRIBUTION (cont’d)
Notes to the Financial Statements 31 December 2010
Details of subordinated liabilities issued are as follows:
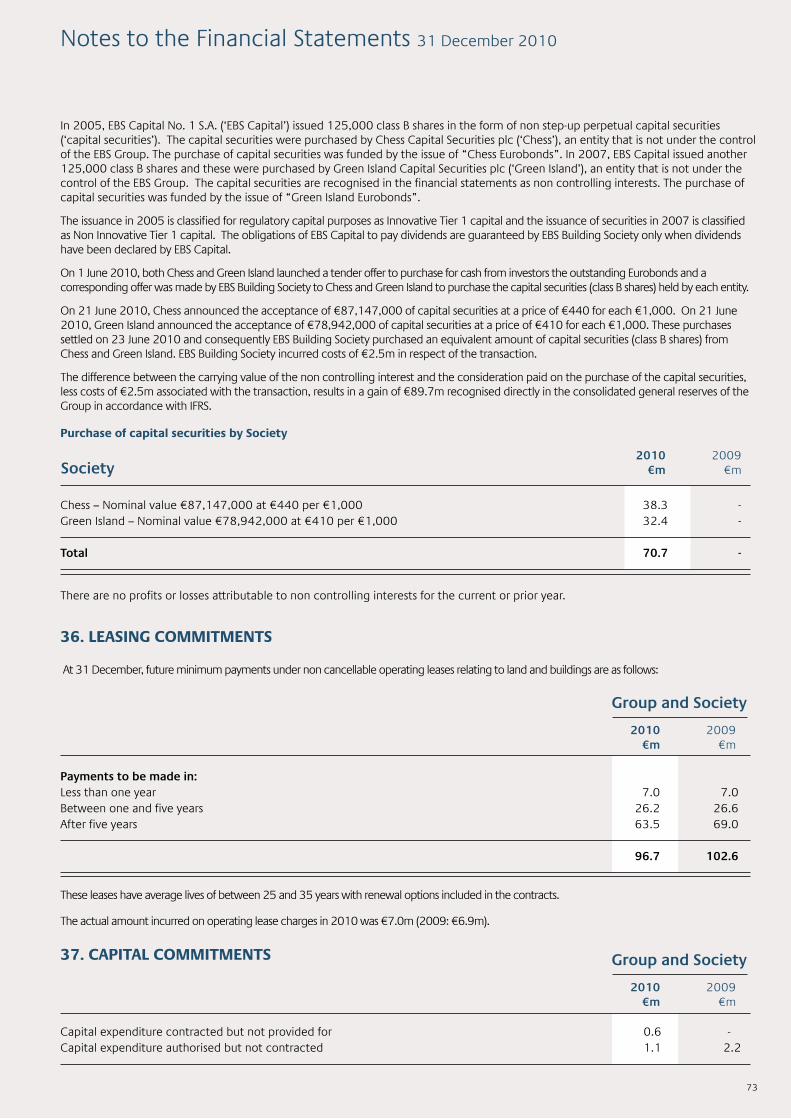
GroupandSociety
2010 2009 €m €m
GroupandSociety
2010 2009 €m €m
In 2005, EBS Capital No. 1 S.A. (‘EBS Capital’) issued 125,000 class B shares in the form of non step-up perpetual capital securities (‘capital securities’). The capital securities were purchased by Chess Capital Securities plc (‘Chess’), an entity that is not under the control of the EBS Group. The purchase of capital securities was funded by the issue of “Chess Eurobonds”. In 2007, EBS Capital issued another 125,000 class B shares and these were purchased by Green Island Capital Securities plc (‘Green Island’), an entity that is not under the control of the EBS Group. The capital securities are recognised in the financial statements as non controlling interests. The purchase of capital securities was funded by the issue of “Green Island Eurobonds”. The issuance in 2005 is classified for regulatory capital purposes as Innovative Tier 1 capital and the issuance of securities in 2007 is classified as Non Innovative Tier 1 capital. The obligations of EBS Capital to pay dividends are guaranteed by EBS Building Society only when dividends have been declared by EBS Capital. On 1 June 2010, both Chess and Green Island launched a tender offer to purchase for cash from investors the outstanding Eurobonds and a corresponding offer was made by EBS Building Society to Chess and Green Island to purchase the capital securities (class B shares) held by each entity. On 21 June 2010, Chess announced the acceptance of €87,147,000 of capital securities at a price of €440 for each €1,000. On 21 June 2010, Green Island announced the acceptance of €78,942,000 of capital securities at a price of €410 for each €1,000. These purchases settled on 23 June 2010 and consequently EBS Building Society purchased an equivalent amount of capital securities (class B shares) from Chess and Green Island. EBS Building Society incurred costs of €2.5m in respect of the transaction. The difference between the carrying value of the non controlling interest and the consideration paid on the purchase of the capital securities, less costs of €2.5m associated with the transaction, results in a gain of €89.7m recognised directly in the consolidated general reserves of the Group in accordance with IFRS.
There are no profits or losses attributable to non controlling interests for the current or prior year.
These leases have average lives of between 25 and 35 years with renewal options included in the contracts. The actual amount incurred on operating lease charges in 2010 was €7.0m (2009: €6.9m).
At 31 December, future minimum payments under non cancellable operating leases relating to land and buildings are as follows:
Purchase of capital securities by Society
36. LEASING COMMITMENTS
37. CAPITAL COMMITMENTS
2010 2009 €m €m
Paymentstobemadein: Less than one year 7.0 7.0 Between one and five years 26.2 26.6 After five years 63.5 69.0 96.7 102.6
Capital expenditure contracted but not provided for 0.6 - Capital expenditure authorised but not contracted 1.1 2.2
73
Notes to the Financial Statements 31 December 2010
Society
Chess – Nominal value €87,147,000 at €440 per €1,000 38.3 - Green Island – Nominal value €78,942,000 at €410 per €1,000 32.4 -
Total 70.7 -

74
38. DERIVATIVE FINANCIAL INSTRUMENTS
GroupGroup operations are exposed to the risk of interest rate fluctuations to the extent that assets and liabilities mature or reprice at different times or in differing amounts. Derivatives allow the Group to modify the repricing characteristics of assets and liabilities in a cost efficient manner. This flexibility helps the Group to achieve liquidity and risk management objectives. Derivatives fluctuate in value as interest or exchange rates rise or fall just as all assets and liabilities fluctuate in value. If the derivatives are purchased or sold as hedges of balance sheet items, the appreciation or depreciation of the derivatives as interest or exchange rates change, will generally be offset by the unrealised appreciation or depreciation of the hedged items. To achieve its risk management objectives, the Group uses a combination of derivative financial instruments, particularly interest rate swaps, currency swaps and equity index swaps. The Group only engages in derivative activity for hedging purposes, although all swaps are considered to be effective hedges in economic terms, due to the nature of some it is not possible to establish a “Fair Value” or “Cash Flow” hedging relationships under IAS 39, such swaps are classified as “Held at fair value through the income statement”. Derivative instruments are contractual agreements whose value is derived from the price movements in underlying assets, interest rates, exchange rates or indices. Derivatives are an efficient and cost effective means of managing market risk and limiting counterparty exposure. The Board approves policy with respect to credit risk, market risk and liquidity risk and has delegated its monitoring and control responsibilities to the Group Asset & Liability Committee. However the Board continues to retain ultimate responsibility for these risks. Membership of the Group Asset & Liability Committee consists of senior management including executive directors. Fair value hedges The Group hedges part of its existing interest rate and foreign currency risk resulting from any potential movement in the fair value of fixed rate assets or liabilities and movement in fair value of assets and liabilities denominated in foreign currencies using interest rate and cross-currency interest rate swaps. The net fair value of these swaps at 31 December 2010 was (€22.5m) (2009: (€37.3m)). Cash flow hedges The Group also hedges part of its existing interest rate risk from any potential movement in variable cash flows using interest rate swaps. The net fair value of these swaps at 31 December 2010 was (€51.3m) (2009: (€77.6m)).
Derivativesheldatfairvaluethroughincomestatement Assetsderivatives Equity swaps 21.4 1.5 34.6 1.5 Cross currency interest rate swaps 40.1 0.3 13.2 0.3 Interest rate swaps 1,060.0 13.3 2,369.0 9.1 Totalassetderivativesheldatfairvaluethroughincomestatement 1,121.5 15.1 2,416.8 10.9
Liabilityderivatives Cross currency interest rate swaps 251.7 (2.8) 233.3 (3.9) Interest rate swaps 1,314.7 (14.9) 1,182.4 (4.2)
Totalliabilityderivativesheldatfairvaluethroughincomestatement 1,566.4 (17.7) 1,415.7 (8.1)
Totalderivativesheldatfairvaluethroughincomestatement 2,687.9 (2.6) 3,832.5 2.8 Totalembeddedderivatives 21.4 (1.6) 34.4 (1.8)
Group
2010 2009
Contract/ Fair notional values amount €m €m
Contract/ Fair notional values amount €m €m
Notes to the Financial Statements 31 December 2010

Group
75
Derivativesheldforhedging Assetsderivatives Interest rate swaps 3,471.6 35.8 2,506.6 28.1 Cross currency interest rate swaps 52.8 7.5 251.8 11.0
Totalassetderivativesheldforhedging 3,524.4 43.3 2,758.4 39.1
Liabilityderivatives Interest rate swaps 5,843.7 (103.1) 9,649.0 (141.4) Cross currency interest rate swaps 85.0 (14.0) 89.5 (12.6)
Totalliabilityderivativesheldforhedging 5,928.7 (117.1) 9,738.5 (154.0)
Totalderivativeheldforhedging 9,453.1 (73.8) 12,496.9 (114.9)
Derivativesdesignatedasfairvaluehedges Interest rate swaps 3,108.1 (16.0) 3,345.2 (35.7) Cross currency interest rate swaps 137.8 (6.5) 341.3 (1.6)
Totalderivativesdesignatedasfairvaluehedges 3,245.9 (22.5) 3,686.5 (37.3)
Derivativesdesignatedascashflowhedges Interest rate swaps 6,207.2 (51.3) 8,810.4 (77.6)
Totalderivativesdesignatedascashflowhedges 6,207.2 (51.3) 8,810.4 (77.6)
Totalderivativeheldforhedging 9,453.1 (73.8) 12,496.9 (114.9)
Totalderivatives 12,162.4 (78.0) 16,363.8 (113.9)
Asset derivatives 4,645.9 58.4 5,175.2 50.0 Liability derivatives 7,495.1 (134.8) 11,154.2 (162.1) Embedded derivatives 21.4 (1.6) 34.4 (1.8)
Totalderivatives 12,162.4 (78.0) 16,363.8 (113.9)
2010 2009
Contract/ Fair notional values amount €m €m
Contract/ Fair notional values amount €m €m
Notes to the Financial Statements 31 December 2010
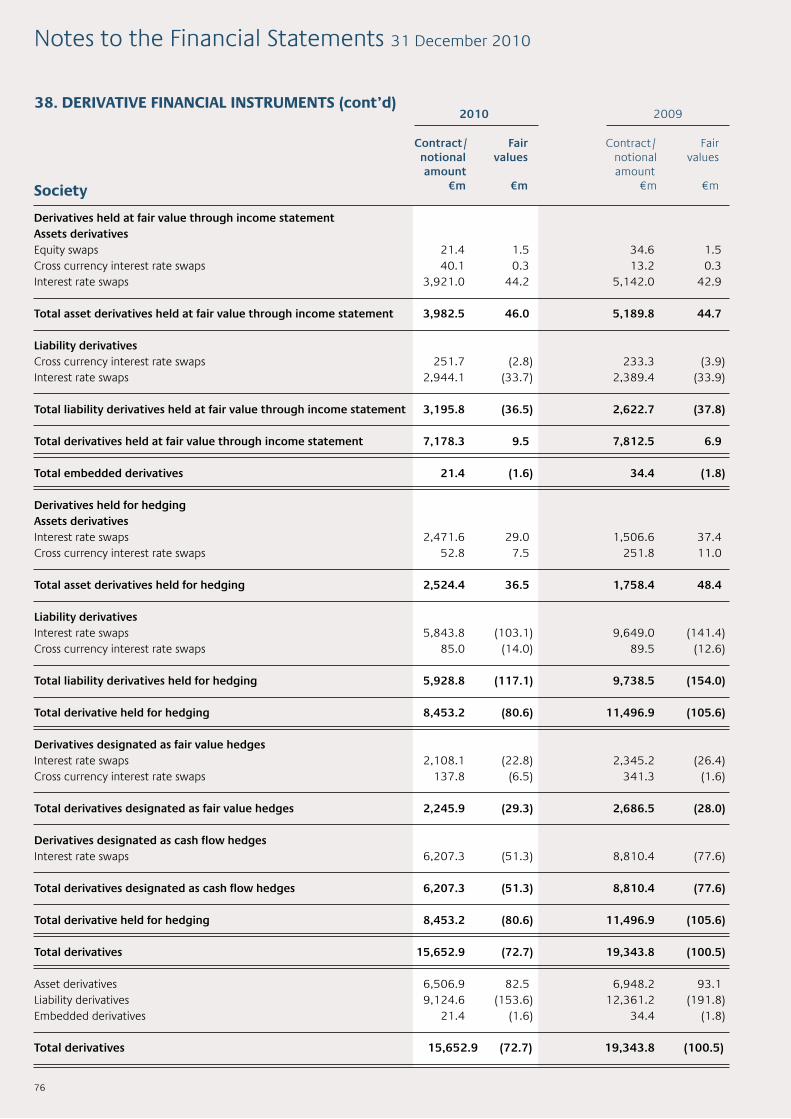
Derivativesheldatfairvaluethroughincomestatement Assetsderivatives Equity swaps 21.4 1.5 34.6 1.5 Cross currency interest rate swaps 40.1 0.3 13.2 0.3 Interest rate swaps 3,921.0 44.2 5,142.0 42.9 Totalassetderivativesheldatfairvaluethroughincomestatement 3,982.5 46.0 5,189.8 44.7
Liabilityderivatives Cross currency interest rate swaps 251.7 (2.8) 233.3 (3.9) Interest rate swaps 2,944.1 (33.7) 2,389.4 (33.9)
Totalliabilityderivativesheldatfairvaluethroughincomestatement 3,195.8 (36.5) 2,622.7 (37.8)
Totalderivativesheldatfairvaluethroughincomestatement 7,178.3 9.5 7,812.5 6.9
Totalembeddedderivatives 21.4 (1.6) 34.4 (1.8)
Derivativesheldforhedging Assetsderivatives Interest rate swaps 2,471.6 29.0 1,506.6 37.4 Cross currency interest rate swaps 52.8 7.5 251.8 11.0
Totalassetderivativesheldforhedging 2,524.4 36.5 1,758.4 48.4
Liabilityderivatives Interest rate swaps 5,843.8 (103.1) 9,649.0 (141.4) Cross currency interest rate swaps 85.0 (14.0) 89.5 (12.6)
Totalliabilityderivativesheldforhedging 5,928.8 (117.1) 9,738.5 (154.0)
Totalderivativeheldforhedging 8,453.2 (80.6) 11,496.9 (105.6)
Derivativesdesignatedasfairvaluehedges Interest rate swaps 2,108.1 (22.8) 2,345.2 (26.4) Cross currency interest rate swaps 137.8 (6.5) 341.3 (1.6)
Totalderivativesdesignatedasfairvaluehedges 2,245.9 (29.3) 2,686.5 (28.0)
Derivativesdesignatedascashflowhedges Interest rate swaps 6,207.3 (51.3) 8,810.4 (77.6)
Totalderivativesdesignatedascashflowhedges 6,207.3 (51.3) 8,810.4 (77.6)
Totalderivativeheldforhedging 8,453.2 (80.6) 11,496.9 (105.6)
Totalderivatives 15,652.9 (72.7) 19,343.8 (100.5)
Asset derivatives 6,506.9 82.5 6,948.2 93.1 Liability derivatives 9,124.6 (153.6) 12,361.2 (191.8) Embedded derivatives 21.4 (1.6) 34.4 (1.8)
Totalderivatives 15,652.9 (72.7) 19,343.8 (100.5)
76
Notes to the Financial Statements 31 December 2010
Society
2010 2009
Contract/ Fair notional values amount €m €m
Contract/ Fair notional values amount €m €m
38. DERIVATIVE FINANCIAL INSTRUMENTS (cont’d)

77
The Group holds derivative financial instruments for hedging purposes only, however there are instances where some of these instruments fail to meet IAS 39 criteria for application of hedge accounting and are classified as held at fair value through the income statement. The weighted average remaining term of the Group’s cash flow hedges is 2.3 years (2009: 2.5 years). The maximum remaining term of any individual cash flow hedge is 7.6 years (2009: 8.6). Fair value is based upon quoted market prices where available. If a quoted market price is not available, fair value is estimated using quoted market prices for similar instruments and adjusted for differences between the quoted instrument and the instrument being valued. In certain cases, including some loans and advances to customers, where there are no ready markets, various techniques using observable data have been used to estimate the fair value of the instruments. These estimates are subjective in nature and involve uncertainties and matters of significant judgement and therefore cannot be determined with precision. Readers of these financial statements are advised to use caution when using the data to evaluate the Group’s financial position or to make comparisons with other institutions. In April 2009, a forecast transaction for which a cashflow hedge was previously designated ceased to be effective. This instrument was fair valued through the income statement for the remainder of 2009 and continued to be fair valued through the income statement during 2010. The fair value of this instrument at 31 December 2010 was €0.7m (2009 €1.4m). The cumulative amount recognised in other comprehensive income for the period when the hedge was effective is currently being amortised to the income statement as the hedged transaction cash flows are still expected to occur. In December 2010, one sterling hedged item was transferred to NAMA but the underlying swap was retained. This instrument is now being fair valued through the income statement. The fair value of this instrument at 31 December 2010 was €0.8m. The derivative maturity table below analyses the asset, liability and embedded derivatives notional amounts by maturity bucket.
Notes to the Financial Statements 31 December 2010
Interest rate swaps 297.1 85.8 63.9 4,059.8 25.0 4,531.6 Cross currency interest rate swaps 16.8 75.8 0.3 - - 92.9 Equity swaps 5.9 2.2 8.7 4.6 - 21.4
Total assets 319.8 163.8 72.9 4,064.4 25.0 4,645.9
Interest rate swaps 1,683.3 693.5 1,460.0 3,155.6 166.0 7,158.4 Cross currency interest rate swaps 213.1 38.6 50.1 34.9 - 336.7
Totalliabilities 1,896.4 732.1 1,510.1 3,190.5 166.0 7,495.1
Embeddedderivatives 5.9 2.2 8.7 4.6 - 21.4
Interest rate swaps 861.8 567.5 1,768.3 1,491.0 187.0 4,875.6 Cross currency interest rate swaps 190.4 0.7 15.5 58.4 - 265.0 Equity swaps - - - 34.6 - 34.6 Total assets 1,052.2 568.2 1,783.8 1,584.0 187.0 5,175.2
Interest rate swaps 2,098.4 1,863.0 2,422.4 4,088.8 358.8 10,831.4 Cross currency interest rate swaps 266.1 1.5 5.1 50.1 - 322.8
Totalliabilities 2,364.5 1,864.5 2,427.5 4,138.9 358.8 11,154.2
Embeddedderivatives - - 12.8 21.6 - 34.4
Derivative Maturity Table - at 31 December 2010
Group
Group
Derivative Maturity Table - at 31 December 2009
Not more Over 3 than 3 months months butnot more than 6 months €m €m
Over 6monthsbut
not more than 12 months
€m
Over 5 Years
€m
Over 1 yearbutnot
more than5 Years
€m
Total
€m
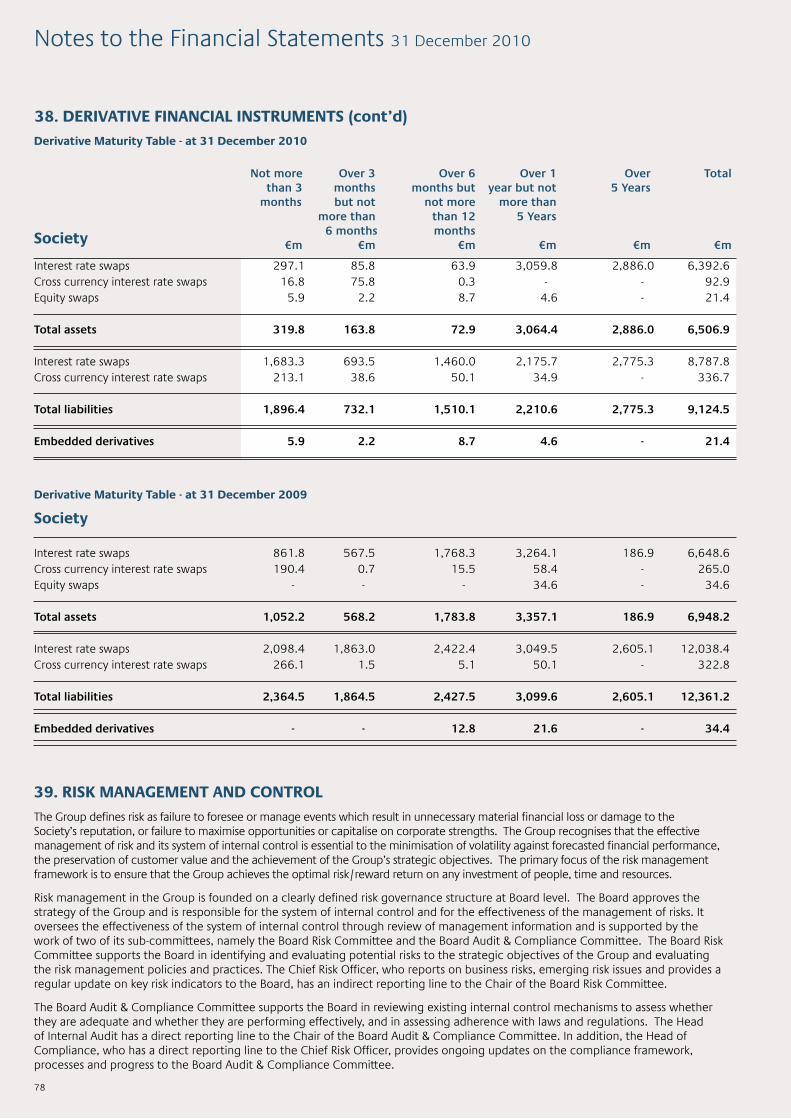
78
39. RISK MANAGEMENT AND CONTROL The Group defines risk as failure to foresee or manage events which result in unnecessary material financial loss or damage to the Society’s reputation, or failure to maximise opportunities or capitalise on corporate strengths. The Group recognises that the effective management of risk and its system of internal control is essential to the minimisation of volatility against forecasted financial performance, the preservation of customer value and the achievement of the Group’s strategic objectives. The primary focus of the risk management framework is to ensure that the Group achieves the optimal risk/reward return on any investment of people, time and resources. Risk management in the Group is founded on a clearly defined risk governance structure at Board level. The Board approves the strategy of the Group and is responsible for the system of internal control and for the effectiveness of the management of risks. It oversees the effectiveness of the system of internal control through review of management information and is supported by the work of two of its sub-committees, namely the Board Risk Committee and the Board Audit & Compliance Committee. The Board Risk Committee supports the Board in identifying and evaluating potential risks to the strategic objectives of the Group and evaluating the risk management policies and practices. The Chief Risk Officer, who reports on business risks, emerging risk issues and provides a regular update on key risk indicators to the Board, has an indirect reporting line to the Chair of the Board Risk Committee. The Board Audit & Compliance Committee supports the Board in reviewing existing internal control mechanisms to assess whether they are adequate and whether they are performing effectively, and in assessing adherence with laws and regulations. The Head of Internal Audit has a direct reporting line to the Chair of the Board Audit & Compliance Committee. In addition, the Head of Compliance, who has a direct reporting line to the Chief Risk Officer, provides ongoing updates on the compliance framework, processes and progress to the Board Audit & Compliance Committee.
Notes to the Financial Statements 31 December 2010
Interest rate swaps 861.8 567.5 1,768.3 3,264.1 186.9 6,648.6 Cross currency interest rate swaps 190.4 0.7 15.5 58.4 - 265.0 Equity swaps - - - 34.6 - 34.6
Total assets 1,052.2 568.2 1,783.8 3,357.1 186.9 6,948.2
Interest rate swaps 2,098.4 1,863.0 2,422.4 3,049.5 2,605.1 12,038.4 Cross currency interest rate swaps 266.1 1.5 5.1 50.1 - 322.8
Totalliabilities 2,364.5 1,864.5 2,427.5 3,099.6 2,605.1 12,361.2
Embeddedderivatives - - 12.8 21.6 - 34.4
Interest rate swaps 297.1 85.8 63.9 3,059.8 2,886.0 6,392.6 Cross currency interest rate swaps 16.8 75.8 0.3 - - 92.9 Equity swaps 5.9 2.2 8.7 4.6 - 21.4
Total assets 319.8 163.8 72.9 3,064.4 2,886.0 6,506.9
Interest rate swaps 1,683.3 693.5 1,460.0 2,175.7 2,775.3 8,787.8 Cross currency interest rate swaps 213.1 38.6 50.1 34.9 - 336.7
Totalliabilities 1,896.4 732.1 1,510.1 2,210.6 2,775.3 9,124.5
Embeddedderivatives 5.9 2.2 8.7 4.6 - 21.4
Derivative Maturity Table - at 31 December 2010
Derivative Maturity Table - at 31 December 2009
Society
Society
Not more Over 3 than 3 months months butnot more than 6 months €m €m
Over 6monthsbut
not more than 12 months
€m
Over 5 Years
€m
Over 1 yearbutnot
more than5 Years
€m
Total
€m
38. DERIVATIVE FINANCIAL INSTRUMENTS (cont’d)

79
EBS has developed and implemented a risk management framework that is commensurate with the size, scale and complexity of the organisation. It is in line with industry practice and meets Central Bank specific requirements and EU supervisory standards. The key elements of this framework are: (i) There is a clearly defined risk governance structure which is regularly updated. The Board has established four permanent sub-committees to consider certain aspects of governance in detail. Each committee through its chair reports to the Board at the earliest scheduled Board meeting. The risk governance framework, risk universe, roles, reporting lines and risk committees are documented in a risk manual which forms part of the induction of new Board members. The risk manual is updated at regular intervals throughout the year. The risk governance framework has been developed in line with the recently published European Banking Authority Guidelines on Internal Governance (CP41) and Remuneration Practices (CP42) and the Central Bank of Ireland’s Corporate Governance Code for Credit Institutions and Insurance Undertakings. (ii) Strategies, goals, objectives, authority limits and reporting mechanisms are clearly defined, against which performance is monitored. (iii) The Board has clearly defined its risk appetite in a risk appetite statement which incorporates risk limits for all key aspects of the business of the Group. The risk appetite statement is reviewed at least annually by the Board and more frequently if required. Risk policies and procedures are updated where appropriate to reflect the limits of risk appetite. These policies are closely managed on a day to day basis throughout the Group, and are monitored by specific business units with oversight by the relevant risk management committees. Material changes to these policies are Board approved on an annual basis. Adherence to the risk limits set by the Board is monitored on an ongoing basis and reported to the Chief Risk Officer. (iv) The risk management framework is supported by its underlying Group risk committees comprising the Asset & Liability Committee; the Credit Risk Committee, the Risk Rating Approval Committee, the Operations Management Committee and the Regulatory Compliance Committee. Each of these committees, whose membership is approved by the Chief Executive, is responsible for identifying actions to support robust risk management in line with the Group’s risk appetite. Progress is monitored and reported regularly to the Board through the report of the Chief Risk Officer. RiskCommitteesandFunctions The Group Asset & Liability Committee, which meets twice monthly or more frequently as required, was established to monitor the Society’s exposure to key market risks, i.e. liquidity risk, funding risk, interest rate risk in the banking book and foreign exchange risk. The Committee is responsible for asset and liability management, monitoring the adequacy of the liquidity framework and buffers and for recommending the appropriate funding and capital policies and plans to the Board for approval. The Committee also has oversight of interest rate risk in the banking book, liquid asset investment and reserves investment policies and hedging policies of the Group. The Committee monitors capital ratios, including projections and oversees the appropriate implementation of the capital policy. The Group Credit Risk Committee, which meets monthly, reviews and recommends appropriate credit risk management policies for the Society and its subsidiaries, in line with the overall credit risk appetite of the Group. These policies comprise lending, debt management and counterparty credit. The Committee is also responsible for monitoring the make up and performance of the loan books, the credit quality of counterparts, the level of mortgage insurance in place and the adequacy of provisions for impaired loans. The Committee monitors the external macro-economic and other factors and new business credit risk trends and projections which serve as a benchmark against which the credit risk appetite of the organisation is evaluated. The Committee is charged with ensuring that an appropriate level of credit risk insurance is being maintained for loans. The Group Risk Rating Approval Committee, which meets quarterly, is responsible for reviewing and recommending to the Board policies on risk model development, validation and use. It is also responsible for the ongoing validation and monitoring of risk rating systems, model performance and model output in terms of forecasting. The Group Operations Management Committee, which meets monthly, reviews and monitors business operation and process risks and improvement initiatives across the organisation. It is also responsible for reviewing loss and near miss events and making recommendations for changes in operational processes to the Management Team where appropriate. The Committee is responsible for evaluating the organisation’s appetite for operational risk and ensuring that it is well communicated and understood. The Health & Safety Committee reports to the Operations Management Committee. The Group Regulatory Compliance Committee, which meets monthly, ensures that there is an appropriate framework in place to support the objective of the Group to clearly be compliant with all its regulatory requirements. It is responsible for monitoring adherence to applicable regulations across the Group, and for evaluating the impact of new regulations and ensuring that EBS is prepared for their implementation in the approved timeline. (v) There are two independent control functions (1) Risk and Compliance and (2) Internal Audit - each of which operates separately to, and independently of, the general business operation. Compliance and Risk report to the Chief Risk Officer and form the ‘second line of defence’ in relation to risk management within the Group. Internal Audit, who report directly to the Board Audit & Compliance Committee, incorporates the work of the Fraud unit, and forms the third, independent, line of defence in terms of risk management. Responsibility for the management of risk rests with each operating unit across the Group. The ‘first line of defence’ in terms of risk management is the management of risk in day to day business operations, new product development and strategy implementation. The Risk and Compliance function, which form the second line of defence, support the Group in developing and maintaining a robust risk management framework and by providing independence in terms of risk identification, measurement, monitoring and reporting. The Risk and Compliance function comprises (a) Risk Analytics, which develops and maintains risk models and risk rating systems and provides independent management information regarding loan book performance and adherence to credit policy, and independent credit review of adherence to procedures, (b) Treasury Risk (middle office) which provides independent management information to both internal and external stakeholders such as the Central Bank, Department of Finance, NTMA etc, regarding adherence
Notes to the Financial Statements 31 December 2010

80
39. RISK MANAGEMENT AND CONTROL (cont’d) to market risk policies and day to day treasury operations, (c) Operational Risk, which monitors operational risk trends, losses and near misses and which incorporates Information Security which reports independently of Information Technology, (d) Enterprise Risk, which supports the development and maintenance of a risk management framework to mitigate against unforeseen risk events materialising and (e) Regulatory Compliance, which is responsible for advising and facilitating the business in identifying, managing and monitoring its regulatory obligations and prudential regulatory requirements. Collectively, the Risk division monitor and report on key risk indicators, developments in risk management protocols, regulations and practices and other risk developments to the relevant risk committees and to the Board. The Internal Audit function, which forms the third line of defence provides independent assurance in relation to the effectiveness of the system of internal control to the Board through the Board Audit & Compliance Committee. A dedicated Fraud prevention unit is in place which also reports to the Head of Internal Audit and updates are regularly provided to the Board Audit & Compliance Committee. (vi) Through a stress testing framework, EBS measures its vulnerabilities to loss under stressed market conditions and considers those results when agreeing financial budgets and on an ongoing basis for monitoring and reviewing risk appetite and risk contingency plans. The stress testing framework, which forms an integral part of the overall governance and risk management culture of EBS has been developed in line with the European Banking Authority revised guidelines on stress testing which are required to be implemented by 1 January 2011. The stress testing program incorporates stress tests at both an individual risk level (bottom up approach) and at a holistic organisation wide level (integrated top down approach) that cover a range of risks and business areas. The stress testing program facilitates the development of risk mitigation or contingency plans across a range of stressed conditions that are used to support the organisation from a risk appetite, capital and liquidity management perspective. Contingency plans also reflect operational response considerations where appropriate. (vii) The risk management framework provides a firm-wide definition of risk and lays down the principles of how risk is to be identified, assessed, measured, monitored and controlled / mitigated and the associated allocation of capital against same. EBS categorises risks under a number of headings namely, strategic, operational, compliance and financial (including credit, liquidity and market) risks. Together, these form the EBS Risk Universe. This helps the Group to assess and manage risk on an enterprise wide, holistic basis. The Risk Universe is continuously reviewed and updated reflecting the changing risk environment and was reviewed by the Board during 2010. Strategic Risks Strategic risk management comprises the Group’s values and beliefs, organisational structure and alignment, change readiness, strategic plan management, performance incentives, crisis management, third party relationship management, brand management, leadership and communication. Strategic risk also encompasses external trends which cannot be controlled but which could have a significant impact on the Group’s business such as the economic environment, market developments and technological innovation. Strategic risks are managed and monitored in the main by the senior management team and the Board. Significant developments are reported to the Board directly and to its sub-committees on a regular basis. Operational Risks Operational risk is the current or prospective risk of loss arising from inadequate or failed internal processes or systems, human error or external events. Group Operational Risk is responsible for supporting and monitoring operational risk management throughout the organisation and for recommending changes to the operational risk policy, as appropriate, to the Group Operations Management Committee. The core focus of operational risk management is to support the delivery of optimal products and services to members and customers, operational efficiency, fraud prevention, clear lines of authority, employee development, health, safety and personal security of all employees and customers, litigation risk management, collateral management, solutions development, systems integrity, business continuity management, third party servicing, outsourcing and customer facing partnership management. Group Operational Risk supports the business in conducting regular self-assessments of the risks in individual functions, in key processes and in significant projects. The self-assessment process helps identify key risks, the materiality of the risks (based on the probability of their occurrence and the impact if they did occur), an evaluation of the management activities to control and/or mitigate the risks and the level of residual risk. This supports the business in identifying actions to improve the Group’s risk management capabilities. Further actions are identified from the evaluation of losses and near misses which are recorded in each part of the organisation and monitored by the Operational Risk function. These, and other actions arising from internal audit reviews or risk committee prompts, are monitored on an ongoing basis and progress against actions is reported on a regular basis to the Management Team and the Board. Regulatory Compliance Risk Regulatory Compliance risk is the risk that the Society fails to meet the standards and requirements of the Central Bank in relation to the provision of financial services to consumers. The Regulatory Compliance function’s role is to mitigate the risks of current or prospective risk to earnings and capital arising from violations or non compliance with laws, rules, regulations, agreements, prescribed practices or ethical standards which can lead to fines, damages and / or the voiding of contracts and can diminish the Group’s reputation. The function independently evaluates adherence to key regulations and reports same to the Regulatory Compliance Committee. An annual plan is developed and approved by the Board Audit & Compliance Committee which receives regular updates on progress. The terms and conditions of the Government Guarantee identify additional levels of oversight and scrutiny for the duration of the scheme. This oversight is concentrated in the following areas; information and monitoring, Board representation and executive management, commercial conduct, corporate social responsibility, and controls on executive remuneration. The Regulatory Compliance
Notes to the Financial Statements 31 December 2010

81
function is responsible for supporting and ensuring (via a quarterly assessment of compliance) that the business is in adherence with the requirements of this regulatory regime and the conditions of the Government Guarantee Scheme and any subsequent scheme. CreditRisk Credit risk is the risk of financial loss to the Group if a customer or counterparty to a financial instrument fails to meet its contractual obligations, and arises from the Group’s loans and advances to customers and credit institutions, loans and advances held for sale, available-for-sale financial assets and derivatives. For risk management reporting purposes, the Group considers and consolidates all elements of credit risk exposure (such as individual obligor default risk, country and sector risk). Credit risk management in EBS is supported by an appropriate governance structure with separation of function between the sourcing and approval of business, the issuing of funds, loan management and independent review and monitoring. Given the deterioration in credit quality throughout 2010 in both the retail and commercial markets, both credit management and credit risk management have been a key area of focus over the past year. Resourcing, structures, policy and processes continue to be reviewed in order to ensure that the Group is best placed to manage asset quality in this severe downturn. The Group Credit Risk Committee is responsible for reviewing and recommending appropriate credit risk management structures and policies in line with the credit risk appetite of the Group and for monitoring the performance of the book. The Risk Analytics team is responsible for the development and ongoing validation of credit risk rating models which are used to assess credit applications and to support a robust capital adequacy assessment process, and for independently monitoring the quality of the Group’s loan assets. The Credit Review team assesses the application of credit policies, processes and procedures across all areas of the Group. The Group conducts both regular and adhoc credit risk stress testing to assess on an ongoing basis the ability of the Group to withstand various idiosyncratic and systemic stress scenarios. Credit contingency plans are developed and updated on a continual basis reflecting the results of the stress tests. Given the economic environment, the Group conducts a quarterly assessment of impairment provisions, assisted by the Risk Analytics and Credit divisions and evaluated by the Group Credit Risk Committee. The Society insures the Group against risk in the Irish residential property market through mortgage indemnity insurance. This insurance is taken on a loan by loan basis, the amount of coverage being determined by the loan to value percentage at origination. In the event of the Society suffering a loss, a claim can be made up to the value of the insurance cover. The insurance provider is Genworth Financial Mortgage Insurance, rated Baa3 by Moody’s (EBS internal grade 10). At 31 December 2010, EBS had €579.2m worth of mortgage indemnity insurance cover in place. LiquidityRisk Liquidity risk relates to the ability of the Group to meet its on and off balance sheet obligations in a timely manner as they fall due, without incurring excessive cost, whilst continuing to fund its assets and growth therein. Group Treasury is responsible for the management of liquidity, i.e. to ensure that resources are available at all times to meet the Group’s obligations arising from the withdrawal of customer deposits or interbank lines. The Asset & Liability Committee which meets every two weeks monitors these risks and reports on key developments to the Board on a regular basis via the Chief Risk Officer’s report. The Group conducts both regular and adhoc funding and liquidity risk stress testing to assess on an ongoing basis the ability of the Group to withstand various idiosyncratic and systemic stress scenarios. Liquidity contingency plans are developed and updated on a continual basis reflecting the results of the stress tests. The Group applies the maturity mismatch approach to the management of liquidity following the adoption of this method by the Central Bank in July 2007. The overall purpose of a maturity mismatch approach is to ensure that the Group will have, at any given time, a pool of highly liquid assets capable of being converted into cash within four business days, sufficient to cover a certain percentage of foreseeable cash outflows for future periods of time (‘time bands’). Expected changes to the liquidity framework (upcoming Bank for International Settlements and European Banking Authority regulations in 2011) will be incorporated into Group policies upon finalisation by the relevant authorities. The Group has conducted stress tests in advance of these expected changes. Funding contingency plans are continually under review in light of unprecedented market and EBS specific events. Further information on liquidity risk is set out page 88. Market Risk Market risk is the risk that changes in market prices, such as interest rate, foreign exchange rates and credit spreads (funding risk) will affect the Group’s income or the value of its holdings of financial instruments. The objective of market risk management is to manage and control market risk exposures within acceptable parameters, while optimising the return on risk. EBS does not engage in proprietary trading i.e. does not trade on its own account. Group Treasury manages market risks using gap and sensitivity analysis. Derivatives such as interest rate and foreign currency swap agreements and equity index options are used to hedge these market risks. The Asset & Liability Committee, which meets every two weeks, monitors these risks and reports on key developments to the Board on a regular basis via the Chief Risk Officer’s report. Interest rate risk in the banking book portfolio is the Group’s primary source of interest rate risk and is managed principally through monitoring interest rate gaps and by having various limits, processes and procedures. Interest rate risk in the reserve investment portfolio is managed under the Reserve Investment Policy as approved by the Board. In addition, the Group conducts regular Interest Rate Risk in the Banking Book (IRRBB) stress testing to evaluate the exposure of the banking book portfolio and reserve investment portfolio to a parallel interest rate shift of 100 and 200 basis points and a series of yield curve twists. The Group has in place small operational foreign currency open position limits which are monitored on a daily basis.
Notes to the Financial Statements 31 December 2010

82
Financial risks The Group has exposure to the following risks from its use of financial instruments: (i) Credit risk (ii) Liquidity risk (iii) Market risks This note presents information about the Group’s exposure to each of the above risks and about the Group’s objectives, policies and processes for measuring and managing risk. (i)Creditrisk Maximumexposuretocreditrisk The following table shows the Group’s credit exposure, which is the maximum potential exposure including committed facilities:
Holdingofcollateral In 2010, EBS developed a collateral management framework which provides improved insight into and efficient use of existing collateral. EBS holds collateral against loans and advances to customers in the form of mortgage interests over property, other registered securities over assets, and guarantees. Estimates of fair value are based on the value of collateral assessed at the time of borrowing. For residential property, these values are updated using the PTSB/ESRI index. Processes to monitor the collateral underpinning commercial lending are in place as part of the annual review of each commercial connected exposure (‘Obligor’). Otherwise, values are updated when a loan is individually assessed as impaired at which time the fair value of the collateral held is factored into the estimate of the impairment provision required. Collateral generally is not held over loans and advances to credit institutions, nor over debt securities or government and other eligible bills. Collateral with a fair value of €13.3m (2009: €19.4m) is held against possession cases. In addition the Society has put in place a number of Credit Support Annexes (CSAs) covering approximately 86% of outstanding derivatives. Creditquality EBS lending credit risk is measured both at transaction level and at portfolio level. At origination, individual loan transactions are assessed for credit risk using a combination of factors. These include the risk rating attached to the credit (application score or obligor grade or external rating of a counterparty), the security exposure and an assessment of the customer’s or obligor’s ability to repay the debt. The performing and non performing split disclosed in the notes to the accounts is based on the proportion of performing versus non performing accounts as a percentage of the total loan balance in the relevant category such as residential or commercial. Additional information on the risk obligor basis is also provided. The risk obligor basis is determined based on the cumulative balances per obligor, which can relate to more than one account, as a percentage of the total loan balance by category. All obligors are graded. Grades 1 to 6 are deemed to be performing, grade 7 is watchlist and grades 8 and 9 are non performing. For the purpose of the performing/non performing split, grade 7 is deemed to be performing.
Loan commitments disclosed above comprise formal loan offers which EBS have a legal obligation to fulfil at the reporting date. This excludes any offer letters where the Society’s legal commitment to fulfil has elapsed.
Non-derivativefinancialassets Cash and balances with central banks 236.2 180.6 250.2 196.5 Loans and advances held-for-sale 37.9 750.6 37.9 750.6 Available-for-sale financial assets 3,943.2 3,972.2 2,575.2 2,924.8 Loans and advances to credit institutions 2,981.3 3,717.4 180.8 957.7 Loans and advances to customers 10,865.9 11,659.8 16,472.9 16,473.5 Interest accrued 57.9 39.5 46.6 37.6 Derivatives Interest rate swaps 73.2 80.3 49.1 37.2 Cross currency interest rate swaps 7.8 11.3 7.8 11.3 Equity swaps 1.5 1.5 1.5 1.5 Loancommitments(notunconditionallycancellable) 68.0 216.5 81.3 252.2
Society Group
2010 2009 €m €m
2010 2009 €m €m
39. RISK MANAGEMENT AND CONTROL (cont’d)
Notes to the Financial Statements 31 December 2010

GroupandSociety
2010 2009
83
Over time, portfolio risk is measured by reference to risk rating migration, the volume and value of loans in default and arrears aged analysis migration. The analysis below in relation to residential, commercial and loans and advances held-for-sale is based on gross lending before impairment provisions, uncashed loan cheques and fair value adjustment for loans in a fair value hedge relationship. Credit quality of treasury financial assets are monitored on an ongoing basis by both the Group Credit Risk Committee and the Asset & Liability Committee. All new investments of the Liquid Asset Portfolio and Reserve Investment Portfolio may only be made to counterparts rated A or higher at the time of purchase. The credit quality of the portfolio of loans and advances to customers is set out below by reference to residential assets, commercial assets and held-for-sale financial assets. Group residential assets amount to €15,881.5m (2009: €15,516.1m), commercial assets amount to €934.1m (2009: €1,002.6m) and held-for-sale financial assets to €65.6m (2009: €912.8m). The assessment of credit quality of loan commitments is the same as for loans and advances to customers. Credit quality in EBS portfolios is monitored using probability of default grades and loss functions mapping all portfolios into a 9-point grading system. Grading outputs are reported monthly to Group Credit Risk Committee where trends, movements and migrations are analysed to assess changes in the risk profile of the portfolio. Non performing loans are determined based on the repayment status of all loans secured on a given property. Non performing is defined to be 90 days or more in arrears, or where at least three monthly payments or the equivalent have been missed. Performing loans are defined to be neither past due nor impaired and up to 90 days or more in arrears. Within the performing loans pool, loans with a probability of default (PD) in excess of 30% and loans with a loans given default (LGD) of greater than 25% where the PD exceeds 5% are categorised as watch risk loans. Residentialassets The EBS residential lending portfolio comprises loans for owner occupation, retail buy-to-let loans for single properties or small portfolios and commercial buy-to-let loans for large portfolios. The following analysis is based on the residential category:
Of the Group Residential assets at 31 December 2010, 7.7% of Homeloans and 13.1% of Buy to Let loans were non performing (2009: 4.9% and 7.8% respectively). On a risk grade obligor basis, 11.4% (2009: 7.1%) of Society Residential assets and 9.4% (2009: 5.6%) of Group Residential assets are non performing. Out of total performing residential loans, 3.5% of Group (2009: 3.6%) and 3.3% of Society loans (2009: 3.5%) are on the watchlist. Commercial assets The EBS Commercial loan portfolio comprises commercial term debt assets. The following analysis is based on the commercial category:
On a risk grade obligor basis, 51.5% (2009: 20.8%) of Commercial assets are non performing. Loans on watch comprise 14.8% of performing loans (2009: 5.7%). Loansandadvancesheld-for-sale Loans and advances held-for-sale comprises development finance loans, commercial term debt and residential loans. These represent the loans that we expect to transfer to NAMA in 2011.
Residentialassets Performing loans 90.1% 93.4% 91.6% 94.8% Non performing loans 9.9% 6.6% 8.4% 5.2%
100.0% 100.0% 100.0% 100.0%
Society Group
2010 2009 2010 2009
Commercial assets Performing loans 92.9% 95.7% Non performing loans 7.1% 4.3%
100.0% 100.0%
Notes to the Financial Statements 31 December 2010
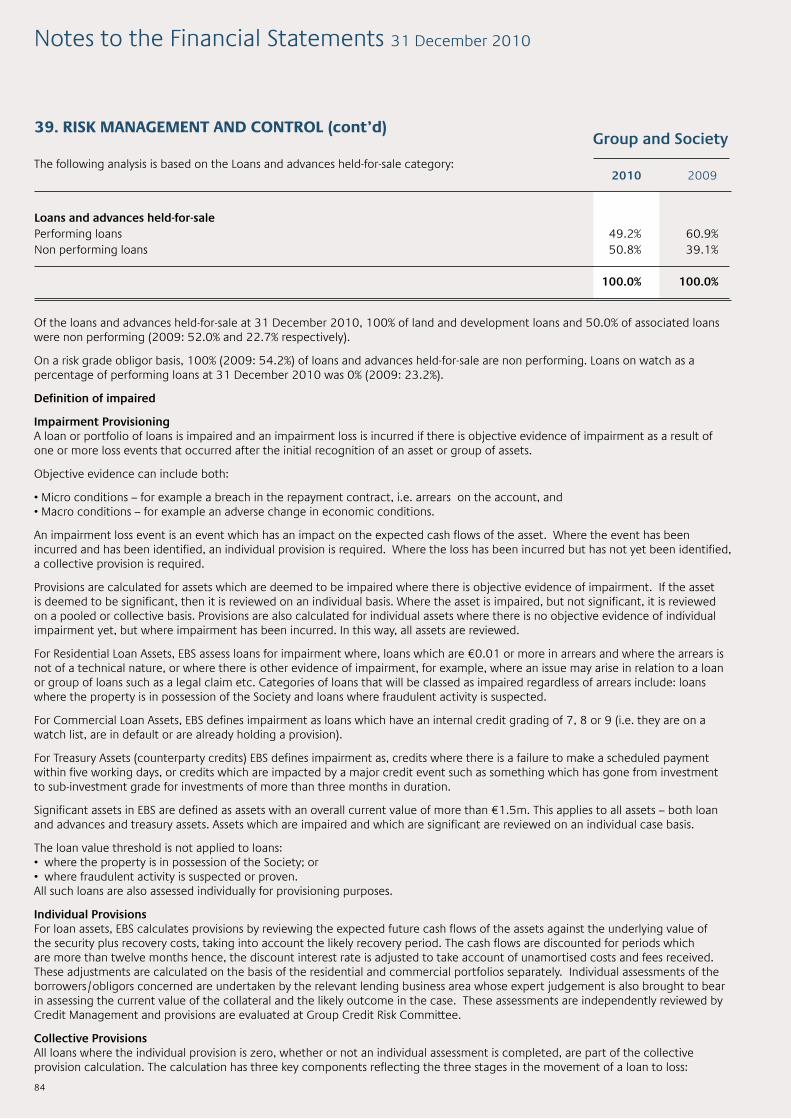
GroupandSociety
2010 2009
84
The following analysis is based on the Loans and advances held-for-sale category:
Of the loans and advances held-for-sale at 31 December 2010, 100% of land and development loans and 50.0% of associated loans were non performing (2009: 52.0% and 22.7% respectively). On a risk grade obligor basis, 100% (2009: 54.2%) of loans and advances held-for-sale are non performing. Loans on watch as a percentage of performing loans at 31 December 2010 was 0% (2009: 23.2%). Definitionofimpaired Impairment ProvisioningA loan or portfolio of loans is impaired and an impairment loss is incurred if there is objective evidence of impairment as a result of one or more loss events that occurred after the initial recognition of an asset or group of assets. Objective evidence can include both: • Micro conditions – for example a breach in the repayment contract, i.e. arrears on the account, and • Macro conditions – for example an adverse change in economic conditions. An impairment loss event is an event which has an impact on the expected cash flows of the asset. Where the event has been incurred and has been identified, an individual provision is required. Where the loss has been incurred but has not yet been identified, a collective provision is required. Provisions are calculated for assets which are deemed to be impaired where there is objective evidence of impairment. If the asset is deemed to be significant, then it is reviewed on an individual basis. Where the asset is impaired, but not significant, it is reviewed on a pooled or collective basis. Provisions are also calculated for individual assets where there is no objective evidence of individual impairment yet, but where impairment has been incurred. In this way, all assets are reviewed. For Residential Loan Assets, EBS assess loans for impairment where, loans which are €0.01 or more in arrears and where the arrears is not of a technical nature, or where there is other evidence of impairment, for example, where an issue may arise in relation to a loan or group of loans such as a legal claim etc. Categories of loans that will be classed as impaired regardless of arrears include: loans where the property is in possession of the Society and loans where fraudulent activity is suspected. For Commercial Loan Assets, EBS defines impairment as loans which have an internal credit grading of 7, 8 or 9 (i.e. they are on a watch list, are in default or are already holding a provision). For Treasury Assets (counterparty credits) EBS defines impairment as, credits where there is a failure to make a scheduled payment within five working days, or credits which are impacted by a major credit event such as something which has gone from investment to sub-investment grade for investments of more than three months in duration. Significant assets in EBS are defined as assets with an overall current value of more than €1.5m. This applies to all assets – both loan and advances and treasury assets. Assets which are impaired and which are significant are reviewed on an individual case basis. The loan value threshold is not applied to loans:• where the property is in possession of the Society; or• where fraudulent activity is suspected or proven.All such loans are also assessed individually for provisioning purposes. IndividualProvisionsFor loan assets, EBS calculates provisions by reviewing the expected future cash flows of the assets against the underlying value of the security plus recovery costs, taking into account the likely recovery period. The cash flows are discounted for periods which are more than twelve months hence, the discount interest rate is adjusted to take account of unamortised costs and fees received. These adjustments are calculated on the basis of the residential and commercial portfolios separately. Individual assessments of the borrowers/obligors concerned are undertaken by the relevant lending business area whose expert judgement is also brought to bear in assessing the current value of the collateral and the likely outcome in the case. These assessments are independently reviewed by Credit Management and provisions are evaluated at Group Credit Risk Committee. Collective ProvisionsAll loans where the individual provision is zero, whether or not an individual assessment is completed, are part of the collective provision calculation. The calculation has three key components reflecting the three stages in the movement of a loan to loss:
Loansandadvancesheld-for-sale Performing loans 49.2% 60.9% Non performing loans 50.8% 39.1%
100.0% 100.0%
39. RISK MANAGEMENT AND CONTROL (cont’d)
Notes to the Financial Statements 31 December 2010
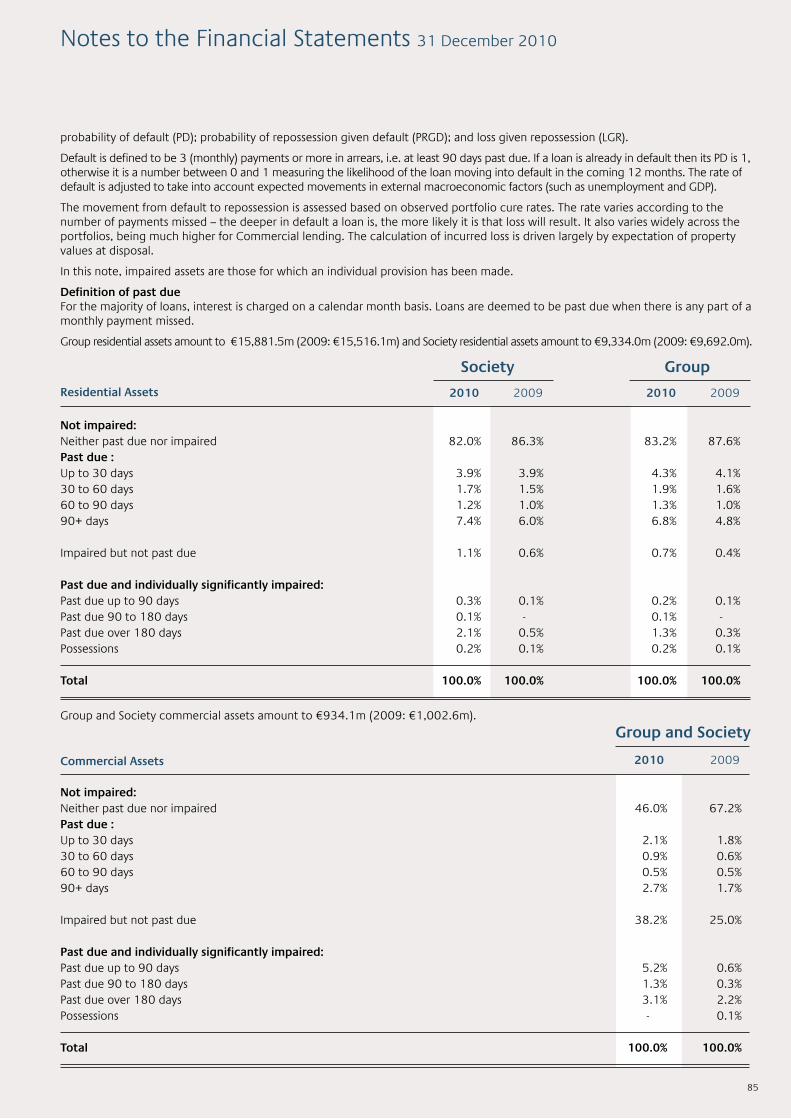
GroupandSociety
2010 2009
85
probability of default (PD); probability of repossession given default (PRGD); and loss given repossession (LGR). Default is defined to be 3 (monthly) payments or more in arrears, i.e. at least 90 days past due. If a loan is already in default then its PD is 1, otherwise it is a number between 0 and 1 measuring the likelihood of the loan moving into default in the coming 12 months. The rate of default is adjusted to take into account expected movements in external macroeconomic factors (such as unemployment and GDP). The movement from default to repossession is assessed based on observed portfolio cure rates. The rate varies according to the number of payments missed – the deeper in default a loan is, the more likely it is that loss will result. It also varies widely across the portfolios, being much higher for Commercial lending. The calculation of incurred loss is driven largely by expectation of property values at disposal. In this note, impaired assets are those for which an individual provision has been made. Definitionofpastdue For the majority of loans, interest is charged on a calendar month basis. Loans are deemed to be past due when there is any part of a monthly payment missed. Group residential assets amount to €15,881.5m (2009: €15,516.1m) and Society residential assets amount to €9,334.0m (2009: €9,692.0m).
Group and Society commercial assets amount to €934.1m (2009: €1,002.6m).
Notimpaired: Neither past due nor impaired 82.0% 86.3% 83.2% 87.6% Pastdue: Up to 30 days 3.9% 3.9% 4.3% 4.1% 30 to 60 days 1.7% 1.5% 1.9% 1.6% 60 to 90 days 1.2% 1.0% 1.3% 1.0% 90+ days 7.4% 6.0% 6.8% 4.8% Impaired but not past due 1.1% 0.6% 0.7% 0.4% Pastdueandindividuallysignificantlyimpaired: Past due up to 90 days 0.3% 0.1% 0.2% 0.1% Past due 90 to 180 days 0.1% - 0.1% - Past due over 180 days 2.1% 0.5% 1.3% 0.3% Possessions 0.2% 0.1% 0.2% 0.1%
Total 100.0% 100.0% 100.0% 100.0%
Society
ResidentialAssets
Commercial Assets
Group
2010 2009 2010 2009
Notimpaired: Neither past due nor impaired 46.0% 67.2% Pastdue: Up to 30 days 2.1% 1.8% 30 to 60 days 0.9% 0.6% 60 to 90 days 0.5% 0.5% 90+ days 2.7% 1.7% Impaired but not past due 38.2% 25.0% Pastdueandindividuallysignificantlyimpaired: Past due up to 90 days 5.2% 0.6% Past due 90 to 180 days 1.3% 0.3% Past due over 180 days 3.1% 2.2% Possessions - 0.1%
Total 100.0% 100.0%
Notes to the Financial Statements 31 December 2010
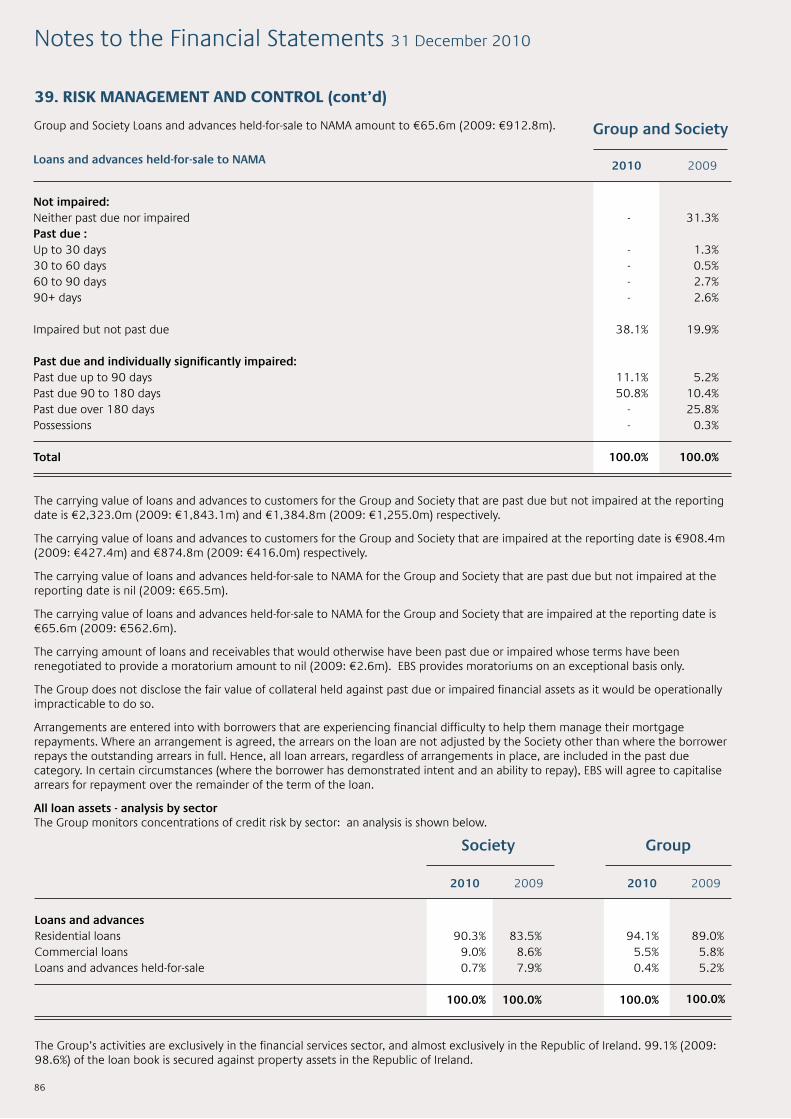
Group and Society Loans and advances held-for-sale to NAMA amount to €65.6m (2009: €912.8m). GroupandSociety
2010 2009
86
The carrying value of loans and advances to customers for the Group and Society that are past due but not impaired at the reporting date is €2,323.0m (2009: €1,843.1m) and €1,384.8m (2009: €1,255.0m) respectively. The carrying value of loans and advances to customers for the Group and Society that are impaired at the reporting date is €908.4m (2009: €427.4m) and €874.8m (2009: €416.0m) respectively. The carrying value of loans and advances held-for-sale to NAMA for the Group and Society that are past due but not impaired at the reporting date is nil (2009: €65.5m). The carrying value of loans and advances held-for-sale to NAMA for the Group and Society that are impaired at the reporting date is €65.6m (2009: €562.6m). The carrying amount of loans and receivables that would otherwise have been past due or impaired whose terms have been renegotiated to provide a moratorium amount to nil (2009: €2.6m). EBS provides moratoriums on an exceptional basis only. The Group does not disclose the fair value of collateral held against past due or impaired financial assets as it would be operationally impracticable to do so. Arrangements are entered into with borrowers that are experiencing financial difficulty to help them manage their mortgage repayments. Where an arrangement is agreed, the arrears on the loan are not adjusted by the Society other than where the borrower repays the outstanding arrears in full. Hence, all loan arrears, regardless of arrangements in place, are included in the past due category. In certain circumstances (where the borrower has demonstrated intent and an ability to repay), EBS will agree to capitalise arrears for repayment over the remainder of the term of the loan. Allloanassets-analysisbysector The Group monitors concentrations of credit risk by sector: an analysis is shown below.
Loansandadvancesheld-for-saletoNAMA
Notimpaired: Neither past due nor impaired - 31.3% Pastdue: Up to 30 days - 1.3% 30 to 60 days - 0.5% 60 to 90 days - 2.7% 90+ days - 2.6% Impaired but not past due 38.1% 19.9% Pastdueandindividuallysignificantlyimpaired: Past due up to 90 days 11.1% 5.2% Past due 90 to 180 days 50.8% 10.4% Past due over 180 days - 25.8% Possessions - 0.3%
Total 100.0% 100.0%
Loansandadvances Residential loans 90.3% 83.5% 94.1% 89.0% Commercial loans 9.0% 8.6% 5.5% 5.8% Loans and advances held-for-sale 0.7% 7.9% 0.4% 5.2%
100.0% 100.0% 100.0%
Society Group
2010 2009 2010 2009
The Group’s activities are exclusively in the financial services sector, and almost exclusively in the Republic of Ireland. 99.1% (2009: 98.6%) of the loan book is secured against property assets in the Republic of Ireland.
39. RISK MANAGEMENT AND CONTROL (cont’d)
Notes to the Financial Statements 31 December 2010
100.0%

87
Treasuryassetsandderivatives Treasury assets consist of cash and balances with central banks, central government bills and other eligible bills, derivative financial instruments, available-for-sale, held-to-maturity financial assets and loans and advances to credit institutions excluding operating bank accounts.
The following tables present an analysis of Treasury asset counterparties based on EBS’s internal ratings mapped to an external rating agency scale. Where the counterparty is government guaranteed we have used the sovereign rating.
Group 2010
Society 2010
Group 2009
Society 2009
Balancesat31December2010 250.2 1,040.9 1,840.2 58.4 180.8 1,581.3
Aaa 100.0% - 14.7% 22.4% 5.5% 94.9% Aa3 to Aa1 - 4.4% 28.7% 62.0% 43.4% - A3 to A1 - - 20.1% 9.3% 31.2% - Lower than A3 - 95.6% 36.5% 6.3% 19.5% - Unrated - - - - 0.4% 5.1%
Balancesat31December2010 236.2 1,040.9 2,902.3 82.5 2,981.3 1,568.0
Aaa 100.0% - 8.5% 14.6% 0.3% 95.7% Aa3 to Aa1 - 4.4% 30.8% 40.5% 0.8% - A3 to A1 - - 11.6% 6.1% 1.5% - Lower than A3 - 95.6% 49.1% 38.8% 97.4% - Unrated - - - - - 4.3%
Balancesat31December2009 196.5 208.3 2,924.8 50.0 957.7 1,152.2 Aaa 100.0% 15.2% 13.2% 1.0% - 78.1% Aa3 to Aa1 - 72.4% 69.9% 22.0% 98.4% - A3 to A1 - 12.4% 16.7% 67.0% - - Lower than A3 - - 0.2% 10.0% 1.6% - Unrated - - - - - 21.9%
Balancesat31December2009 180.6 208.3 3,972.2 93.1 3,717.4 1,116.5
Aaa 100.0% 15.2% 9.5% 0.6% - 80.6% Aa3 to Aa1 - 72.4% 76.6% 58.6% 99.6% - A3 to A1 - 12.4% 12.1% 35.5% - - Lower than A3 - - 1.8% 5.3% 0.4% - Unrated - - - - - 19.4%
Cash& Govtand AFS balances other financial withcentral eligible assets banks bills €m €m €m
Derivatives Loans & Commiments advancesto &contingent credit liabilities institutions €m €m €m
Notes to the Financial Statements 31 December 2010

88
39. RISK MANAGEMENT AND CONTROL (cont’d) The Society has put in place a number of Credit Support Annexes (CSAs) covering in excess of approximately 86% of outstanding derivatives. Derivatives covered by these agreements are marked to market on an ongoing basis resulting in the determination of the amount to be posted as collateral under the CSA and thereby removing the counterparty credit risk. The counterparty credit risk relating to the remaining approximately 14% of derivatives not covered by CSAs is mitigated by the fact that under our counterparty credit risk policy we can only transact derivatives with counterparties who warrant a minimum rating of 4 based on the EBS internal rating based (‘IRB’) system, if a CSA agreement is not in place. EBS has established and enforces operating limits and other practices that maintain exposures within levels consistent with their internal policies. EBS adheres to the principles of sound practices for managing interest rate risk and complies with any regulatory requirements as a minimum. EBS transacts derivatives for the purpose of reducing or eliminating Interest Rate Risk in the Banking Book (IRRBB). EBS uses interest rate, cross currency and foreign exchange swaps for this purpose. Treasury assets are monitored on a daily basis. Commitments and contingent liabilities include the Society’s obligations to the Central Bank of Ireland and loan commitments. (ii)Liquidityrisk Liquidity risk relates to the ability of the Group to meet its on and off balance sheet obligations in a timely manner as they fall due, without incurring excessive cost, whilst continuing to fund its assets and growth therein. The Group applies the maturity mismatch approach to the management of liquidity following the adoption of this method by the Central Bank in July 2007. The overall purpose of a maturity mismatch approach is to ensure that the Group will have, at any given time, a pool of highly liquid assets capable of being converted into cash within four business days, sufficient to cover a certain percentage of foreseeable cash outflows for future periods of time (‘time bands’). Expected changes to the liquidity framework (upcoming Bank for International Settlements and European Banking Authority regulations in 2011) will be incorporated into Group policies upon finalisation by the relevant authorities. The Group has conducted stress tests in advance of these expected changes. Funding contingency plans are continually under review in light of unprecedented market and EBS specific events. The maturity mismatch approach requires cash flows to be analysed under various headings and assigned to predetermined time bands depending on when the cash is received or paid out. Assumptions are made about the retention rates of certain retail and corporate flows, which are based on historical behaviour together with additional prudential reductions (haircuts). Maturity mismatches are assessed on a net cumulative basis, with statutory limits imposed on the first (up to eight days) and second (over eight days to one month) time bands. The Group applies internal limits in excess of the regulatory requirements for these two time bands. Key measures used by the Group for managing liquidity risk are the liquidity ratios, calculated and reported on a daily basis to the Group Treasurer, on a weekly basis to the Central Bank and on a monthly basis to the Asset & Liability Committee and the Board. Any breaches of limits are escalated immediately in line with the escalation procedure. EBS was one of the Irish institutions included in the Covered Institutions (Financial Support) Scheme 2008 (‘CIFS’) which ran from September 2008 to September 2010. EBS also joined the Credit Institutions (Eligible Liabilities Guarantee) Scheme 2009 (ELG) in early February 2010. These schemes greatly assisted EBS in securing long term and short term wholesale funding throughout 2009 and the early part of 2010. As at 31 December 2010, EBS had raised a total of €1,025.0m in 5 year fixed term funding under the terms of the ELG scheme. Such funding would not have been possible without the Government Guarantee as provided under the ELG scheme. The cost of the ELG scheme for 2010 was €34.6m (see note 3) and the cost of the CIFS scheme for 2010 was €5.6m (see note 4). As a result of the worsening liquidity position and very limited access to the capital markets, the EBS Board approved a number of funding and liquidity contingency measures in July 2010 designed to increase the EBS pool of usable collateral to facilitate secured funding from quarter 3 2010 onwards. These measures increased the pool of collateral available but due to a series of negative market events in the latter part of 2010 as outlined below, EBS was unable to gainfully utilise this additional collateral. The liquidity position of EBS deteriorated in late quarter 4 2010 as a result of a number of factors including the downgrading of the Group and the Irish Sovereign, the EU/IMF assistance programme and market uncertainty around the impact of the general election. These factors combined to cause a collapse of market confidence in Ireland and all Irish domestic credit institutions including EBS. This collapse in turn led to some wholesale customers withdrawing deposits in late November and early December 2010. EBS thereupon increased its reliance on the Monetary Authorities for required funding. Given the market access difficulty for both the Irish Sovereign and Irish banks, the liquidity position has gone below regulatory ratio requirements. The Central Bank has been informed of any breaches. This sudden loss of liquidity during this period caused the Group to breach the regulatory liquidity requirements on a small number of occasions since that time and into 2011. As at 31 December 2010, EBS Group had a total of €4,880.0m in secured funding from the European and Irish Monetary Authorities (see note 24).
Notes to the Financial Statements 31 December 2010
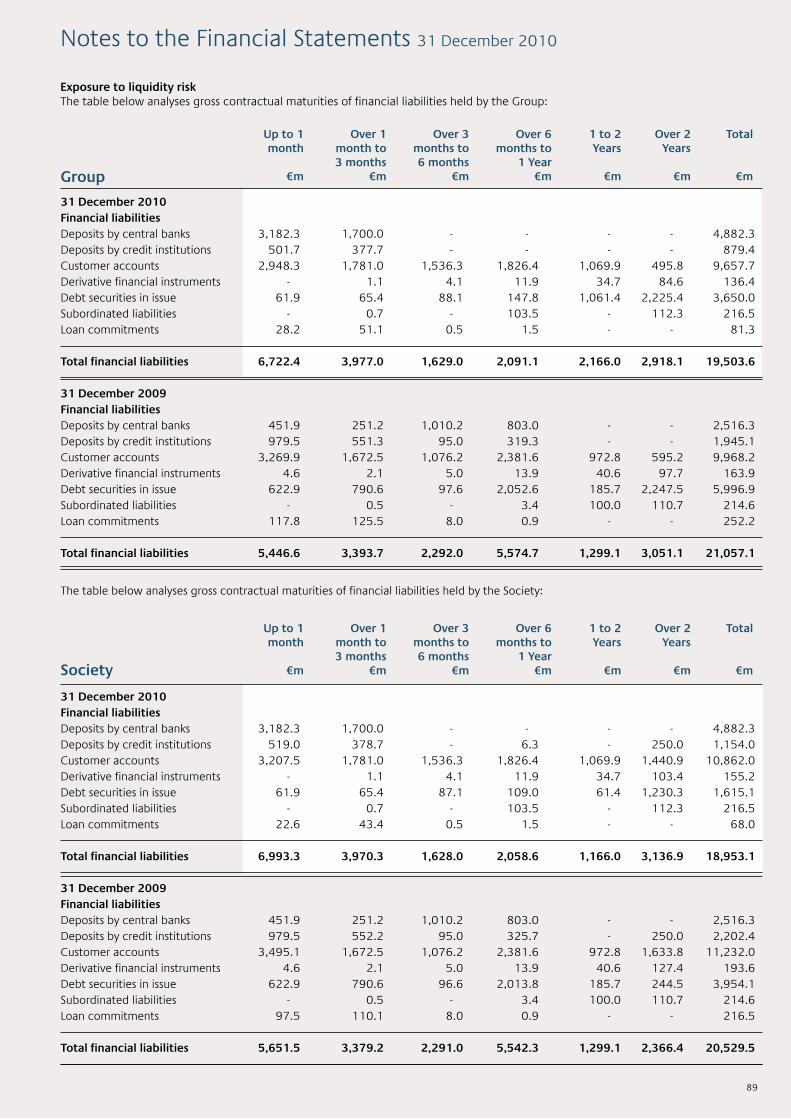
89
Exposuretoliquidityrisk The table below analyses gross contractual maturities of financial liabilities held by the Group:
Notes to the Financial Statements 31 December 2010
31December2010 Financialliabilities Deposits by central banks 3,182.3 1,700.0 - - - - 4,882.3 Deposits by credit institutions 519.0 378.7 - 6.3 - 250.0 1,154.0 Customer accounts 3,207.5 1,781.0 1,536.3 1,826.4 1,069.9 1,440.9 10,862.0 Derivative financial instruments - 1.1 4.1 11.9 34.7 103.4 155.2 Debt securities in issue 61.9 65.4 87.1 109.0 61.4 1,230.3 1,615.1 Subordinated liabilities - 0.7 - 103.5 - 112.3 216.5 Loan commitments 22.6 43.4 0.5 1.5 - - 68.0 Totalfinancialliabilities 6,993.3 3,970.3 1,628.0 2,058.6 1,166.0 3,136.9 18,953.1
31December2009 Financialliabilities Deposits by central banks 451.9 251.2 1,010.2 803.0 - - 2,516.3 Deposits by credit institutions 979.5 552.2 95.0 325.7 - 250.0 2,202.4 Customer accounts 3,495.1 1,672.5 1,076.2 2,381.6 972.8 1,633.8 11,232.0 Derivative financial instruments 4.6 2.1 5.0 13.9 40.6 127.4 193.6 Debt securities in issue 622.9 790.6 96.6 2,013.8 185.7 244.5 3,954.1 Subordinated liabilities - 0.5 - 3.4 100.0 110.7 214.6 Loan commitments 97.5 110.1 8.0 0.9 - - 216.5 Totalfinancialliabilities 5,651.5 3,379.2 2,291.0 5,542.3 1,299.1 2,366.4 20,529.5
The table below analyses gross contractual maturities of financial liabilities held by the Society:
31December2010 Financialliabilities Deposits by central banks 3,182.3 1,700.0 - - - - 4,882.3 Deposits by credit institutions 501.7 377.7 - - - - 879.4 Customer accounts 2,948.3 1,781.0 1,536.3 1,826.4 1,069.9 495.8 9,657.7 Derivative financial instruments - 1.1 4.1 11.9 34.7 84.6 136.4 Debt securities in issue 61.9 65.4 88.1 147.8 1,061.4 2,225.4 3,650.0 Subordinated liabilities - 0.7 - 103.5 - 112.3 216.5 Loan commitments 28.2 51.1 0.5 1.5 - - 81.3 Totalfinancialliabilities 6,722.4 3,977.0 1,629.0 2,091.1 2,166.0 2,918.1 19,503.6 31December2009 Financialliabilities Deposits by central banks 451.9 251.2 1,010.2 803.0 - - 2,516.3 Deposits by credit institutions 979.5 551.3 95.0 319.3 - - 1,945.1 Customer accounts 3,269.9 1,672.5 1,076.2 2,381.6 972.8 595.2 9,968.2 Derivative financial instruments 4.6 2.1 5.0 13.9 40.6 97.7 163.9 Debt securities in issue 622.9 790.6 97.6 2,052.6 185.7 2,247.5 5,996.9 Subordinated liabilities - 0.5 - 3.4 100.0 110.7 214.6 Loan commitments 117.8 125.5 8.0 0.9 - - 252.2 Totalfinancialliabilities 5,446.6 3,393.7 2,292.0 5,574.7 1,299.1 3,051.1 21,057.1
Up to 1month
€m
Up to 1month
€m
Over 1 month to 3 months
€m
Over 1 month to 3 months
€m
Over 3 months to 6 months
€m
Over 3 months to 6 months
€m
Over 6 months to
1 Year €m
Over 6 months to
1 Year €m
1 to 2 Years
€m
1 to 2 Years
€m
Over 2 Years
€m
Over 2 Years
€m
Total
€m
Total
€m
Group
Society
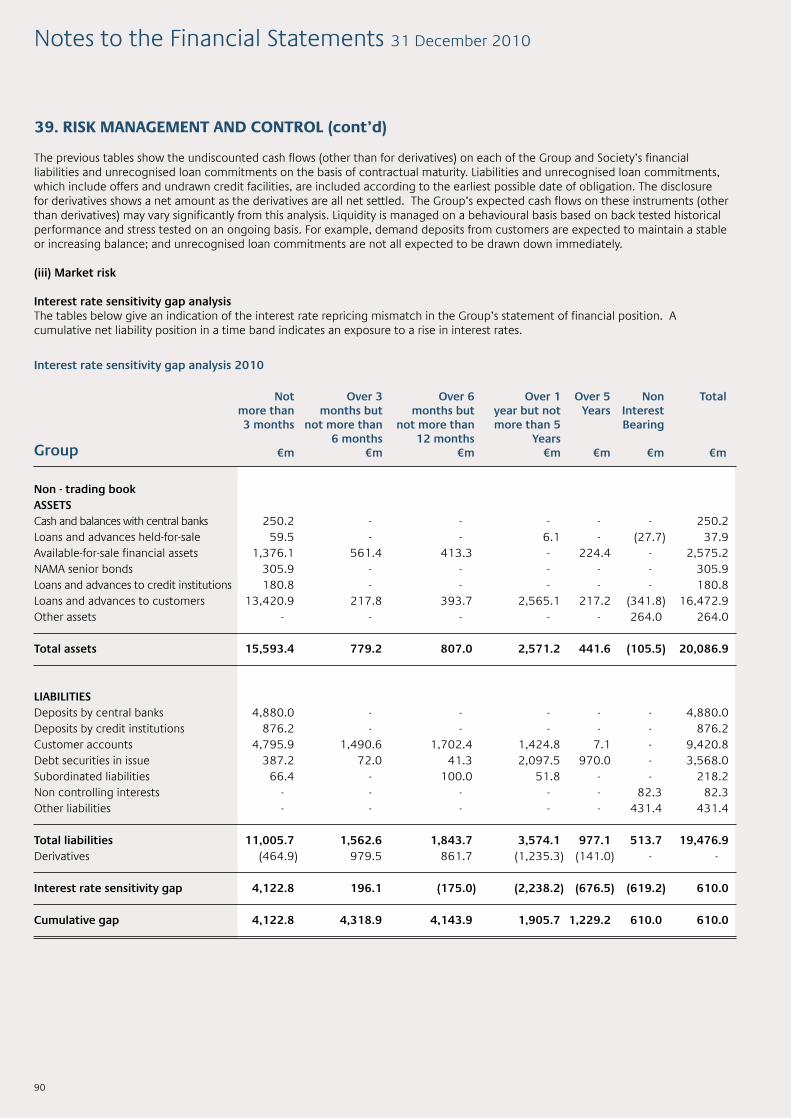
Non-tradingbook ASSETS Cash and balances with central banks 250.2 - - - - - 250.2 Loans and advances held-for-sale 59.5 - - 6.1 - (27.7) 37.9 Available-for-sale financial assets 1,376.1 561.4 413.3 - 224.4 - 2,575.2 NAMA senior bonds 305.9 - - - - - 305.9 Loans and advances to credit institutions 180.8 - - - - - 180.8 Loans and advances to customers 13,420.9 217.8 393.7 2,565.1 217.2 (341.8) 16,472.9 Other assets - - - - - 264.0 264.0
Total assets 15,593.4 779.2 807.0 2,571.2 441.6 (105.5) 20,086.9
LIABILITIES Deposits by central banks 4,880.0 - - - - - 4,880.0 Deposits by credit institutions 876.2 - - - - - 876.2 Customer accounts 4,795.9 1,490.6 1,702.4 1,424.8 7.1 - 9,420.8 Debt securities in issue 387.2 72.0 41.3 2,097.5 970.0 - 3,568.0 Subordinated liabilities 66.4 - 100.0 51.8 - - 218.2 Non controlling interests - - - - - 82.3 82.3 Other liabilities - - - - - 431.4 431.4
Totalliabilities 11,005.7 1,562.6 1,843.7 3,574.1 977.1 513.7 19,476.9 Derivatives (464.9) 979.5 861.7 (1,235.3) (141.0) - -
Interest rate sensitivity gap 4,122.8 196.1 (175.0) (2,238.2) (676.5) (619.2) 610.0
Cumulative gap 4,122.8 4,318.9 4,143.9 1,905.7 1,229.2 610.0 610.0
90
The previous tables show the undiscounted cash flows (other than for derivatives) on each of the Group and Society’s financial liabilities and unrecognised loan commitments on the basis of contractual maturity. Liabilities and unrecognised loan commitments, which include offers and undrawn credit facilities, are included according to the earliest possible date of obligation. The disclosure for derivatives shows a net amount as the derivatives are all net settled. The Group’s expected cash flows on these instruments (other than derivatives) may vary significantly from this analysis. Liquidity is managed on a behavioural basis based on back tested historical performance and stress tested on an ongoing basis. For example, demand deposits from customers are expected to maintain a stable or increasing balance; and unrecognised loan commitments are not all expected to be drawn down immediately. (iii) Market risk Interest rate sensitivity gap analysis The tables below give an indication of the interest rate repricing mismatch in the Group’s statement of financial position. A cumulative net liability position in a time band indicates an exposure to a rise in interest rates. Interest rate sensitivity gap analysis 2010
39. RISK MANAGEMENT AND CONTROL (cont’d)
Notes to the Financial Statements 31 December 2010
Not more than 3 months
€m
Over 3 monthsbut
not more than 6 months
€m
Over 6 monthsbut
not more than 12 months
€m
Over 1 yearbutnotmore than 5
Years €m
Over 5 Years
€m
Non Interest Bearing
€m
Total
€mGroup

91
In the tables above the assets and liabilities are allocated to time buckets based on the next repricing date of the individual assets and liabilities underlying the categories above. The financial assets exposed to fair value interest rate risk are €4,591.6m (2009: €6,573.4m), exposed to cash flow interest rate risk are €15,600.8m (2009: €14,938.2m) and not exposed to interest rate risk are €105.5m (2009: (€6.0m)). The financial liabilities exposed to fair value interest rate risk are €7,957.5m (2009: €8,260.7m), exposed to cash flow interest rate risk are €11,005.7m (2009: €12,353.3m) and not exposed to interest rate risk are €513.7m (2009: €496.3m). There are some limitations associated with the above analysis, mainly due to market effects, over aggregation and run-offs. However, measures have been taken to minimise the effect of these limitations in line with industry practice and we are satisfied that the sensitivity analysis is an appropriate tool for measuring interest rate risk. Interest rate stress testing The Group conducts daily stress testing on the banking book portfolio, evaluating the exposure of the Group and Society to a parallel interest rate shift of 100 bps and a series of yield curve twist tests. The Group also conducts at least monthly interest rate stress testing on the Reserve Investment Portfolio, evaluating the exposure of the Group and Society to a parallel interest rate shift of 100 bps and a series of yield curve twist tests. The results of these stress tests are presented to the Asset & Liability Committee on a monthly basis.
Non-tradingbook ASSETS Cash and balances with central banks 196.5 - - - - - 196.5 Loans and advances held-for-sale to NAMA 895.1 - 7.8 8.9 1.0 (162.2) 750.6 Available-for-sale financial assets 208.5 244.7 737.2 1,496.8 237.6 - 2,924.8 Loans and advances to credit institutions 307.6 - 650.1 - - - 957.7 Loans and advances to customers 13,330.5 429.5 445.0 2,178.9 135.9 (46.3) 16,473.5 Other assets - - - - - 202.5 202.5
Total assets 14,938.2 674.2 1,840.1 3,684.6 374.5 (6.0) 21,505.6
LIABILITIES Deposits by central banks 700.0 - 1,800.0 - - - 2,500.0 Deposits by credit institutions 1,737.4 94.5 102.0 - - - 1,933.9 Customer accounts 5,119.0 1,042.0 2,322.5 1,323.1 23.6 - 9,830.2 Debt securities in issue 4,611.9 87.1 1,074.7 91.1 25.0 - 5,889.8 Subordinated liabilities 60.0 - - 150.1 - 5.1 215.2 Non controlling interests 125.0 - - - 125.0 (4.8) 245.2 Other liabilities - - - - - 496.0 496.0
Totalliabilities 12,353.3 1,223.6 5,299.2 1,564.3 173.6 496.3 21,110.3 Derivatives (4,713.8) 3,162.8 2,064.5 (322.7) (190.8) - -
Interest rate sensitivity gap (2,128.9) 2,613.4 (1,394.6) 1,797.6 10.1 (502.3) 395.3
Cumulative gap (2,128.9) 484.5 (910.1) 887.5 897.6 395.3 395.3
Not more than 3 months
€m
Over 3 monthsbut
not more than 6 months
€m
Over 6 monthsbut
not more than 12 months
€m
Over 1 yearbutnotmore than 5
Years €m
Over 5 Years
€m
Non Interest Bearing
€m
Total
€mGroup
Interest rate sensitivity gap analysis 2009
Notes to the Financial Statements 31 December 2010

Sterling 438.5 393.6 US Dollars 81.6 263.5 Japanese Yen - 7.5 Czeck Krona 61.2 57.9 Total 581.3 722.5
GroupandSociety
2010 2009 €m €m
92
The tables below provide an analysis of the Group’s sensitivity to an increase or decrease in market rates:
The above table shows the present value effect that would be realised in the income statement on an accruals basis on the banking book and reserve investment book over the life of the assets and liabilities contained therein. Overall interest rate risk positions are managed by Group Treasury. The use of derivatives to manage interest rate risk is described in note 38. There have been no changes in methods or assumptions used from the prior year for managing interest rate risk. Exposure to other market risks Foreign exchange risk The Group and Society take the euro as their base currency. However, through the normal course of business operations, EBS naturally accumulates foreign currency positions. The Group is therefore exposed to movements in foreign exchange rates that may have an adverse effect on the economic value of the Group and Society. The size of the foreign currency open positions are kept within small operational limits.
The main methods used for mitigating foreign exchange risk include prohibiting the running of a trading book in any foreign currency, monitoring and centrally managing foreign exchange risk and hedging open currency positions through the use of derivatives. The Group and Society have no substantial net exposure to foreign exchange rate fluctuations or changes in foreign currency interest rates.
Bankingbookportfolio Average for the period -/+ 4,571 -/+ 3,947 Maximum for the period -/+ 11,488 -/+ 8,365 Minimum for the period -/+ 51 -/+ 172 Reserve investment portfolio Average for the period -/+ 9,856 -/+ 15,249 Maximum for the period -/+ 12,163 -/+ 17,837 Minimum for the period -/+ 7,424 -/+ 12,393
2010 2009 €’000 €’000
100bpsparallelshift (increase/decrease)
Assets(includingderivatives)denominatedincurrencyotherthanEuro:
Liabilities(includingderivatives)denominatedincurrencyotherthanEuro:
Sterling 438.8 392.5 US Dollars 80.8 263.7 Japanese Yen - 7.5 Czeck Krona 61.2 57.9 Total 580.8 721.6
39. RISK MANAGEMENT AND CONTROL (cont’d)
Notes to the Financial Statements 31 December 2010

ASSETS Cash and balances with central banks Amortised cost 250.2 250.2 - 196.5 196.5 - Derivative financial instruments Fair value 58.4 58.4 - 50.0 50.0 - Loans and advances held-for-sale to NAMA Amortised cost 37.9 37.9 - 750.6 639.0 (111.6) Available-for-sale financial assets Available-for-sale 2,575.2 2,575.2 - 2,924.8 2,924.8 - NAMA senior bonds Loans and receivables 305.9 301.1 (4.8) - - - Loans and advances to credit institutions Loans and receivables 180.8 180.8 - 957.7 957.4 (0.3) Loans and advances to customers Loans and receivables 16,472.9 15,212.7 (1,260.2) 16,473.5 15,922.2 (551.3) LIABILITIES Deposits by central banks Amortised cost 4,880.0 4,880.0 - 2,500.0 2,500.0 - Deposits by credit institutions Amortised cost 876.2 876.2 - 1,933.9 1,933.9 - Customer accounts Amortised cost 9,420.8 9,138.2 282.6 9,830.2 9,781.8 48.4 Derivative financial instruments Fair value 136.4 136.4 - 163.9 163.9 - Debt securities in issue Amortised cost 3,568.0 2,849.6 718.4 5,889.8 5,756.2 133.6 Subordinated liabilities Amortised cost 218.2 63.5 152.8 215.2 185.3 29.9
93
Fundingrisk-creditspreads Funding risk (not relating to changes in the obligor / issuer’s credit standing) is closely managed by Group Treasury and is monitored on an ongoing basis by the Asset & Liability Committee. Fair value risk The following table represents the fair value of financial instruments, including those not reflected in the financial statements at fair value. It is accompanied by a discussion of the methods used to determine fair value for financial instruments. In addition we have also set out the accounting classifications of each of the assets and liabilities. Where assets or liabilities are in a fair value hedge relationship the underlying asset or liability is also marked to market.
ASSETS
Cash and balances with central banks Amortised cost 236.2 236.2 - 180.6 180.6 -
Derivative financial instruments Fair value 82.5 82.5 - 93.1 93.1 -
Loans and advances held-for-sale Loans and receivables 37.9 37.9 - 750.6 639.0 (111.6)
Available-for-sale financial assets Available-for-sale 3,943.2 3,943.2 - 3,972.2 3,972.2 -
NAMA senior bonds Loans and receivables 305.9 301.1 (4.8) - - -
Loans and advances to credit institutions Loans and receivables 2,981.3 2,981.3 - 3,717.4 3,717.1 (0.3)
Loans and advances to customers Loans and receivables 10,865.9 10,031.6 (834.3) 11,659.8 11,309.6 (350.2)
LIABILITIES Deposits by central banks Amortised cost 4,880.0 4,880.0 - 2,500.0 2,500.0 -
Deposits by credit institutions Amortised cost 1,139.6 1,139.6 - 2,183.9 2,183.9 -
Customer accounts Amortised cost 10,621.3 10,302.7 318.6 11,082.8 11,034.4 48.4
Derivative financial instruments Fair value 155.2 155.2 - 193.6 193.6 -
Debt securities in issue Amortised cost 1,567.7 1,289.1 278.6 3,895.5 3,761.0 134.5
Subordinated liabilities Amortised cost 218.2 63.5 152.8 215.2 185.3 29.9
Group
Society
Accounting classifications
Carrying Value
€m
2009
Fair Value
€m
Unrecognised Gain (Loss)
€m
Carrying Value
€m
2010
Fair Value
€m
Unrecognised Gain (Loss)
€m
Accounting classifications
Carrying Value
€m
2009
Fair Value
€m
Unrecognised Gain (Loss)
€m
Carrying Value
€m
2010
Fair Value
€m
Unrecognised Gain (Loss)
€m
Notes to the Financial Statements 31 December 2010
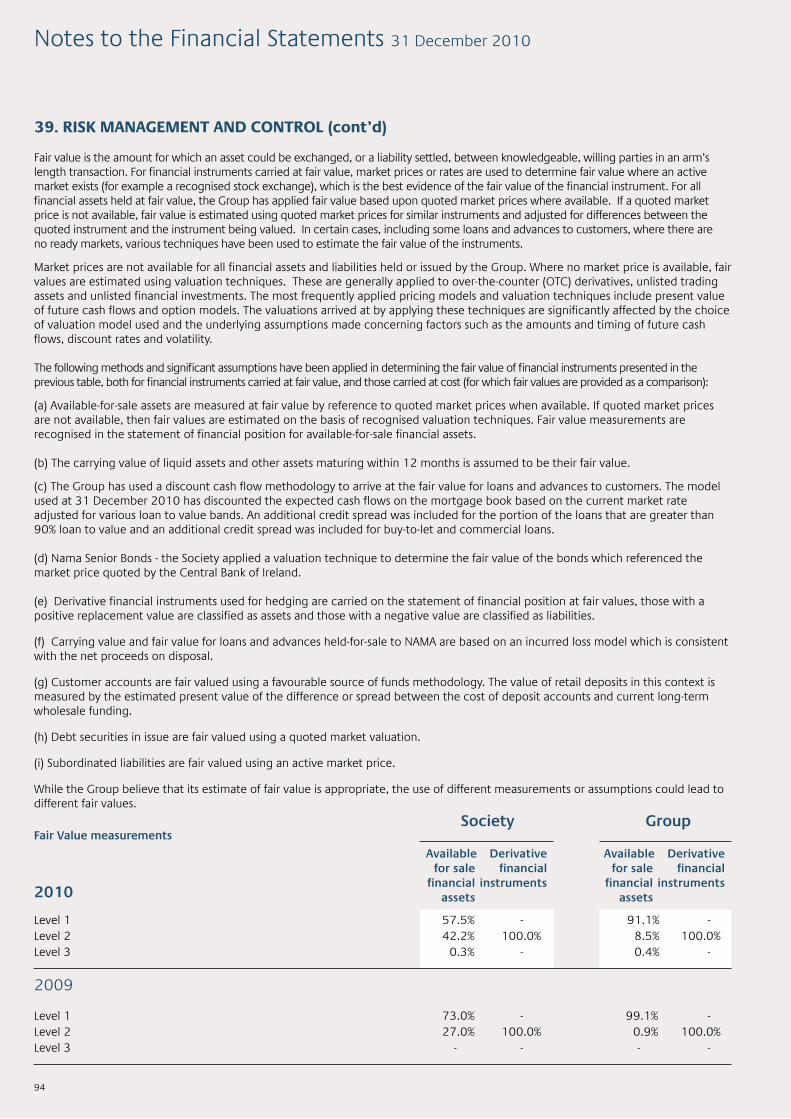
94
Fair value is the amount for which an asset could be exchanged, or a liability settled, between knowledgeable, willing parties in an arm’s length transaction. For financial instruments carried at fair value, market prices or rates are used to determine fair value where an active market exists (for example a recognised stock exchange), which is the best evidence of the fair value of the financial instrument. For all financial assets held at fair value, the Group has applied fair value based upon quoted market prices where available. If a quoted market price is not available, fair value is estimated using quoted market prices for similar instruments and adjusted for differences between the quoted instrument and the instrument being valued. In certain cases, including some loans and advances to customers, where there are no ready markets, various techniques have been used to estimate the fair value of the instruments. Market prices are not available for all financial assets and liabilities held or issued by the Group. Where no market price is available, fair values are estimated using valuation techniques. These are generally applied to over-the-counter (OTC) derivatives, unlisted trading assets and unlisted financial investments. The most frequently applied pricing models and valuation techniques include present value of future cash flows and option models. The valuations arrived at by applying these techniques are significantly affected by the choice of valuation model used and the underlying assumptions made concerning factors such as the amounts and timing of future cash flows, discount rates and volatility. The following methods and significant assumptions have been applied in determining the fair value of financial instruments presented in the previous table, both for financial instruments carried at fair value, and those carried at cost (for which fair values are provided as a comparison): (a) Available-for-sale assets are measured at fair value by reference to quoted market prices when available. If quoted market prices are not available, then fair values are estimated on the basis of recognised valuation techniques. Fair value measurements are recognised in the statement of financial position for available-for-sale financial assets. (b) The carrying value of liquid assets and other assets maturing within 12 months is assumed to be their fair value. (c) The Group has used a discount cash flow methodology to arrive at the fair value for loans and advances to customers. The model used at 31 December 2010 has discounted the expected cash flows on the mortgage book based on the current market rate adjusted for various loan to value bands. An additional credit spread was included for the portion of the loans that are greater than 90% loan to value and an additional credit spread was included for buy-to-let and commercial loans. (d) Nama Senior Bonds - the Society applied a valuation technique to determine the fair value of the bonds which referenced the market price quoted by the Central Bank of Ireland. (e) Derivative financial instruments used for hedging are carried on the statement of financial position at fair values, those with a positive replacement value are classified as assets and those with a negative value are classified as liabilities. (f) Carrying value and fair value for loans and advances held-for-sale to NAMA are based on an incurred loss model which is consistent with the net proceeds on disposal. (g) Customer accounts are fair valued using a favourable source of funds methodology. The value of retail deposits in this context is measured by the estimated present value of the difference or spread between the cost of deposit accounts and current long-term wholesale funding. (h) Debt securities in issue are fair valued using a quoted market valuation. (i) Subordinated liabilities are fair valued using an active market price. While the Group believe that its estimate of fair value is appropriate, the use of different measurements or assumptions could lead to different fair values. Society
Level 1 73.0% - 99.1% - Level 2 27.0% 100.0% 0.9% 100.0% Level 3 - - - -
2009
Group
Level 1 57.5% - 91.1% - Level 2 42.2% 100.0% 8.5% 100.0% Level 3 0.3% - 0.4% -
2010
Fair Value measurements
Available Derivative forsale financial financial instruments assets
Available Derivative forsale financial financial instruments assets
39. RISK MANAGEMENT AND CONTROL (cont’d)
Notes to the Financial Statements 31 December 2010
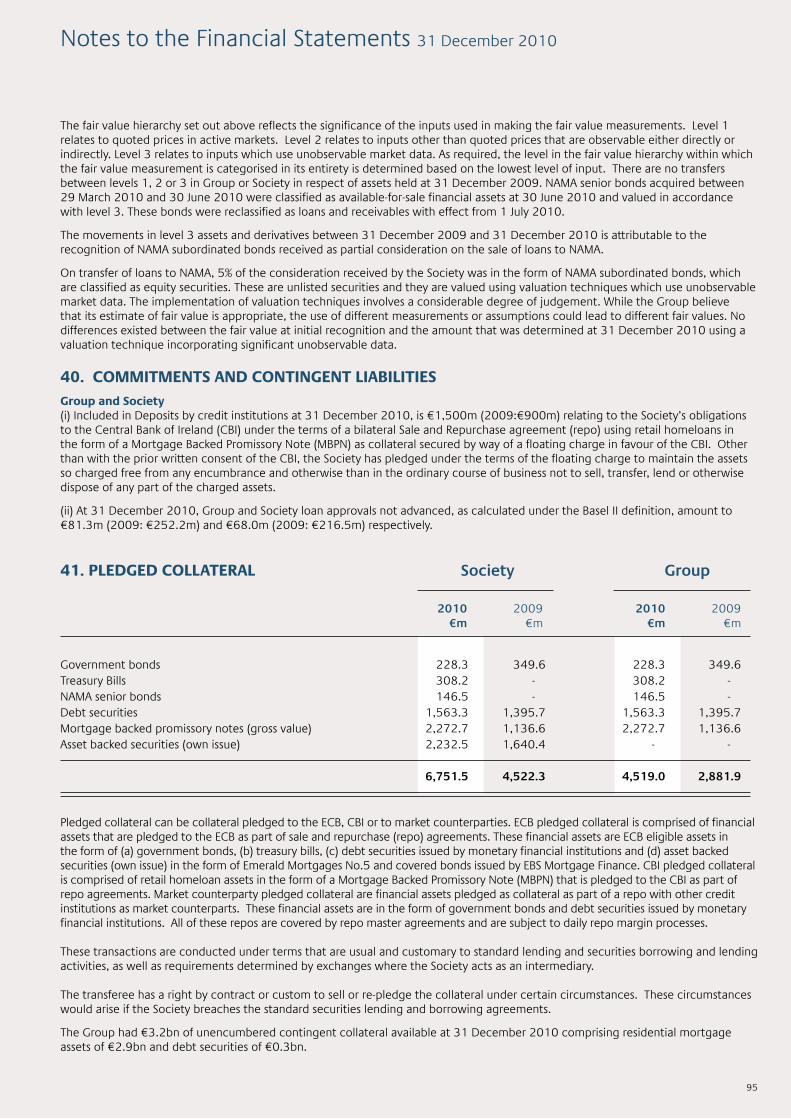
95
The fair value hierarchy set out above reflects the significance of the inputs used in making the fair value measurements. Level 1 relates to quoted prices in active markets. Level 2 relates to inputs other than quoted prices that are observable either directly or indirectly. Level 3 relates to inputs which use unobservable market data. As required, the level in the fair value hierarchy within which the fair value measurement is categorised in its entirety is determined based on the lowest level of input. There are no transfers between levels 1, 2 or 3 in Group or Society in respect of assets held at 31 December 2009. NAMA senior bonds acquired between 29 March 2010 and 30 June 2010 were classified as available-for-sale financial assets at 30 June 2010 and valued in accordance with level 3. These bonds were reclassified as loans and receivables with effect from 1 July 2010. The movements in level 3 assets and derivatives between 31 December 2009 and 31 December 2010 is attributable to the recognition of NAMA subordinated bonds received as partial consideration on the sale of loans to NAMA. On transfer of loans to NAMA, 5% of the consideration received by the Society was in the form of NAMA subordinated bonds, which are classified as equity securities. These are unlisted securities and they are valued using valuation techniques which use unobservable market data. The implementation of valuation techniques involves a considerable degree of judgement. While the Group believe that its estimate of fair value is appropriate, the use of different measurements or assumptions could lead to different fair values. No differences existed between the fair value at initial recognition and the amount that was determined at 31 December 2010 using a valuation technique incorporating significant unobservable data.
40. COMMITMENTS AND CONTINGENT LIABILITIES Group and Society (i) Included in Deposits by credit institutions at 31 December 2010, is €1,500m (2009:€900m) relating to the Society’s obligations to the Central Bank of Ireland (CBI) under the terms of a bilateral Sale and Repurchase agreement (repo) using retail homeloans in the form of a Mortgage Backed Promissory Note (MBPN) as collateral secured by way of a floating charge in favour of the CBI. Other than with the prior written consent of the CBI, the Society has pledged under the terms of the floating charge to maintain the assets so charged free from any encumbrance and otherwise than in the ordinary course of business not to sell, transfer, lend or otherwise dispose of any part of the charged assets. (ii) At 31 December 2010, Group and Society loan approvals not advanced, as calculated under the Basel II definition, amount to €81.3m (2009: €252.2m) and €68.0m (2009: €216.5m) respectively.
Government bonds 228.3 349.6 228.3 349.6 Treasury Bills 308.2 - 308.2 - NAMA senior bonds 146.5 - 146.5 - Debt securities 1,563.3 1,395.7 1,563.3 1,395.7 Mortgage backed promissory notes (gross value) 2,272.7 1,136.6 2,272.7 1,136.6 Asset backed securities (own issue) 2,232.5 1,640.4 - -
6,751.5 4,522.3 4,519.0 2,881.9
41. PLEDGED COLLATERAL Society Group
2010 2009 €m €m
2010 2009 €m €m
Pledged collateral can be collateral pledged to the ECB, CBI or to market counterparties. ECB pledged collateral is comprised of financial assets that are pledged to the ECB as part of sale and repurchase (repo) agreements. These financial assets are ECB eligible assets in the form of (a) government bonds, (b) treasury bills, (c) debt securities issued by monetary financial institutions and (d) asset backed securities (own issue) in the form of Emerald Mortgages No.5 and covered bonds issued by EBS Mortgage Finance. CBI pledged collateral is comprised of retail homeloan assets in the form of a Mortgage Backed Promissory Note (MBPN) that is pledged to the CBI as part of repo agreements. Market counterparty pledged collateral are financial assets pledged as collateral as part of a repo with other credit institutions as market counterparts. These financial assets are in the form of government bonds and debt securities issued by monetary financial institutions. All of these repos are covered by repo master agreements and are subject to daily repo margin processes. These transactions are conducted under terms that are usual and customary to standard lending and securities borrowing and lending activities, as well as requirements determined by exchanges where the Society acts as an intermediary. The transferee has a right by contract or custom to sell or re-pledge the collateral under certain circumstances. These circumstances would arise if the Society breaches the standard securities lending and borrowing agreements. The Group had €3.2bn of unencumbered contingent collateral available at 31 December 2010 comprising residential mortgage assets of €2.9bn and debt securities of €0.3bn.
Notes to the Financial Statements 31 December 2010
96
42. RELATED PARTY TRANSACTIONS Group Details of the principal subsidiary undertakings are shown in Note 18. In accordance with IAS 24 - related party disclosures, transactions or balances between group entities that have been eliminated on consolidation are not reported. TheIrishGovernmentandGovernmentrelatedentities (a) Irish Government Guarantee Schemes EBS Building Society and its subsidiary EBS Mortgage Finance are covered institutions under the Government’s Credit Institutions (Financial Support) Scheme 2008 (the “CIFS Scheme”) which guaranteed covered liabilities raised by covered institutions up to 29 September 2010. Covered liabilities that were covered by the CIFS Scheme were those liabilities in respect of retail and corporate deposits (to the extent not covered by existing deposit protection scheme in Ireland or any other jurisdiction), inter-bank deposits and senior unsecured debt excluding any intra group borrowing and any debt due to the European Central Bank arising from Euro-system monetary operations. Under the terms of the CIFS Scheme the Central Bank in consultation with the Minister regulated the commercial conduct of covered institutions strictly in order to achieve the objectives of this scheme. EBS Building Society is a participating institution under the Government’s Credit Institutions (Eligible Liabilities Guarantee) Scheme 2009 (the “ELG scheme”) which guarantees certain eligible liabilities (including deposits) of up to five years in maturity. The terms of the prolongation and modification of the ELG scheme on 28 June 2010 provided that guaranteed liabilities under the ELG scheme can continue with similar conditions, albeit at a higher cost, to 29 September 2010. Beyond this date, the European Commission approved a modification to the scheme to provide for a prolongation of the issuance window from 29 September 2010 to 31 December 2010 in respect of all eligible liabilities. The total amount of guaranteed deposits and senior unsecured debt raised by the Society as a covered institution under the Government Guarantee ELG scheme at 31 December 2010 amounted to €5,121.7m (December 2009: €11,837.5m under both ELG and CIFS schemes). In 2010 €4.5m was charged to EBS under the CIFS scheme (2009: €7.9m) and €34.6m was charged to EBS under the ELG scheme (2009: Nil). €1.1m was charged to EBS Mortgage Finance Unlimited under the CIFS scheme for the year ended 31 December 2010 (Nil for the year ending 31 December 2009) (b)SpecialInvestmentShares A special general meeting of the Society was held in December 2009 at which the EBS members approved the issue of Special Investment Shares to the Minister for Finance. On 27 May 2010, the Society issued 1,000,000 perpetual Special Investment Shares to the Minister for Finance for an aggregate subscription price of €100m. On 14 December 2010, the Society issued 5,250,000 perpetual Special Investment Shares to the Minister for Finance for an aggregate subscription price of €525m. Further information on the Special Investment Shares is included in note 32. (c) Promissory Note On 17 June 2010, a Promissory Note in the initial principal amount of €250m was issued by the Minister for Finance to EBS Building Society pursuant to the Minister’s powers under the Credit Institutions (Financial Support) Act 2008. Further information on the Promissory Note is included in note 33. Interest earned on the Promissory Note for the year ending 31 December 2010 amounted to €7.4m (2009: Nil). (d)NationalAssetManagementAgency(NAMA) The Irish Government set up an asset relief scheme in 2009 under the auspices of the National Asset Management Agency in Ireland. EBS is a participating institution in NAMA. Senior unsecured floating rate notes and callable perpetual subordinated fixed rate bonds were received as consideration from NAMA for the transfer of loans and receivables. Further information on this is included in notes 10, 13 and 14. Interest earned on these bonds in 2010 amounted to €2.3m (2009: Nil). (e)CreditInstitutions(Stabilisation)Act2010 The Credit Institutions (Stabilisation) Act 2010 was passed into Irish law on 21 December 2010. The Act provides the legislative basis for the re-organisation and restructuring of the Irish banking system agreed in the joint EU/IMF programme for Ireland. The Act applies to all institutions that have received financial support from the State and as such applies to EBS. The Act provides powers to the Minister for Finance (in consultation with the Governor of the Central Bank of Ireland) to act on financial stability grounds to effect the restructuring and recapitalisation measures envisaged in the programme. This allows the Minister to take the actions required to bring about a domestic retail bank system that is proportionate to and focussed on the Irish economy.
Notes to the Financial Statements 31 December 2010

97
(f)Governmentrelatedentities As a result of the capital received from Government and the participation in the Government Guarantee Scheme, the Government is recognised as a related party, as defined under the accounting standards. In the normal course of business the Group has various transactions with the Government, state departments and semi-state bodies and state owned financial institutions including the holding of securities issued by the Government and semi-state bodies of €159.8m (December 2009: €208.3m). Deposits by banks and state owned financial institutions include deposits of €796.9m (December 2009: €377.3m) placed by the National Treasury Management Agency (NTMA). During 2009 and 2010 the Government acquired 100% of shares in Anglo Irish Bank Corporation Limited (“Anglo”), acquired a controlling interest in Irish Nationwide Building Society, Allied Irish Banks, p.l.c. and acquired a significant influence over Bank of Ireland. As the Government also took a controlling interest in the Society, balances between the Group and each of the other aforementioned institutions are considered to be related party transactions. These institutions, together with Irish Life and Permanent Group Holdings Plc are members of the Credit Institutions (Eligible Liabilities Guarantee) Scheme 2009. The following table sets out the aggregate balance between the Group and these financial institutions.
(g)Subsidiariesandspecialpurposevehicles Society A number of transactions are entered into with related parties (i.e. subsidiaries and special purpose vehicles) in the normal course of business by the Society. These include deposits, loans and rental agreements.
2010 806.7 - - 655.1 1.4 2009 893.8 1.2 828.0 1,661.7 2.9
Asat31December
Available-for-salefinancial
assets
€m
Derivative financial
instruments (Assets)
€m
Loansandadvancestocredit
institutions €m
Deposits byCredit
institutions
€m
Derivative financial
instruments (Liabilities)
€m
Loanstorelatedparties At 1 January 3,772.2 2,537.5 Net movement in loans during the year (296.5) 1,234.7 At31December 3,475.7 3,772.2
Depositsfromrelatedparties At 1 January 3,446.7 3,604.4 Net movement in deposits during the year 122.5 (157.7)
At31December 3,569.2 3,446.7
Permanentinterestbearingshares At 1 January 250.0 250.0 Issued in the year - - At31December 250.0 250.0 IncludedintheIncomeStatement: Interest income on loans 5.3 11.8 Interest expense on loans 103.4 107.1 Interest expense on permanent interest bearing shares 3.7 11.0 Other income 43.4 33.5
2010 2009 €m €m
Notes to the Financial Statements 31 December 2010
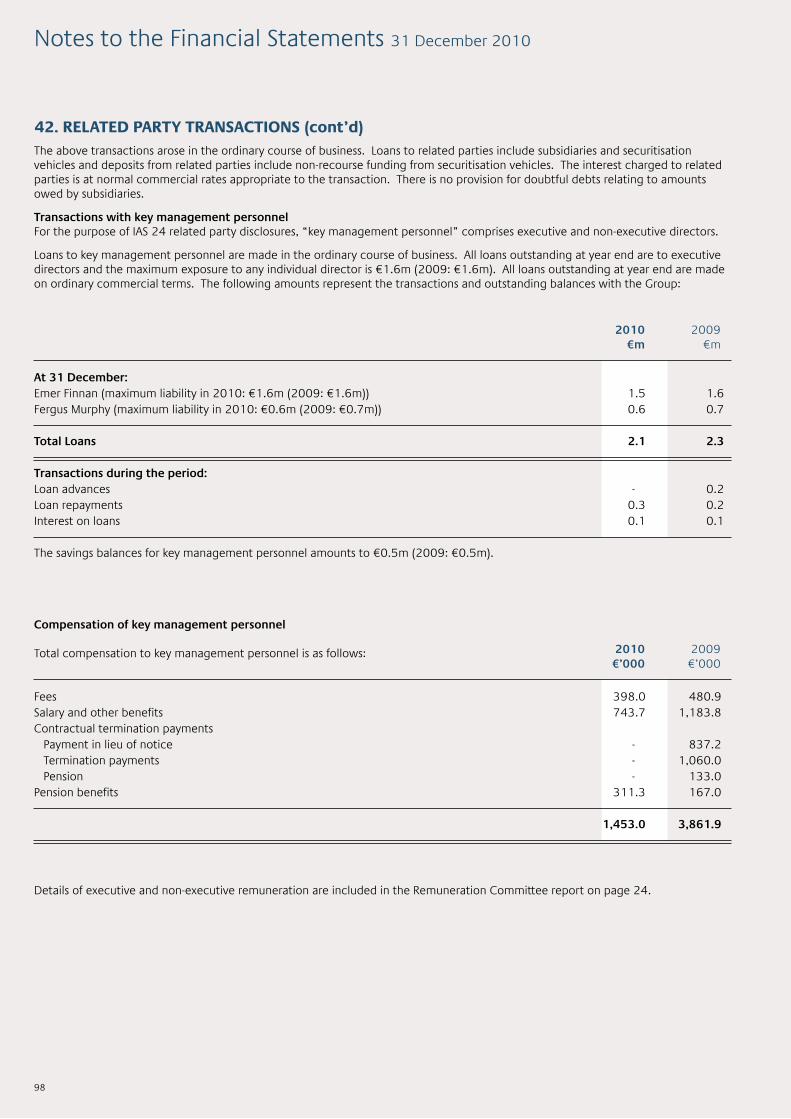
98
The above transactions arose in the ordinary course of business. Loans to related parties include subsidiaries and securitisation vehicles and deposits from related parties include non-recourse funding from securitisation vehicles. The interest charged to related parties is at normal commercial rates appropriate to the transaction. There is no provision for doubtful debts relating to amounts owed by subsidiaries. Transactionswithkeymanagementpersonnel For the purpose of IAS 24 related party disclosures, “key management personnel” comprises executive and non-executive directors. Loans to key management personnel are made in the ordinary course of business. All loans outstanding at year end are to executive directors and the maximum exposure to any individual director is €1.6m (2009: €1.6m). All loans outstanding at year end are made on ordinary commercial terms. The following amounts represent the transactions and outstanding balances with the Group:
Compensation of key management personnel Total compensation to key management personnel is as follows:
Details of executive and non-executive remuneration are included in the Remuneration Committee report on page 24.
At31December: Emer Finnan (maximum liability in 2010: €1.6m (2009: €1.6m)) 1.5 1.6 Fergus Murphy (maximum liability in 2010: €0.6m (2009: €0.7m)) 0.6 0.7 Total Loans 2.1 2.3 Transactionsduringtheperiod: Loan advances - 0.2 Loan repayments 0.3 0.2 Interest on loans 0.1 0.1
The savings balances for key management personnel amounts to €0.5m (2009: €0.5m).
Fees 398.0 480.9 Salary and other benefits 743.7 1,183.8 Contractual termination payments Payment in lieu of notice - 837.2 Termination payments - 1,060.0 Pension - 133.0 Pension benefits 311.3 167.0 1,453.0 3,861.9
2010 2009 €m €m
2010 2009 €’000 €’000
42. RELATED PARTY TRANSACTIONS (cont’d)
Notes to the Financial Statements 31 December 2010
99
43. CAPITAL MANAGEMENT Regulatory capital From 1 January 2008, the minimum regulatory capital requirement of the Group’s banking operations has been calculated in accordance with the provisions of Basel II as implemented by the European Capital Requirements Directive and the Central Bank of Ireland. The objective of Basel II is to more closely align bank regulatory capital with the economic capital required to support the risks being undertaken. The capital required to cover credit, operational and market risks is required to be explicitly measured under the Basel II methodology. In implementing Basel II, the Group has adopted the standardised approach to credit risk. EBS Group sets and monitors capital policy in line with regulatory and legislative requirements. Capital adequacy is monitored by the Capital Forum which reports to the Asset & Liability Committee. In early 2010, the Central Bank announced an increase in the minimum Core Tier 1 ratio requirement for Irish banks and building societies from 4% to 8%. The Central Bank then conducted an extensive assessment of the capital requirement for the Society as part of an industry-wide review, and concluded that EBS would need an additional €875m of capital to be in place at the end of 2010 to meet a Core Tier 1 target of 8%. In late November, as part of the EU/IMF aid package, the Central Bank prescribed a further increase in the Core Tier 1 ratio to 12%, and announced that EBS would require additional capital of €438m by the end of February 2011. On 9 February 2011, the Minister for Finance announced that the capital injection into all Irish banks, including EBS, would be postponed until after the general election on 25 February 2011. In January 2011, the Central Bank initiated a Financial Measures Programme, which incorporated the PCAR and PLAR exercises. The PCAR exercise enabled the Central Bank to perform a thorough and conservative assessment of Banks’ asset quality and earnings together with incorporating incremental three year projected provisions estimates based on Blackrock identified stress loan losses. The PCAR exercise was carried out to determine the required amount of capital to achieve a 10.5% Core Tier 1 capital ratio under Base and a 6% Core Tier 1 ratio under Stress. It was announced on 31 March 2011, that EBS requires €1.2bn of capital to meet the new target Core Tier 1 capital ratio of 10.5% under Base and 6% under Stress on the basis of the combined results of the PCAR assumptions and three year projected provisions estimates from Blackrock, before the addition of a conservative capital buffer. The additional capital buffer of €0.3bn was determined with €0.1bn representing equity and €0.2bn representing contingent capital. This brings the total capital requirement for EBS under the PCAR to €1.5bn. On 31 March 2011, the Minister for Finance confirmed that the Banks will be recapitalised to the levels required under the PCAR, including where appropriate burden sharing with subordinated bondholders. The Central Bank has indicated that capital must be raised by 31 July 2011. The Minister for Finance has committed that this capital will be made available by the Government. SpecialInvestmentSharesandGovernmentCapitalInvestment At our Special General Meeting in December 2009, changes in EBS’s Rules were endorsed to allow the Minister for Finance to provide capital to the Society. Recapitalisation took place in the first half of 2010 with the issuance of €100m Special Investment Shares (SIS) and a €250m Promissory Note. A further €525m of capital was subsequently invested by way of SIS in December which brought the total Government investment at the end of 2010 to €875m. During the first half of 2010, EBS Building Society benefited from derogations from certain regulatory capital requirements granted on a temporary basis by the Central Bank. TheGroup’sregulatorycapitalcomprises: (a) Tier 1 capital, which includes Special Investment Shares and Promissory Note investments by the Irish Government, general reserve capital, innovative and non innovative Tier 1 securities which are classified as non controlling interests, deductions for goodwill and intangible assets, and other regulatory adjustments relating to items that are included in equity but are treated differently for capital adequacy purposes. (b) Tier 2 capital, which includes qualifying subordinated liabilities, revaluation reserve, collective impairment allowances and other regulatory adjustments. Within these tiers, limits are set for different components of capital. The amount of innovative Tier 1 securities cannot exceed 15% of total Tier 1 capital, qualifying Tier 2 capital cannot exceed Tier 1 capital, and qualifying term subordinated loan capital may not exceed 50% of Tier 1 capital. There also are restrictions on the amount of collective impairment allowances that may be included as part of Tier 2 capital. Banking operations are categorised as either banking book or reserve investments, and risk-weighted assets are determined according to specified requirements that seek to reflect the varying levels of risk attached to assets exposures. The Group’s policy is to maintain a strong capital base so as to maintain creditor and market confidence and to sustain future development of the business. There have been no material changes in the Group’s capital policy during the period.
Notes to the Financial Statements 31 December 2010
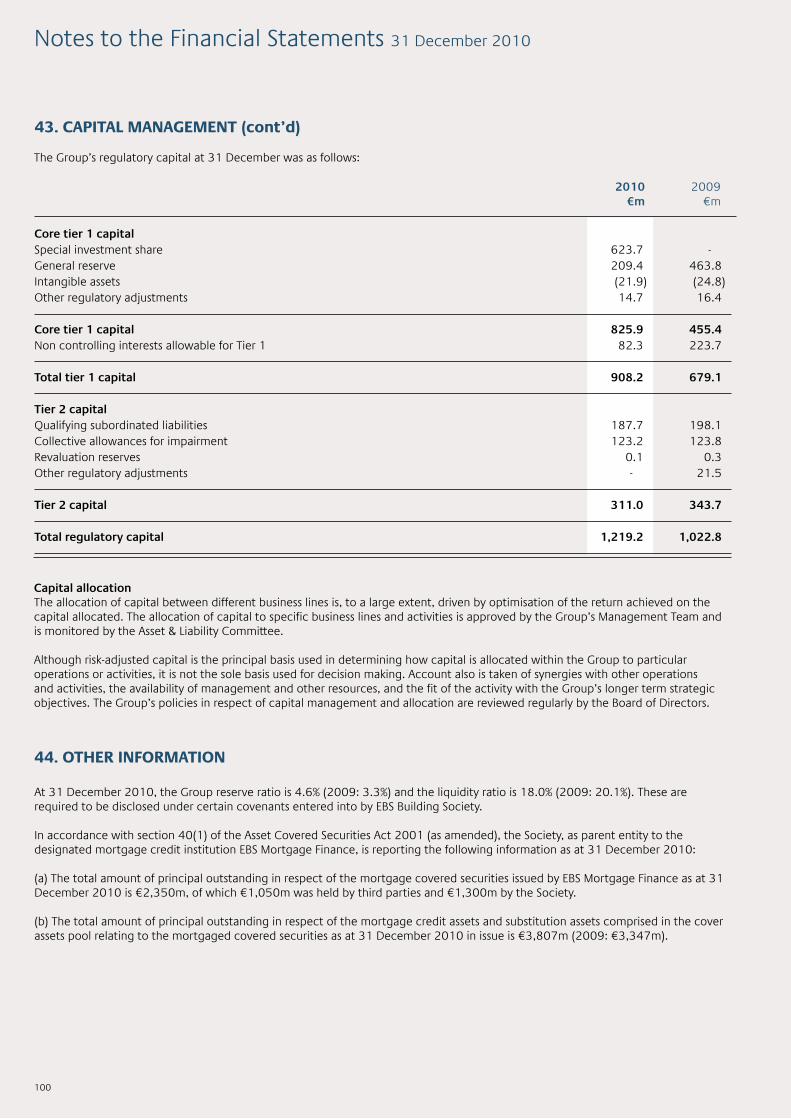
100
The Group’s regulatory capital at 31 December was as follows:
Capital allocation The allocation of capital between different business lines is, to a large extent, driven by optimisation of the return achieved on the capital allocated. The allocation of capital to specific business lines and activities is approved by the Group’s Management Team and is monitored by the Asset & Liability Committee. Although risk-adjusted capital is the principal basis used in determining how capital is allocated within the Group to particular operations or activities, it is not the sole basis used for decision making. Account also is taken of synergies with other operations and activities, the availability of management and other resources, and the fit of the activity with the Group’s longer term strategic objectives. The Group’s policies in respect of capital management and allocation are reviewed regularly by the Board of Directors.
Core tier 1 capital Special investment share 623.7 - General reserve 209.4 463.8 Intangible assets (21.9) (24.8) Other regulatory adjustments 14.7 16.4
Core tier 1 capital 825.9 455.4 Non controlling interests allowable for Tier 1 82.3 223.7 Total tier 1 capital 908.2 679.1 Tier 2 capital Qualifying subordinated liabilities 187.7 198.1 Collective allowances for impairment 123.2 123.8 Revaluation reserves 0.1 0.3 Other regulatory adjustments - 21.5 Tier 2 capital 311.0 343.7 Total regulatory capital 1,219.2 1,022.8
2010 2009 €m €m
44. OTHER INFORMATION At 31 December 2010, the Group reserve ratio is 4.6% (2009: 3.3%) and the liquidity ratio is 18.0% (2009: 20.1%). These are required to be disclosed under certain covenants entered into by EBS Building Society. In accordance with section 40(1) of the Asset Covered Securities Act 2001 (as amended), the Society, as parent entity to the designated mortgage credit institution EBS Mortgage Finance, is reporting the following information as at 31 December 2010:
(a) The total amount of principal outstanding in respect of the mortgage covered securities issued by EBS Mortgage Finance as at 31 December 2010 is €2,350m, of which €1,050m was held by third parties and €1,300m by the Society.
(b) The total amount of principal outstanding in respect of the mortgage credit assets and substitution assets comprised in the cover assets pool relating to the mortgaged covered securities as at 31 December 2010 in issue is €3,807m (2009: €3,347m).
43. CAPITAL MANAGEMENT (cont’d)
Notes to the Financial Statements 31 December 2010

101
On the Society and Group income statement, amounts reported for the prior year have been reclassified in relation to interest income and interest expense. This affects the income statement only and total net interest income does not change. There is no impact on the opening statement of financial position and, as a result, a restated statement of financial position was not required.
47. APPROVAL OF FINANCIAL STATEMENTS The financial statements were authorised for issue by the Board of Directors on 15 April 2011.
45. EVENTS SINCE THE REPORTING DATE There have been no material events since the reporting date which require disclosure or adjustment to the 31 December 2010 financial statements. PCAR/PLAR In January 2011, the Central Bank initiated a Financial Measures Programme, which incorporated the PCAR and PLAR exercises. The PCAR exercise enabled the Central Bank to perform a thorough and conservative assessment of Banks’ asset quality and earnings together with incorporating incremental three year projected provisions estimates based on Blackrock identified stress loan losses. An additional element of conservatism was also applied through the requirement to achieve a 10.5% Core Tier 1 capital ratio under Base and a 6% Core Tier 1 ratio under Stress as well as an additional protective buffer. It was announced on 31 March 2011 that EBS requires €1.2bn of capital to meet the new target Core Tier 1 capital ratio of 10.5% under Base and 6% under Stress on the basis of the combined results of the PCAR assumptions and three year projected provisions estimates from Blackrock, before the addition of a conservative capital buffer. The additional capital buffer of €0.3bn was determined with €0.1bn representing equity and €0.2bn representing contingent capital. This brings the total capital requirement for EBS under the PCAR to €1.5bn. On 31 March 2011, the Minister for Finance confirmed that the banks will be recapitalised to the levels required under the PCAR, including where appropriate burden sharing with subordinated bondholders. The Central Bank has indicated that capital must be raised by 31 July 2011.
The PLAR exercise outlines the measures to be implemented to steadily deleverage the banking system and reduce reliance on the funding from Monetary Authorities. The PLAR exercise established a target funding and loan to deposit ratio for the aggregate domestic banking system, including EBS, of 122.5% and consequently in order to reach the targeted ratio EBS is required to deleverage €2.5bn of non-core assets (comprising our commercial and buy-to-let books) over the period to 2013. Sale process EBS was engaged in a sale process throughout 2010 as part of the EU restructuring plan. It was confirmed by the National Treasury Management Agency on 30 March 2011 that the sale process was terminated following a decision by the Minister for Finance. On 31 March 2011, the Minster for Finance announced the future banking landscape in Ireland and its intention to combine the operations of EBS and AIB to build a second pillar bank in Ireland from the strengths of both institutions. NAMA The tranche of assets was transferred to NAMA in December 2010 on an accelerated sale basis. It is NAMA’s intention to complete a due diligence exercise in 2011. To date,19 of the 98 obligors that transferred to NAMA in December 2010 have been reviewed and no material additional discounts have been applied by NAMA in respect of these cases. The remaining obligors will be reviewed over the coming months. We cannot reliably estimate what, if any, additional discounts will be applied but based on the outcome to date we do not expect any material additional discounts. A further transfer of loans with a nominal amount of €65.6m is expected to be completed in 2011. Subordinatedliabilities In February 2011, the Society completed a liability management exercise to repurchase subordinated liabilities at a discount. The average take up was 69.6%, resulting in a gain of €106.4m in 2011. Non controlling interests In February 2011, the Group completed a further repurchase of capital securities at a discount. The average take up rate was 45%, resulting in a gain of €29.5m being recognised in general reserves with a reduction of €38.1m in non controlling interests.
46. RECLASSIFICATIONS
Interest income 889.7 836.6 0.9 1.3 888.8 835.3 Interest expense (784.4) (681.7) (0.9) (1.3) (783.5) (680.4)
Net interest income 105.3 154.9 - - 105.3 154.9
AdjustmentAs previously reported Restated
Society Group 2009 2009 €m €m
Society Group 2009 2009 €m €m
Society Group 2009 2009 €m €m
Notes to the Financial Statements 31 December 2010

Notes


Where Family Counts
EBS Building Society is regulated by the Central Bank of Ireland Chief Office: The EBS Building, 2 Burlington Road,Dublin 4. Registered No.139