EBOS Group Annual Reportreportingnz.org/wp-content/uploads/2018/07/3-EBOS-Group-Limited-AR.pdf ·...
94
Annual Report EBOS Group
Transcript of EBOS Group Annual Reportreportingnz.org/wp-content/uploads/2018/07/3-EBOS-Group-Limited-AR.pdf ·...

EBO
S Group Lim
ited | Annual Report 2017
1
Annual ReportEBOS Group

2
EBOS has reinforced its position through an unwavering commitment to the provision of high quality healthcare and animal care

EBO
S Group Lim
ited | Annual Report 2017
3
05Introduction
06Summary of Results
08EBOS Group Overview
12CEO and Chairman’s Report
142017 Highlights
18Community Snapshot
20Board of Directors
22Financial Summary
24Financial Report
26Independent Auditor’s Report
31Financial Statements
81Corporate Governance
88Directors’ Interests
89Directors’ Disclosures
93Directory
Contents

4
The Group is in a sound financial position and we intend to capitalise on this to deliver further strong returns for shareholders

EBO
S Group Lim
ited | Annual Report 2017
5
EBOS Group has reinforced its position as the largest Australasian marketer, wholesaler and distributor of healthcare, medical, pharmaceutical and animal care products through an unwavering commitment to the provision of high quality healthcare and animal care.
The Group has embarked on a series of major investments and acquisitions designed to strengthen the core of our business and provide the platform for future growth.
EBOS has for a number of years committed to a major capital investment program driven by the need to ensure our principal distribution facilities can satisfy all of our customers’ needs.
This has seen the Group invest in leading warehouse automation technologies. This investment is a further demonstration of our commitment to the industry in both New Zealand and Australia.
EBOS plays an integral part in the supply of medicines to our communities and it’s this responsibility which drives us forward every day.
EBOS has completed a number of acquisitions this year and we will continue to seek out investment opportunities that complement our existing businesses. The Group is in a sound financial position and we intend to capitalise on this to deliver further strong returns for shareholders.
We trust you enjoy reading this year’s Annual Report and we look forward to continuing the EBOS journey in future years.
Introduction

6
Summary of Results
+ $7.6 billion revenue +7.4% increase
+ $234.4 million EBITDA +4.0% increase
+ $133.3 million net profit after tax +4.9% increase
+ 87.8 cents earnings per share +4.5% increase
+ 63.0 cents total dividends per share +7.7% increase
All figures are in New Zealand Dollars, unless otherwise stated.
FINANCIAL HIGHLIGHTS FIVE YEAR REVENUE TRENDFor the year ended 30 June ($millions)
6,0682015
7,1012016
7,6262017
5,7572014
1,8222013
FIVE YEAR EBITDA TRENDFor the year ended 30 June ($millions)
196.72015
225.52016
234.42017
175.42014
57.02013
133.32017
FIVE YEAR NPAT TREND (attributable to shareholders)For the year ended 30 June ($millions)
105.9
127.0
92.1
28.2
2015
2016
2014
2013
UNDERLYING RESULTS1 AT 30 JUNE 2017
$241.4 million
$138.6 million
91.3 cents
EBITDA
Net profit after tax
Earnings per share
+7.1%
+9.1%
+8.7%
Growth
Growth
Growth
1 Underlying results exclude $7.0 million of transaction costs ($5.3 million after tax and non-controlling interests) incurred on acquisitions undertaken in FY17.

EBO
S Group Lim
ited | Annual Report 2017
7
Contract Logistics
Institutional Healthcare
Pharmacy (Wholesale and Retail)
8%
21%
50%
SEGMENT AND DIVISIONAL EARNINGS OVERVIEW
Animal Care
Consumer Products
15%
6%
HEALTHCARE 85%ANIMAL CARE 15%
Data based on gross operating revenue, which comprises revenue less cost of sales and write down of inventory.
Animal Care
Healthcare
52 locations in Australia and New Zealand

8
COMMUNITY PHARMACY CONSUMER PRODUCTS
Healthcare
EBOS Group Overview

EBO
S Group Lim
ited | Annual Report 2017
9
INSTITUTIONAL HEALTHCARE CONTRACT LOGISTICS VETERINARY AND PET CARE
Healthcare Animal Care

10
COMMUNITY PHARMACY
Delivering pharmaceutical and over-the-counter medicines to thousands of pharmacies across Australia and New Zealand, EBOS’ wholesale businesses play a critical role in the provision of healthcare across both countries.
The Group’s commitment to the pharmacy industry also extends well beyond the supply chain. With branded franchise systems, retail support programs, medication management solutions for community pharmacy patients and retail pharmacy management software solutions, EBOS provides the building blocks for community pharmacy.
CONSUMER PRODUCTS
Endeavour Consumer Health, EBOS’ consumer products division, is responsible for bringing high-quality, cost-effective products to market. We are the proud owners of a number of quality brands including Red Seal and Faulding, and in 2017 we acquired the Australian distribution rights to the popular Floradix product line.

EBO
S Group Lim
ited | Annual Report 2017
11
INSTITUTIONAL HEALTHCARE
EBOS plays a key role in the Australasian institutional healthcare market. Our businesses supply a range of products and services to public and private hospitals, doctors’ surgeries and aged care facilities. Following the acquisition of HPS in June 2017, EBOS Group is now the leading provider of outsourced pharmacy services to Australian hospitals.
CONTRACT LOGISTICS
EBOS’ contract logistics businesses offer a wide menu of services to pharmaceutical manufacturers, medical device suppliers and consumer healthcare companies in Australia and New Zealand. These services include warehousing, distribution and logistics support. This division also offers a range of specialised logistics services for the clinical research industry, minimising risks and delivering trials with precision and efficiency.
VETERINARY AND PET CARE
The veterinary and pet care business provides sales, marketing, wholesale and distribution support to pet retailers, veterinarians and grocery stores across Australasia. It also holds a retail presence in New Zealand and is responsible for some of the most trusted brands in pet care, including leading grocery and premium pet food brands Vitapet and Black Hawk.

12
The 2016/17 financial year was another successful period for EBOS Group. Key strategic acquisitions coupled with an ongoing focus on investment in our core businesses has further strengthened our Group’s position across Australia and New Zealand.
Our Healthcare and Animal Care businesses in Australia and New Zealand are performing well and we continue to benefit from an increasingly diversified portfolio of businesses.
The Group has in recent years committed to a major capital investment program involving new distribution centres to cater for the growth in our Healthcare and Animal Care businesses.
In 2018, our Symbion business will bring on stream two major projects in Brisbane and Sydney which combined, involve a capital spend commitment of approximately $73 million.
FINANCIAL RESULTS
EBOS Group’s financial results saw substantial revenue growth across both Healthcare and Animal Care segments, highlighting the strength and organic growth of our existing businesses and the contributions of key strategic acquisitions to the Group.
Healthcare revenue rose by 7.7% to $7.2 billion and Animal Care improved by 2.0% to $423.2 million, resulting in overall Group revenues increasing by 7.4% to $7.6 billion.
Net Profit after Tax attributable to shareholders increased by 4.9% to $133.3 million. Underlying Net Profit after Tax (excluding one-off costs incurred on completing acquisitions undertaken in FY17) increased by 9.1% to $138.6 million, while underlying earnings per share grew by 8.7% to 91.3 cents per share.
Reported growth rates were negatively impacted by a stronger NZD/AUD exchange rate for the financial year.
Our profit performance has allowed us to deliver another increase in dividends to shareholders. Directors have declared a final dividend of 33.0 cents per share, taking full year dividends to 63 cents per share, an increase of 7.7% on the prior year.
These are just a few highlights from the full report but demonstrate the ongoing performance across all our business units.
CEO and Chairman’s Report
01 PATRICK DAVIES Chief Executive Officer
02 MARK WALLER Chairman
01
02
...we continue to benefit from an increasingly diversified portfolio of businesses.

EBO
S Group Lim
ited | Annual Report 2017
13
HEALTHCARE
Healthcare remains the core of EBOS Group and once again performed strongly this past financial year, generating a combined revenue of $7.2 billion and a 7.1% increase in EBITDA to $208.8 million.
Australian revenue growth was driven by the ongoing sale of hepatitis C medicines, while key investments including the Terry White Group (TWG), contributed to revenue growth through an increasingly diversified portfolio of business.
Despite the ongoing impact of the Australian Government’s Pharmaceutical Benefits Scheme (PBS) reforms and lower levels of activity in the non-prescription over-the-counter (OTC) channel, our Healthcare business continues to perform strongly through a combination of multiple revenue streams and improved productivity generating cost efficiencies.
Our New Zealand business continues to deliver solid results, increasing revenue by 2.4% and EBITDA by 10.8% with Red Seal consumer products recording strong growth. We are focused on driving Red Seal’s growth into new export markets, including South Korea and Japan.
EBOS Group is positioned for further growth in Australia’s hospital supply chain following the success of the first twelve months of our Onelink agreement with NSW Health. This agreement provides NSW Health with warehousing and distribution of medical consumables to all of the state’s public hospitals and is a strong example of how EBOS can work with governments to deliver high levels of service to healthcare markets.
ANIMAL CARE
EBOS Group’s Animal Care segment continues to perform well with our Black Hawk and Vitapet brands delivering strong revenue growth. The Animal Care business recorded 2.0% revenue growth and 5.7% EBITDA growth over the year.
Black Hawk has had another exceptional year and is an example of EBOS’ ability to accelerate the growth of a business using the Group’s distribution network, market knowledge and financial resources. In 2017, Black Hawk launched its premium grain-free product range, which assisted in driving significant sales growth in the Australian market.
Vitapet continues to perform strongly in both the Australian and New Zealand markets, achieving revenue growth well above the market average through new product development and wider distribution.
EBOS Group’s 50% owned Animates business also performed very well recording 15.9% sales growth thanks to further network expansion with 7 new retail stores and 8 veterinary clinics opened during the year. The business now operates 39 retail stores and 16 veterinary clinics in New Zealand.
ACQUISITIONS
In June 2017, EBOS Group acquired HPS, Australia’s largest provider of outsourced pharmacy services to hospitals. The $162.8 million acquisition is complementary to the Group’s existing hospital business and is evidence of our commitment to this important market channel.
HPS provides outsourced pharmacy services to over 100 sites, employing 580 staff and has contracts with several key private hospital groups, correctional facilities, oncology and fertility clinics.
The acquisition will see the Group take market leadership in pharmacy services to hospitals and provides the platform for further revenue growth across HPS’ extensive network of clients.
EBOS Group acquired a majority shareholding in TWG on 31 October 2016. As an outcome of the acquisition, we merged TWG with our Chemmart business to create one of Australia’s largest retail pharmacy networks.
OUR FUTURE
Our growth has not been possible without the efforts and commitment of our employees who continue to service our customers’ needs every day. We are confident that the Group is well positioned for future growth and we will continue to explore new opportunities in our key markets and seek to reward our shareholders with increased returns.

14
2017 Highlights
TERRYWHITE CHEMMART
TerryWhite Chemmart is one of Australia’s largest retail pharmacy networks.
The merger between Chemmart and Terry White Group was completed in October 2016.
As Australian pharmacy market dynamics shift rapidly, the size and scope of TerryWhite Chemmart allows for stronger marketing cut-through, improved service levels and a focus on value for money health services.
New TerryWhite Chemmart branding is being rolled out across the store network.
Major investments in 2017

EBO
S Group Lim
ited | Annual Report 2017
15
HPS
EBOS Group added to its Institutional Healthcare business in June 2017 following the $162.8 million acquisition of HPS, Australia’s largest provider of outsourced pharmacy services to hospitals.
HPS has over 40 years’ experience in providing health services and maintains a vision to provide the highest quality pharmacy care to clients, patients and the wider community.
Employing 580 staff across more than 100 sites around Australia, HPS offers tailored and responsive solutions to its clients and holds several key contracts with private hospital groups and state government departments.
HPS complements and extends the Group’s expanding hospital business revenue streams and allows for further supply chain integration and superior service delivery through EBOS’ extensive distribution network.
15EB
OS G
roup Limited | Annual R
eport 2017

1616
BLACK HAWK
ANIMAL CARE
Australia’s leading premium natural pet food brand Black Hawk recently announced its expansion into the New Zealand market.
Following six months of hard work from all members of the Masterpet business, the range of Black Hawk premium pet food products became available in New Zealand from July 2017, with over 120 retailers confirming distribution.
To coincide with the launch of Black Hawk into the New Zealand market, the Company has commissioned an extensive advertising campaign across both markets aimed at building brand awareness and encouraging pet owners to join ‘the real food movement’ for pets.

EBO
S Group Lim
ited | Annual Report 2017
17
ZEST
SPECIALTY PHARMACY
ZEST represents EBOS’ commitment to providing end-to-end healthcare solutions in the Australian market. ZEST plays a critical role in the delivery of integrated programs across the country.
Through partnerships with multinational pharmaceutical manufacturers, ZEST provides patient support programs and market access programs, assisting patients with their medication adherence in often complex and chronic cases. ZEST also provides consulting support to align policy and strategy with patient needs and healthcare services.
ZEST continues to expand the breadth of its services through technology innovation and data integration, and is also expanding its relationship with community pharmacy through its ‘ZEST Connect’ program to further enhance services and patient outcomes.
ZEST is well placed as the Australian government increases funding of and access to new generation biological-based pharmaceuticals through the Pharmaceutical Benefits Scheme. This emerging ‘specialty pharmaceutical market’ will require increased patient services from community pharmacy and integrated data solutions. The Group is well positioned to provide solutions for these changing market requirements.
SYMBION
CAPITAL EXPENDITURE PROGRAM SYMBION WHOLESALE
Symbion continues to invest in the core of its business. Through the development of new facilities and a focus on automation we are increasing efficiencies in service delivery for customers.
Construction has commenced on a new distribution centre in Brisbane, Queensland. The new site represents a $58 million investment and will feature state-of-the-art automated picking, distribution and storage technologies, facilitating our continued growth.
CONTRACT LOGISTICS
The rapid growth of our Contract Logistics business requires us to commit further capital to take advantage of future growth opportunities.
An expansionary project in 2018 will see the opening of a substantial new facility in Sydney that will house contract logistics, clinical trials and secondary packaging.
This project underlines the Group’s commitment to providing quality logistics solutions to the Australian healthcare market.
An artist’s impression of Symbion’s yet to be constructed facility in Brisbane, QLD
18
Community Snapshot
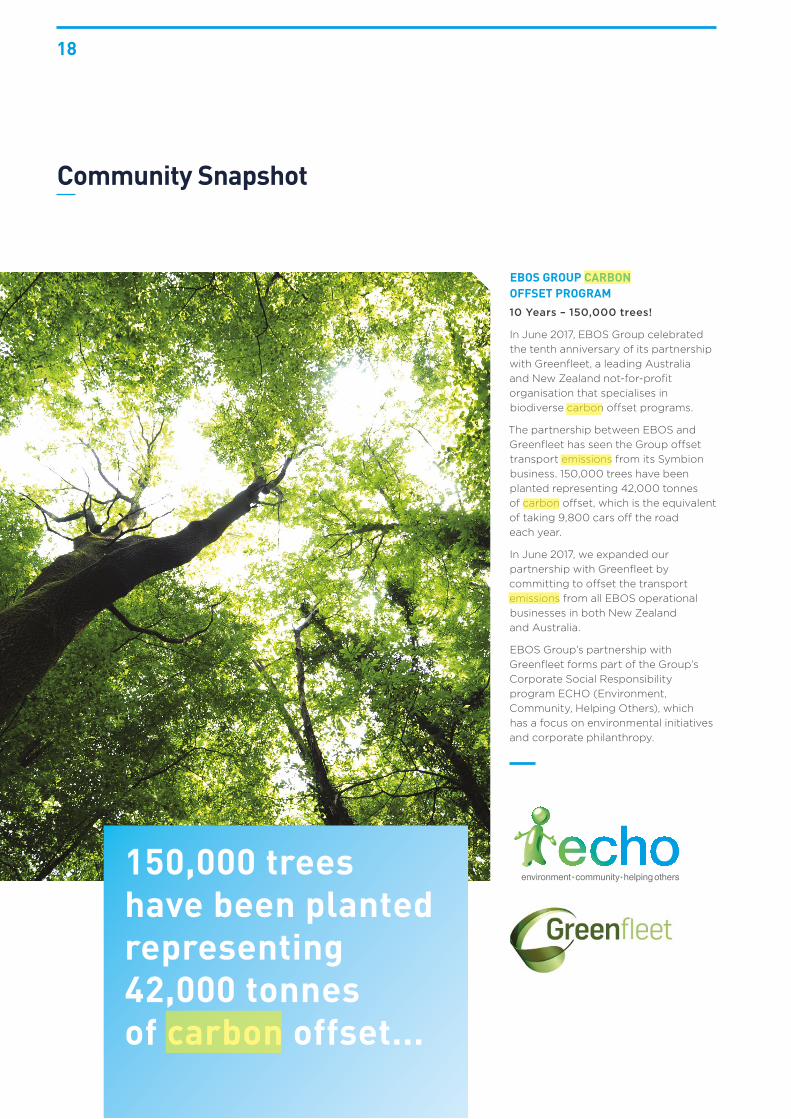
EBOS GROUP CARBON OFFSET PROGRAM
10 Years – 150,000 trees!
In June 2017, EBOS Group celebrated the tenth anniversary of its partnership with Greenfleet, a leading Australia and New Zealand not-for-profit organisation that specialises in biodiverse carbon offset programs.
The partnership between EBOS and Greenfleet has seen the Group offset transport emissions from its Symbion business. 150,000 trees have been planted representing 42,000 tonnes of carbon offset, which is the equivalent of taking 9,800 cars off the road each year.
In June 2017, we expanded our partnership with Greenfleet by committing to offset the transport emissions from all EBOS operational businesses in both New Zealand and Australia.
EBOS Group’s partnership with Greenfleet forms part of the Group’s Corporate Social Responsibility program ECHO (Environment, Community, Helping Others), which has a focus on environmental initiatives and corporate philanthropy.
150,000 trees have been planted representing 42,000 tonnes of carbon offset...
admin
Redact
admin
Redact
admin
Redact
admin
Redact
admin
Redact
admin
Redact

EBO
S Group Lim
ited | Annual Report 2017
19
REX AYSON CHRISTCHURCH
In his 50 years with ProPharma, Rex Ayson has seen it all.
Rex joined the Company as a part-timer back in 1966 when it was known as H.F. Stevens and the Company was still handwriting labels. Evolving through the ages to utilise typewriters, IBM computers the size of a ‘small car’, and now modern PCs and mobile devices, the business has developed alongside Rex’s career.
Along the journey, Rex has relocated five times with the business and witnessed it change names from H.F. Stevens, to Steven Pharmaceuticals, Zuellig Pharma and finally ProPharma as it exists today.
Rex now runs the packing/dispatch bench during the day and ticketing at night during rush hour, and has been described as the ‘model employee’.
REX AYSON AND BRIAN MANSFIELD CELEBRATE 50 YEARS WITH EBOS GROUP
Rex Ayson with Patrick Davies, EBOS Group Chief Executive Officer, accepting his 50 Year Service award
Brian Mansfield with Patrick Davies, EBOS Group Chief Executive Officer, accepting his 50 Year Service award
BRIAN MANSFIELD PERTH
Brian Mansfield has worked across four business units within Symbion since he started with the Company in 1967.
Early in his career, Brian was a Perfumery Buyer, before moving up through the ranks firstly as an Assistant State Buyer before assuming the role of State Buyer.
In the early 1970s he was involved in the move from the FH Faulding Building in Murray Street, Perth to the Kewdale warehouse where he helped arrange stock placement.
Brian has worked in many roles during his career and has always embraced change with a positive approach to his work.

20
MARK WALLER BCOM, FACA, FNZIM Independent Chairman of Directors
Mark Waller was appointed as Chairman of the Board in October 2015 and was formerly the Chief Executive and Managing Director of EBOS Group Limited from 1987 to 30 June 2014. He is Chairman of the Remuneration Committee and is a member of the Audit and Risk Committee. He is also a director of EBOS Group Limited subsidiaries, as well as being a director of Scott Technology Limited. He was the recipient of the Leadership Award at the INFINZ Industry Awards in May 2014 and the Chief Executive of the Year Award at the Deloitte 200 Awards in 2011.
ELIZABETH COUTTS ONZM, BMS, FCA Independent Director
Elizabeth Coutts was appointed to the EBOS Group Limited Board in July 2003. She is Chairman of the Audit and Risk Committee and a member of the Remuneration Committee. She is Chair of Ports of Auckland Ltd, Urwin & Co Limited, Oceania Healthcare Ltd and Skellerup Holdings Limited, and Director of the Yellow Pages group of companies, Sanford Limited, and Tennis Auckland Region Incorporated and Member, Marsh New Zealand Advisory Board. She is President of the Institute of Directors Inc.
Elizabeth is a former Chairman of Meritec Group, Industrial Research, and Life Pharmacy Limited, former director of Air New Zealand Limited and the Health Funding Authority, former Deputy Chairman of Public Trust, former board member of Sport NZ, former member of the Pharmaceutical Management Agency (Pharmac), former Commissioner for both the Commerce and Earthquake Commissions, former external monetary policy adviser to the Governor of the Reserve Bank of New Zealand and former Chief Executive of the Caxton Group of Companies.
STUART McGREGOR BCOM, LLB, MBA
Stuart McGregor was appointed to the EBOS Group Limited Board in July 2013. He is a member of the Audit and Risk Committee. Stuart was educated at Melbourne University and the London School of Business Administration, gaining degrees in Commerce and Law. He also completed a Masters of Business Administration.
Currently Stuart is Chairman of Donaco International Ltd, an ASX listed company. He is also Chairman of Powerlift Australia Pty Ltd, C B Norwood Pty Ltd and director of Symbion Pty Ltd.
Over the last 30 years, Stuart has been Company Secretary of Carlton United Breweries, Managing Director of Cascade Brewery Company Limited in Tasmania and Managing Director of San Miguel Brewery Hong Kong Limited. In the public sector, he served as Chief of Staff to a Minister for Industry and Commerce in the Federal Government and as Chief Executive of the Tasmanian Government’s Economic Development Agency. He was formerly a director of Primelife Limited from 2001 to 2004.
Board of Directors

EBO
S Group Lim
ited | Annual Report 2017
21
SARAH OTTREY BCOM Independent Director
Sarah Ottrey was appointed to the EBOS Group Limited Board in September 2006. She is a member of the Remuneration Committee. Sarah is a director of Comvita Limited, Whitestone Cheese Limited, Skyline Enterprises Limited and Sarah Ottrey Marketing Limited. She is a past board member of the Public Trust and the Smiths City Group. Sarah has held senior marketing management positions with Unilever and Heineken.
PETER WILLIAMS
Peter Williams was appointed to the EBOS Group Limited Board in July 2013. Peter has been an executive of The Zuellig Group since 2000. Peter is a director of Pharma Industries Limited, C B Norwood Pty Ltd and Green Cross Health Limited. He is also a director of Cambert, a company marketing health and personal care products in South East Asia.

22
EBOS Group has delivered another year of strong financial results, with record revenue and net profit.
Group revenue increased by 7.4% to $7.6 billion, driven largely by the full twelve months’ sales of high value hepatitis C medicines in our Australian Healthcare business.
During the year we completed two major strategic acquisitions with the completion of the TerryWhite Chemmart merger in the first half, and more recently the acquisition of HPS in June 2017. As a result we incurred acquisition costs of $7.0 million ($5.3 million after tax and non-controlling interests) which negatively impacted our statutory results. Our financial performance excluding these costs is referred to in the commentary below as being measured on an ‘underlying’ basis.
Earnings before net finance costs, tax, depreciation and amortisation (EBITDA) grew by $9 million to $234.4 million representing an increase of 4%. Underlying EBITDA growth for the year was 7.1%.
Net Profit After Tax attributable to shareholders (NPAT) increased by 4.9% to $133.3 million. Underlying NPAT increased by $11.6 million or 9.1% due to the solid growth in operating earnings and lower net finance costs.
DIVISIONAL OVERVIEW
The Group recorded solid profit growth in both its Healthcare and Animal Care divisions.
HEALTHCARE
The Healthcare segment generated a 7.1% increase in EBITDA on the back of a 7.7% increase in revenue.
The Australian business recorded a 9.2% increase in revenue and a 6.1% increase in EBITDA. The majority of revenue growth was attributable to a full 12 months of hepatitis C medicine sales. Our Pharmacy and Institutional Healthcare businesses each contributed to the growth in EBITDA.
The New Zealand operations delivered another strong profit performance for the year with revenue increasing 2.4% and EBITDA increasing by 10.8%, assisted by a full 12-month contribution from our Red Seal business.
ANIMAL CARE
The Animal Care segment generated a 2% increase in revenue and a 5.7% increase in EBITDA.
The business continues to benefit from investment in its key brands, particularly Black Hawk and Vitapet. In FY17 we committed to a significant investment in advertising and marketing for our Black Hawk premium pet food and our customer base continues to expand, providing the business with increased market share. Black Hawk and Vitapet’s year on year sales growth was 48% and 8.5% respectively.
In another exciting development for the growth of our Black Hawk brand we commenced sales into the New Zealand market in July 2017.
Our Animates business, in which we hold a 50% equity interest, continues to perform strongly with our share of Net Profit After Tax increasing 23% on last year.
ACQUISITIONS COMPLETED
We completed two major strategic acquisitions during the year that we are confident will deliver future profit growth for the Group. Both acquisitions expanded the Group’s Healthcare segment and were funded from a combination of cash and debt facilities. In October 2016, we completed the merger of the Terry White and Chemmart businesses and then, in June 2017, we acquired HPS, Australia’s leading provider of outsourced pharmacy services to hospitals. The cost of all acquisitions completed during the year was $203.6 million.
Financial Summary

EBO
S Group Lim
ited | Annual Report 2017
23
OPERATING CASH FLOW AND CAPITAL EXPENDITURE
The Group recorded another year of strong operating cash flow of $143.9 million again demonstrating our disciplined focus on cash flow management.
Capital expenditure for the year was $37.6 million, of which $23 million related to construction of our new wholesale distribution centre in Brisbane, Queensland. The Group is currently undertaking two major capital expenditure projects - the Brisbane distribution centre and a warehouse for our contract logistics business in Sydney. Both sites are expected to be operational in 2018. As at 30 June 2017 the Group had spent $30 million on these projects and we expect to spend a further $42 million to complete the projects.
NET DEBT AND RETURN ON CAPITAL EMPLOYED
The Group’s net debt was $435 million at 30 June 2017 with a net debt to EBITDA ratio of 1.79x, up from 1.14x at June 2016. The increase in net debt for the year was primarily attributable to the cost of acquisitions and the Group’s capital expenditure program.
The business generated a return on capital employed of 16%, a result in line with the prior year and reflective of the Group’s focus on efficiently managing its capital base to drive improved returns for shareholders.
CURRENCY
The Group generates approximately 80% of its earnings in Australia and the higher average exchange rate (+2.4 cents to last year) used to translate our Australian dollar earnings during the year negatively impacted reported EBITDA by approximately $5.1 million.
DIVIDENDS
The Board declared a final dividend of 33 cents per share which takes full year dividends to 63 cents per share, an increase of 7.7% on the prior year and represents a dividend payout ratio of 71.8% of NPAT.
The record date for the dividend will be 29 September 2017 and the dividend will be paid on 13 October 2017.
The final dividend will be imputed to 25% for New Zealand tax resident shareholders and will be fully franked for Australian tax resident shareholders.
OUTLOOK
EBOS Group has recorded a strong financial performance in FY17 and the Company is confident of further profit growth into FY18 on an underlying, constant currency basis.
A performance update will be provided to shareholders at the Annual Meeting on 17 October 2017.

24
Financial Report
INTRODUCING THIS REPORT 37
SECTION A: EBOS PERFORMANCE
A1. Revenue and expenses 39
A2. Segment information 41
A3. Taxation 44
A4. Earnings per share 46
SECTION B: KEY JUDGEMENTS MADE
B1. Goodwill and intangibles 47
B2. Acquisition information 52
SECTION C: OPERATING ASSETS AND LIABILITIES USED BY EBOS
C1. Trade and other receivables 58
C2. Inventories 59
C3. Trade and other payables 60
SECTION D: CAPITAL ASSETS USED BY EBOS TO OPERATE OUR BUSINESS
D1. Property, plant and equipment 60
D2. Capital work in progress 61
SECTION E: HOW WE FUND THE BUSINESSE1. Share capital 62
E2. Dividends 63
E3. Borrowings 63
E4. Borrowings facility maturity profile 64
E5. Operating cash flows 65
SECTION F: EBOS GROUP STRUCTURE
F1. Subsidiaries 67
F2. Investment in associates 69
SECTION G: HOW WE MANAGE RISK
G1. Financial risk management 71
G2. Financial instruments 72
SECTION H: OTHER DISCLOSURES
H1. Contingent liabilities 75
H2. Commitments for expenditure 75
H3. Subsequent events 76
H4. Related party disclosures 76
H5. Remuneration of auditors 77
H6. Changes in financial reporting standards 78
Additional stock exchange information 79
Corporate Governance 81
Directors’ Interests 88
Directors’ Disclosures 89
Directory 93
CONTENTS
DIRECTORS’ RESPONSIBILITY STATEMENT 25
INDEPENDENT AUDITOR’S REPORT 26
FINANCIAL STATEMENTS 31
Consolidated Income Statement 31
Consolidated Statement of Comprehensive Income 32
Consolidated Balance Sheet 33
Consolidated Statement of Changes in Equity 35
Consolidated Cash Flow Statement 36
NOTES TO THE CONSOLIDATED FINANCIAL STATEMENTS 37
KEY
Key judgements and other judgements made Accounting policy
Subsequent event Explanatory note
Risks

EBO
S Group Lim
ited | Annual Report 2017
25
DIRECTORS’ RESPONSIBILITY STATEMENT
The directors of EBOS Group Limited are pleased to present to shareholders the financial statements for EBOS Group Limited and its controlled entities (together the ‘Group’) for the year to 30 June 2017.
The directors are responsible for presenting financial statements in accordance with New Zealand law and generally accepted accounting practice, which give a true and fair view of the financial position of the Group as at 30 June 2017 and the results of their operations and cash flows for the year ended on that date.
The directors consider the financial statements of the Group have been prepared using accounting policies which have been consistently applied and supported by reasonable judgements and estimates and that all relevant financial reporting and accounting standards have been followed.
The directors believe that proper accounting records have been kept which enable with reasonable accuracy, the determination of the financial position of the Group and facilitate compliance of the financial statements with the Financial Markets Conduct Act 2013.
The directors consider that they have taken adequate steps to safeguard the assets of the Group, and to prevent and detect fraud and other irregularities. Internal control procedures are also considered to be sufficient to provide reasonable assurance as to the integrity and reliability of the financial statements.
The financial statements are signed on behalf of the Board by:
MARK WALLER Chairman
ELIZABETH COUTTSDirector
23 August 2017

26
Independent Auditor’s Report to the Shareholders of EBOS Group Limited
REPORT ON THE AUDIT OF THE CONSOLIDATED FINANCIAL STATEMENTS
Opinion We have audited the consolidated financial statements of EBOS Group Limited and its subsidiaries (the “Group”), which comprise the consolidated balance sheet as at 30 June 2017, and the consolidated income statement, statement of comprehensive income, statement of changes in equity and cash flow statement for the year then ended, and notes to the consolidated financial statements, including a summary of significant accounting policies.
In our opinion, the accompanying consolidated financial statements, on pages 31 to 78, present fairly, in all material respects, the consolidated financial position of the Group as at 30 June 2017, and its consolidated financial performance and its consolidated cash flows for the year then ended in accordance with New Zealand Equivalents to International Financial Reporting Standards (“NZ IFRS”) and International Financial Reporting Standards (“IFRS”).
Basis for Opinion We conducted our audit in accordance with International Standards on Auditing (“ISAs”) and International Standards on Auditing (New Zealand) (“ISAs (NZ)”). Our responsibilities under those standards are further described in the Auditor’s Responsibilities for the Audit of the Consolidated Financial Statements section of our report.
We believe that the audit evidence we have obtained is sufficient and appropriate to provide a basis for our opinion.
We are independent of the Group in accordance with Professional and Ethical Standard 1 (Revised) Code of Ethics for Assurance Practitioners issued by the New Zealand Auditing and Assurance Standards Board and the International Ethics Standards Board for Accountants’ Code of Ethics for Professional Accountants, and we have fulfilled our other ethical responsibilities in accordance with these requirements.
Our firm carries out other assignments for the Group in the area of due diligence, advisory services and information technology services. These services have not impaired our independence as auditor of the Company and Group. In addition to this, partners and employees of our firm deal with the Company and its subsidiaries on normal terms within the ordinary course of trading activities of the business of the Company and its subsidiaries. The firm has no other relationship with, or interest in, the Company or any of its subsidiaries.
Audit Materiality We consider materiality primarily in terms of the magnitude of misstatement in the financial statements of the Group that in our judgement would make it probable that the economic decisions of a reasonably knowledgeable person would be changed or influenced (the ‘quantitative’ materiality). In addition, we also assess whether other matters that come to our attention during the audit would in our judgement change or influence the decisions of such a person (the ‘qualitative’ materiality). We use materiality both in planning the scope of our audit work and in evaluating the results of our work.
We determined materiality for the Group financial statements as a whole to be $10m.
Key Audit Matters Key audit matters are those matters that, in our professional judgement, were of most significance in our audit of the consolidated financial statements of the current period. These matters were addressed in the context of our audit of the consolidated financial statements as a whole, and in forming our opinion thereon, and we do not provide a separate opinion on these matters.

EBO
S Group Lim
ited | Annual Report 2017
27
Key audit matter How our audit addressed the key audit matter
Goodwill and Intangible Asset Impairment Assessment
The Group has $1,000m of goodwill and $116m of indefinite life intangible assets, including $99m of brands and franchise network asset, on the balance sheet at 30 June 2017 as detailed in notes B1 and B2 to the financial statements. Included within goodwill and detailed in note B2 is $130m of goodwill relating to the Alchemy Holdings Pty Limited (‘HPS’) acquisition and $27m of goodwill relating to the Terry White Group acquisition.
The carrying values of goodwill and indefinite life intangible assets are dependent on the future cash flows expected to be generated by the underlying businesses, and there is a risk if these cash flows do not meet the Group’s expectations that the assets may be impaired.
The Group tests goodwill and indefinite life intangible assets for impairment at least annually by determining the recoverable amount (the higher of value-in-use or fair value less costs to sell) of the individual assets where possible, or otherwise the cash-generating units (CGUs) to which the assets belong and comparing the recoverable amounts of the assets to their carrying values.
The impairment calculations prepared by the Group contain a number of significant assumptions. Changes in these assumptions might lead to a change in the carrying value of indefinite life intangible assets and goodwill.
The Group has calculated the recoverable amount of brands using the relief from royalty method described below under ‘Acquisition Accounting’. The Group has calculated the recoverable amount of each CGU or group of CGUs to which goodwill has been allocated based on value-in-use models. The key assumptions applied in the value-in-use models are:
• annual revenue and expense growth rates for the 5 year forecast period;
• pre-tax discount rates; and
• terminal growth rates.
We included the impairment assessments of goodwill and indefinite life intangible assets as a key audit matter due to the significance of the balances to the financial statements and the level of judgement applied by the Group in determining the key assumptions used to determine the recoverable amounts.
We considered whether the Group’s methodology for assessing impairment is compliant with NZ IAS 36: Impairment of Assets. We focused on testing and challenging the suitability of the models and reasonableness of the assumptions used by the Group in conducting their impairment reviews.
Our procedures included:
• Agreeing a sample of future cash flows to Board approved forecasts (and in the case of HPS to management projections).
• Challenging the reliability of the Group’s forecasts by comparing historical forecasts to actual results of the underlying businesses (where applicable).
• Assessing the reasonableness of key assumptions and changes to them from previous years.
• We used our internal valuation specialist to assist with evaluating the models and challenging the Group’s key assumptions. The procedures of the specialist included:
- evaluating the appropriateness of the valuation methodology;
- testing the mathematical integrity of the models;
- evaluating the Group’s determination of the pre-tax discount rates and royalty rates used in the models through consideration of the relevant risk factors for each CGU, the cost of capital for the Group, and market data on comparable businesses; and
- comparing the long-term growth rates to market data for the industry sectors.
• We evaluated the sensitivity analysis performed by management to consider the extent to which a change in one or more of the key assumptions could give rise to impairment in the goodwill and indefinite life intangible assets.
We considered the adequacy of the Group’s disclosures in respect of impairment testing.

28
Key audit matter How our audit addressed the key audit matter
Acquisition Accounting
During the year, the Group has made a number of acquisitions including the Terry White Group in Australia and HPS in Australia.
Terry White Group
As detailed in note B2 during the year the Group completed the acquisition of a controlling interest in Terry White Group. EBOS Group transferred its Chemmart business assets, investment in VIM Health Pty Limited, and cash of $19m to the acquiree, in return for a controlling equity interest in TWG. The acquisition resulted in the recognition of indefinite life intangible assets, comprising brands and franchise network contract of $25m and $27m of goodwill.
New Zealand accounting standards require the purchaser to identify the assets and liabilities acquired, including identifiable intangible assets, and to measure them at fair value at the date of acquisition.
The Terry White brand has been valued using the relief from royalty method. The key assumptions applied in the model were:
• annual revenue growth rates;
• pre-tax discount rate;
• royalty rate; and
• terminal growth rate.
The franchise network asset has been valued using the multiple-period excess earnings method. The key assumptions applied in the model were:
• annual revenue and expense growth rates;
• discount rate;
• contributory asset charge; and
• terminal growth rate.
We included the identification and valuation of intangible assets for the Terry White acquisition as a key audit matter because there is significant judgement involved in identifying the intangible assets acquired and determining the appropriate methodology and key assumptions to calculate their fair value.
Terry White Group
Our procedures included:
We obtained the sale and purchase agreements and related documents to corroborate the assets and liabilities acquired, focusing on the identification and measurement of intangible assets.
Utilising industry knowledge to assess the Group’s identification of intangible assets and consider what is represented by residual goodwill.
Comparing the forecast sales to Board approved forecasts.
Challenging the reliability of the revenue and expense growth rates by comparing the forecasts underlying the growth rates to historical forecasts and actual results of the underlying businesses.
We used our internal valuation specialist to assess the appropriateness of the nature and valuation of the intangible assets identified by the Group. This assessment included:
• evaluating the appropriateness of the valuation methodology and testing the mechanics of the model;
• evaluating the pre-tax discount rate applied in the model through comparison to the cost of equity funding for the business and to external market data; and
• comparing the Group’s assumed royalty rate and contributory asset charge to market data for similar intangible assets and independently developing an expected royalty rate and contributory asset charge based on the profitability of the brand/relationship.
We also considered the adequacy of the Group’s disclosure relating to the acquisition.

EBO
S Group Lim
ited | Annual Report 2017
29
Key audit matter How our audit addressed the key audit matter
Acquisition Accounting
HPS
During the year, as detailed in note B2, the Group completed the acquisition of HPS for a purchase price of $163m. As at 30 June 2017, due to the timing of the acquisition, the acquisition balance sheet has been determined on a provisional basis. The acquisition has created goodwill of $130m.
Under NZ IFRS, the fair values of the acquired assets and liabilities are provisional and can be revised within the measurement period of one year from the date of acquisition.
We have included the acquisition of HPS as a key audit matter due to the significance of the associated goodwill to the financial statements.
HPS
We obtained the sale and purchase agreements and related documents to corroborate the assets and liabilities acquired.
We confirmed the fair value of the consideration paid and deferred consideration to cash transactions and the sale and purchase agreement.
We considered the appropriateness of the provisional accounting for the acquisition balance sheet of HPS.
We considered the judgements applied by the Group in determining whether there was any impairment of goodwill arising from this acquisition above under Goodwill and Indefinite Life Intangible Asset Impairment Assessment.

30
Other Information The directors are responsible on behalf of the Group for the other information. The other information comprises the information in the Annual Report that accompanies the consolidated financial statements and the audit report.
Our opinion on the consolidated financial statements does not cover the other information and we do not express any form of assurance conclusion thereon.
Our responsibility is to read the other information and consider whether it is materially inconsistent with the consolidated financial statements or our knowledge obtained in the audit or otherwise appears to be materially misstated. If so, we are required to report that fact. We have nothing to report in this regard.
Board of Directors’ Responsibilities for the Consolidated Financial Statements
The directors are responsible on behalf of the Group for the preparation and fair presentation of the consolidated financial statements in accordance with NZ IFRS and IFRS, and for such internal control as the directors determine is necessary to enable the preparation of consolidated financial statements that are free from material misstatement, whether due to fraud or error.
In preparing the consolidated financial statements, the directors are responsible on behalf of the Group for assessing the Group’s ability to continue as a going concern, disclosing, as applicable, matters related to going concern and using the going concern basis of accounting unless the directors either intend to liquidate the Group or to cease operations, or have no realistic alternative but to do so.
Auditor’s Responsibilities for the Audit of the Consolidated Financial Statements
Our objectives are to obtain reasonable assurance about whether the consolidated financial statements as a whole are free from material misstatement, whether due to fraud or error, and to issue an auditor’s report that includes our opinion. Reasonable assurance is a high level of assurance, but is not a guarantee that an audit conducted in accordance with ISAs and ISAs (NZ) will always detect a material misstatement when it exists. Misstatements can arise from fraud or error and are considered material if, individually or in the aggregate, they could reasonably be expected to influence the economic decisions of users taken on the basis of these consolidated financial statements.
A further description of our responsibilities for the audit of the consolidated financial statements is located on the External Reporting Board’s website at:
https://www.xrb.govt.nz/standards-for-assurance-practitioners/auditors-responsibilities/audit-report-1
This description forms part of our auditor’s report.
Restriction on Use This report is made solely to the Company’s shareholders, as a body. Our audit has been undertaken so that we might state to the Company’s shareholders those matters we are required to state to them in an auditor’s report and for no other purpose. To the fullest extent permitted by law, we do not accept or assume responsibility to anyone other than the Company’s shareholders as a body, for our audit work, for this report, or for the opinions we have formed.
PAUL BRYDEN, PARTNER FOR DELOITTE LIMITED Christchurch, New Zealand
23 August 2017

EBO
S Group Lim
ited | Annual Report 2017
31
Consolidated Income StatementThe Consolidated Income Statement presents income earned and expenditure incurred by EBOS Group during the financial year in determining profit.
For the financial year ended 30 June 2017 Notes2017
$’0002016
$’000
Revenue A1(a) 7,625,854 7,101,455
Income from associates F2 4,062 3,823
Acquisition costs A1(b) (7,021) -
Profit before depreciation, amortisation, net finance costs and tax expense (EBITDA)
234,427
225,475
Depreciation A1(b) (13,616) (12,933)
Amortisation A1(b) (12,218) (11,757)
Profit before net finance costs and tax expense 208,593 200,785
Finance income 2,079 2,503
Finance costs (21,104) (22,573)
Profit before tax expense 189,568 180,715
Tax expense A3 (56,722) (53,718)
Profit for the year 132,846 126,997
Profit for the year attributable to:
Owners of the Company 133,279 126,997
Non-controlling interests (433) -
132,846 126,997
Earnings per share:
Basic (cents per share) A4 87.8 84.0
Diluted (cents per share) A4 87.8 84.0
Notes to the financial statements are included on pages 37 to 78.

32
Consolidated Statement of Comprehensive IncomeThe Consolidated Statement of Comprehensive Income presents gains and losses that are not recognised in the Consolidated Income Statement and instead are required to be taken directly to reserves within equity.
For the financial year ended 30 June 20172017
$’0002016
$’000
Profit for the year 132,846 126,997
Other comprehensive income
Items that may be reclassified subsequently to profit or loss:
Cashflow hedge gains/(losses) 5,675 (4,017)
Related income taxes (1,653) 1,283
Translation of foreign operations 1,947 (18,885)
Total comprehensive income net of tax 138,815 105,378
Total comprehensive income for the year is attributable to:
Owners of the Company 139,248 105,378
Non-controlling interests (433) -
138,815 105,378
Notes to the financial statements are included on pages 37 to 78.

EBO
S Group Lim
ited | Annual Report 2017
33
Notes to the financial statements are included on pages 37 to 78.
Consolidated Balance SheetThe Consolidated Balance Sheet presents a summary of the EBOS Group assets, liabilities and equity at the end of the financial year.
As at 30 June 2017 Notes2017
$’0002016
$’000
Current assets
Cash and cash equivalents 162,181 120,251
Trade and other receivables C1 1,041,849 1,320,387
Prepayments 7,834 8,234
Inventories C2 572,001 578,513
Current tax refundable 168 83
Other financial assets - derivatives G2 19 -
Total current assets 1,784,052 2,027,468
Non-current assets
Property, plant and equipment D1 115,876 97,973
Capital work in progress D2 22,923 6,494
Prepayments 9 234
Deferred tax assets A3(b) 49,263 47,043
Goodwill B1(a) 1,000,050 829,163
Indefinite life intangibles B1(b) 115,940 91,147
Finite life intangibles B1(d) 80,084 55,341
Investment in associates F2 36,455 36,778
Other financial assets 922 1,255
Total non-current assets 1,421,522 1,165,428
Total assets 3,205,574 3,192,896
Current liabilities
Trade and other payables C3 1,327,757 1,611,611
Finance leases 72 143
Bank loans E3 155,857 106,976
Current tax payable 14,209 18,203
Employee benefits 40,971 35,598
Other financial liabilities - derivatives G2 2,995 8,652
Total current liabilities 1,541,861 1,781,183

34
Non-current liabilities
Bank loans E3 440,847 260,672
Trade and other payables C3 13,837 12,926
Deferred tax liabilities A3(b) 50,783 46,120
Finance leases 103 36
Employee benefits 5,745 4,682
Total non-current liabilities 511,315 324,436
Total liabilities 2,053,176 2,105,619
Net assets 1,152,398 1,087,277
Equity
Share capital E1 888,513 888,513
Share based payments reserve 490 -
Foreign currency translation reserve (34,814) (36,761)
Retained earnings 277,912 239,578
Cashflow hedge reserve (31) (4,053)
Equity attributable to owners of the Company 1,132,070 1,087,277
Non-controlling interests 20,328 -
Total equity 1,152,398 1,087,277
As at 30 June 2017 Notes2017
$’0002016
$’000
Notes to the financial statements are included on pages 37 to 78.
Consolidated Balance Sheet (continued)

EBO
S Group Lim
ited | Annual Report 2017
35
Notes to the financial statements are included on pages 37 to 78.
Consolidated Statement of Changes in EquityThe Consolidated Statement of Changes in Equity presents the components of capital and reserves of EBOS Group and explains the movements in each component during the financial year.
For the financial year ended 30 June 2017 Notes
Share capital $’000
Share based payments
$’000
Foreign currency
translation reserve $’000
Retained earnings
$’000
Cashflow hedge
reserve $’000
Non- controlling
interests $’000
Total $’000
Balance at 1 July 2015 880,628 - (17,876) 189,595 (1,319) - 1,051,028
Profit for the year - - - 126,997 - - 126,997
Other comprehensive income for the year, net of tax - - (18,885) - (2,734) - (21,619)
Payment of dividends E2 - - - (77,014) - - (77,014)
Dividends reinvested E1 7,885 - - - - - 7,885
Balance at 30 June 2016 888,513 - (36,761) 239,578 (4,053) - 1,087,277
Balance at 1 July 2016 888,513 - (36,761) 239,578 (4,053) - 1,087,277
Profit for the year - - - 133,279 - (433) 132,846
Other comprehensive income for the year, net of tax - - 1,947 - 4,022 - 5,969
Payment of dividends E2 - - - (94,945) - - (94,945)
Arising on acquisition of subsidiaries B2 - - - - - 20,936 20,936
Share based payments - 490 - - - - 490
Effect of exchange rate fluctuations - - - - - (175) (175)
Balance at 30 June 2017 888,513 490 (34,814) 277,912 (31) 20,328 1,152,398

36
Consolidated Cash Flow StatementThe Consolidated Cash Flow Statement presents the cash generated and used by EBOS Group during the financial year.
For the financial year ended 30 June 2017 Notes2017
$’0002016
$’000
Cash flows from operating activities
Receipts from customers 7,922,392 6,536,472
Interest received 2,079 2,503
Dividends received from associates F2 913 1,113
Payments to suppliers and employees (7,694,957) (6,238,864)
Taxes paid (65,380) (54,529)
Interest paid (21,104) (22,573)
Net cash inflow from operating activities E5 143,943 224,122
Cash flows from investing activities
Sale of property, plant and equipment 150 5,209
Purchase of property, plant and equipment (13,507) (9,771)
Payments for capital work in progress (22,923) (6,494)
Payments for intangible assets (1,164) (1,354)
Acquisition of associates - (1,107)
Acquisition of subsidiaries B2 (183,228) (89,724)
Investment in other financial assets (879) (1,255)
Net cash (outflow) from investing activities (221,551) (104,496)
Cash flows from financing activities
Proceeds from issue of shares - 7,885
Proceeds from borrowings 224,456 -
Repayment of borrowings (10,357) (36,061)
Dividends paid to equity holders of parent E2 (94,945) (77,014)
Net cash inflow/(outflow) from financing activities 119,154 (105,190)
Net increase in cash held 41,546 14,436
Effect of exchange rate fluctuations on cash held 384 (3,706)
Net cash and cash equivalents at the beginning of the year 120,251 109,521
Net cash and cash equivalents at the end of the year 162,181 120,251
Notes to the financial statements are included on pages 37 to 78.

EBO
S Group Lim
ited | Annual Report 2017
37
Notes to the Consolidated Financial Statements
For the Financial Year Ended 30 June 2017
INTRODUCING THIS REPORTThe notes to the financial statements include information that is considered relevant and material to assist the reader in the understanding of the financial performance and financial position of EBOS Group.
Information is considered relevant and material if:
• the amount is significant because of its size and nature;
• it is important to assist the reader’s understanding of the results of EBOS;
• it helps to explain to the reader the changes in the business and/or operations of EBOS; or
• it relates to an aspect of operations that is important to the future performance of EBOS.
EBOS Group Limited (‘the Company’) is a profit-oriented company incorporated in New Zealand, registered under the Companies Act 1993 and dual listed on both the New Zealand Stock Exchange and the Australian Securities Exchange.
Basis of preparation
The financial statements have been prepared in accordance with Generally Accepted Accounting Practice (GAAP). They comply with New Zealand Equivalents to International Financial Reporting Standards (NZ IFRS) and other applicable reporting standards as appropriate for profit-oriented entities.
The financial statements comply with International Financial Reporting Standards (IFRS).
EBOS is a Tier 1 for-profit entity in terms of the New Zealand External Reporting Board Standard A1.
The Company is a FMC reporting entity for the purposes of the Financial Markets Conduct Act 2013, and its financial statements comply with this Act.
The financial statements have been prepared on the basis of historical cost, except for the revaluation of certain financial instruments. Cost is based on the fair value of the consideration given in exchange for assets.
The information is presented in thousands of New Zealand dollars, unless otherwise stated.
A number of changes have been made to the wording, layout and structure of these financial statements compared to the prior year in order to make the financial information disclosed more relevant for the reader of the financial statements.
Critical accounting estimates and judgements
In the process of applying the Group’s accounting policies and the application of accounting standards, EBOS has made a number of judgements and estimates. The estimates and underlying assumptions are based on historic experience and various other factors that are considered to be appropriate under the circumstances.
Therefore, there is an inherent risk that actual results may subsequently differ from the estimates made.
These estimates and underlying assumptions are reviewed on an ongoing basis. Revisions to accounting estimates are recognised in the period in which the estimate is revised if the revision affects only that period, or in the period of the revision and future periods if the revision affects both current and future periods.
Judgements and estimates that are considered material to understanding the performance of EBOS are found in the relevant notes to the financial statements. Key judgements have been made in regard to assumptions that support the impairment assessment for goodwill and indefinite life intangibles (note B1) and the identification and valuation of intangibles recognised on acquisitions (note B2).
Basis of consolidation
The EBOS Group financial statements comprise the financial statements of EBOS Group Limited, the parent company, combined with all the entities that comprise the Group, being its subsidiaries (listed in note F1) and its share of associate investments (listed in note F2). The financial statements of the members of the Group, including associates, are prepared for the same reporting period as the parent company, using consistent accounting policies.
Subsidiaries are consolidated on the date on which control is obtained to the date on which control is lost.

38
The results of subsidiaries acquired or disposed of during the year are included in the Consolidated Income Statement from the effective date of acquisition or up to the effective date of disposal, as appropriate.
All significant inter-company transactions and balances are eliminated on consolidation.
Foreign currency
Functional currency
The financial statements of each of the Group’s entities are measured using the currency of the primary economic environment in which that entity operates (‘the functional currency’).
Transactions and balances
Foreign currency transactions are translated into the functional currency using the exchange rate on the date of the transaction. At each balance sheet date, monetary assets and liabilities that are denominated in foreign currencies are translated at the rates prevailing on the balance sheet date. Non-monetary assets and liabilities that are measured in terms of historical cost in a foreign currency are not retranslated.
Exchange differences arising on the settlement of monetary items, and on the translation of monetary items, are included in the Consolidated Income Statement for the period.
Foreign operations
On consolidation, the assets and liabilities of EBOS’ overseas operations are translated at the exchange rate at the reporting date. Income and expense items are translated at the average rates for the period. Exchange differences arising are recognised in the foreign currency translation reserve (in equity) and recognised in profit or loss on disposal of the foreign operation.
Goodwill and fair value adjustments arising on the acquisition of a foreign entity are treated as assets and liabilities of the foreign entity and translated at the exchange rate at the reporting date.
Other Accounting Policies
Other accounting policies that are relevant to the reader’s understanding of the financial statements are included throughout the following notes to the financial statements.
INTRODUCING THIS REPORT continued

EBO
S Group Lim
ited | Annual Report 2017
39
A1. REVENUE AND EXPENSES
(a) Revenue
Revenue consisted of the following items:
2017 $’000
2016 $’000
Revenue from the sale of goods 7,471,918 6,989,949
Revenue from the rendering of services 153,936 111,506
7,625,854 7,101,455
RECOGNITION AND MEASUREMENT
Revenue is measured at the fair value of the consideration received or receivable and represents amounts net of any returns and discounts. Revenue is recognised when it is considered probable that the economic benefits of the transaction will be received by EBOS. The following specific recognition criteria must be met before revenue is recognised:
Sale of Goods Rendering of Services
Revenue from the sale of goods is recognised when significant risks and rewards of owning the goods are transferred to the buyer.
Revenue from services is recognised on the basis of the value of services performed to date as a percentage of the total services to be performed.
SECTION OVERVIEW
This section explains the financial performance of EBOS by:
a) displaying additional information about individual items in the Consolidated Income Statement;
b) presenting further analysis of EBOS’ operating segments by revenue and expenses; and
c) providing an analysis of the components of EBOS’ tax balances for the year and the current imputation credit account balance.
SECTION A: EBOS PERFORMANCE

40
A1. REVENUE AND EXPENSES continued
(b) Expenses
Profit before tax expense has been arrived at after charging the following expenses by nature:
2017 $’000
2016 $’000
Cost of sales (6,872,190) (6,418,523)
Write-down of inventory (8,387) (6,392)
Impairment loss on trade and other receivables (2,758) (2,423)
Depreciation of property, plant and equipment (13,616) (12,933)
Amortisation of finite life intangibles (12,218) (11,757)
Operating lease rental expenses (35,125) (30,352)
Donations (49) (101)
Employee benefit expense (245,813) (220,960)
Defined contribution plan expense (14,653) (12,635)
Loss on derivative financial instruments - (770)
Acquisition costs (7,021) -
Other expenses (209,493) (187,647)
Total expenses (7,421,323) (6,904,493)
RECOGNITION AND MEASUREMENTImpairmentEBOS reviews the recoverable amount of its tangible and intangible assets, including goodwill, at each balance date. If the carrying value of an asset exceeds the recoverable amount, an impairment expense is recognised in the income statement.
Assets are grouped at the lowest levels for which there are separately identifiable cash flows (cash generating units). The recoverable amount is the higher of an asset’s fair value less costs to sell and the present value of future cash flows expected to be generated by the asset (value in use).
Depreciation and amortisationDepreciation is provided for on a straight-line basis on all property, plant and equipment other than freehold land, at depreciation rates calculated to allocate the assets’ cost less estimated residual value, over their estimated useful lives. Refer to note D1 for the useful lives used in the calculation of depreciation.
Amortisation is charged on a straight-line basis over the estimated useful life of finite life intangibles. Refer to note B1 for the useful lives used in the calculation of amortisation.
Operating lease expensesEBOS leases certain land, buildings, plant and equipment. Operating leases are where the lessor rather than EBOS has effectively retained the substantial risk and benefit of ownership of a leased item. Operating lease payments are included in the determination of profit or loss in equal instalments over the period of the lease. Lease incentives received are recognised on a straight-line basis over the lease period.

EBO
S Group Lim
ited | Annual Report 2017
41
Employee expensesProvision is made for benefits owing to employees in respect of wages and salaries, annual leave, long service leave and employee incentives for services rendered. Provisions are recognised when it is probable they will be settled and can be measured reliably. They are carried at the remuneration rate expected to apply at the time of settlement and discounted to the present value of the expected payment to the employee at balance date.
Net Finance costsFinance costs include bank interest and amortisation of costs incurred in connection with borrowings facilities. Finance costs are expensed immediately as incurred, using the effective interest rate method, unless they relate to acquisition and development of qualifying assets, in which case finance cost is capitalised.
Interest income is recognised on a time-proportionate basis using the effective interest rate method.
Dividend incomeDividend income from investments is recognised when EBOS has the right to receive payment of the dividend.
A2. SEGMENT INFORMATION
(a) Reportable segments
EBOS’ major products and services are the same as the reportable segments, i.e. Healthcare and Animal Care, with no major products and services allocated to corporate.
(b) Segment revenues and results
The following is an analysis of EBOS’ revenue and results by reportable segment:
Revenue from external customers ($’000)
HEALTHCARE SEGMENT
Sale of healthcare products in a range of sectors, own brands, retail healthcare, pharmacy services and wholesale activities.
CORPORATE SEGMENT
Includes net funding costs and central administration expenses that have not been allocated to the Healthcare or Animal Care segments.
ANIMAL CARE SEGMENT
Sale of animal care products in a range of sectors, own brands, retail and wholesale activities.
EBOS GROUP LIMITED
2017 2016
Healthcare $7,202,68894%
Animal Care $415,0406%
Animal Care $423,1666%
Healthcare $6,686,41594%
Healthcare Animal Care

42
A2. SEGMENT INFORMATION continued
EBITDA ($’000)
Profit for the year ($’000)
Associate information:
2017 $’000
2016 $’000
Included in the segment results above is income from associates:
Animal Care 3,141 2,554
Healthcare 921 1,269
Total income from associates 4,062 3,823
Healthcare
$208,782
$44,712
($19,067)
$195,028
$42,308
($11,861)
Animal Care Corporate*
Healthcare
$133,172
$29,953($29,846)
$121,447
$27,789($22,239)
Animal Care Corporate*
20162017
20162017
*Includes $7 million of transaction costs incurred on acquisitions undertaken in 2017 (2016: nil).

EBO
S Group Lim
ited | Annual Report 2017
43
The following is an analysis of other financial information by reportable segment:
(c) Geographical information
EBOS operates in two principal geographical areas: New Zealand and Australia.
EBOS’ revenue from external customers by geographical location and information about its segment assets (non-current assets), excluding financial instruments and deferred tax assets, are detailed below:
Healthcare Animal Care Corporate
2017 $’000
2016 $’000
2017 $’000
2016 $’000
2017 $’000
2016 $’000
Depreciation (12,562) (11,691) (1,054) (1,242) - -
Amortisation of finite life intangibles (9,719) (9,283) (2,499) (2,474) - -
Net finance costs - - - - (19,025) (20,070)
Tax (expense)/benefit (53,762) (52,607) (11,206) (10,803) 8,246 9,692
Australia New Zealand Group
2017 $’000
2016 $’000
2017 $’000
2016 $’000
2017 $’000
2016 $’000
Continuing operations
Revenue from external customers 6,116,760 5,633,418 1,509,094 1,468,037 7,625,854 7,101,455
Non-current assets 1,048,967 795,436 286,837 286,171 1,335,804 1,081,607
(d) Information about major customers
No revenues from transactions that are with a single customer amount to 10% or more of EBOS’ revenues (2016: Nil).
RECOGNITION AND MEASUREMENT
The reportable segments of EBOS have been identified in accordance with NZ IFRS 8 ‘Operating Segments’.
The Group’s operating segments are identified on the basis of internal reports about components of the Group that are regularly reviewed by the chief operating decision maker in order to allocate resources to the segment and to assess its performance.
The accounting policies of EBOS have been consistently applied to the operating segments. Profit before depreciation, amortisation, net finance costs and tax expense (EBITDA) is the measure reported to the chief operating decision-maker for the purposes of resource allocation and assessment of segment performance.
Assets are not allocated to operating segments as they are not reported to the chief operating decision-maker at a segment level.

44
A3. TAXATION
(a) Tax expense recognised in Consolidated Income Statement
The tax rates used are principally the corporate tax rates of 28% (2016: 28%) payable by New Zealand and 30% (2016: 30%) payable by Australian corporate entities on taxable profits under tax law in each jurisdiction.
2017 $’000
2016 $’000
Tax expense comprises:
Current tax expense/(credit):
Current year 59,303 59,135
Adjustments for prior years (119) (598)
59,184 58,537
Deferred tax (credit): (2,832) (4,923)
Adjustments for prior years 370 104
(2,462) (4,819)
Total tax expense 56,722 53,718
The prima facie tax expense on pre-tax accounting profit from operations reconciles to the tax expense in the financial statements as follows:
Profit before tax expense 189,568 180,715
Tax expense calculated at 28% (2016: 28%) 53,079 50,600
Non-deductible expenses 1,762 225
Effect of different tax rates of subsidiaries operating in overseas jurisdictions 2,503 3,332
Under/(over) provision of tax expense in prior years 251 (494)
Other adjustments (873) 55
Total tax expense 56,722 53,718

EBO
S Group Lim
ited | Annual Report 2017
45
(b) Deferred tax assets and liabilities
Taxable and deductible temporary differences arise from the following:
(c) Imputation credit account balances
2017 $’000
2016 $’000
Gross deferred tax liabilities:
Property, plant and equipment (1,437) (3,112)
Provisions (221) (1,180)
Other financial assets – derivatives (28) -
Intangible assets (49,097) (41,828)
(50,783) (46,120)
Gross deferred tax assets:
Property, plant and equipment 9,541 7,493
Provisions 35,159 30,721
Other financial liabilities – derivatives 802 2,323
Intangible assets 3,499 6,325
Tax losses carried forward 262 181
49,263 47,043
2017 $’000
2016 $’000
Imputation credits available directly and indirectly to shareholders of the parent company:
5,885
3,542
Imputation credits allow EBOS to pass onto its shareholders the benefit of the New Zealand income tax it has paid by attaching imputation credits to the dividends it distributes, reducing shareholders’ net tax obligations.
RECOGNITION AND MEASUREMENT
Income tax expense is the income tax assessed on taxable profit for the year.
Taxable profit differs from profit before tax reported in the Consolidated Income Statement as it excludes items of income and expense that are taxable or deductible in other years (temporary differences) and also excludes items that will never be taxable or deductible (permanent differences).
Income tax expense components are current income tax and deferred tax.

46
A3. TAXATION continued
Deferred tax is income tax that is expected to be payable or recoverable in the future as a result of the unwinding of temporary differences. These arise from differences in the recognition of assets and liabilities for financial reporting and for the filing of income tax returns.
Deferred tax is recognised on all temporary differences, other than those arising:
• from goodwill;
• from the initial recognition of assets and liabilities in a transaction (other than in a business combination) that affects neither the accounting nor taxable profit or loss; and
• from investments in associates and subsidiaries where EBOS is able to control the reversal of the temporary differences and such differences are not expected to reverse in the foreseeable future.
Deferred tax is calculated at the tax rates that are expected to apply to the year when a liability is settled or an asset realised, based on tax rates and tax laws that have been enacted or substantively enacted at balance date.
A deferred tax asset is recognised to the extent it is probable that future taxable profits will be available to use the asset. This is reviewed at each balance date and reduced to the extent that it is no longer probable that sufficient taxable profits will be available in the future to utilise the deferred tax asset.
A4. EARNINGS PER SHARE
Basic earnings per share
Diluted earnings per share
2017 $’000
2016 $’000
2017 $’000
2016 $’000
Earnings used in the calculation of total earnings per share ($’000) 133,279 126,997 133,279 126,997
Weighted average number of ordinary shares for the purposes of calculating earnings per share No. (000’s) 151,768 151,131 151,768 151,131
Earnings per share Cents 87.8 84.0 87.8 84.0

EBO
S Group Lim
ited | Annual Report 2017
47
B1. GOODWILL AND INTANGIBLES
(a) Goodwill
2017 $’000
2016 $’000
Gross carrying amount
Balance at beginning of financial year 829,163 764,618
Recognised from business acquisition during the year 171,107 68,346
Effects of foreign currency exchange differences (220) (3,801)
Net book value 1,000,050 829,163
RECOGNITION AND MEASUREMENT
Goodwill arising on the acquisition of a subsidiary is recognised as an asset at the date that control is acquired (the acquisition date). Goodwill is measured as the excess of the sum of the consideration transferred, the amount of any non-controlling interest in the acquiree and the fair value of the acquirer’s previously-held equity interest (if any) in the acquiree over the fair value of the identifiable net assets recognised.
Goodwill is not amortised, but is reviewed for impairment at least annually. For the purpose of impairment testing, goodwill is allocated to each of EBOS’ cash-generating units or groups of cash-generating units expected to benefit from the synergies of the combination. Cash-generating units to which goodwill has been allocated are tested for impairment annually, or more frequently when there is an indication that the unit may be impaired. The recoverable amount is the higher of fair value less cost to sell and value in use. If the recoverable amount of the cash-generating unit is less than the carrying amount, the impairment loss is allocated first to reduce the carrying amount of any goodwill and then to the other assets of the unit on a pro-rata basis. Any impairment loss to goodwill is recognised immediately in profit or loss and is not subsequently reversed.
SECTION OVERVIEW
This section identifies the balances and transactions to which key judgements have been made by EBOS in the preparation of these financial statements. Key judgements have been in regard to the estimates for future cash flows for goodwill impairment assessment purposes, and the identification of intangible assets and recognition of goodwill for business acquisitions.
SECTION B: KEY JUDGEMENTS MADE

48
B1. GOODWILL AND INTANGIBLES continued
Indefinite life intangibles
TerryWhite Chemmart
Brands $’000
Other Pharmacy
Brands $’000
Franchise Network
$’000
Animal Care
Brands $’000
Trademarks $’000
Total $’000
Gross carrying amount
Balance at 1 July 2015 27,088 6,338 - 28,377 17,240 79,043
Acquisitions through business combinations - 16,000 - - - 16,000
Reclassifications - - - (610) - (610)
Effects of foreign currency exchange differences (1,790) (91) - (1,405) - (3,286)
Balance at 30 June 2016 25,298 22,247 - 26,362 17,240 91,147
Acquisitions through business combinations 13,034 - 11,613 - - 24,647
Effects of foreign currency exchange differences 109 8 (92) 121 - 146
Balance at 30 June 2017 38,441 22,255 11,521 26,483 17,240 115,940
RECOGNITION AND MEASUREMENT
Indefinite life intangible assets represent purchased brands, trademarks and franchise network asset that are initially recognised at fair value. These intangible assets are tested annually for impairment on the same basis as for goodwill.
JUDGEMENT: USEFUL LIVES OF INDEFINITE LIFE INTANGIBLE ASSETS
The Directors have assessed these brands, trademarks and franchise network asset as having an indefinite useful life. In coming to this conclusion, the expected expansion of these assets across other products and markets, the typical product life cycle of these assets, the stability of the industry in which the assets are operating, the level of maintenance expenditure required and the period of legal control over these assets has been considered.

EBO
S Group Lim
ited | Annual Report 2017
49
(c) Cash-generating units
The carrying amount of goodwill and indefinite life intangibles allocated to cash-generating units or groups of cash-generating units is as follows:
Goodwill Indefinite life intangibles
2017 $’000
2016 $’000
2017 $’000
2016 $’000
Healthcare Australia1 643,267 507,979 3,865 29,155
Healthcare New Zealand2 65,683 64,701 18,390 18,390
Healthcare: Pharmacy/Logistics NZ3 95,043 95,043 17,240 17,240
Healthcare: Terry White Group 4 34,367 - 49,962 -
Animal Care5 161,690 161,440 26,483 26,362
1,000,050 829,163 115,940 91,147
For the year ended 30 June 2017, the Directors have determined that there is no impairment of any of the cash-generating units containing goodwill, brands and trademarks (2016: Nil).
1 Australian Hospital, Pharmacy, Primary Healthcare sectors. 2 New Zealand Consumer, Hospital, Primary Healthcare, Aged Care and International Product Supplies. 3 New Zealand Pharmacy Wholesaler and Logistics Services. 4 Australia - Terry White Group. 5 New Zealand and Australia Animal Care.
KEY JUDGEMENT: IMPAIRMENT ASSESSMENT ASSUMPTION
The recoverable amounts of cash generating units is determined on the basis of value in use calculations. The recoverable amount calculations are most sensitive to changes in the following assumptions:
Revenue Estimated by management based on revenue achieved in the period immediately before the start of the assessment period and adjusted each year for any anticipated growth.
Operating costs Estimated by management based on current trends at the start of the assessment period and adjusted for expected changes in the business or sector in which the business operates.
Discount rates Estimated by management based on a current market assessment of the time value of money, cost of capital and risks specific to the asset to which the cash flows generated by that asset are being assessed.

50
2017 $’000
2016 $’000
Goodwill
Annual revenue growth rates 1.6% - 5.0% 1.9% - 5.9%
Allowance for increases in expenses 2.7% - 5.0% 2.8% - 5.0%
Pre-tax discount rates 12.3% - 14.3% 12.7% - 14.3%
Terminal growth rate 2.5% 2.5%
KEY ESTIMATE: VALUE IN USE CALCULATION
The value in use calculation uses cash flow projections based on financial forecasts approved by the Board and management covering a five year period, including terminal value, and management’s past experience. The following estimates were used in the value in use calculation:
KEY ESTIMATE: FAIR VALUE LESS COST TO SELL CALCULATION
The fair value of indefinite life intangibles has been calculated using the relief from royalty method. The following estimates were used:
Management have carried out a sensitivity analysis and believe that any reasonably possible change in the key assumptions would not cause the book value of any of the cash-generating units, or groups of cash-generating units, to exceed their recoverable amount.
Indefinite life intangibles
Annual revenue growth rates 2.7% - 7.0% 2.2% - 7.0%
Allowance for increases in expenses 2.4% - 4.7% 2.8% - 7.0%
Royalty rate 3.0% - 8.3% 3.0% - 8.3%
Pre-tax discount rates 12.7% - 17.9% 13.3% - 17.9%
Terminal growth rate 2.5% 2.5%
B1. GOODWILL AND INTANGIBLES continued

EBO
S Group Lim
ited | Annual Report 2017
51
(d) Finite life intangibles
Other $’000
Customer relationships/
contracts $’000
Total $’000
Gross carrying amount 8,409 82,869 91,278
Accumulated amortisation and impairment (5,322) (30,615) (35,937)
Balance at 30 June 2016 3,087 52,254 55,341
Gross carrying amount 14,215 114,403 128,618
Accumulated amortisation and impairment (6,971) (41,563) (48,534)
Balance at 30 June 2017 7,244 72,840 80,084
Aggregate amortisation recognised as an expense during the year:
2017 $’000
2016 $’000
Customer relationships and contracts 10,641 10,578
Other 1,577 1,179
12,218 11,757
RECOGNITION AND MEASUREMENT
Finite life intangible assets are recorded at cost less accumulated amortisation. Amortisation is charged on a straight-line basis over their estimated useful life.
JUDGEMENT: USEFUL LIVES OF FINITE LIFE INTANGIBLE ASSETS
In determining the estimated useful life of finite life intangible assets (of a period of between 1 to 12 years) the following characteristics have been assessed: (i) expected expansion of the usage of the assets, (ii) the typical product life cycle of these assets, (iii) the stability of the industry in which the assets are operating, and (iv) the level of maintenance expenditure required. The estimated useful life and amortisation period is reviewed at the end of each annual reporting period.

52
B1. GOODWILL AND INTANGIBLES continued
(e) Goodwill and intangibles accounting policies
ACCOUNTING POLICIES
At each balance sheet date, EBOS reviews the carrying amounts of its non-current assets to determine whether there is any indication that those assets have suffered an impairment loss. If any such indication exists, the recoverable amount of the asset is estimated in order to determine the extent of the impairment loss (if any). Where the asset does not generate cash flows that are independent from other assets, EBOS estimates the recoverable amount of the cash-generating unit to which the asset belongs.
Recoverable amount is the higher of fair value less costs to sell and value in use. In assessing value in use, the estimated future cash flows are discounted to their present value using a pre-tax discount rate that reflects current market assessments of the time value of money and the risks specific to the asset for which the estimates of future cash flows have not been adjusted.
If the recoverable amount of an asset (cash-generating unit) is estimated to be less than its carrying amount, the carrying amount of the asset (cash-generating unit) is reduced to its recoverable amount. An impairment loss is recognised as an expense immediately.
Where an impairment loss subsequently reverses, other than for goodwill, the carrying amount of the asset (cash-generating unit) is increased to the revised estimate of its recoverable amount, but only to the extent that the increased carrying amount does not exceed the carrying amount that would have been determined had no impairment loss been recognised for the asset (cash-generating unit) in prior years. A reversal of an impairment loss is recognised as income immediately. Impairment losses cannot be reversed for goodwill.
B2. ACQUISITION INFORMATION
The following material acquisitions of subsidiaries took place during the year.
Name of business acquired Principal activitiesDate of
acquisitionCost of acquisition
$’000
2017:
50.01% of the business assets of Terry White Group Healthcare October 2016 20,936
100% of the business assets of Alchemy Holdings Pty Ltd (‘HPS’) Healthcare June 2017 162,760

EBO
S Group Lim
ited | Annual Report 2017
53
In October 2016 the Group acquired the Terry White Group (‘TWG’).
EBOS Group transferred (i) its Chemmart business assets, (ii) investment in VIM Health Pty Limited, and (iii) cash of $19.1m to the acquiree, in return for a controlling equity interest in TWG (50.01%). The transaction also permitted TWG to make a $13.8m payment to the TWG shareholders that were in place immediately preceding the acquisition by EBOS.
Details of the acquisition are as follows:
Assets and liabilities acquired:
Carrying value $’000
Fair value adjustment
$’000
Fair value on acquisition
$’000
Current assets
Cash and cash equivalents 5,442 - 5,442
Trade and other receivables 9,321 (238)2 9,083
Prepayments 1,148 - 1,148
Inventories 7,596 (1,731)3 5,865
Non-current assets
Property, plant and equipment 2,930 (102)4 2,828
Deferred tax assets 1,078 1,0305 2,108
Indefinite life intangibles 1,918 22,7291 24,647
Finite life intangibles 5,280 (1,701)6 3,579
Current liabilities
Trade and other payables (11,406) (17,899)7 (29,305)
Current tax payable (1,632) - (1,632)
Employee benefits (1,914) - (1,914)
Non-current liabilities
Bank loans (14,542) (299)8 (14,841)
Trade and other payables (674) (1,078)7 (1,752)
Deferred tax liabilities (108) (5,801)5 (5,909)
Loans to related parties (1,278) - (1,278)
Employee benefits (350) - (350)
Net Assets acquired 2,809 (5,090) (2,281)

54
Carrying Value $’000
Fair value adjustment
$’000
Fair value on acquisition
$’000
Goodwill on acquisition 26,927
Less disposal of associate (3,710)
Total consideration: Non-controlling interest arising on acquisition 20,936
Net cash inflow from acquisition 5,442
KEY JUDGEMENTS: FAIR VALUE ADJUSTMENT
1. To recognise the fair values of the Terry White brand and franchise network asset as a result of a valuation performed at acquisition. The Terry White brand was valued using the relief from royalty method. Key assumptions used in the valuation of the brand were: royalty rate (2.5%), annual revenue growth rate (1.5%), pre-tax discount rate (14.9%) and terminal growth rate (1.5%). The franchise network asset identified was valued using the multiple-period excess earnings method. The key assumptions used in valuing the asset were: annual revenue growth rate (1.5%), contributory asset charge (3.1%), pre-tax discount rate (15.0%) and terminal growth rate (1.5%). Judgements made: 2. To recognise the fair value of trade and other receivables on acquisition. 3. To recognise the fair value of inventory on acquisition. 4. To recognise the fair value of property, plant and equipment on acquisition. 5. To recognise additional deferred tax asset and liability balances on acquisition. 6. To recognise the fair value of finite life intangibles on acquisition. 7. To recognise additional liabilities identified on acquisition. 8. To recognise the fair value of borrowings on acquisition.
RECOGNITION AND MEASUREMENT
Acquisition of subsidiaries and businesses are accounted for using the acquisition method.
The cost of acquisition is measured at the aggregate of the fair values, at the date of exchange, of assets given, liabilities incurred or assumed, and equity instruments issued by EBOS in exchange for control of the acquiree. Acquisition-related costs are recognised in profit or loss as incurred.
Where applicable, the cost of acquisition includes any asset or liability resulting from a contingent consideration arrangement, measured at its acquisition date fair value. Subsequent changes in such fair values are adjusted against the cost of acquisition where they qualify as measurement period adjustments. All other subsequent changes in the fair value of contingent consideration classified as an asset or liability are accounted for in accordance with relevant NZ IFRSs. Changes in the fair value of contingent consideration classified as equity are not recognised.
B2. ACQUISITION INFORMATION continued

EBO
S Group Lim
ited | Annual Report 2017
55
In June 2017 the Group acquired the business assets of Alchemy Holdings Pty Ltd (‘HPS’). Details of the acquisition are as follows:
Carrying value $’000
Fair value adjustment
$’000
Fair value on acquisition
$’000
Current assets
Cash and cash equivalents 97 - 97
Trade and other receivables 4,245 - 4,245
Prepayments 195 - 195
Inventories 305 - 305
Non-current assets
Property, plant and equipment 8,040 - 8,040
Deferred tax assets 4,119 - 4,119
Indefinite life intangibles 7 - 7
Finite life intangibles 31,989 - 31,989
Other financial assets 150 - 150
Current liabilities
Trade and other payables (5,662) - (5,662)
Current tax payable (481) - (481)
Employee benefits (3,616) - (3,616)
Goodwill arising on acquisition
Goodwill arose on the acquisition of the business operations of TWG because the cost of acquisition included a control premium paid. In addition, goodwill resulted from the consideration paid for the benefit of future expected cash flows above the current fair value of the assets acquired and the expected synergies and future market benefits expected to be obtained. These benefits are not recognised separately from goodwill as the expected future economic benefits arising cannot be reliably measured and they do not meet the definition of identifiable intangible assets.
TWG was acquired as it is a profitable healthcare business that the Group believes fits strategically with its existing Australian healthcare business assets.
Impact of the acquisition on the results of the Group for the year ended 30 June 2017
TWG contributed a profit of $1.179m to the Group profit for the year, this amount is inclusive of transaction costs incurred by TWG attributable to the acquisition. Group revenue for the year includes $84.295m in respect of TWG. Had the TWG acquisition been effective at 1 July 2016, the revenue of the Group from continuing operations would have been $7.655b and the profit for the period would have been $133.616m.

56
Subsequent to the acquisition of HPS and prior to balance date, $9.769m of the deferred consideration balance was settled. Due to the timing of the acquisition the above figures have not yet been able to be finalised and are currently considered provisional.
Goodwill arising on acquisition
Goodwill arose on the acquisition of the business operations of HPS because the cost of acquisition included a control premium paid. In addition, the consideration paid for the benefit of future expected cash flows above the current fair value of the assets acquired and the expected synergies and future market benefits expected to be obtained. These benefits are not recognised separately from goodwill as the expected future economic benefits arising cannot be reliably measured and they do not meet the definition of identifiable intangible assets.
HPS was acquired as it is a profitable healthcare business that the Group believes fits strategically with its existing Australian healthcare business assets.
Impact of the acquisition on the results of the Group for the year ended 30 June 2017
Due to the timing of the acquisition, HPS’ contribution to the Group’s revenue and profit for the year were immaterial. Had the HPS acquisition been effective at 1 July 2016, the revenue of the Group from continuing operations would have been $7.684b and the profit for the period would have been $135.221m.
Carrying value $’000
Fair value adjustment
$’000
Fair value on acquisition
$’000
Non-current liabilities
Trade and other payables (2,053) - (2,053)
Deferred tax liabilities (4,336) - (4,336)
Employee benefits (353) - (353)
Net assets acquired 32,646 - 32,646
Goodwill on acquisition 130,114
Total consideration 162,760
Less cash and cash equivalents acquired (97)
Deferred purchase consideration (13,148)
Net cash outflow on acquisition 149,515
B2. ACQUISITION INFORMATION continued
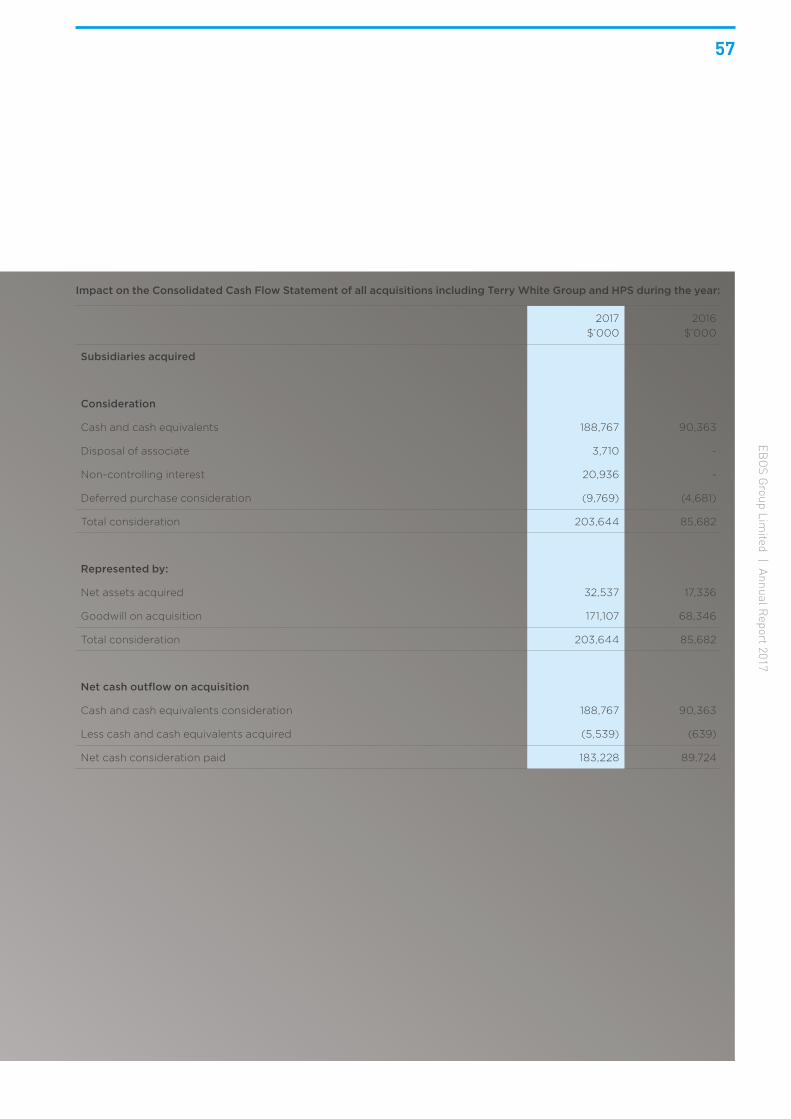
EBO
S Group Lim
ited | Annual Report 2017
57
Impact on the Consolidated Cash Flow Statement of all acquisitions including Terry White Group and HPS during the year:
2017 $’000
2016 $’000
Subsidiaries acquired
Consideration
Cash and cash equivalents 188,767 90,363
Disposal of associate 3,710 -
Non-controlling interest 20,936 -
Deferred purchase consideration (9,769) (4,681)
Total consideration 203,644 85,682
Represented by:
Net assets acquired 32,537 17,336
Goodwill on acquisition 171,107 68,346
Total consideration 203,644 85,682
Net cash outflow on acquisition
Cash and cash equivalents consideration 188,767 90,363
Less cash and cash equivalents acquired (5,539) (639)
Net cash consideration paid 183,228 89,724

58
C1. TRADE AND OTHER RECEIVABLES
2017 $’000
2016 $’000
Trade receivables (i) 1,035,971 1,320,068
Other receivables 26,746 17,593
Allowance for impairment (20,868) (17,274)
1,041,849 1,320,387
RECOGNITION AND MEASUREMENT
Trade receivables are measured on initial recognition at fair value, and are subsequently carried at amortised cost. Allowances are made for estimated unrecoverable amounts (provision for doubtful debts) and these are recognised in the Consolidated Income Statement. The provision for doubtful debts is measured as the difference between the trade receivables carrying amount and expected present value of future cash flows, which has considered customer credit history and historical recovery performance and trends.
(i) Trade receivables are non-interest bearing with credit accounts provided to customers on monthly terms. Interest may be charged on outstanding overdue balances in accordance with the terms and conditions under which goods are supplied.
(ii) Ageing of impaired trade and other receivables
2017 $’000
2016 $’000
Current 2,894 3,343
30 - 60 days 1,075 2,520
60 - 90 days 835 1,968
90 days+ 15,169 8,778
19,973 16,609
SECTION OVERVIEW
This section provides further analysis on the significant operating assets and liabilities of EBOS. These balances comprise the material net working capital balances used by EBOS to run its day-to-day operating activities.
SECTION C: OPERATING ASSETS AND LIABILITIES USED BY EBOS

EBO
S Group Lim
ited | Annual Report 2017
59
(iii) Ageing of past due but not impaired trade and other receivables
Included in the trade and other receivables balance are debtors with a carrying amount of $71.610m (2016: $83.090m) that are past due at the reporting date for which EBOS has not provided any impairment as the amounts are still considered recoverable.
2017 $’000
2016 $’000
30 - 60 days 55,396 60,257
60 - 90 days 9,608 4,443
90 days+ 6,606 18,390
71,610 83,090
C2. INVENTORIES
2017 $’000
2016 $’000
Raw materials – at cost 1,860 2,852
Finished goods – at cost 570,141 575,661
572,001 578,513
RECOGNITION AND MEASUREMENT
Inventories consist of raw materials (for the manufacturing operations of EBOS) and finished goods. Inventories are recognised at the lower of cost, determined on a weighted average basis and net realisable value. Cost comprises direct materials and, where applicable, direct labour costs and those overheads that have been incurred in bringing the inventories to their present location and condition. Net realisable value represents the estimated selling price in the ordinary course of business, less all estimated costs of completion and costs to be incurred in marketing, selling and distribution.

60
C3. TRADE AND OTHER PAYABLES
2017 $’000
2016 $’000
Current
Trade payables 1,229,981 1,539,855
Other payables 94,397 71,756
Deferred purchase consideration 3,379 -
1,327,757 1,611,611
Non-current
Other payables 13,837 12,926
13,837 12,926
RECOGNITION AND MEASUREMENT
Trade and other payables are initially measured at fair value and subsequently measured at amortised cost using the effective interest method.
D1. PROPERTY, PLANT AND EQUIPMENT
Freehold land
$’000Buildings
$’000
Leasehold improvements
$’000
Plant and equipment
$’000
Office equipment, furniture and fittings
$’000Total
$’000
Cost 23,757 16,752 15,923 53,341 22,570 132,343
Accumulated depreciation - (4,817) (4,643) (11,702) (13,208) (34,370)
Balance at 30 June 2016 23,757 11,935 11,280 41,639 9,362 97,973
Cost 34,834 17,481 20,620 61,942 24,804 159,681
Accumulated depreciation - (5,468) (5,953) (19,454) (12,930) (43,805)
Balance at 30 June 2017 34,834 12,013 14,667 42,488 11,874 115,876
SECTION OVERVIEW
This section explains what capital assets, such as property, plant and equipment EBOS uses to operate its business activities. This section also describes the material movements in capital assets during the year.
SECTION D: CAPITAL ASSETS USED BY EBOS TO OPERATE OUR BUSINESS

EBO
S Group Lim
ited | Annual Report 2017
61
Reconciliation of the carrying amount from the beginning to the end of the year ($’000)
RECOGNITION AND MEASUREMENT
Property, plant and equipment is initially recorded at cost. Cost includes the original purchase consideration and those costs directly attributable to bringing the item of property, plant and equipment to the location and condition for its intended use. After recognition as an asset, property, plant and equipment is carried at cost less accumulated depreciation and impairment losses.
Depreciation of property, plant and equipment assets, other than freehold land, is calculated on a straight-line basis. This allocates the cost or fair value amount of an asset, less any residual value, over its estimated remaining useful life.
JUDGEMENTS AND ESTIMATES – USEFUL LIVES
EBOS makes estimates of the remaining useful life of assets as follows:
• Buildings: 20 to 50 years • Leasehold improvements: 2 to 15 years • Plant and equipment: 2 to 20 years • Office equipment, furniture and fittings: 2 to 10 years
The residual value and useful lives are reviewed and if appropriate, adjusted at each reporting date.
D2. CAPITAL WORK IN PROGRESS
2017 $’000
2016 $’000
Capital work in progress 22,923 6,494
22,923 6,494
Capital work in progress relates to custom built distribution centres in Australia and New Zealand. The additional cost to complete the project is estimated at $42,891,000 (2016: $54,033,000).
Balance at 30 June 2016
-$20,000
$20,000
$60,000
$100,000
$140,000
Additions Business combination
Disposals Depreciation charge
Foreign exchange
movements
Balance at 30 June 2017
$20,082
($631) ($13,616)
$510$11,558
$97,973$115,876

62
Capital management
EBOS manages its capital, meaning total shareholders’ funds, to provide appropriate returns to shareholders whilst maintaining a capital structure that safeguards its ability to remain a going concern and optimises the cost of capital.
RECOGNITION AND MEASUREMENT
Equity instruments issued by the Company are recorded at the proceeds received, net of direct issue costs.
E1. SHARE CAPITAL
2017 No.
000’s
2017 Total
$’000
2016 No.
000’s
2016 Total
$’000
Fully paid ordinary shares
Balance at beginning of financial year 151,314 888,513 150,687 880,628
Shares issues under the long-term executive incentive scheme
- September 2016 600 - - -
Dividends reinvested:
- October 2015 - - 627 7,885
151,914 888,513 151,314 888,513
SECTION OVERVIEW
This section explains how EBOS funds its operations and shows the sources of other available facilities that it may call upon if required to fund its operational or future investing activities.
SECTION E: HOW WE FUND THE BUSINESS

EBO
S Group Lim
ited | Annual Report 2017
63
E2. DIVIDENDS
2017 2016
Cents per share
Total $’000
Cents per share
Total $’000
Recognised amounts
Fully paid ordinary shares:
Final - prior year 32.5 49,371 25.0 37,672
Interim - current year 30.0 45,574 26.0 39,342
Dividends per share 62.5 94,945 51.0 77,014
Unrecognised amounts
Final dividend 33.0 50,132 32.5 49,371
SUBSEQUENT EVENT
A dividend of 33.0 cents per share was declared on 23 August 2017 with the dividend being payable on 13 October 2017. The anticipated cash impact of the dividend is approximately $50.1m (2016: $49.2m).
E3. BORROWINGS
2017 $’000
2016 $’000
Current
Bank loans - securitisation facility (i) 154,962 106,976
Bank loans (ii) 895 -
155,857 106,976
Non-current
Bank loans (ii) 440,847 260,672
(i) EBOS, through a subsidiary company, has a trade debtor securitisation facility of $447.0m (2016: $444.3m) of which $292.0m was unutilised at 30 June 2017 (2016: $337.3m). The securitisation facility involves providing security over the future cash flows of specific trade receivables, which meet certain criteria, in return for cash finance on a contracted percentage of the security provided. As recourse, in the event of default by a trade debtor, remains with EBOS the trade receivables provided as security and the funding provided are recognised on the EBOS Consolidated Balance Sheet. At 30 June 2017, the value of trade receivables provided as security under this securitisation facility was $198.9m (2016: $148.4m). The net cash flows associated with the securitisation program are disclosed in the Consolidated Cash Flow Statement as cash flows from financing activities.

64
E4. BORROWINGS FACILITY MATURITY PROFILE
As at 30 June 2017 EBOS had unrestricted access to the following lines of available credit:
FacilityAmount (NZD)
$ millions Maturity
Term debt facilities - Less than 1 year
Term debt facilities $105.3 1-2 years
Term debt facilities $99.5 2-3 years
Term debt facilities $33.0 3-4 years
Term debt facilities $52.6 4-5 years
Working capital facilities $160.0 1-2 years
Securitisation facility $447.0 1-2 years
Less than 1 year
$’0001-2 years
$’0002-3 years
$’0003-4 years
$’0004-5 years
$’0005+ years
$’000Total
$’000
Bank loans
2017 18,182 402,310 98,611 34,358 50,515 - 603,976
2016 14,053 14,053 206,905 95,186 26,999 51,957 409,153
The following table shows the remaining contractual maturity for EBOS’ borrowings at balance date. The table includes both interest and principal (undiscounted) cash flows, with total bank loans of $603.976m (2016: $409.153m):
E3. BORROWINGS continued
(ii) EBOS has bank term loans and revolving cash advance facilities of $450.4m (2016: $346.0m), of which $8.7m was unutilised at 30 June 2017 (2016: $85.3m). EBOS is in full compliance with its debt facility financial covenants. Bank loans are secured by a guarantee over the assets of EBOS.
RECOGNITION AND MEASUREMENT
All loans and borrowings are initially recognised at cost, being the fair value of the consideration received plus issue costs associated with the borrowing. After initial recognition, these loans and borrowings are subsequently measured at amortised cost using the effective interest method that allocates the cost through the expected life of the loan or borrowing. The fair value of non-current borrowings is approximately equal to their carrying amount.
Bank loans are classified as current liabilities unless EBOS has an unconditional right to defer settlement of the liability for at least 12 months after the balance sheet date.

EBO
S Group Lim
ited | Annual Report 2017
65
2017 $’000
2016 $’000
Bank overdraft facility, reviewed annually and payable at call:
Amount unused 4,290 1,659
4,290 1,659
Bank loan facilities with various maturity dates through to July 2021 (2016: July 2021)
Amount used 596,704 367,648
Amount unused 300,704 422,634
897,408 790,282
Financing activities
E5. OPERATING CASH FLOWS
Reconciliation of profit for the year with cash from operating activities:
For the financial year ended 30 June 20172017
$’0002016
$’000
Profit for the year 132,846 126,997
Add/(less) non-cash items:
Depreciation 13,616 12,933
Loss on sale of property, plant and equipment 497 274
Amortisation of finite life intangible assets 12,218 11,757
Share of profit from associates (4,062) (3,823)
Loss on derivative financial instruments - 770
Expense recognised in respect of share based payments 490 -
Deferred tax (2,462) (4,819)
20,297 17,092

66
ACCOUNTING POLICIES
Cash and cash equivalents comprise cash on hand and deposits readily convertible to cash and which are not subject to a significant risk of change in value.
The Consolidated Cash Flow Statement is prepared exclusive of Goods and Services Tax (GST), which is consistent with the method used in the Consolidated Income Statement.
• Operating activities include all transactions and other events that are not investing or financing activities.
• Investing activities are those activities relating to the acquisition and disposal of current and non-current investments and any other non-current assets.
• Financing activities are those activities relating to changes in the equity and debt capital structure of the Group and those activities relating to the cost of servicing EBOS’ equity capital.
For the financial year ended 30 June 20172017
$’0002016
$’000
Movement in working capital:
Trade and other receivables 278,538 (516,548)
Prepayments 626 (94)
Inventories 6,512 (60,241)
Current tax refundable/payable (4,079) 1,218
Trade and other payables (282,943) 662,238
Employee benefits 6,436 1,880
Foreign currency translation of working capital balances 608 (18,400)
5,698 70,053
Balances classified as investing activities (2,466) 6,706
Working capital items acquired (12,432) 3,274
Net cash inflow from operating activities 143,943 224,122
E5. OPERATING CASH FLOWS continued

EBO
S Group Lim
ited | Annual Report 2017
67
F1. SUBSIDIARIES
The following entities comprise the significant trading and holding companies of the Group:
Parent and head entity: EBOS Group Limited
Ownership interests and voting rights
Subsidiaries (all balance dates 30 June unless otherwise noted)Country of
Incorporation 2017 2016
Pet Care Holdings Australia Pty Limited (formerly EBOS Healthcare [Australia] Pty Limited) Australia 100% 100%
EBOS Group Australia Pty Limited Australia 100% 100%
EBOS Health & Science Pty Limited Australia 100% 100%
PRNZ Limited New Zealand 100% 100%
Pharmacy Retailing NZ Limited New Zealand 100% 100%
Pet Care Distributors Pty Limited (formerly Healthcare Distributors Pty Limited) Australia 100% 100%
Masterpet Corporation Limited New Zealand 100% 100%
Masterpet Australia Pty Limited Australia 100% 100%
Botany Bay Imports and Exports Pty Limited Australia 100% 100%
Aristopet Pty Ltd Australia 100% 100%
EAHPL Pty Limited (formerly EBOS Australia Holdings Pty Limited) Australia 100% 100%
ZHHA Pty Ltd Australia 100% 100%
ZAP Services Pty Ltd Australia 100% 100%
Symbion Pty Ltd Australia 100% 100%
Intellipharm Pty Ltd Australia 100% 100%
Clinect Pty Ltd Australia 100% 100%
Lyppard Australia Pty Ltd Australia 100% 100%
DoseAid Pty Limited (formerly APHS Packaging Pty Limited) Australia 100% 100%
Symbion Pharmacy Services Trade Receivables Trust1 Australia 100% 100%
Black Hawk Premium Pet Care Pty Limited Australia 100% 100%
SECTION OVERVIEW
This section provides information to assist in the understanding the EBOS Group legal structure and how it affects the financial position and performance of the Group. Details of businesses acquired are presented in Section B.
SECTION F: EBOS GROUP STRUCTURE

68
1 The balance date of all subsidiaries is 30 June aside from the Symbion Pharmacy Services Trade Receivables Trust, which has a balance date of 31 December. The results of the Symbion Pharmacy Services Trade Receivables Trust (SPS Trust) have been included in the Group results for the year to 30 June 2017. The SPS Trust is consolidated as EBOS has the exposure, or rights, to variable returns from its involvement with the Trust and the Group considers that it has existing rights that give it the current ability to direct the relevant activities of the Trust.
F1. SUBSIDIARIES continued
Endeavour Consumer Health Limited (formerly Healthcare Distributors Pty Limited) New Zealand 100% 100%
Nexus Australasia Pty Limited Australia 100% 100%
EBOS PH Pty Limited Australia 100% -
Terry White Group Pty Limited Australia 50% -
Chemmart Holdings Pty Limited Australia 50% -
TW&CM Pty Ltd Australia 50% -
TWC IP Pty Ltd Australia 50% -
PBA Wholesale Pty Ltd Australia 50% -
VIM Health Pty Ltd Australia 50% -
Old LL Pty Ltd Australia 50% -
PBA Finance Pty Ltd Australia 50% -
Chem Plus Pty Ltd Australia 50% -
Pharmacy Brands Australia Pty Ltd Australia 50% -
VIM Health IP Pty Ltd Australia 50% -
Tony Ferguson Weight Management Pty Ltd Australia 50% -
Lite Living Pty Ltd Australia 50% -
Alchemy Holdings Pty Limited Australia 100% -
Alchemy Sub-Holdings Pty Ltd Australia 100% -
HPS Holdings Group (Aust) Pty Ltd Australia 100% -
HPS Hospitals Pty Ltd Australia 100% -
HPS Corrections Pty Ltd Australia 100% -
HPS Services Pty Ltd Australia 100% -
Hospharm Pty Ltd Australia 100% -
HPS IVF Pty Ltd Australia 100% -
HPS Finance Pty Ltd Australia 100% -
HPS Brands Pty Ltd Australia 100% -
Natures Synergy Pty Ltd Australia 100% -

EBO
S Group Lim
ited | Annual Report 2017
69
F2. INVESTMENT IN ASSOCIATES
Name of associate company Principal activitiesDate of
acquisition
Proportion of shares
and voting rights
acquired
Cost of acquisition
$’000
Animates NZ Holdings Limited Animal care supplies December 2011 50% 18,150
Good Price Pharmacy Franchising Pty Limited Healthcare supplies October 2014 25.77% 3,918
Good Price Pharmacy Management Pty Limited Healthcare supplies October 2014 25.77% 3,918
The reporting date for Animates NZ Holdings Limited is 30 June. Animates NZ Holdings Limited is incorporated in New Zealand.
The reporting date for Good Price Pharmacy Franchising Pty Limited and Good Price Pharmacy Management Pty Limited is 30 June. They are incorporated in Australia.
Although the Company holds 50% of the shares and voting power in Animates NZ Holdings Limited and this entity is not deemed to be a subsidiary as the other 50% is held by a single shareholder, therefore EBOS is unable to exercise control over this entity.

70
F2. INVESTMENT IN ASSOCIATES continued
The summary financial information in respect of EBOS Group’s associates is set out below:
2017 $’000
2016 $’000
Statement of Financial Position
Total assets 72,344 67,829
Total liabilities (43,051) (37,829)
Net assets 29,293 30,000
Group’s share of net assets 13,741 14,171
Income Statement
Total revenue 119,032 113,512
Total profit for the year 9,880 9,454
Group’s share of profits of associates 4,062 3,823
Movement in the carrying amount of the Group’s investment in associates:
Balance at the beginning of the financial year 36,778 34,911
Disposals (3,710) -
Share of profits of associates 4,062 3,823
Share of dividends (913) (1,113)
Net foreign currency exchange differences 238 (843)
Balance at the end of the financial year 36,455 36,778
Goodwill included in the carrying amount of the Group’s investment in associates
21,398
21,365
The Group’s share of the contingent liabilities of associates - -
The Group’s share of capital commitments of associates - -

EBO
S Group Lim
ited | Annual Report 2017
71
RECOGNITION AND MEASUREMENT
An associate is an entity over which EBOS has significant influence and that is neither a subsidiary nor an interest in a joint venture or joint operation. EBOS has significant influence when it has the power to participate in the financial and operating policy decisions of the investee, but is not in control or joint control over those policies.
Investments in associates are incorporated in the EBOS Group financial statements using the equity method of accounting. Under the equity method, investments in associates are carried in the Consolidated Balance Sheet at cost and adjusted for post-acquisition changes in EBOS’ share of the net assets of the associate, less any impairment in the value of individual investments and less any dividends. Losses of an associate in excess of EBOS’ interest in that associate are recognised only to the extent that EBOS has incurred legal or constructive obligations or made payments on behalf of the associate.
Any excess of the cost of acquisition over EBOS’ share of the net fair value of the identifiable assets, liabilities and contingent liabilities of the associate recognised at the date of acquisition is recognised as goodwill. The goodwill is included within the carrying amount of the investment and is assessed for impairment as part of that investment.
FOREIGN CURRENCY RISK
EBOS is exposed to foreign currency risk arising primarily from the procurement of goods denominated in foreign currencies (US dollar, Thai Baht, Euro and British Pound).
INTEREST RATE RISK
EBOS is exposed to interest rate risk as it borrows funds in both New Zealand dollars and Australian dollars at floating interest rates.
SECTION OVERVIEW
This section describes the financial risks that EBOS has identified and how it manages these risks, to protect its financial position and financial performance. Management of these risks includes the use of financial instruments to hedge against unfavourable interest rate and foreign currency movements.
SECTION G: HOW WE MANAGE RISK
G1. FINANCIAL RISK MANAGEMENT
The EBOS corporate treasury function provides services to the Group’s entities, coordinates access to financial markets and manages the financial risks relating to the operation of the Group.
EBOS does not enter into or trade financial instruments, including derivative financial instruments, for speculative purposes. The use of financial derivatives is governed by Group policies approved by the Board of Directors, which provide written principles on the use of financial derivatives. Compliance with policies and exposure limits is reviewed by the Board of Directors on a regular basis.
Foreign exchange rate exposures are managed utilising forward foreign exchange contracts.
EBOS enters into forward foreign exchange contracts to manage the risk associated with anticipated future purchase transactions denominated in foreign currencies in accordance with the Board approved treasury policy.

72
G1. FINANCIAL RISK MANAGEMENT continued
The risk is assessed and managed by the use of interest rate swap contracts.
Under interest rate swap contracts, EBOS agrees to exchange the difference between fixed and floating rate interest amounts calculated on agreed notional principal amounts. Such contracts enable EBOS to mitigate the risk of changing interest rates on debt held.
Interest rate swap contracts are only entered into in accordance with the Group’s Board approved treasury policy.
LIQUIDITY RISK
EBOS is exposed to liquidity risk as it must invest in significant levels of working capital such as inventory and accounts receivables that can impact liquidity unless they are converted to cash.
CREDIT RISK
EBOS is exposed to the risk of default in relation to receivables owing from its Healthcare and Animal Care customers, hedging instruments and guarantees and deposits held with banks and other financial institutions.
EBOS manages liquidity risk by maintaining adequate reserves, banking facilities and reserve banking facilities by continuously monitoring forecast and actual cash flows and matching maturity profiles of financial assets and liabilities. Refer to note E4 for information on EBOS’ borrowings facility maturity profile.
EBOS has adopted a policy of only dealing with creditworthy counter parties as a means of mitigating the risk of financial loss from defaults.
Trade receivables consist of a large number of customers, spread across diverse sectors and geographical areas. Ongoing credit evaluation is performed on the financial condition of the trade receivables.
The carrying amount of financial assets recorded in the financial statements, net of any allowances for losses, represents the maximum exposure to EBOS of any credit risk.
EBOS does not have any significant credit risk exposure to any single counter party. The credit risk on liquid funds and derivative financial instruments is limited because the counter parties are banks with high credit ratings assigned by international credit rating agencies.
EBOS has not changed its overall strategy regarding the management of risk from 2016.
G2. FINANCIAL INSTRUMENTS
Derivatives
2017 $’000
2016 $’000
Other financial assets – derivatives (at fair value)
Foreign currency forward contracts (i) 19 -
19 -
Other financial liabilities – derivatives (at fair value)
Foreign currency forward contracts (i) 428 1,475
Interest rate swaps (i) 2,567 7,177
2,995 8,652

EBO
S Group Lim
ited | Annual Report 2017
73
(i) Designated and effective as a cash flow hedging instrument carried at fair value.
EBOS has categorised these derivatives, both financial assets and financial liabilities, as Level 2 under the fair value hierarchy contained within NZ IFRS 13. There were no transfers between fair value hierarchy levels during the current or prior periods.
The fair value of forward foreign exchange contracts is determined using a discounted cash flow valuation. Key inputs are based upon observable forward exchange rates, at the measurement date, with the resulting value discounted back to present values.
Interest rate swaps are valued using a discounted cash flow valuation. Key inputs for the valuation of interest rate swaps are the estimated future cash flows based on observable yield curves at the end of the reporting period, discounted at a rate that reflects the credit risk of the various counterparties.
2017 $’000
2016 $’000
Buy Australia dollars 5,566 5,076
Buy EURO 3,694 3,685
Buy British Pounds 3,584 3,468
Buy Thai Bhat 5,283 5,309
Buy USD 24,766 28,688
42,893 46,226
2017 $’000
2016 $’000
Less than 1 year 53,122 87,268
1 to 3 years 107,140 131,809
3 to 5 years 127,433 60,558
Greater than 5 years 57,846 5,000
345,541 284,665
Outstanding forward foreign currency contracts: nominal value
Outstanding interest rate swap contracts: nominal value

74
RECOGNITION AND MEASUREMENT
Derivatives are initially recognised at fair value on the date a derivative contract is entered into and are subsequently remeasured to their fair value. The resulting gain or loss is recognised in profit or loss immediately unless the derivative is designated and effective as a hedging instrument, in which event the timing of the recognition in profit or loss depends on the nature of the hedge relationship. EBOS designates certain derivatives as cash flow hedges of highly probable forecast transactions.
The carrying amount of financial assets and financial liabilities recorded in the financial statements approximates their fair values.
The fair values of financial assets and financial liabilities are determined as follows:
• the fair value of financial assets and financial liabilities with standard terms and conditions and traded on active liquid markets are determined with reference to quoted market prices;
• the fair value of other financial assets and financial liabilities are determined in accordance with generally accepted pricing models based on discounted cash flow analysis; and
• the fair value of derivative instruments is calculated using quoted prices. Where such prices are not available use is made of discounted cash flow analysis using the applicable yield curve for the duration of the instruments.
CASH FLOW HEDGES
Changes in fair value of hedges that are designated and qualify as cash flow hedges and are considered effective for accounting purposes are recognised in the cash flow hedge reserve (in equity) and in other comprehensive income. The gain or loss relating to any ineffective element is recognised immediately in the income statement. Amounts accumulated in other comprehensive income are recycled in the income statement in the periods when the forecast transactions (hedged item) take place.
However, when the forecast transaction that is hedged results in the recognition of a non-financial asset or a non-financial liability, the gains and losses previously deferred in equity are transferred from equity and included in the initial measurement of the cost of the asset or liability.
Hedge accounting is discontinued when EBOS either revokes the hedging relationship or the hedging instrument expires or is terminated, exercised or no longer qualifies for hedge accounting. Amounts deferred in equity are recycled in profit or loss in the periods when the hedged item is recognised in profit or loss.
When a forecast transaction is no longer expected to occur, the cumulative gain or loss that was deferred in equity is recognised immediately in profit or loss.
G2. FINANCIAL INSTRUMENTS continued

EBO
S Group Lim
ited | Annual Report 2017
75
SECTION OVERVIEW
This section includes the remaining information relating to EBOS that is required to be presented so as to comply with its financial reporting requirements.
SECTION H: OTHER DISCLOSURES
H1. CONTINGENT LIABILITIES
2017 $’000
2016 $’000
Contingent liabilities
Guarantees given to third parties 9,640 10,311
9,640 10,311
H2. COMMITMENTS FOR EXPENDITURE
2017 $’000
2016 $’000
Capital expenditure commitments:
Plant 27,697 11,361
Software development 628 449
28,325 11,810
Operating expenditure commitments:
Non-cancellable operating lease payments:
Less than one year 32,024 24,074
More than one year and less than five years 81,043 62,618
More than five years 42,295 50,381
155,362 137,073
Guarantees principally comprise property lease guarantees on behalf of landlords of EBOS.
Lease arrangements
Operating leases relate to certain land, buildings, plant and equipment, with lease terms of between one to twelve years with options to extend for a further one to nineteen years. All operating lease contracts contain market review clauses in the event that EBOS exercises its option to renew. EBOS does not have an option to purchase the leased asset at the expiry of the lease period.

76
H3. SUBSEQUENT EVENTS
SUBSEQUENT EVENT
Subsequent to year end the Board has approved a final dividend to shareholders. For further details please refer to note E2.
H4. RELATED PARTY DISCLOSURES
Key management personnel compensation
2017 $’000
2016 $’000
Short-term employee benefits 9,722 11,674
9,722 11,674
EBOS operates a long term incentive share plan whereby EBOS provides an interest free, non-recourse loan to participating senior executives in order for those executives to purchase shares in the company. While the shares are issued and held in the executive’s name the shares will not vest unless and until performance conditions are met. The executive cannot deal in the shares unless and until those shares vest. All net dividends received in respect of the shares must be applied to the repayment of the interest-free loan.
A total of 600,000 shares were issued in September 2016 with an issue price of $18.15. The performance conditions in relation to these shares will be tested after the end of the performance period, being 1 July 2016 to 30 June 2019.

EBO
S Group Lim
ited | Annual Report 2017
77
H5. REMUNERATION OF AUDITORS
2017 $’000
2016 $’000
Auditor of the Group (Deloitte)
Audit of the financial statements 683 571
Audit related services for review of interim financial statements 164 163
Due diligence 25 177
Information technology services 162 248
Advisory services 9 21
1,043 1,180
Other Auditors (Ernst & Young)
Audit of subsidary financial statements 147 -
Audit related services for review of interim financial statements 37 -
Advisory services 47 -
231 -
All non-audit services provided by EBOS’ auditors require pre-approval by the Audit and Risk Committee. Before any non-audit services are approved, the Audit and Risk Committee must be satisfied that the provision of such services will not have any influence on the independence of the auditors.

78
H6. CHANGES IN FINANCIAL REPORTING STANDARDS
No new accounting standards or interpretations have been adopted during the year that have had a material impact on these financial statements. The following new standards have been approved but are not yet effective, which may have a future impact on the Group’s financial statements:
NZ IFRS 16 Leases
NZ IFRS 16 will supersede the current lease guidance including NZ IAS 17 leases and the related interpretations when it becomes effective for EBOS in the 2020 financial year.
NZ IFRS 16 distinguishes leases and service contracts on the basis of whether an identified asset is controlled by a customer. Distinctions of operating leases (off balance sheet) and finance leases (on balance sheet) are removed for lessee accounting, and is replaced by a model where a right-of-use asset and a corresponding liability have to be recognised for all leases by lessees (i.e., all on balance sheet) except for short-term leases and leases of low value assets.
The right-of-use asset is initially measured at cost and subsequently measured at cost (subject to certain exceptions) less accumulated depreciation and impairment losses, adjusted for any remeasurement of the lease liability. The lease liability is initially measured at the present value of the lease payments that are not paid at that date. Subsequently, the lease liability is adjusted for interest and lease payments, as well as the impact of lease modifications.
Furthermore, the classification of cash flows will also be affected as operating lease payments under NZ IAS 17 are presented as operating cash flows; whereas under the NZ IFRS 16 model, the lease payments will be split into a principal and an interest portion that will be presented as financing and operating cash flows respectively.
The new requirement to recognise a right-of use asset and a related lease liability is expected to have a significant impact on the amounts recognised in the Group’s consolidated financial statements and the directors are currently assessing its potential impact. It is not practicable to provide a reasonable estimate of the financial effect until the directors complete their review.
NZ IFRS 9 Financial instruments
NZ IFRS 9 establishes the principles for hedge accounting and impairment of financial assets. Under NZ IFRS 9, greater flexibility has been introduced to the types of transactions eligible for hedge accounting. In addition, the effectiveness test has been overhauled and replaced with the principle of an ‘economic relationship’. Retrospective assessment of hedge effectiveness is also no longer required. Enhanced disclosure requirements about an entity’s risk management activities have also been introduced. In relation to the impairment of financial assets NZ IFRS 9 requires an expected credit loss model, as opposed to an incurred credit loss model under NZ IAS 39. The expected credit loss model requires an entity to account for expected credit losses and changes in those expected credit losses at each reporting date to reflect changes. This standard will be effective for EBOS in the 2019 financial year. While the Group has made progress in its assessment of the potential impact of this standard this process has not yet been completed.
NZ IFRS 15 Revenue from Contracts
NZ IFRS 15 provides a single, comprehensive principles-based five-step model to be applied to all contracts with customers. This standard will be effective for EBOS in the 2019 financial year. The five steps in the model are: identify the contract with the customer; identify the performance obligations in the contract; determine the transaction price; allocate the transaction price to the performance obligations in the contract; and recognise revenue when (or as) the entity satisfies a performance obligation. While the Group has made progress in its assessment of the potential impact of this standard this process has not yet been completed.
We expect to report more detailed information on these not-yet-implemented standards, including estimated quantitative financial effects, in our 2018 financial statements.

EBO
S Group Lim
ited | Annual Report 2017
79
Fully paid sharesPercentage of
paid capital
Sybos Holdings Pte Limited 60,525,721 39.84%
60,525,721 39.84%
Substantial Security Holders
As at 21 July 2017 the following persons are deemed to be substantial security holders in accordance with Section 26 of the Securities Markets Amendment Act 1988:
As at 21 July 2017
Twenty largest shareholders Fully paid sharesPercentage of
paid capital
Sybos Holdings Pte Limited 60,525,721 39.84%
HSBC Nominees (New Zealand) Limited – NZCSD HKBN90 10,299,083 6.78%
JP Morgan Chase Bank NA NZ Branch-Segregated Clients Acct – NZCSD CHAM24 7,624,177 5.02%
Citibank Nominees (New Zealand) Limited – NZCSD CNOM90 4,701,576 3.09%
Forsyth Barr Custodians Limited 1-CUSTODY 4,097,000 2.70%
Whyte Adder No 3 Limited 3,596,425 2.37%
Tea Custodians Limited Client Property Trust Account – NZCSD TEAC40 2,853,854 1.88%
Accident Compensation Corporation – NZCSD ACCI40 2,557,983 1.68%
FNZ Custodians Limited 2,469,801 1.63%
HSBC Nominees (New Zealand) Limited A/C State Street – NZCSD HKBN45 2,453,635 1.62%
Custodial Services Limited A/C 3 2,059,142 1.36%
JP Morgan Nominees Australia Limited 1,597,669 1.05%
Citicorp Nominees Pty Limited 1,298,302 0.85%
Custodial Services Limited A/C 4 1,092,537 0.72%
HSBC Nominees A/C New Zealand Superannuation Fund Nominees - NZCSD SUPR40
1,062,319 0.70%
BNP Paribas Nominees Pty Ltd Agency Lending DRP A/C 1,036,336 0.68%
HSBC Custody Nominees (Australia) Limited 903,799 0.59%
Custodial Services Limited A/C 2 895,972 0.59%
National Nominees New Zealand Limited – NZCSD NNLZ90 861,728 0.57%
Custodial Services Limited A/C 18 802,038 0.53%
112,789,097 74.25%
ADDITIONAL STOCK EXCHANGE INFORMATION

80
Distribution of Shareholders and Shareholdings Holders Fully paid sharesPercentage of
paid capital
Size of Holding
1 to 1,000 2,161 940,850 0.62%
1,001 to 5,000 3,161 7,266,978 4.78%
5,001 to 10,000 808 5,502,723 3.62%
10,001 to 100,000 682 14,442,786 9.51%
100,001 and over 55 123,760,967 81.47%
Total 6,867 151,914,304 100.00%
Unmarketable parcel as at 21 July 2017
As at 21 July 2017, there were 112 shareholders (with a total of 1,550 shares) holding less than a marketable parcel of shares under the ASX Listing Rules, based on the closing share price of A$16.71. The ASX Listing Rules define a marketable parcel of shares as a parcel of shares of not less than A$500.
Waivers from the NZX and ASX Listing Rules
Waivers granted from the application of NZX and ASX Listing Rules are published on the Company’s website.
The terms of the Company’s admission to the ASX and ongoing listing requires the following disclosures:
1. The Company is not subject to Chapters 6, 6A, 6B and 6C of the Australian Corporations Act dealing with the acquisition of shares (including substantial holdings and takeovers).
2. Limitations on the acquisition of securities imposed under New Zealand law are as follows:
(a) In general, securities in the Company are freely transferable and the only significant restrictions or limitations in relation to the acquisition of securities are those imposed by New Zealand laws relating to takeovers, overseas investment and competition.
(b) The New Zealand Takeovers Code creates a general rule under which the acquisition of 20% or more of the voting rights in the Company or the increase of an existing holding of 20% or more of the voting rights of the Company can only occur in certain permitted ways. These include a full takeover offer in accordance with the Takeovers Code, a partial takeover in accordance with the Takeovers Code, an acquisition approved by an ordinary resolution, an allotment approved by an ordinary resolution, a creeping acquisition (in certain circumstances), or compulsory acquisition of a shareholder holding 90% or more of the shares.
(c) The New Zealand Overseas Investment Act 2005 and Overseas Investment Regulations 2005 (New Zealand) regulate certain investments in New Zealand by overseas interests. In general terms, the consent of the New Zealand Overseas Investment Office is likely to be required where an ‘overseas person’ acquires shares in the Company that amount to 25% or more of the shares issued by the Company, or if the overseas person already holds 25% or more, the acquisition increases that holding.
(d) The New Zealand Commerce Act 1986 is likely to prevent a person from acquiring shares in the Company if the acquisition would have, or would be likely to have, the effect of substantially lessening competition in the market.
Voting Rights
Shareholders may vote at a meeting of shareholders either in person or by proxy, attorney, or representative. Where voting is by show of hands or by voice every shareholder present in person or representative has one vote.
In a poll every shareholder present in person or by proxy, attorney or representative has one vote for each share.

EBO
S Group Lim
ited | Annual Report 2017
81
The Board and management of EBOS Group Limited are committed to ensuring that the Company adheres to best practice and governance principles and maintains high ethical standards.
The Board has agreed to regularly review and assess the Company’s governance structures to ensure they are consistent, both in form and in substance, with best practice. The Board considers that the Company’s Corporate Governance policies, practices and procedures substantially comply with the New Zealand Stock Exchange Corporate Governance Best Practice Code. The Company is committed to complying with the NZX Corporate Governance Code 2017 (2017 Code) and will report on its compliance with it in accordance with the timeframes required under the 2017 Code and NZX Listing Rules. The Company supports the ASX Corporate Governance Council’s Corporate Governance Principles and Recommendations (‘ASX Principles’) and acknowledges that at present it does not meet all of ASX’s recommendations. Where the Company does not meet the ASX Principles these have been outlined below.
Further information on the Company’s corporate governance policies and practices can be found in the Company’s Corporate Governance Code (‘Corporate Governance Code’), the full content of which can be found on the Company’s website at http://www.ebosgroup.com/investor-centre/corporate-governance/. The Corporate Governance Code includes the Charters of the Board and its committees, the Code of Ethics and the Continuous Disclosure Policy referred to in this Corporate Governance Statement. This Corporate Governance Statement was approved by the Board of EBOS Group Limited and is current as at 24 August 2017.
PRINCIPLE 1: LAY SOLID FOUNDATIONS FOR MANAGEMENT AND OVERSIGHT
ROLE OF THE BOARD AND MANAGEMENT
The Board is responsible for the direction and supervision of the business and affairs of the Company and the monitoring of the performance of the Company on behalf of shareholders. The Board also places emphasis on regulatory compliance.
Responsibility for the day-to-day management of the Company has been delegated to the Chief Executive Officer (CEO) and his management team.
The Board is responsible for directing the Company and enhancing its value for shareholders. It has adopted a formal Corporate Governance Code that details the Board’s responsibilities, membership and operation.
As part of the Board’s oversight of senior management, all Company executives are subject to annual performance review and goal planning. In addition, the Board monitors the performance of the CEO against the Board’s requirements and expectations. In the 12 month period ended 30 June 2017, a review of each member of the Company’s senior management was completed and this was discussed with the executive concerned as part of the annual review process for that executive.
The Corporate Governance Code sets out a process for evaluating the performance of the Board, its committees and individual directors. This process occurred during the year and was led by the Chairman.
The Company’s policy is to undertake appropriate checks before putting forward a person to shareholders for election or appointing a person to fulfil a casual vacancy. Where the Company determines that a person is an appropriate candidate, shareholders are notified of that and are provided with all material information in the Company’s possession that is relevant to their decision on whether or not to elect or re-elect a director through a number of channels, including through the Notice of Meeting and other information contained in the Annual Report.
Upon appointment, each director (and senior executive) receives a letter of appointment that sets out the formal terms of their appointment, along with a deed of indemnity, insurance and access.
Directors also attend formal induction sessions where they are briefed on the Company’s vision and values, strategy, financial performance, and governance and risk management frameworks. Directors are also provided with ongoing professional development and training opportunities and programs to enable them to develop and maintain the skills and knowledge needed to perform their role effectively.
As a New Zealand listed entity, the Company does not have a company secretary. The General Counsel provides company secretarial services. The General Counsel is accountable to the Board through the Chairman.
Corporate Governance

82
The Board has recently adopted a Diversity Policy, which is set out as Appendix G of the Corporate Governance Code. Under the policy, the Board is responsible for setting measurable objectives for achieving diversity. The Board has adopted the following objectives for the 2017/18 year:
• aim to increase the proportion of women on the Board as vacancies arise, having regard to the circumstances (including skill requirements) relating to the vacancies;
• aim to increase the proportion of women in executive and senior management roles as vacancies arise, having regard to the circumstances (including skill requirements) relating to the vacancies;
• continue to ensure that the remuneration of females in salaried roles is objectively reviewed against the remuneration of males in comparable roles in order to eliminate inequity based on gender (with such review taking into account relevant experience, qualifications and performance); and
• continue to promote family friendly and flexible work place practices including but not limited to parental leave, flexible return to work arrangements, flexible work arrangements and employee assistance programs.
The Company’s gender representation as at 30 June 2017 was as follows:
Female % Male %
Board 40 60
Executive* 9 91
Group 57 43
PRINCIPLE 2: STRUCTURE THE BOARD TO ADD VALUE
BOARD COMPOSITION
The Board is structured to bring to its deliberations a range of experience relevant to the Company’s operations.
Expertise Experience
Strategy
Commercial acumen
Financial knowledge and experience
Risk management
Corporate governance
International trade
Industry
• Healthcare
• Marketing
• Logistics
• Technology
• Government
Geographic regions
• Oceania
• South-East Asia
Pages 20 to 21 set out the qualifications, expertise, experience and length of service of each director in office as at the date of this report.
The Board is elected by the shareholders of EBOS Group Limited. At each annual meeting at least one-third of the directors retire by rotation.
The Board currently comprises five directors. All of the directors are non-executive directors. Mark Waller, Elizabeth Coutts and Sarah Ottrey have been determined as Independent Directors. Each of these directors are considered to be independent as that term is defined in the NZX Main Board Listing Rules. Elizabeth Coutts and Sarah Ottrey are considered to be independent as that term is defined in the ASX Principles. Mark Waller does not satisfy every ASX Corporate Governance Council recommendation as to the factors relevant to assessing the independence of a director, but the Board members unanimously believe that he acts independently as a director and as Chairman, based on the experiences of those of them who have worked with him, and in particular having regard to the high degree of professionalism he has at all times displayed as an EBOS director and as Chairman. In addition, the Board notes that Mark Waller has no affiliation with any major shareholder of the Company and did not have any such affiliation during his tenure as the EBOS Managing Director/Chief Executive Officer.
The Board believes that its current structure is appropriate. The involvement of Peter Williams and Stuart McGregor reflects the confidence of Sybos Holdings Pty Limited as a 40% shareholder in the Company. A further enlargement of the Board for the sole purpose of complying with the ASX Principles is not justified at this time given the calibre of the current Board.*Executive means the CEO and his direct reports.

EBO
S Group Lim
ited | Annual Report 2017
83
The Board’s assessment of the independence of each current director is set out below.
Name StatusAppointment Date
Mark Waller Independent 1987
Elizabeth Coutts Independent July 2003
Stuart McGregor Non-independent
July 2013
Sarah Ottrey Independent September 2006
Peter Williams Non-independent
July 2013
SENIOR EXECUTIVES
EBOS Group’s senior executives are appointed by the CEO and their key performance indicators contain specific financial and other objectives. These KPIs are reviewed annually by the CEO and noted by the Remuneration Committee. The performance of the EBOS Group senior executives against these objectives is evaluated annually.
BOARD COMMITTEES
Specific responsibilities can be delegated to the Audit and Risk Committee, the Remuneration Committee and the Nomination Committee. Each of these committees has a charter setting out the committee’s objectives, procedures, composition and responsibilities. Copies of these charters are available on the Company’s website.
BOARD PROCESSES
The table within the Directors’ Disclosures shows attendance at the Board and committee meetings during the year ended 30 June 2017.
Under the Company’s Corporate Governance Code, the Chairperson is responsible for the processes for evaluating the performance of the Board, Board Committees and individual directors.
The Company’s Corporate Governance Code provides for directors of the Company to obtain independent professional advice at the expense of the Company subject to obtaining the prior approval of the Audit and Risk Committee.
SHARE TRADING BY DIRECTORS AND OFFICERS
The Company has formal procedures that directors and officers must follow when trading EBOS shares. The Share Trading Policy is available on the EBOS Group website.
REMUNERATION COMMITTEE
The Remuneration Committee provides the Board with assistance in establishing relevant remuneration policies and practices for directors, executives and employees including ensuring appropriate background checks are undertaken. The current members of the Remuneration Committee are Mark Waller (Chairman), Elizabeth Coutts and Sarah Ottrey.
NOMINATION COMMITTEE
The procedure for the appointment and removal of directors is ultimately governed by the Company’s Constitution. A director is appointed by ordinary resolution of the shareholders although the Board may fill a casual vacancy. The Board has allowed for a Nomination Committee to be constituted for the purposes of, amongst other things, recommending candidates to be nominated as a director on the Board and candidates for the committees. However, the Board considers, having regard to the current composition of the Board, that the functions of the Nomination Committee will be undertaken by the Board for the time being. Accordingly, there were no Nomination Committee meetings held during the year.
The Nomination Committee Charter, which outlines the Committee’s authority, duties, responsibility and relationship with the Board is set out as Appendix D to the Corporate Governance Code and is available on the Company’s website.
PRINCIPLE 3: ACT ETHICALLY AND RESPONSIBLY
The Board has a code of conduct for its directors, senior executives and employees, in the form of its Code of Ethics. The Code of Ethics is set out as Appendix A to the Corporate Governance Code and is available on the Company’s website. The Code of Ethics is the framework of standards by which the directors and employees of EBOS and its related companies are expected to conduct their professional lives, and covers conflicts of interest, receipt of gifts, confidentiality, expected behaviour, delegated authority and compliance with laws and policies.

84
PRINCIPLE 4: SAFEGUARD INTEGRITY IN CORPORATE REPORTING
The Audit and Risk Committee provides the Board with assistance in fulfilling its responsibilities to shareholders, the investment community and others for overseeing the Company’s financial statements, financial reporting processes, internal accounting systems, financial controls, and annual external financial audit and EBOS’ relationship with its external auditor. In addition, the Audit and Risk Committee is responsible for the establishment of policies and procedures relating to risk oversight, identification, management and control.
The current members of the Audit and Risk Committee are Elizabeth Coutts (Chairman), Mark Waller and Stuart McGregor. Further information about the relevant qualifications and experience of the members of the committee is set out on pages 20 to 21. The majority of the members are not independent for the purposes of the ASX Principles, but the Board consider them appropriate based on their individual skills.
The Audit and Risk Committee Charter which outlines the Committee’s authority, duties, responsibilities and relationship with the Board is set out as Appendix B to the Corporate Governance Code and is available on the Company’s website. Information on the procedures for the selection and appointment of the external auditor, and for the rotation of external audit engagement partners, is set out in section 9 of the Corporate Governance Code.
There were three Audit and Risk Committee Meetings held during the year which were attended by all then-current members of the committee.
For the annual and half-year accounts released publicly, the Board has received assurances from the Chief Executive Officer and the Chief Financial Officer that, in their opinion, the financial records of the Company and the consolidated group have been properly maintained; the financial statements and notes required by accounting standards for external reporting give a true and fair view of the financial position and performance of the Company and the consolidated group, and comply with the accounting standards and any further legislative requirements and the representations are based on a sound system of risk management and internal control and the system is operating effectively in all material respects in relation to financial reporting risks.
Deloitte acts as the Company’s external auditor, attends the Company’s Annual Meeting and is available to answer questions from shareholders relevant to the audit.
PRINCIPLE 5: MAKE TIMELY AND BALANCED DISCLOSURE
The Company has a written policy that is designed to ensure compliance with the NZSX Main Board Listing Rule and ASX Listing Rule disclosure requirements and to ensure accountability at a senior executive level for that compliance. The General Counsel is responsible for the Company’s compliance with statutory and NZSX and ASX continuous disclosure requirements and the Board is advised of, and considers, continuous disclosure issues at each Board meeting.
The Company’s Continuous Disclosure Policy is set out as Appendix F to the Corporate Governance Code and is available on the Company’s website.
PRINCIPLE 6: RESPECT THE RIGHTS OF SECURITY HOLDERS
Respecting the rights of shareholders is of fundamental importance to the Company and a key element of this is how the Company communicates to its shareholders. To this end, the Company recognises that shareholders must receive relevant information in a timely manner in order to properly and effectively exercise their rights as shareholders.
Information is communicated to shareholders in the Annual Report and the Interim Report. The Board has adopted a policy of continuous disclosure to ensure that it complies with the NZSX and ASX Listing Rules. The Board encourages full participation of shareholders at the Company meetings to ensure a high level of accountability and identification with the Group’s strategies and goals, including encouraging shareholders to attend meetings, giving advanced notice of the dates of all scheduled meetings, inviting shareholders to submit questions in advance and allowing time at meetings for shareholders to speak on any resolutions and ask questions of the Board. Investors are provided with information on the Company from its website. The website contains recent NZSX and ASX announcements and reports. Shareholders are also given the option to

EBO
S Group Lim
ited | Annual Report 2017
85
receive communication from, and send communications to, the Company and its security registry electronically.
The Company has an investor relations program, which aims to provide information that will allow existing shareholders, potential shareholders and financial analysts to make informed decisions about the Company. This program is governed by a set of shareholder participation principles that are designed to promote effective communication with shareholders and encourage shareholder participation at general meetings. These principles are set out in section 12 of the Corporate Governance Code which is available on the Company’s website.
PRINCIPLE 7: RECOGNISE AND MANAGE RISK
The Company has established an Audit and Risk Committee whose purpose is to, among other things, assist the Board in discharging its responsibility to exercise due care, diligence and skill in relation to identifying and monitoring material business risks. A summary of the functions of the Audit and Risk Committee is set out in the Audit and Risk Committee Charter which is set out as Appendix B to the Corporate Governance Code and available on the Company’s website.
The members of the Audit and Risk Committee and their independence is noted above and the number of times they met is noted below.
The management team reports to the Board and/or the Audit and Risk Committee on whether the Company’s material business risks are being managed effectively.
The Audit and Risk Committee is required to review the Company’s risk management framework annually to satisfy itself that it continues to be sound, with the last such review undertaken in August 2017.
The Company does not have an internal audit function other than the oversight undertaken by the Audit and Risk Committee. However, the Company has appointed KPMG to act as the Company’s internal auditor by reviewing specific areas of the business each year under a program approved by the Audit and Risk Committee to provide the Company with an independent and objective evaluation of the Company’s management of risk.
The EBOS Group external auditor, Deloitte, was reappointed on 27 October 2015. Deloitte is invited to all
Audit and Risk Committee meetings and all Audit and Risk Committee papers are made available to Deloitte.
Deloitte attends the Company’s Annual Meeting and a representative is available to answer questions from shareholders relevant to that audit at, or ahead of, the Annual Meeting.
EBOS Group defines risk management as the identification, assessment and treatment of risks that have the potential to materially impact the Group’s operations, people, and reputation, the environment and communities in which the Group works, and the financial prospects of the Group.
EBOS Group’s risk management framework is tailored to its business, embedded largely within existing processes and aligned to the Company’s objectives, both short and longer term. Given the diversity of the Group’s operations a wide range of risk factors have the potential to affect the achievement of business objectives. Key risks are set out below, together with the Group’s approach to managing those risks.
Competition risk: EBOS Group operates in a competitive environment and, as such, may experience increased competition that could adversely affect EBOS Group’s sales, operating margins and market share.
Risk management: The risk of increased competition in the markets that EBOS operates in is ever present and to a large extent outside the control of management. The Group has a continued focus on its operating performance to ensure that it continues to service the needs of its customers whilst at the same time delivering acceptable returns to shareholders.
Reliance on key suppliers: A material proportion of EBOS Group’s inbound supplies is derived from key suppliers in several of its markets. If any key suppliers ceased supplying to EBOS Group or materially reduced the amount of these supplies, the result could be a negative impact on the financial performance of EBOS Group.
Risk management: There is the possibility of competition for supply of wholesale services with suppliers choosing to bypass the existing wholesale network. This happened in Australia when Pfizer decided to distribute their retail pharmacy products directly in 2011. The Group is focussed on maintaining its critical supplier relationships by active engagement programs.

86
Price regulatory risk: The commercial success of EBOS is partly dependent on the achievement of acceptable pricing and margins for the goods and services it provides. EBOS Group operates in a number of highly regulated industry segments, relating to the distribution and supply of pharmaceutical and medical products and as such, EBOS Group is continually exposed to the risk of new government policies, regulations and legislation that may impact on both the pricing of products and its resulting profitability.
Risk management: The pharmaceutical distribution industry is subject to significant regulation and government reform. The Australian government’s reforms to the Pharmaceutical Benefits Scheme (PBS) over many years has had and continues to have the effect of lowering the prices paid for medicines that have been genericised, thereby lowering the distribution margin earned by the Group. The Group has no control over these price adjustments and to date has offset the impact of lower distribution margin by reducing operating costs and customer discounts. As the regulated adjustment to medicine prices continues, the Group is focused on adjusting its business model that best meets its objectives however, there is no guarantee that it will always be in a position to offset the lost margin from these reforms.
Industry regulatory risk: The financial performance of EBOS may be materially affected by changes in government regulations with respect to the pharmacy industry in Australia and New Zealand, including the Community Service Obligation (CSO) funding in Australia. Any material adverse change in the basis of the CSO funding, the performance criteria, the achievement of performance criteria, or the termination of Symbion’s CSO deed, would have a material negative impact on the financial performance of EBOS Group.
Risk management: Symbion Pty Ltd, a wholly owned subsidiary of EBOS Group, is a signatory to the CSO deed which governs the arrangements under which the Group distributes medicines around Australia in return for access to a pool of funding that subsidises the distribution of pharmaceuticals to rural and remote parts of Australia. Failure to meet the obligations under this deed or other state-based legislation, may result in restricted or no access to the CSO pool of funding, fines or loss of licence to distribute pharmaceuticals. The Group reports and reviews its compliance with regulations to ensure all obligations are met. The Group’s operations are also subject to separate external audit by the CSO Agency. If at any point in the
future the government decided to reduce the amount of funding provided under the CSO deed then the Group may need to reconsider its business model and determine whether being a signatory to the CSO continues to be commercially viable.
Risk of change to industry structure: Future potential changes to the structure of the pharmaceutical industry in Australia or New Zealand may have a material impact on EBOS Group’s margins and financial performance.
Risk management: Retail pharmacy in Australia and New Zealand is subject to significant government regulation. This regulation governs the rules on both pharmacy ownership and location rules. If the government were to change either the ownership or location rules then this could have a significant impact on the Group’s operations and financial position. The Group has no control over the government’s approach to regulation of these matters but does actively engage with government on the benefits of the current model.
Currency risk: EBOS Group’s operations are primarily in New Zealand and Australia. Foreign exchange risk arises when future commercial transactions and recognised assets and liabilities are denominated in a currency that is not the primary currency for the Group’s operations. The Group makes purchases in foreign currencies such as the US dollar and the Euro and is therefore exposed to foreign exchange risk arising from movements in exchange rates.
EBOS Group’s presentation currency is New Zealand dollars. EBOS Group is exposed to currency translation risk on conversion of earnings in Australian dollars to New Zealand dollars. This may have the impact of either increasing or decreasing the expected earnings from EBOS Group.
Risk management: To manage the currency risk in respect of both revenue and expenses, EBOS Group may hedge a percentage of its net foreign currency exposures using forward foreign exchange contracts and/or foreign exchange options to reduce the variability from changes in EBOS Group’s net operating income and cash flows to acceptable parameters. Such hedging does not, however, guarantee a more favourable outcome than that achieved by not hedging.
The Group does not hedge the translation risk that arises upon conversion of its overseas based operations into New Zealand dollars.

EBO
S Group Lim
ited | Annual Report 2017
87
Impairment risk: EBOS Group carries significant goodwill and intangible assets on its balance sheet. Accounting policies require that these assets be regularly tested for impairment and that the underlying assumptions supporting their carrying value be confirmed. There is a risk that the carrying balances for goodwill and/or intangibles may become impaired in the future which would have an adverse effect on EBOS Group’s financial position.
Risk management: Whether the Group experiences a write down in the carrying value of its intangibles will largely depend on the operating performance of the business with which those intangibles are associated. The Group conducts an annual test for impairment on the value of all goodwill and indefinite life intangible assets, including the underlying assumptions using a discounted cash flow analysis.
PRINCIPLE 8: REMUNERATE FAIRLY AND RESPONSIBLY
The Company has established a Remuneration Committee, the current members of which are Mark Waller, Elizabeth Coutts and Sarah Ottrey. Mark Waller is the Chair of the Remuneration Committee. The Remuneration Committee’s Charter which outlines the Committee’s authority, duties, responsibility and relationship with the Board is set out as Appendix C to the Corporate Governance Code and is available on the Company’s website.
There were two Remuneration Committee meetings held during the year which were attended by all then-current members of the committee.
The Company’s policies and approach to remuneration issues are outlined in section 10 of the Corporate Governance Code.
EBOS operates a long term incentive share plan for senior executives. Under the rules for the plan, a participating executive must not enter into an arrangement with anyone, including a derivative or hedging arrangement, if the arrangement would have the effect of limiting the exposure of the participant to risk relating to unvested shares.
ANNUAL MEETING
The Annual Meeting of Shareholders will be held at Addington Raceway Events Centre, 75 Jack Hinton Drive, Addington, Christchurch, New Zealand, at 2:00pm on Tuesday, 17 October 2017.

88
SHARE DEALINGS BY DIRECTORS
The directors have disclosed to the Board under section 148(2) of the Companies Act 1993 particulars of acquisitions or disposals of a relevant interest in the Company’s shares.
DISCLOSURE OF INTERESTS BY DIRECTORS
In accordance with section 140(2) of the Companies Act 1993, the directors named below have made general disclosure of interest, by a general notice disclosed to the Board and entered in the Company’s interests register, as follows:
E.M. Coutts, ONZM: Chair of Urwin & Co Ltd, Oceania Healthcare Ltd, Ports of Auckland Ltd and Skellerup Holdings Ltd, Director of Yellow Pages group of companies, Sanford Ltd, and Tennis Auckland Region Incorporated, Member, Marsh New Zealand Advisory Board and President, Institute of Directors Inc.
S.J. McGregor: Chairman of Donaco International Ltd, Powerlift Australia Pty Ltd, C B Norwood Pty Ltd and director of Symbion Pty Ltd.
S.C. Ottrey: Director of Comvita Ltd, Whitestone Cheese Ltd, Skyline Enterprises Limited and Sarah Ottrey Marketing Ltd.
M.B. Waller: Director of EBOS Group Ltd subsidiaries and Scott Technology Ltd.
P.J. Williams: Executive of The Zuellig Group and associated companies, a director of Pharma Industries Ltd, C B Norwood Pty Ltd, Cambert and Green Cross Health Limited.
Former Directors
P.F. Kraus: Director of Whyte Adder No.3 Ltd, Herpa Properties Ltd, Ecostore Company Ltd and Peton Villas Ltd.
B.J. Wallace: Director of Allum Management Services Ltd, Whyte Adder No 3 Ltd, Herpa Properties Ltd, Ecostore Company Ltd, Peton Villas Ltd and BeGroup New Zealand Limited.
Directors’ Interests

EBO
S Group Lim
ited | Annual Report 2017
89
Directors’ Disclosures
There were no notices from directors of the Company requesting to use Company information received in their capacity as directors, which would not otherwise have been available to them.
SHARE DEALINGS BY DIRECTORS
DIRECTORS’ SHAREHOLDINGS
DirectorOrdinary Shares
Purchased/(Sold)Consideration
Paid/(Received)Date of
Transaction
E M Coutts 1,000 $17,750 14 September 2016
Number of fully paid shares held as at 30 June 2017 30 June 2016
Current Directors
E M Coutts - Indirect beneficial interest 28,296 27,296
S C Ottrey - Directly held together with another 8,079 8,079
- Indirect beneficial interest 3,050 3,050
M B Waller - Directly held together with others 535,265 535,265
- Direct non-beneficial interest/trustee of EBOS Staff Share Plan 71,592 71,592
Former Directors
P F Kraus* - Directly held 1,535 1,535
- Held by associated persons 3,596,425 3,596,425
B J Wallace^ - Non beneficially held – Director of Whyte Adder No.3 Ltd/Herpa Properties Ltd
3,596,425 3,596,425
* Mr Kraus ceased to be a director of EBOS Group Limited during the year ended 30 June 2017.^ Mr Wallace ceased to be a director of EBOS Group Limited during the year ended 30 June 2017.

90
Board Audit & Risk Remuneration
Eligibleto Attend Attended
Eligibleto Attend Attended
Eligibleto Attend Attended
E M Coutts 8 8 3 3 2 2
S C Ottrey 8 8
S J McGregor 8 8
M B Waller 8 8 3 3 2 2
P J Williams 8 8
P F Kraus* 5 3
B J Wallace^ 3 3 1 1
ATTENDANCE AT BOARD AND COMMITTEE MEETINGS
INDEMNITY AND INSURANCE
In accordance with section 162 of the Companies Act 1993 and the constitution of the Company, the Company has given indemnities to, and has effected insurance for, the directors and executives of the Company and its related companies which, except for some specific matters that are expressly excluded, indemnify and insure directors and executives against monetary losses as a result of actions undertaken by them in the course of their duties. Specifically excluded are certain matters, such as the incurring of penalties and fines, which may be imposed for breaches of law.
DIRECTORS’ REMUNERATION AND OTHER BENEFITS
Directors’ remuneration and other benefits required to be disclosed pursuant to section 211(1) of the Companies Act 1993 for the year ended 30 June 2017 were as follows:
GENDER COMPOSITION
As at 30 June 2017:
• two of the directors of the Company were female (2016:2) and 3 of the directors were male (2016:5); and
• one senior management position was held by a female (2016:1) and ten senior management positions were held by males (2016:11).
* Mr Kraus ceased to be a director of EBOS Group Limited during the year ended 30 June 2017.^ Mr Wallace ceased to be a director of EBOS Group Limited during the year ended 30 June 2017.There were no meetings held of the Nomination Committee during the year ended 30 June 2017.
* Mr Waller ceased to be an executive director in October 2015. The amount paid to Mr Waller for the year ended 30 June 2016 includes salary paid to Mr Waller as an executive and director’s fees paid to Mr Waller after he ceased to be an executive.
^ Mr Kraus ceased to be a director of EBOS Group Limited during the year ended 30 June 2017.^^ Mr Wallace ceased to be a director of EBOS Group Limited during the year ended 30 June 2017.
30 June 2017 30 June 2016
E M Coutts $125,500 $120,000
S J McGregor $110,833 $110,000
S C Ottrey $110,250 $110,000
M B Waller* $235,000 $599,798
P J Williams $110,000 $110,000
P F Kraus^ $94,555 $110,000
B J Wallace^^ $56,333 $128,000

EBO
S Group Lim
ited | Annual Report 2017
91
EMPLOYEE REMUNERATION
Grouped below, in accordance with Section 211 of the Companies Act 1993, are the number of employees or former employees of the Company and its subsidiaries, including those based in Australia, who received remuneration and other benefits in their capacity as employees totalling NZ$100,000 or more during the year.
Employee Remuneration (NZ$) 30 June 2017 Number of Employees
100,000 – 110,000 80
110,000 – 120,000 67
120,000 – 130,000 52
130,000 – 140,000 52
140,000 – 150,000 27
150,000 – 160,000 36
160,000 – 170,000 29
170,000 – 180,000 15
180,000 – 190,000 18
190,000 – 200,000 12
200,000 – 210,000 6
210,000 – 220,000 7
220,000 – 230,000 6
230,000 – 240,000 7
240,000 – 250,000 3
250,000 – 260,000 2
260,000 – 270,000 4
270,000 – 280,000 2
280,000 – 290,000 3
290,000 – 300,000 3
300,000 – 310,000 3
310,000 – 320,000 1
320,000 – 330,000 5
330,000 – 340,000 4
340,000 – 350,000 1
350,000 – 360,000 3
370,000 – 380,000 1
380,000 – 390,000 1
390,000 – 400,000 1
400,000 – 410,000 2
420,000 – 430,000 1

92
AUDITOR
The Company’s Auditor, Deloitte, will continue in office in accordance with the Companies Act 1993.
The directors are satisfied that the provision of non-audit services, during the year by the auditor is compatible with the general standard of independence for auditors imposed by the Companies Act 1993. Details of amounts paid or payable to the auditor for non-audit services provided during the year by the auditor are outlined in H5 of the financial statements.
Employee Remuneration (NZ$) 30 June 2017 Number of Employees
430,000 – 440,000 1
460,000 – 470,000 1
550,000 – 560,000 1
590,000 – 600,000 1
720,000 – 730,000 1
730,000 – 740,000 1
760,000 – 770,000 1
770,000 – 780,000 1
820,000 – 830,000 1
910,000 – 920,000 1
940,000 – 950,000 1
1,170,000 – 1,180,000 1
2,330,000 – 2,340,000 1
M B WallerChairman of Directors
E M CouttsDirector

EBO
S Group Lim
ited | Annual Report 2017
93
REGISTERED OFFICES
108 Wrights Road PO Box 411 Christchurch 8024 New Zealand Telephone +64 3 338 0999 E-mail: [email protected]
Level 7, 737 Bourke Street Docklands 3008 PO Box 7300 Melbourne 8004 Australia Telephone +61 3 9918 5555 E-mail: [email protected]
WEBSITE ADDRESS
www.ebosgroup.com
DIRECTORS
Mark Waller Chairman
Elizabeth Coutts Independent Director
Stuart McGregor
Sarah Ottrey Independent Director
Peter Williams
SENIOR EXECUTIVES
Patrick Davies Chief Executive Officer
Brett Barons Executive General Manager, Pharmacy
Andrea Bell Chief Information Officer
Michael Broome Group General Manager, HCL and Symbion Contract Logistics
Simon Bunde General Manager, Group Operations & Strategy
John Cullity Chief Financial Officer
Sean Duggan Chief Executive Officer, Animal Care
Tim Goldenberg Chief Human Resources Officer
David Lewis General Manager, Onelink Australia
Stuart Spencer Executive General Manager, Institutional Healthcare
Andrew Vidler Executive General Manager, Endeavour Consumer Health
AUDITOR
Deloitte Limited Christchurch
SECURITIES EXCHANGE
EBOS Group Limited shares are quoted on the New Zealand Securities Exchange and the Australian Securities Exchange (NZX/ASX code: EBO).
SHARE REGISTER
Computershare Investor Services Ltd Private Bag 92119 Auckland 1142 New Zealand Telephone: +64 9 488 8777
Computershare Investor Services Pty Ltd GPO Box 3329 Melbourne, Victoria 3001 Australia Telephone: 1800 501 366
MANAGING YOUR SHAREHOLDING ONLINE:
To change your address, update your payment instructions and to view your Investment portfolio, including transactions, please visit:
www.computershare.com/investorcentre
General enquiries can be directed to:
• Private Bag 92119, Auckland 1142, New Zealand or GPO Box 3329, Melbourne, Victoria 3001, Australia
• Telephone (NZ) +64 9 488 8777 or (Aust) 1800 501 366
• Facsimile (NZ) +64 9 488 8787 or (Aust) +61 3 9473 2500
Please assist our registrar by quoting your CSN or shareholder number.
NOTICE OF ANNUAL MEETING
The Annual Meeting of Shareholders will be held at Addington Raceway and Events Centre, 75 Jack Hinton Drive, Addington, Christchurch, New Zealand, at 2:00pm on Tuesday, 17 October 2017.
Directory

94
www.ebosgroup.com