EBIT - Danske Commodities · 6 FINANCIAL HIGHLIGHTS Danske Commodities Annual Report 2018 FINANCIAL...
39
ANNUAL REPORT 2018
Transcript of EBIT - Danske Commodities · 6 FINANCIAL HIGHLIGHTS Danske Commodities Annual Report 2018 FINANCIAL...
ANNUAL REPORT 2018
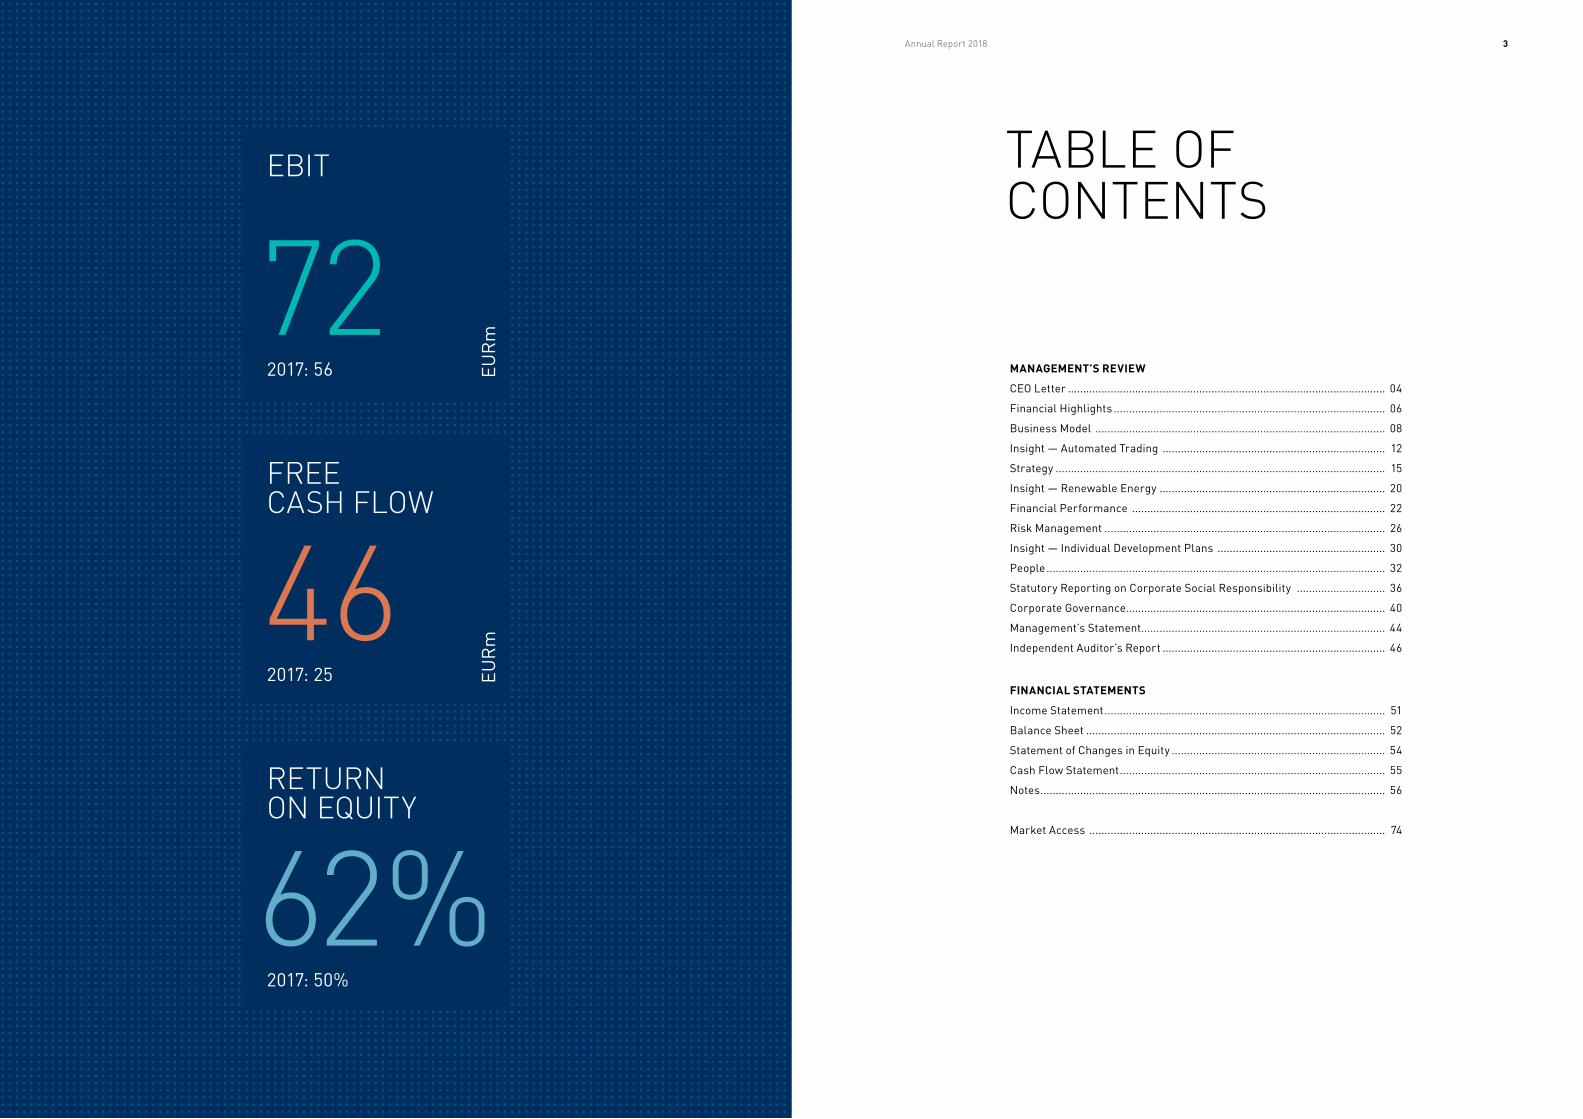
EBIT
2017: 56
72FREE CASH FLOW
2017: 25
RETURN ON EQUITY
2017: 50%
EUR
mEU
Rm
46
62%
3Annual Report 2018
TABLE OF CONTENTS
MANAGEMENT’S REVIEW
CEO Letter ........................................................................................................ 04
Financial Highlights ......................................................................................... 06
Business Model ............................................................................................... 08
Insight — Automated Trading ......................................................................... 12
Strategy ............................................................................................................ 15
Insight — Renewable Energy .......................................................................... 20
Financial Performance ................................................................................... 22
Risk Management ............................................................................................ 26
Insight — Individual Development Plans ....................................................... 30
People ............................................................................................................... 32
Statutory Reporting on Corporate Social Responsibility ............................. 36
Corporate Governance..................................................................................... 40
Management’s Statement ................................................................................ 44
Independent Auditor’s Report ......................................................................... 46
FINANCIAL STATEMENTS
Income Statement ............................................................................................ 51
Balance Sheet .................................................................................................. 52
Statement of Changes in Equity ...................................................................... 54
Cash Flow Statement ....................................................................................... 55
Notes ................................................................................................................. 56
Market Access ................................................................................................. 74
CEO LETTER4 Danske Commodities
I am pleased to present Danske Commodities’ 2018 Annual Report. It has truly been an exceptional year for our company; we captured opportunities in favourable market conditions and delivered the strongest financial results in company history. At the same time, 2018 marked the beginning of a new journey for Danske Commodities. We launched a new three-year corporate strategy and were acquired by Equinor, the Norwegian multinational energy company. Becoming a part of Equinor gives us new opportunities to develop our business on a global scale.
STRONG VOLUME, REVENUE AND PROFIT PERFORMANCEIn volatile energy markets characterised by extreme weather conditions in 2018, Danske Commodities bene-fitted from its short response time and efficient opera-tional setup, generating EBIT of EUR 72 million, an increase of 28% on 2017. The performance was driven by a significant increase in volumes traded and higher energy prices, enabling us to grow our revenue by 71% from EUR 5,472 million in 2017 to EUR 9,377 million in 2018. Gross profit was up 19% to EUR 123 million, while the cost base increased slightly due to a higher activity level and an increased average number of employees.
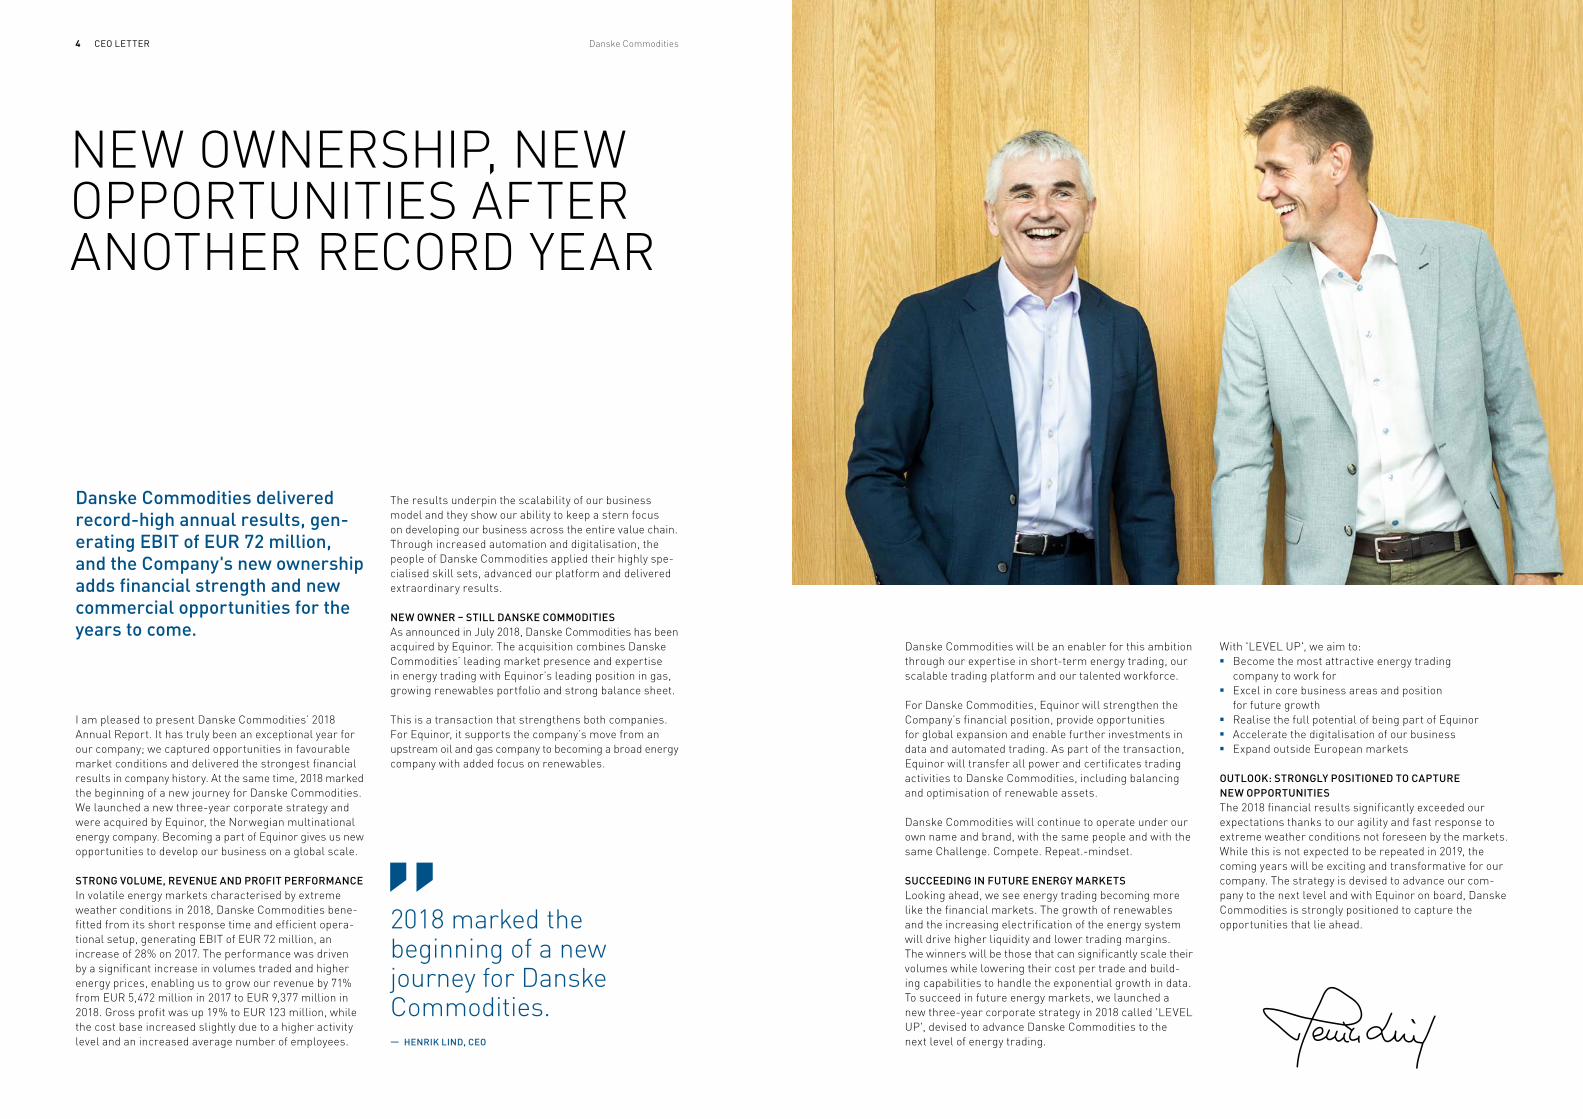
2018 marked the beginning of a new journey for Danske Commodities.— HENRIK LIND, CEO
NEW OWNERSHIP, NEW OPPOR TUNITIES AFTER ANOTHER RECORD YEAR
Danske Commodities delivered record-high annual results, gen-erating EBIT of EUR 72 million, and the Company's new ownership adds financial strength and new commercial opportunities for the years to come.
Danske Commodities will be an enabler for this ambition through our expertise in short-term energy trading, our scalable trading platform and our talented workforce.
For Danske Commodities, Equinor will strengthen the Company’s financial position, provide opportunities for global expansion and enable further investments in data and automated trading. As part of the transaction, Equinor will transfer all power and certificates trading activities to Danske Commodities, including balancing and optimisation of renewable assets.
Danske Commodities will continue to operate under our own name and brand, with the same people and with the same Challenge. Compete. Repeat.-mindset.
SUCCEEDING IN FUTURE ENERGY MARKETS Looking ahead, we see energy trading becoming more like the financial markets. The growth of renewables and the increasing electrification of the energy system will drive higher liquidity and lower trading margins. The winners will be those that can significantly scale their volumes while lowering their cost per trade and build -ing capabilities to handle the exponential growth in data. To succeed in future energy markets, we launched a new three-year corporate strategy in 2018 called 'LEVEL UP', devised to advance Danske Commodities to the next level of energy trading.
With 'LEVEL UP', we aim to: ■ Become the most attractive energy trading
company to work for ■ Excel in core business areas and position
for future growth■ Realise the full potential of being part of Equinor■ Accelerate the digitalisation of our business ■ Expand outside European markets
OUTLOOK: STRONGLY POSITIONED TO CAPTURE NEW OPPORTUNITIESThe 2018 financial results significantly exceeded our expectations thanks to our agility and fast response to extreme weather conditions not foreseen by the markets. While this is not expected to be repeated in 2019, the coming years will be exciting and transformative for our company. The stra tegy is devised to advance our com-pany to the next level and with Equinor on board, Danske Commodities is strongly positioned to capture the opportunities that lie ahead.
The results underpin the scalability of our business model and they show our ability to keep a stern focus on developing our business across the entire value chain. Through increased automation and digitalisation, the people of Danske Commodities applied their highly spe-cialised skill sets, advanced our platform and delivered extraordinary results.
NEW OWNER – STILL DANSKE COMMODITIESAs announced in July 2018, Danske Commodities has been acquired by Equinor. The acquisition combines Danske Commodities’ leading market presence and expertise in energy trading with Equinor’s leading position in gas, growing renewables portfolio and strong balance sheet.
This is a transaction that strengthens both companies. For Equinor, it supports the company’s move from an up stream oil and gas company to becoming a broad energy company with added focus on renewables.
FINANCIAL HIGHLIGHTS FINANCIAL HIGHLIGHTS6 7Danske Commodities Annual Report 2018
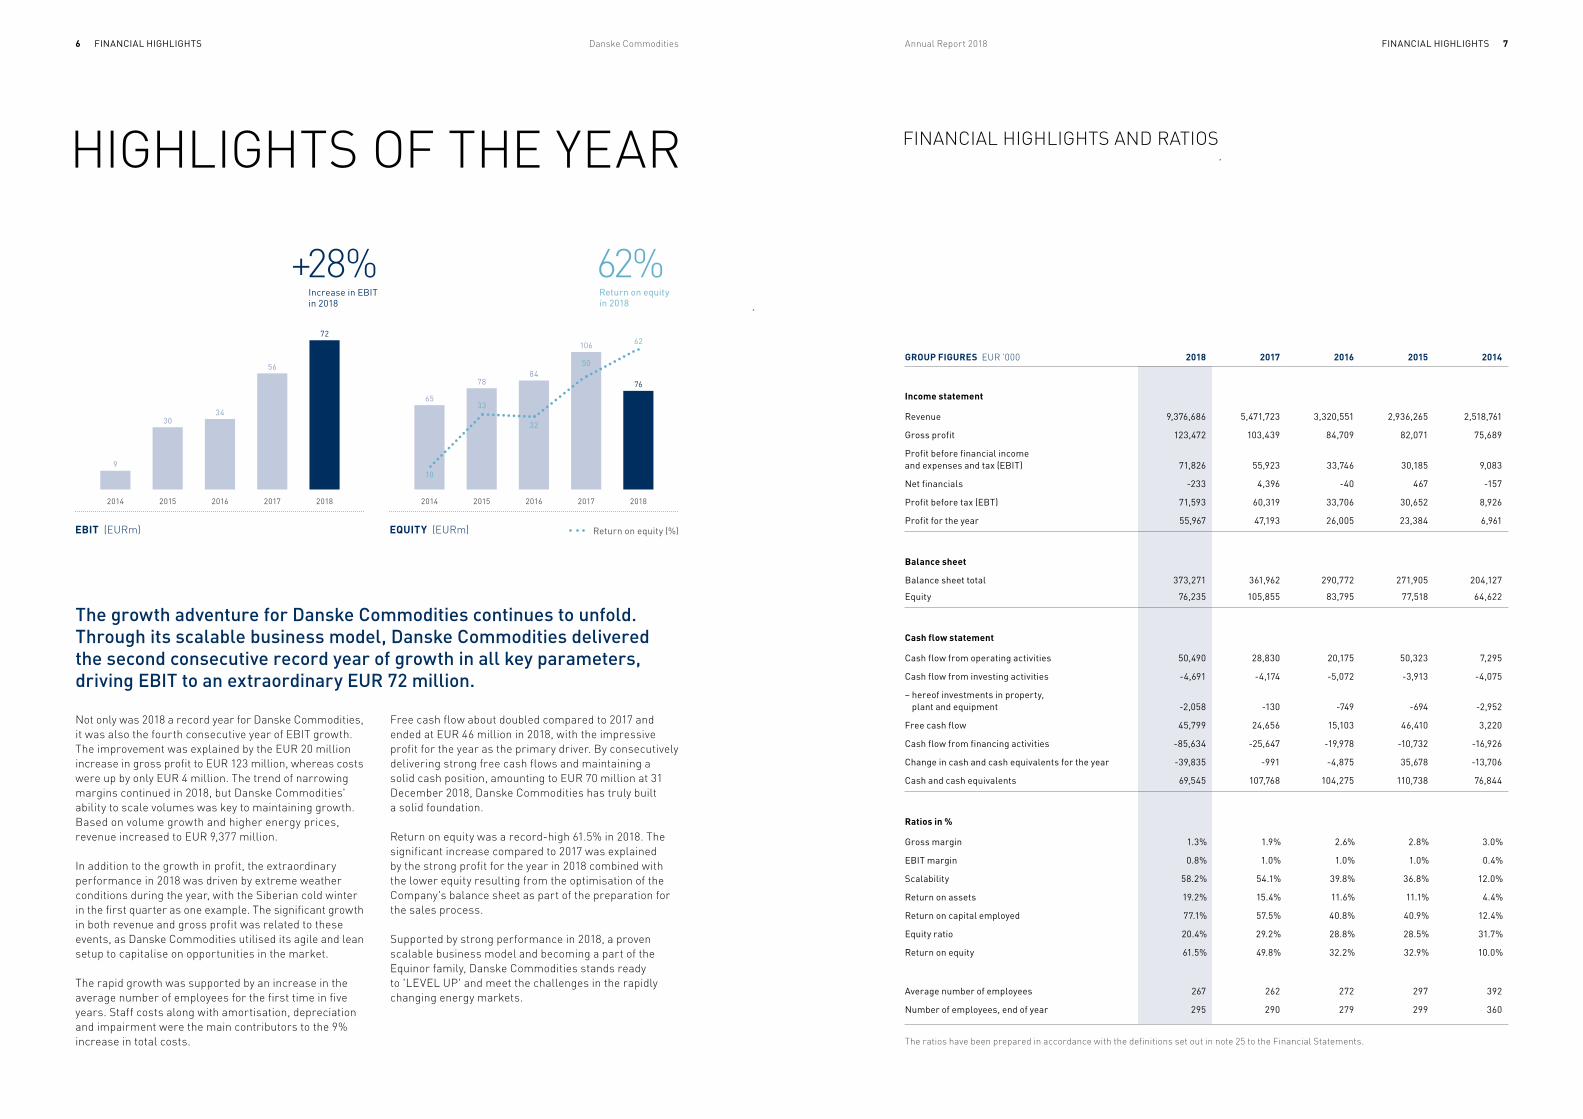
Not only was 2018 a record year for Danske Commodities, it was also the fourth consecutive year of EBIT growth. The improvement was explained by the EUR 20 million increase in gross profit to EUR 123 million, whereas costs were up by only EUR 4 million. The trend of narrowing margins continued in 2018, but Danske Commodities' ability to scale volumes was key to maintaining growth. Based on volume growth and higher energy prices, revenue increased to EUR 9,377 million.
In addition to the growth in profit, the extraordinary performance in 2018 was driven by extreme weather conditions during the year, with the Siberian cold winter in the first quarter as one example. The significant growth in both revenue and gross profit was related to these events, as Danske Commodities utilised its agile and lean setup to capitalise on opportunities in the market.
The rapid growth was supported by an increase in the average number of employees for the first time in five years. Staff costs along with amortisation, depreciation and impairment were the main contributors to the 9% increase in total costs.
FINANCIAL HIGHLIGHTS AND RATIOSHIGHLIGHTS OF THE YEAR
The growth adventure for Danske Commodities continues to unfold. Through its scalable business model, Danske Commodities delivered the second consecutive record year of growth in all key parameters, driving EBIT to an extraordinary EUR 72 million.
Free cash flow about doubled compared to 2017 and ended at EUR 46 million in 2018, with the impressive profit for the year as the primary driver. By consecutively delivering strong free cash flows and maintaining a solid cash position, amounting to EUR 70 million at 31 December 2018, Danske Commodities has truly built a solid foundation.
Return on equity was a record-high 61.5% in 2018. The sig nificant increase compared to 2017 was explained by the strong profit for the year in 2018 combined with the lower equity resulting from the optimisation of the Company's balance sheet as part of the preparation for the sales process.
Supported by strong performance in 2018, a proven scalable business model and becoming a part of the Equinor family, Danske Commodities stands ready to 'LEVEL UP' and meet the challenges in the rapidly changing energy markets.
GROUP FIGURES EUR ’000 2018 2017 2016 2015 2014
Income statement
Revenue 9,376,686 5,471,723 3,320,551 2,936,265 2,518,761
Gross profit 123,472 103,439 84,709 82,071 75,689
Profit before financial income and expenses and tax (EBIT) 71,826 55,923 33,746 30,185 9,083
Net financials -233 4,396 -40 467 -157
Profit before tax (EBT) 71,593 60,319 33,706 30,652 8,926
Profit for the year 55,967 47,193 26,005 23,384 6,961
Balance sheet
Balance sheet total 373,271 361,962 290,772 271,905 204,127
Equity 76,235 105,855 83,795 77,518 64,622
Cash flow statement
Cash flow from operating activities 50,490 28,830 20,175 50,323 7,295
Cash flow from investing activities -4,691 -4,174 -5,072 -3,913 -4,075
– hereof investments in property, plant and equipment -2,058 -130 -749 -694 -2,952
Free cash flow 45,799 24,656 15,103 46,410 3,220
Cash flow from financing activities -85,634 -25,647 -19,978 -10,732 -16,926
Change in cash and cash equivalents for the year -39,835 -991 -4,875 35,678 -13,706
Cash and cash equivalents 69,545 107,768 104,275 110,738 76,844
Ratios in %
Gross margin 1.3% 1.9% 2.6% 2.8% 3.0%
EBIT margin 0.8% 1.0% 1.0% 1.0% 0.4%
Scalability 58.2% 54.1% 39.8% 36.8% 12.0%
Return on assets 19.2% 15.4% 11.6% 11.1% 4.4%
Return on capital employed 77.1% 57.5% 40.8% 40.9% 12.4%
Equity ratio 20.4% 29.2% 28.8% 28.5% 31.7%
Return on equity 61.5% 49.8% 32.2% 32.9% 10.0%
Average number of employees 267 262 272 297 392
Number of employees, end of year 295 290 279 299 360
The ratios have been prepared in accordance with the definitions set out in note 25 to the Financial Statements.
20182014
9
2014
65
10
2015
7884
2016 2017
106
2015
30
2016
34
2017
56
2018
72
76
EBIT (EURm) EQUITY (EURm) Return on equity (%)
Return on equity in 2018
33
62%Increase in EBIT in 2018
+28%
32
62
50
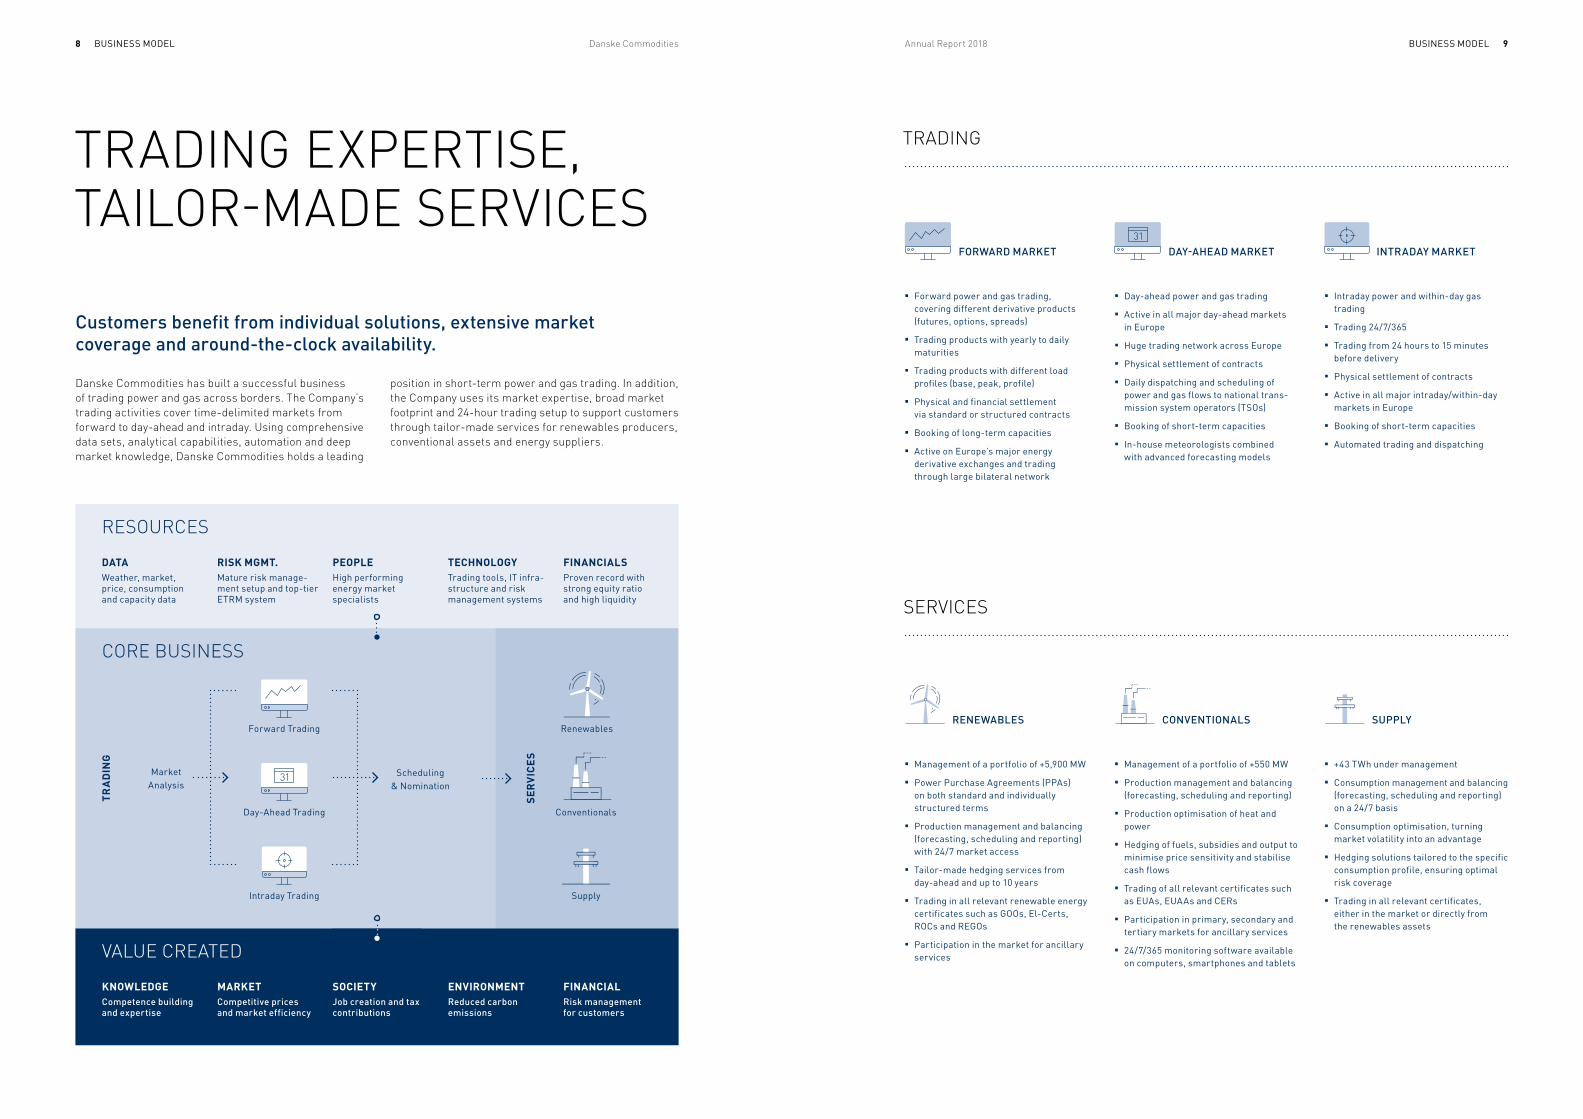
VALUE CREATED
KNOWLEDGECompetence building and expertise
MARKETCompetitive prices and market efficiency
SOCIETYJob creation and tax contributions
ENVIRONMENTReduced carbon emissions
FINANCIALRisk management for customers
RESOURCES
DATAWeather, market, price, consumption and capacity data
RISK MGMT.Mature risk manage-ment setup and top-tier ETRM system
PEOPLEHigh performing energy market specialists
TECHNOLOGYTrading tools, IT infra-structure and risk management systems
FINANCIALSProven record with strong equity ratio and high liquidity
CORE BUSINESS
BUSINESS MODEL BUSINESS MODEL8 9Danske Commodities Annual Report 2018
Danske Commodities has built a successful business of trading power and gas across borders. The Company’s trading activities cover time-delimited markets from forward to day-ahead and intraday. Using comprehensive data sets, analytical capabilities, automation and deep market knowledge, Danske Commodities holds a leading
■ +43 TWh under management
■ Consumption management and balancing (forecasting, scheduling and reporting) on a 24/7 basis
■ Consumption optimisation, turning market volatility into an advantage
■ Hedging solutions tailored to the specific consumption profile, ensuring optimal risk coverage
■ Trading in all relevant certificates, either in the market or directly from the renewables assets
■ Intraday power and within-day gas trading
■ Trading 24/7/365
■ Trading from 24 hours to 15 minutes before delivery
■ Physical settlement of contracts
■ Active in all major intraday/within-day markets in Europe
■ Booking of short-term capacities
■ Automated trading and dispatching
TRADING EXPERTISE,TAILOR-MADE SERVICES
Customers benefit from individual solutions, extensive market coverage and around-the-clock availability.
SUPPLY
position in short-term power and gas trading. In addition, the Company uses its market expertise, broad market footprint and 24-hour trading setup to support customers through tailor-made services for renewables producers, conventional assets and energy suppliers.
■ Management of a portfolio of +550 MW
■ Production management and balancing (forecasting, scheduling and reporting)
■ Production optimisation of heat and power
■ Hedging of fuels, subsidies and output to minimise price sensitivity and stabilise cash flows
■ Trading of all relevant certificates such as EUAs, EUAAs and CERs
■ Participation in primary, secondary and tertiary markets for ancillary services
■ 24/7/365 monitoring software available on computers, smartphones and tablets
■ Day-ahead power and gas trading
■ Active in all major day-ahead markets in Europe
■ Huge trading network across Europe
■ Physical settlement of contracts
■ Daily dispatching and scheduling of power and gas flows to national trans-mission system operators (TSOs)
■ Booking of short-term capacities
■ In-house meteorologists combined with advanced forecasting models
RENEWABLES
FORWARD MARKET
CONVENTIONALS
DAY-AHEAD MARKET INTRADAY MARKET
■ Management of a portfolio of +5,900 MW
■ Power Purchase Agreements (PPAs) on both standard and individually structured terms
■ Production management and balancing (forecasting, scheduling and reporting) with 24/7 market access
■ Tailor-made hedging services from day-ahead and up to 10 years
■ Trading in all relevant renewable energy certificates such as GOOs, El-Certs, ROCs and REGOs
■ Participation in the market for ancillary services
■ Forward power and gas trading, covering different derivative products (futures, options, spreads)
■ Trading products with yearly to daily maturities
■ Trading products with different load profiles (base, peak, profile)
■ Physical and financial settlement via standard or structured contracts
■ Booking of long-term capacities
■ Active on Europe’s major energy derivative exchanges and trading through large bilateral network
TRADING
SERVICES
SER
VIC
ES
TRA
DIN
G
Market Analysis
Scheduling & Nomination
Intraday Trading
Forward Trading
Day-Ahead Trading
Renewables
Conventionals
Supply
BUSINESS MODEL BUSINESS MODEL10 11Danske Commodities Annual Report 2018
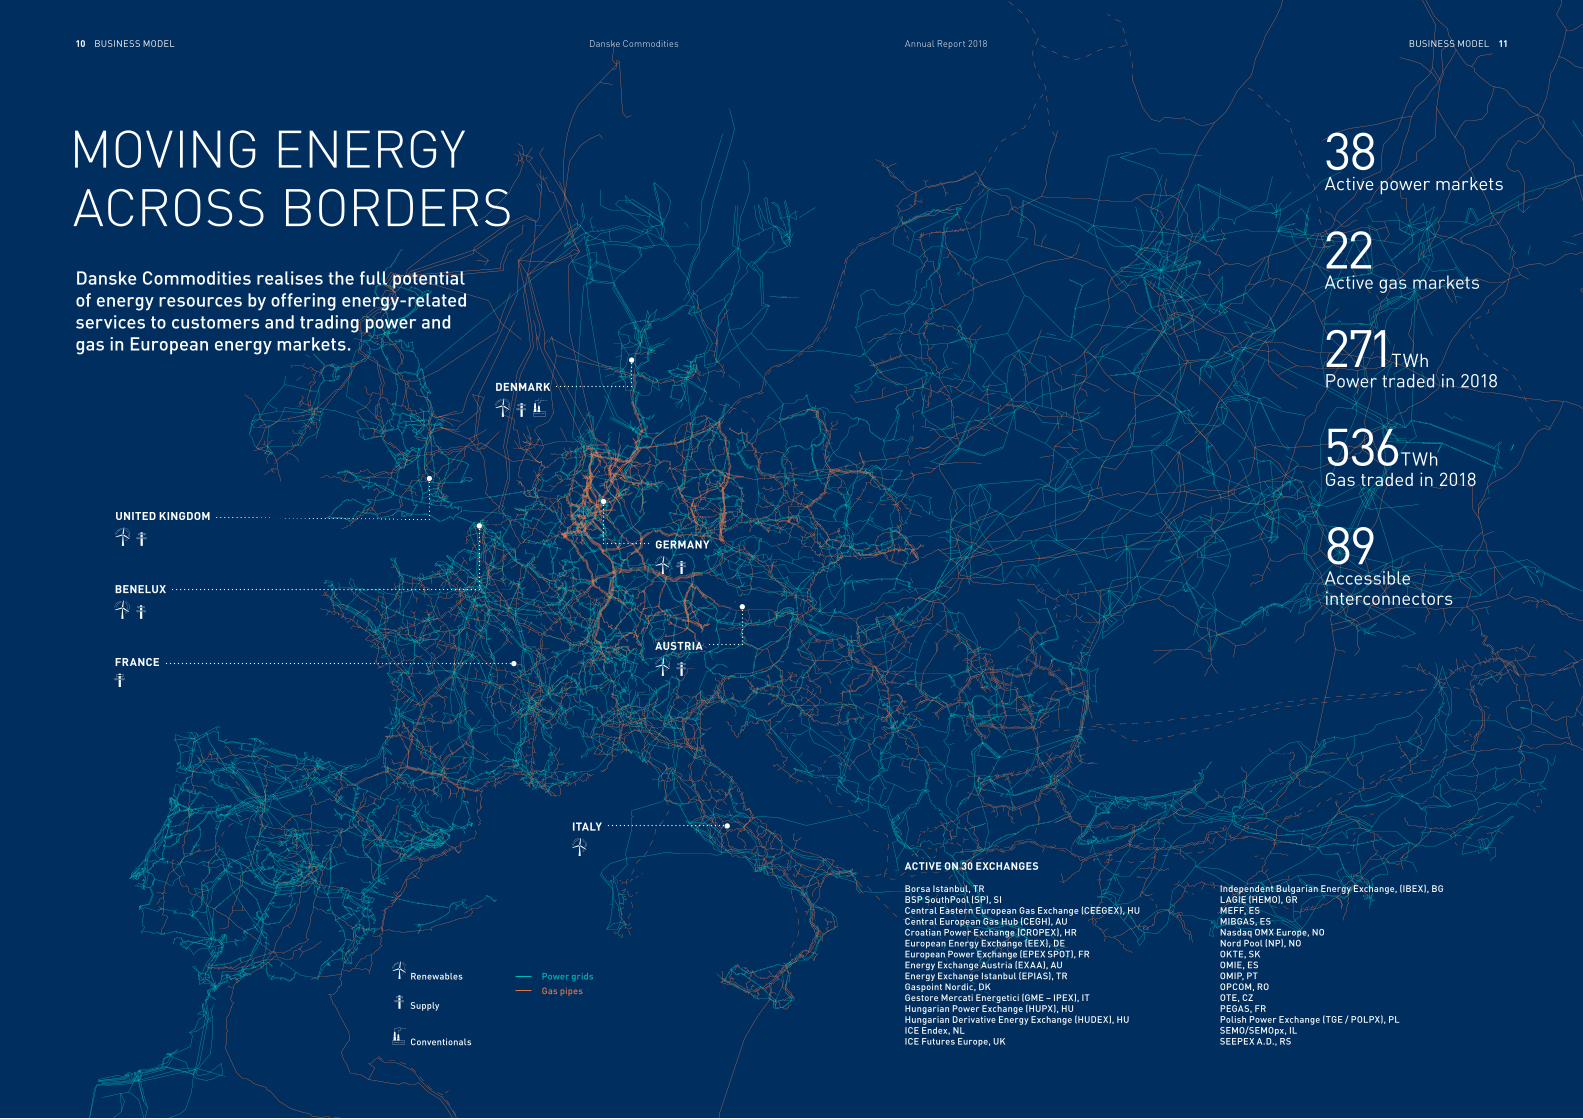
MOVING ENERGY ACROSS BORDERS
38 Active power markets
22Active gas markets
89Accessible interconnectors
271 TWh Power traded in 2018
536 TWh Gas traded in 2018
Danske Commodities realises the full potential of energy resources by offering energy-related services to customers and trading power and gas in European energy markets.
Borsa Istanbul, TRBSP SouthPool (SP), SICentral Eastern European Gas Exchange (CEEGEX), HUCentral European Gas Hub (CEGH), AUCroatian Power Exchange (CROPEX), HREuropean Energy Exchange (EEX), DEEuropean Power Exchange (EPEX SPOT), FREnergy Exchange Austria (EXAA), AUEnergy Exchange Istanbul (EPIAS), TRGaspoint Nordic, DKGestore Mercati Energetici (GME – IPEX), ITHungarian Power Exchange (HUPX), HU Hungarian Derivative Energy Exchange (HUDEX), HUICE Endex, NLICE Futures Europe, UK
Independent Bulgarian Energy Exchange, (IBEX), BGLAGIE (HEMO), GRMEFF, ESMIBGAS, ESNasdaq OMX Europe, NONord Pool (NP), NOOKTE, SKOMIE, ESOMIP, PTOPCOM, ROOTE, CZPEGAS, FRPolish Power Exchange (TGE / POLPX), PLSEMO/SEMOpx, ILSEEPEX A.D., RS
ACTIVE ON 30 EXCHANGES
UNITED KINGDOM
DENMARK
FRANCE
ITALY
BENELUX
AUSTRIA
GERMANY
Gas pipes
Power gridsRenewables
Supply
Conventionals
INSIGHT — AUTOMATED TRADING INSIGHT — AUTOMATED TRADING12 13Danske Commodities Annual Report 2018
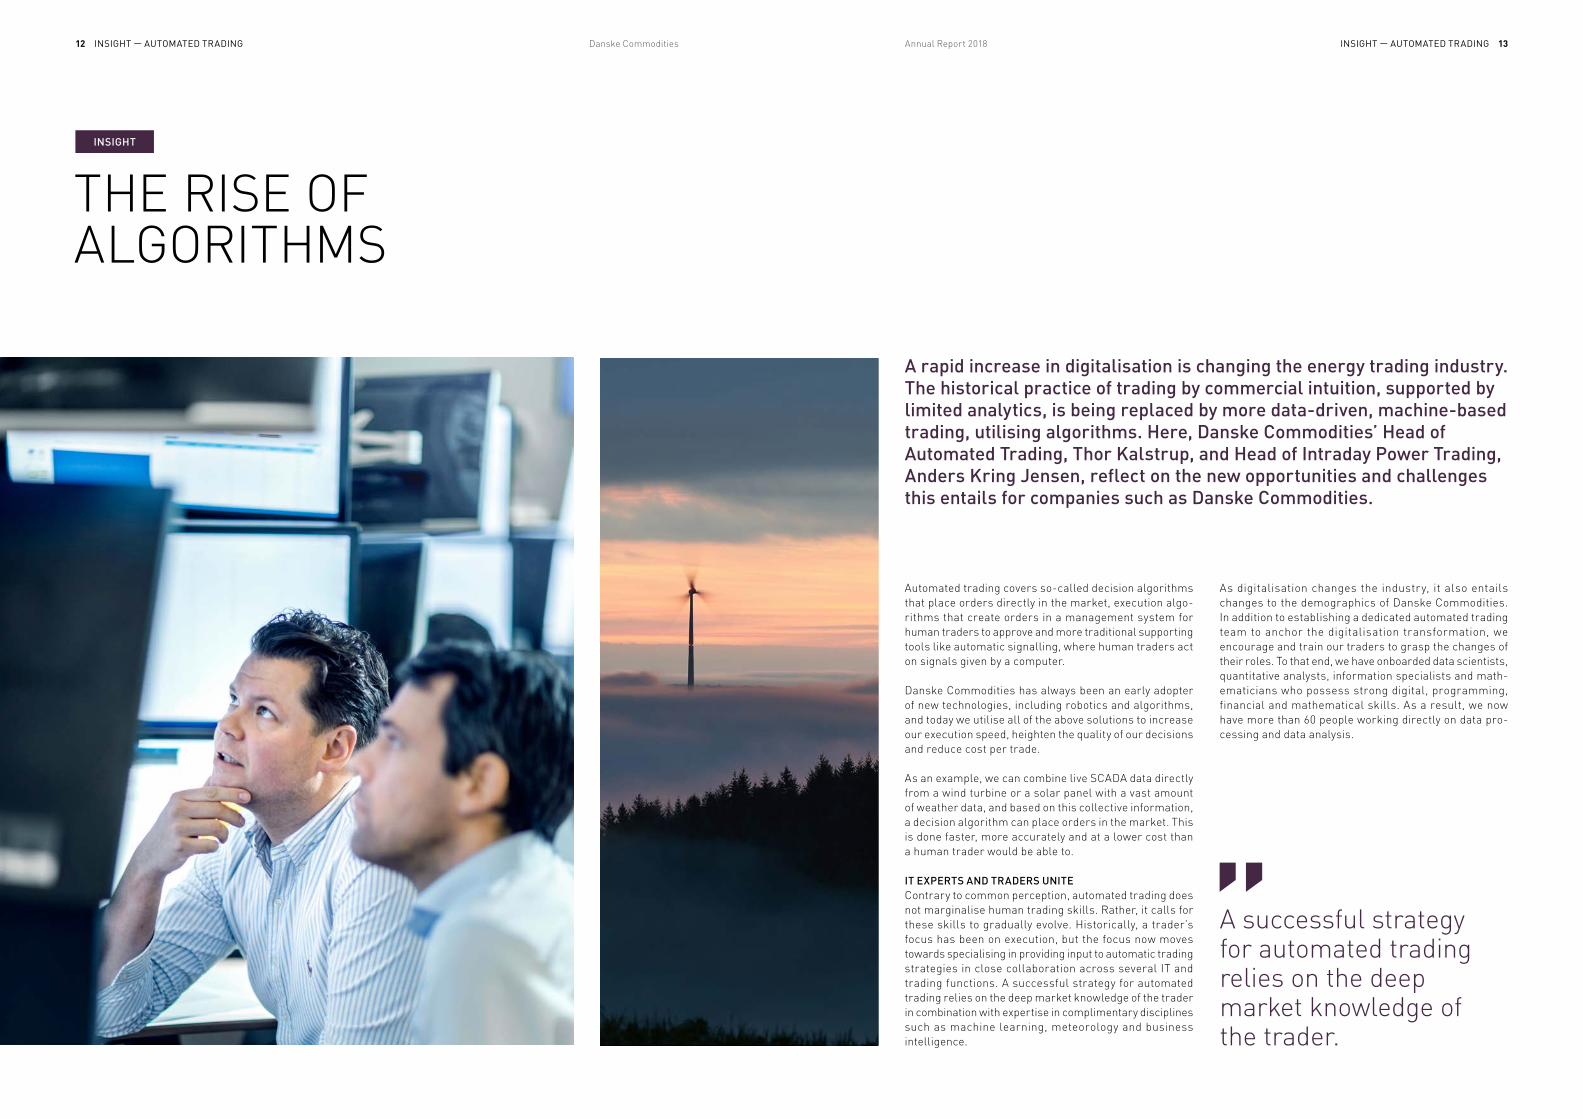
THE RISE OF ALGORITHMS
A rapid increase in digitalisation is changing the energy trading industry. The historical practice of trading by commercial intuition, supported by limited analytics, is being replaced by more data-driven, machine-based trading, utilising algorithms. Here, Danske Commodities’ Head of Automated Trading, Thor Kalstrup, and Head of Intraday Power Trading, Anders Kring Jensen, reflect on the new opportunities and challenges this entails for companies such as Danske Commodities.
A successful strategy for automated trading relies on the deep market knowledge of the trader.
Automated trading covers so-called decision algorithms that place orders directly in the market, execution algo-rithms that create orders in a management system for human traders to approve and more traditional supporting tools like automatic signalling, where human traders act on signals given by a computer.
Danske Commodities has always been an early adopter of new technologies, including robotics and algorithms, and today we utilise all of the above solutions to increase our execution speed, heighten the quality of our decisions and reduce cost per trade.
As an example, we can combine live SCADA data directly from a wind turbine or a solar panel with a vast amount of weather data, and based on this collective information, a decision algorithm can place orders in the market. This is done faster, more accurately and at a lower cost than a human trader would be able to.
IT EXPERTS AND TRADERS UNITEContrary to common perception, automated trading does not marginalise human trading skills. Rather, it calls for these skills to gradually evolve. Historically, a trader’s focus has been on execution, but the focus now moves towards specialising in providing input to automatic trading strategies in close collaboration across several IT and trading functions. A successful strategy for automated trading relies on the deep market knowledge of the trader in combination with expertise in complimentary disciplines such as machine learning, meteorology and business intelligence.
As digitalisation changes the industry, it also entails changes to the demographics of Danske Com modities. In addition to establishing a dedicated auto ma ted trading team to anchor the digitalisation transformation, we encourage and train our traders to grasp the changes of their roles. To that end, we have onboarded data scientists, quantitative analysts, information specialists and math-ematicians who possess strong digital, programming, financial and mathematical skills. As a result, we now have more than 60 people working directly on data pro-cessing and data analysis.
INSIGHT
STRATEGy 15Annual Report 2018
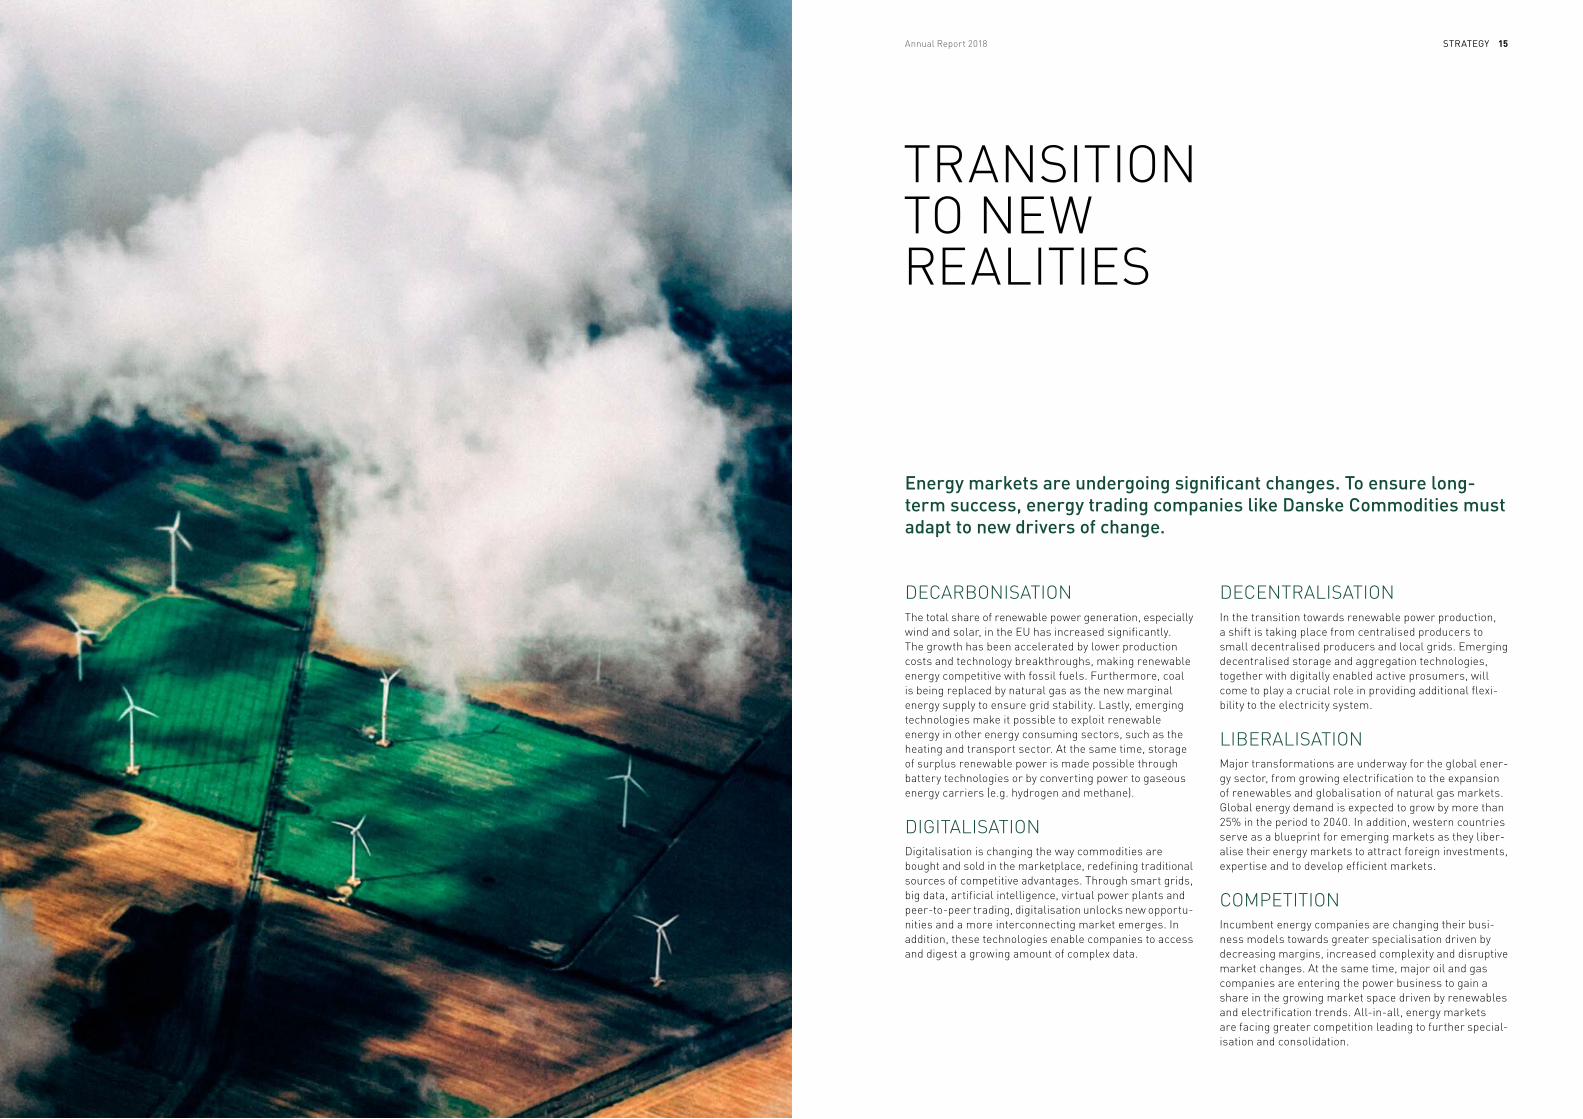
TRANSITION TO NEW REALITIES
Energy markets are undergoing significant changes. To ensure long-term success, energy trading companies like Danske Commodities must adapt to new drivers of change.
DECARBONISATIONThe total share of renewable power generation, especially wind and solar, in the EU has increased significantly. The growth has been accelerated by lower production costs and technology breakthroughs, making renewable energy competitive with fossil fuels. Furthermore, coal is being replaced by natural gas as the new marginal energy supply to ensure grid stability. Lastly, emerging technologies make it possible to exploit renewable energy in other energy consuming sectors, such as the heating and transport sector. At the same time, storage of surplus renewable power is made possible through battery technologies or by converting power to gaseous energy carriers (e.g. hydrogen and methane).
DIGITALISATIONDigitalisation is changing the way commodities are bought and sold in the marketplace, redefining tradition al sources of competitive advantages. Through smart grids, big data, artificial intelligence, virtual power plants and peer-to-peer trading, digitalisation unlocks new op portu - nities and a more interconnecting market emerges. In addition, these technologies enable companies to access and digest a growing amount of complex data.
DECENTRALISATIONIn the transition towards renewable power production, a shift is taking place from centralised producers to small decentralised producers and local grids. Emerging de centralised storage and aggregation technologies, to gether with digitally enabled active prosumers, will come to play a crucial role in providing additional flexi-bility to the electricity system.
LIBERALISATIONMajor transformations are underway for the global ener - gy sector, from growing electrification to the expansion of renewables and globalisation of natural gas markets. Global energy demand is expected to grow by more than 25% in the period to 2040. In addition, western countries serve as a blueprint for emerging markets as they liber-alise their energy markets to attract foreign investments, expertise and to develop efficient markets.
COMPETITIONIncumbent energy companies are changing their busi-ness models towards greater specialisation driven by decreasing margins, increased complexity and disruptive market changes. At the same time, major oil and gas companies are entering the power business to gain a share in the growing market space driven by renewables and electrification trends. All-in-all, energy markets are facing greater competition leading to further special - isation and consolidation.
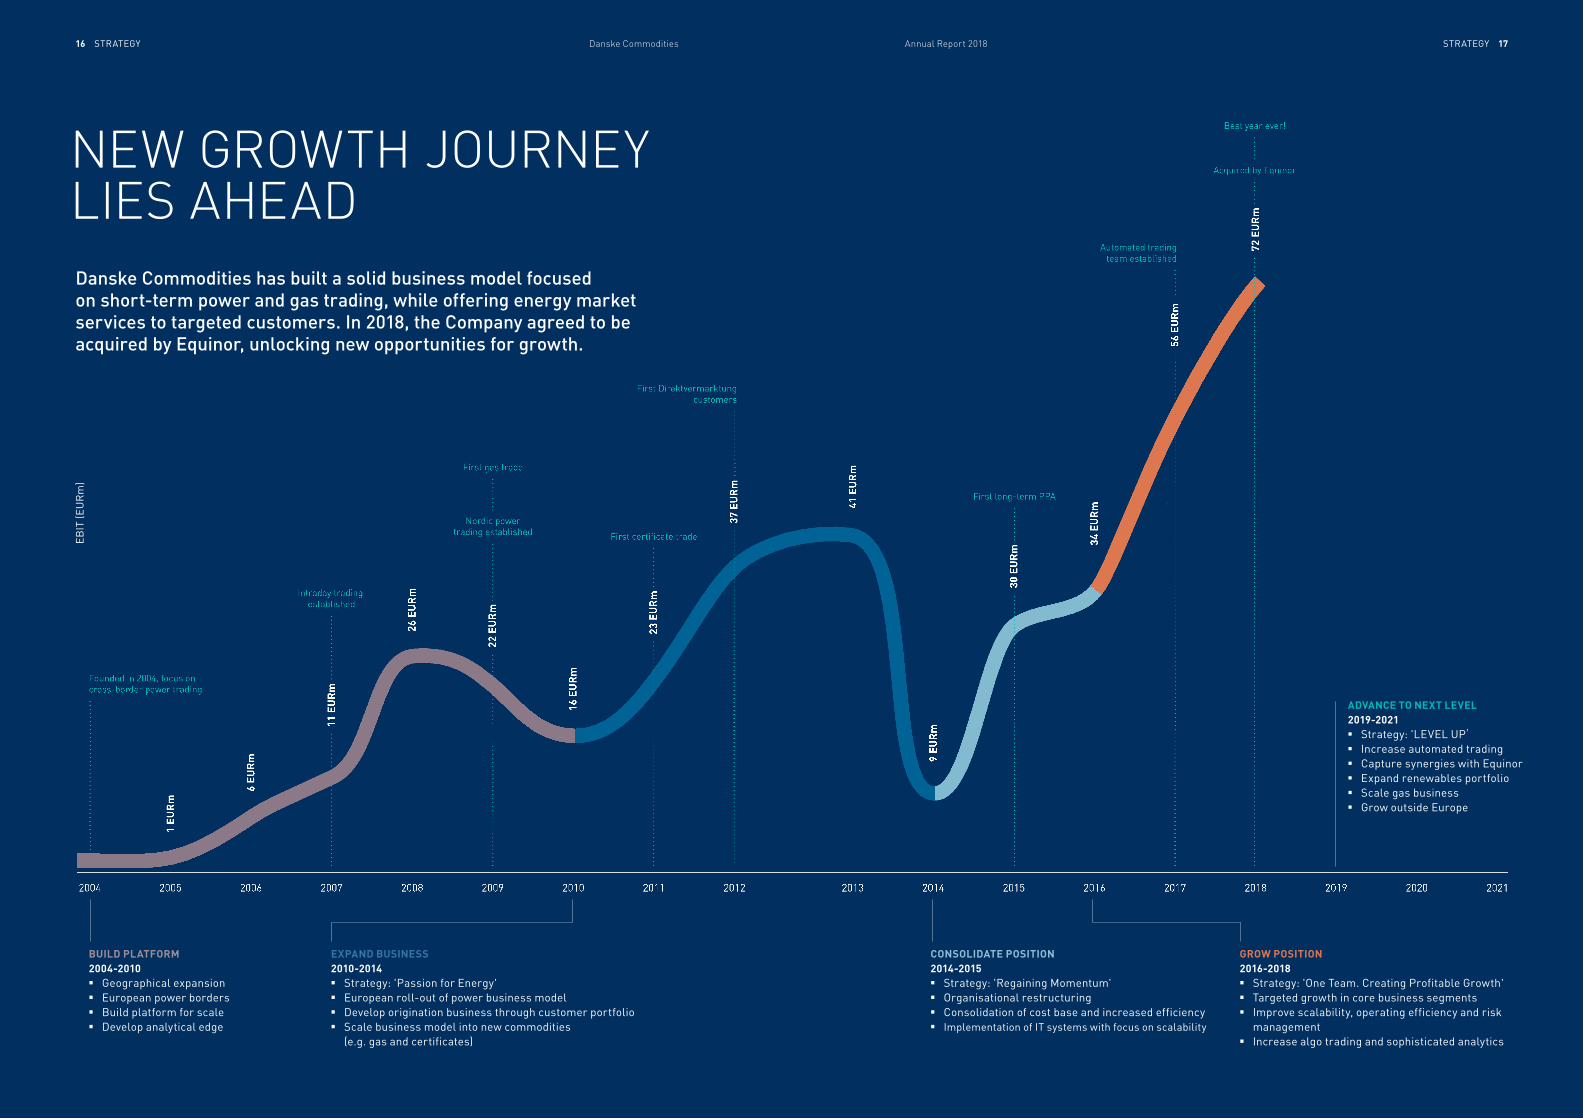
1 EU
Rm
6 EU
Rm
26 E
UR
m
22 E
UR
m
16 E
UR
m
23 E
UR
m
37 E
UR
m
41 E
UR
m
9 EU
Rm
30 E
UR
m
56 E
UR
m
72 E
UR
m
2004 2005 2006 2007 2008 2009 2010 2011 2012 2013 2014 2015 2016 2017 2018 2019 2020 2021
Founded in 2004, focus on cross-border power trading
Intraday trading established
Nordic power trading established
First gas trade
First certificate trade
First Direktvermarktungcustomers
First long-term PPA
Automated trading team established
Best year ever!
Acquired by Equinor
11 E
UR
m
34 E
UR
m
EB
IT (E
UR
m)
STRATEGy STRATEGy16 17Danske Commodities Annual Report 2018
Danske Commodities has built a solid business model focused on short-term power and gas trading, while offering energy market services to targeted customers. In 2018, the Company agreed to be acquired by Equinor, unlocking new opportunities for growth.
NEW GROWTH JOURNEY LIES AHEAD
BUILD PLATFORM2004-2010■ Geographical expansion ■ European power borders■ Build platform for scale■ Develop analytical edge
EXPAND BUSINESS2010-2014■ Strategy: 'Passion for Energy'■ European roll-out of power business model■ Develop origination business through customer portfolio■ Scale business model into new commodities
(e.g. gas and certificates)
CONSOLIDATE POSITION2014-2015■ Strategy: 'Regaining Momentum'■ Organisational restructuring■ Consolidation of cost base and increased efficiency■ Implementation of IT systems with focus on scalability
GROW POSITION2016-2018■ Strategy: 'One Team. Creating Profitable Growth'■ Targeted growth in core business segments■ Improve scalability, operating efficiency and risk
management■ Increase algo trading and sophisticated analytics
ADVANCE TO NEXT LEVEL2019-2021■ Strategy: 'LEVEL UP ' ■ Increase automated trading■ Capture synergies with Equinor■ Expand renewables portfolio■ Scale gas business■ Grow outside Europe
STRATEGy STRATEGy18 19Danske Commodities Annual Report 2018
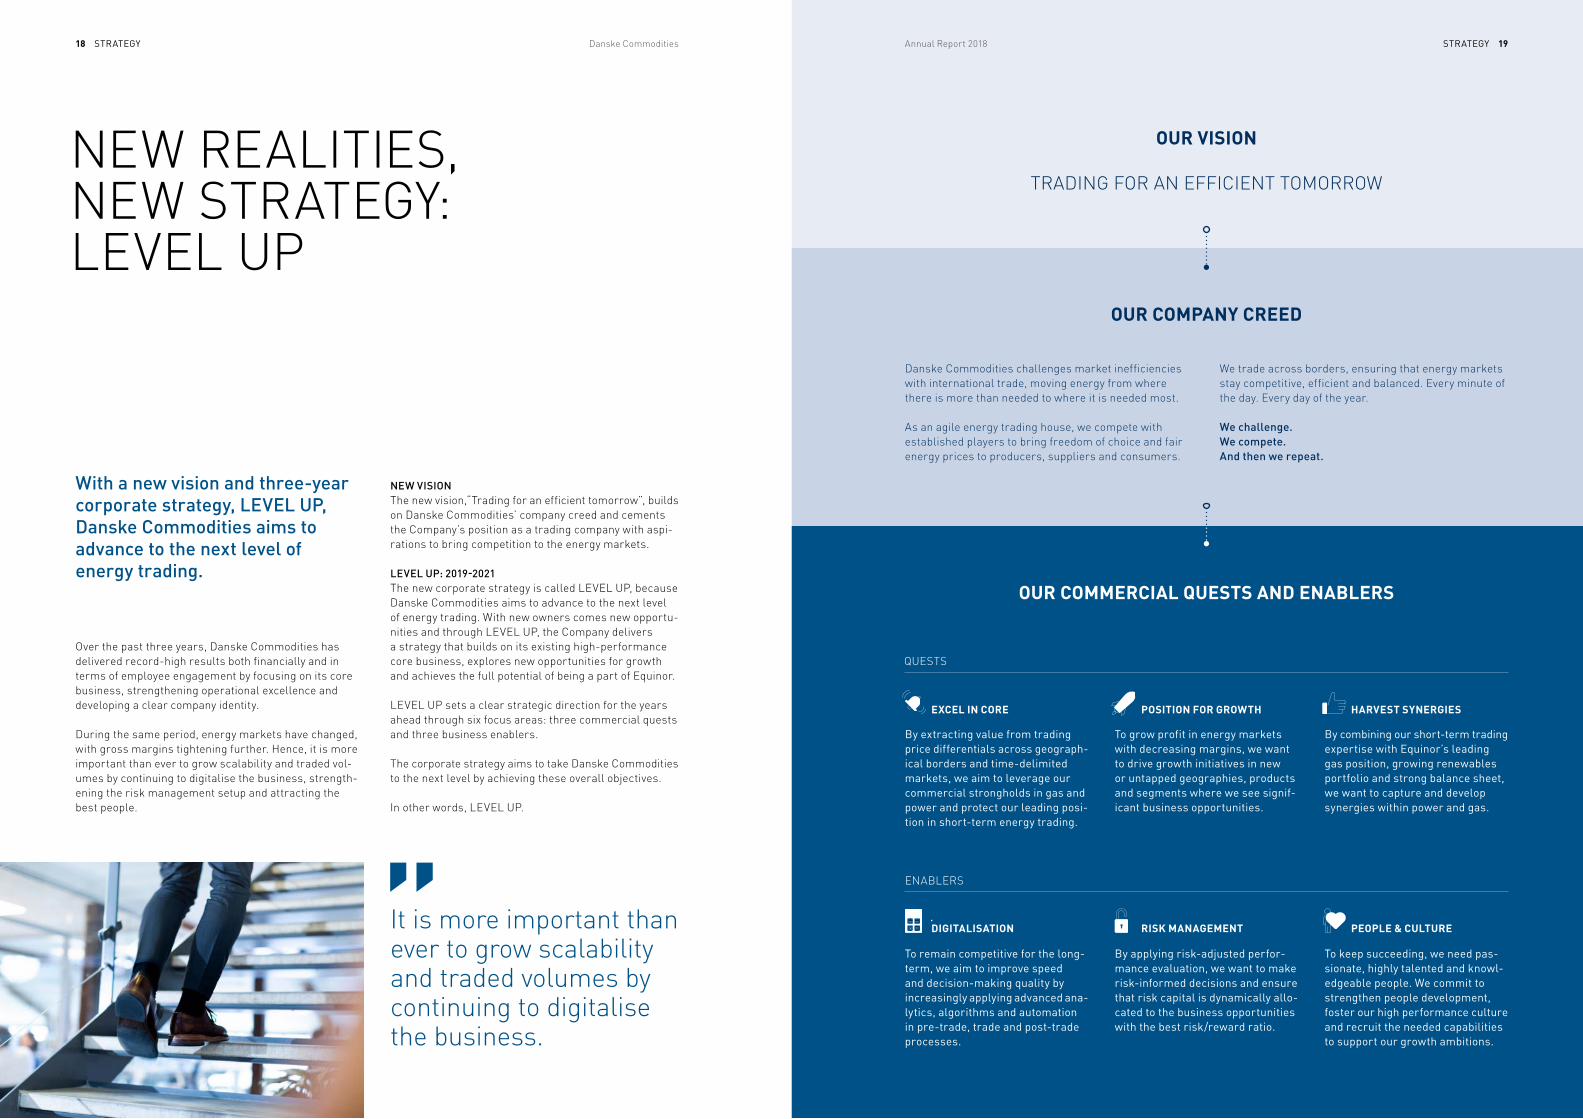
NEW REALITIES, NEW STRATEGY: LEVEL UP
With a new vision and three-year corporate strategy, LEVEL UP, Danske Commodities aims to advance to the next level of energy trading.
Over the past three years, Danske Commodities has delivered record-high results both financially and in terms of employee engagement by focusing on its core business, strengthening operational excellence and developing a clear company identity.
During the same period, energy markets have changed, with gross margins tightening further. Hence, it is more important than ever to grow scalability and traded vol-umes by continuing to digitalise the business, strength-ening the risk management setup and attracting the best people.
Danske Commodities challenges market inefficiencies with international trade, moving energy from where there is more than needed to where it is needed most. As an agile energy trading house, we compete with established players to bring freedom of choice and fair energy prices to producers, suppliers and consumers.
EXCEL IN CORE
By extracting value from trading price differentials across geograph-ical borders and time-delimited markets, we aim to leverage our commercial strongholds in gas and power and protect our leading posi-tion in short-term energy trading.
POSITION FOR GROWTH
To grow profit in energy markets with decreasing margins, we want to drive growth initiatives in new or untapped geographies, products and segments where we see signif-icant business opportunities.
HARVEST SYNERGIES
By combining our short-term trading expertise with Equinor’s leading gas position, growing renewables portfolio and strong balance sheet, we want to capture and develop synergies within power and gas.
DIGITALISATION
To remain competitive for the long-term, we aim to improve speed and decision-making quality by in creasingly applying advanced ana - lytics, algorithms and auto mation in pre-trade, trade and post-trade processes.
RISK MANAGEMENT
By applying risk-adjusted perfor-mance evaluation, we want to make risk-informed decisions and ensure that risk capital is dynamically allo-cated to the business opportunities with the best risk/reward ratio.
PEOPLE & CULTURE
To keep succeeding, we need pas-sionate, highly talented and knowl-edgeable people. We commit to strengthen people development, foster our high performance culture and recruit the needed capabilities to support our growth ambitions.
NEW VISIONThe new vision,“Trading for an efficient tomorrow”, builds on Danske Commodities’ company creed and cements the Company’s position as a trading company with aspi-rations to bring competition to the energy markets.
LEVEL UP: 2019-2021The new corporate strategy is called LEVEL UP, because Danske Commodities aims to advance to the next level of energy trading. With new owners comes new opportu-nities and through LEVEL UP, the Company delivers a strategy that builds on its existing high-performance core business, explores new opportunities for growth and achieves the full potential of being a part of Equinor.
LEVEL UP sets a clear strategic direction for the years ahead through six focus areas: three commercial quests and three business enablers.
The corporate strategy aims to take Danske Commodities to the next level by achieving these overall objectives.
In other words, LEVEL UP.
It is more important than ever to grow scalability and traded volumes by continuing to digitalise the business.
We trade across borders, ensuring that energy markets stay competitive, efficient and balanced. Every minute of the day. Every day of the year. We challenge. We compete. And then we repeat.
OUR COMMERCIAL QUESTS AND ENABLERS
OUR COMPANY CREED
OUR VISION
TRADING FOR AN EFFICIENT TOMORROW
QUESTS
ENABLERS
INSIGHT — RENEWABLE ENERGy 21
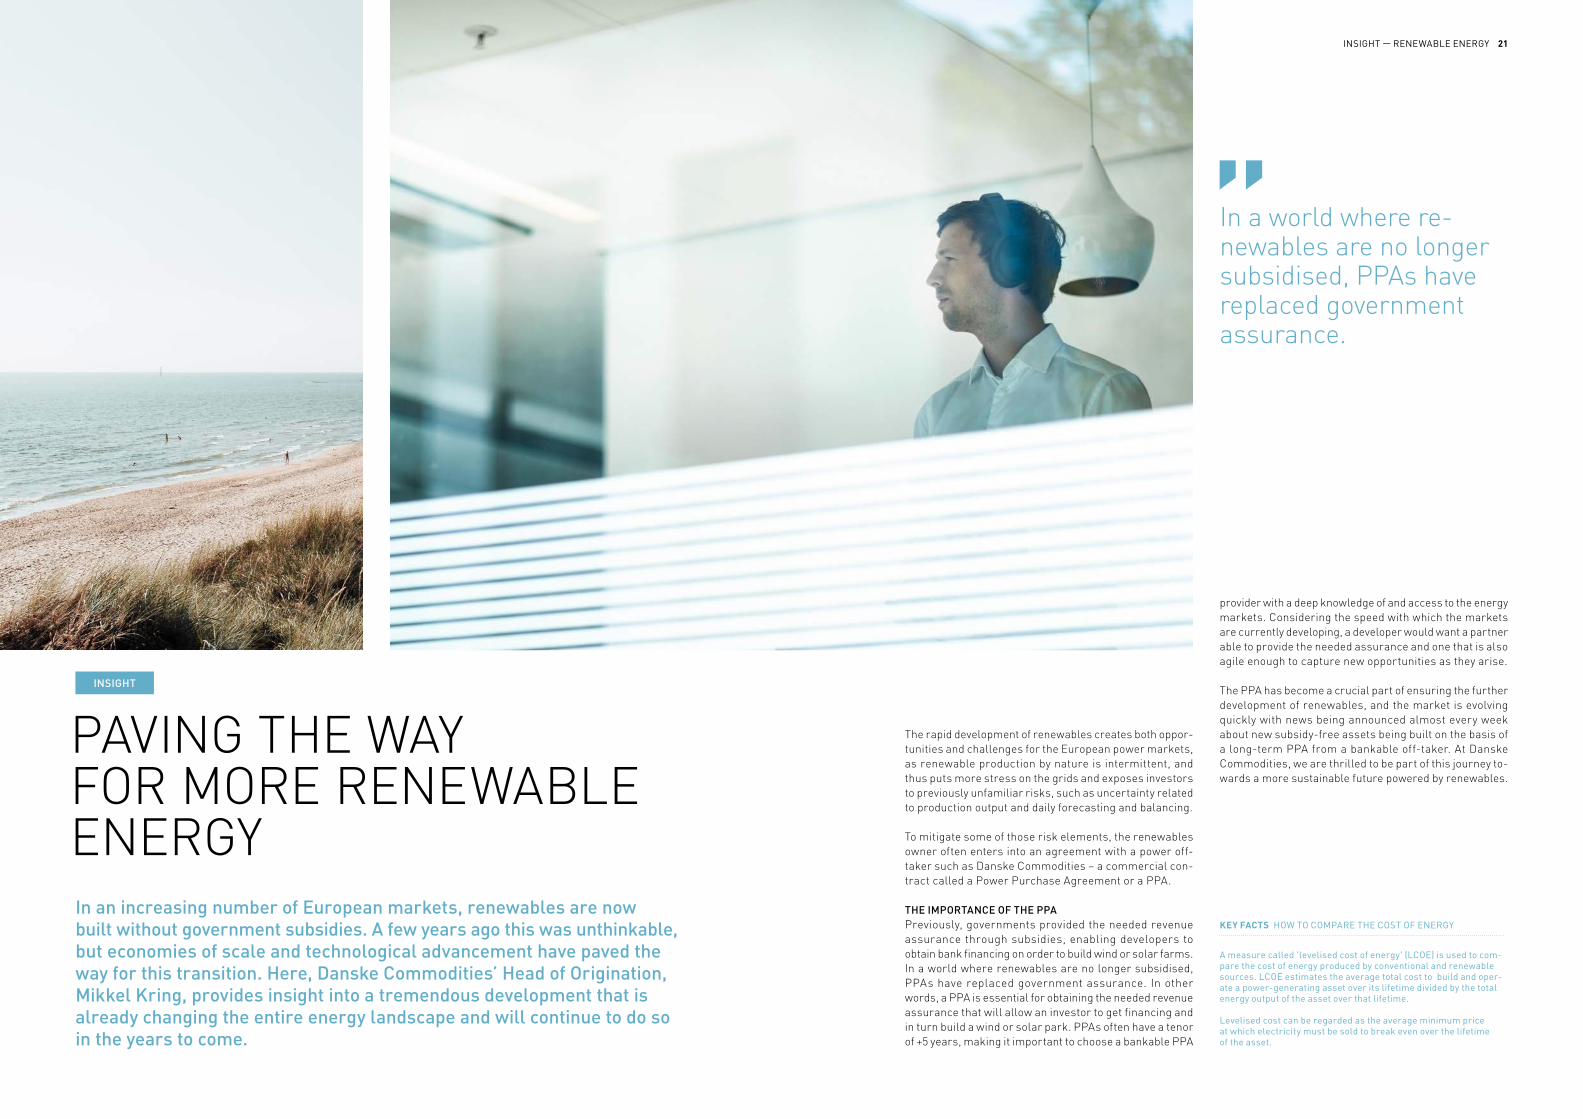
PAVING THE WAY FOR MORE RENEWABLE ENERGY
The rapid development of renewables creates both oppor-tunities and challenges for the European power markets, as renewable production by nature is intermittent, and thus puts more stress on the grids and exposes investors to previously unfamiliar risks, such as uncertainty related to production output and daily forecasting and balancing.
To mitigate some of those risk elements, the renewables owner often enters into an agreement with a power off-taker such as Danske Commodities – a commercial con-tract called a Power Purchase Agreement or a PPA.
THE IMPORTANCE OF THE PPAPreviously, governments provided the needed revenue assurance through subsidies, enabling developers to obtain bank financing on order to build wind or solar farms. In a world where renewables are no longer subsidised, PPAs have replaced government assurance. In other words, a PPA is essential for obtaining the needed revenue assurance that will allow an investor to get financing and in turn build a wind or solar park. PPAs often have a tenor of +5 years, making it important to choose a bankable PPA
In an increasing number of European markets, renewables are now built without govern ment subsidies. A few years ago this was unthink able, but economies of scale and technological ad vancement have paved the way for this transition. Here, Danske Commodities’ Head of Origination, Mikkel Kring, provides insight into a tremendous development that is already changing the entire energy landscape and will continue to do so in the years to come.
In a world where re - new ables are no longer subsidised, PPAs have re placed gov ern ment assurance.
provider with a deep knowledge of and access to the energy markets. Considering the speed with which the markets are currently developing, a developer would want a partner able to provide the needed assurance and one that is also agile enough to capture new opportunities as they arise.
The PPA has become a crucial part of ensuring the further development of renewables, and the market is evolving quickly with news being announced almost every week about new subsidy-free assets being built on the basis of a long-term PPA from a bankable off-taker. At Danske Com modities, we are thrilled to be part of this journey to - wards a more sustainable future powered by re new ables.
A measure called 'levelised cost of energy' (LCOE) is used to com-pare the cost of energy produced by conventional and renewable sources. LCOE estimates the average total cost to build and oper-ate a power-generating asset over its lifetime divided by the total energy output of the asset over that lifetime.
Levelised cost can be regarded as the average minimum price at which electricity must be sold to break even over the lifetime of the asset.
KEY FACTS HOW TO COMPARE THE COST OF ENERGy
INSIGHT
FINANCIAL PERFORMANCE FINANCIAL PERFORMANCE22 23Danske Commodities Annual Report 2018
Danske Commodities’ continuous focus on operational excellence was clearly reflected in the ability to grow business activity at a low marginal cost. The operational improvements were the result of strong performance, harvesting the innovative and agile mindset and a clear focus on the bottom line. During 2018, extreme weather conditions created opportunities in the market, enabling Danske Commodities to prove the potential of the Com-pany's scalable operating model.
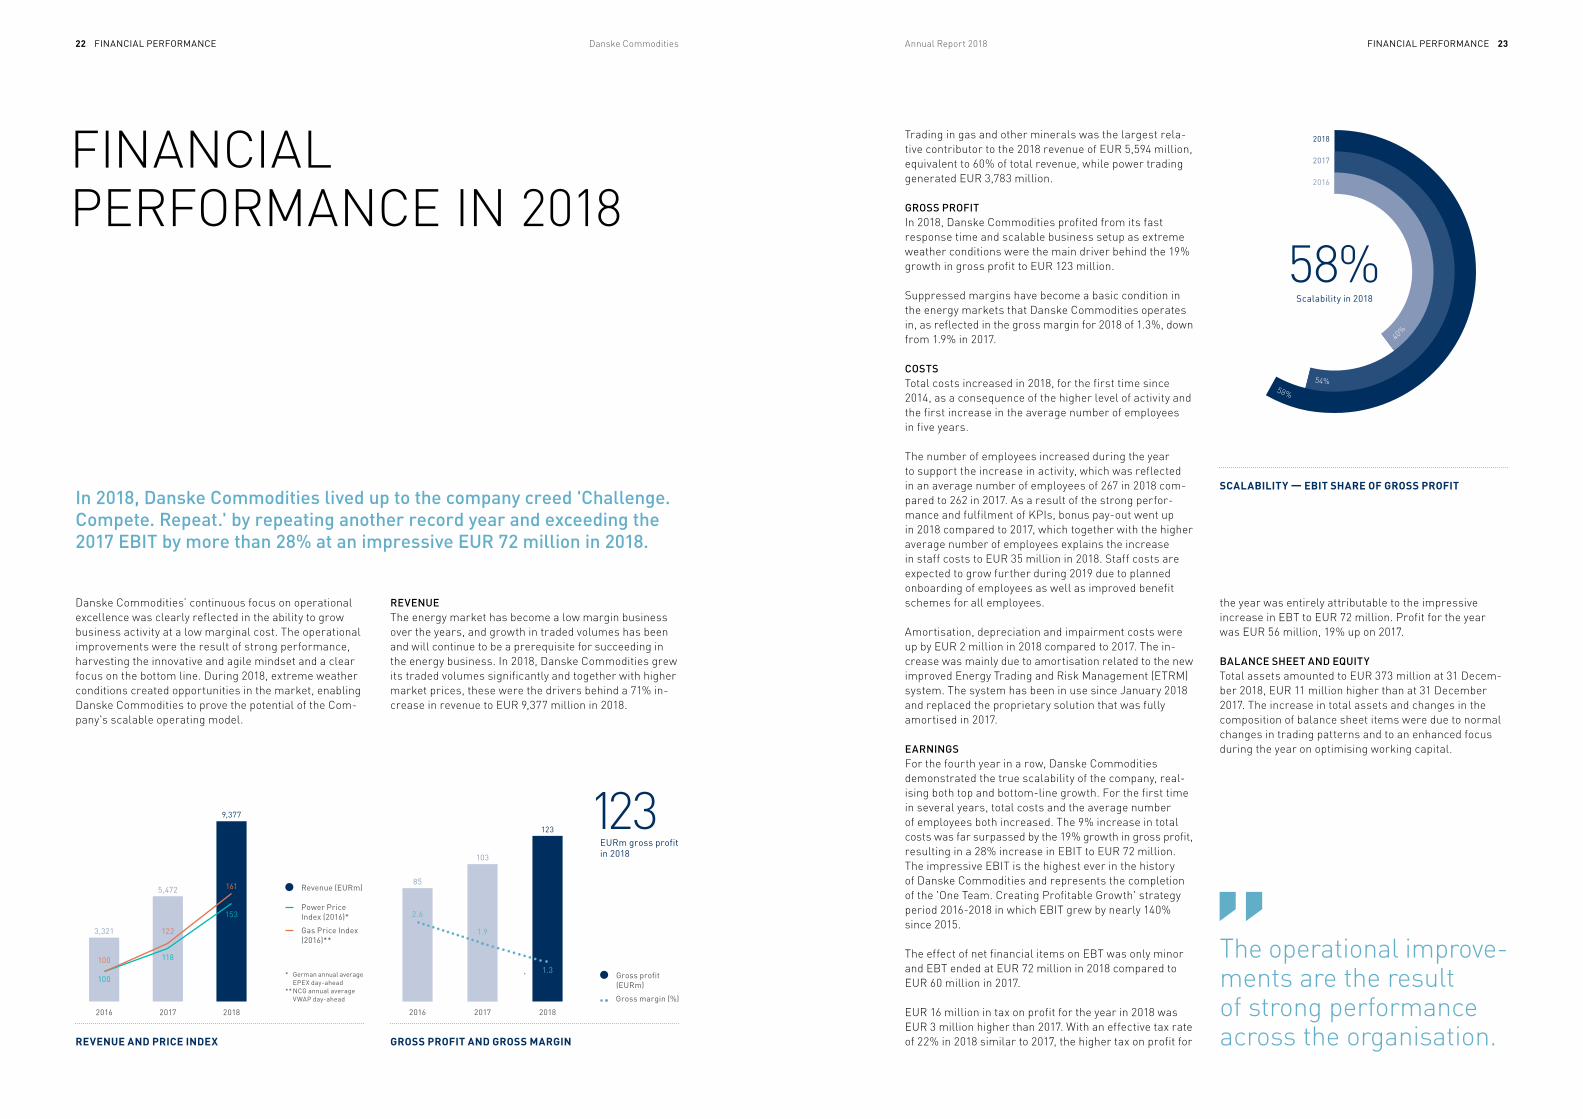
Trading in gas and other minerals was the largest rela-tive contributor to the 2018 revenue of EUR 5,594 million, equivalent to 60% of total revenue, while power trading generated EUR 3,783 million.
GROSS PROFITIn 2018, Danske Commodities profited from its fast response time and scalable business setup as extreme weather conditions were the main driver behind the 19% growth in gross profit to EUR 123 million.
Suppressed margins have become a basic condition in the energy markets that Danske Commodities operates in, as reflected in the gross margin for 2018 of 1.3%, down from 1.9% in 2017.
COSTSTotal costs increased in 2018, for the first time since 2014, as a consequence of the higher level of activity and the first increase in the average number of employees in five years.
The number of employees increased during the year to support the increase in activity, which was reflected in an average number of employees of 267 in 2018 com-pared to 262 in 2017. As a result of the strong perfor-mance and fulfilment of KPIs, bonus pay-out went up in 2018 compared to 2017, which together with the higher average number of employees explains the increase in staff costs to EUR 35 million in 2018. Staff costs are expected to grow further during 2019 due to planned onboarding of employees as well as improved benefit schemes for all employees.
Amortisation, depreciation and impairment costs were up by EUR 2 million in 2018 compared to 2017. The in - crease was mainly due to amortisation related to the new im proved Energy Trading and Risk Management (ETRM) system. The system has been in use since January 2018 and replaced the proprietary solution that was fully amortised in 2017.
EARNINGSFor the fourth year in a row, Danske Commodities dem on strated the true scalability of the company, real-ising both top and bottom-line growth. For the first time in several years, total costs and the average number of em ployees both increased. The 9% increase in total costs was far surpassed by the 19% growth in gross profit, re sulting in a 28% increase in EBIT to EUR 72 million. The impres sive EBIT is the highest ever in the history of Danske Commodities and represents the completion of the 'One Team. Creating Profitable Growth' strategy period 2016-2018 in which EBIT grew by nearly 140% since 2015.
The effect of net financial items on EBT was only minor and EBT ended at EUR 72 million in 2018 compared to EUR 60 million in 2017.
EUR 16 million in tax on profit for the year in 2018 was EUR 3 million higher than 2017. With an effective tax rate of 22% in 2018 similar to 2017, the higher tax on profit for
FINANCIAL PERFORMANCE IN 2018
In 2018, Danske Commodities lived up to the company creed 'Challenge. Compete. Repeat.' by repeating another record year and exceeding the 2017 EBIT by more than 28% at an impressive EUR 72 million in 2018.
REVENUEThe energy market has become a low margin business over the years, and growth in traded volumes has been and will continue to be a prerequisite for succeeding in the energy business. In 2018, Danske Commodities grew its traded volumes significantly and together with higher market prices, these were the drivers behind a 71% in -crease in revenue to EUR 9,377 million in 2018.
the year was entirely attributable to the impressive increase in EBT to EUR 72 million. Profit for the year was EUR 56 million, 19% up on 2017.
BALANCE SHEET AND EQUITYTotal assets amounted to EUR 373 million at 31 Decem-ber 2018, EUR 11 million higher than at 31 December 2017. The increase in total assets and changes in the composition of balance sheet items were due to normal changes in trading patterns and to an enhanced focus during the year on optimising working capital.
The operational im prove - ments are the result of strong performance across the organisation.
58 %
54 %
40 %
123EURm gross profit in 2018
58%Scalability in 2018
Revenue (EURm)
Power Price Index (2016)*
Gas Price Index (2016)**
* German annual average EPEX day-ahead
** NCG annual average VWAP day-ahead
2016
2017
2018
2016
85
2017
103
2018
123
REVENUE AND PRICE INDEX
SCALABILITY — EBIT SHARE OF GROSS PROFIT
GROSS PROFIT AND GROSS MARGIN
2.6
1.9
1.3100
122
161
100
118
153
Gross profit (EURm)
Gross margin (%)
9,377
5,472
3,321
201820172016
FINANCIAL PERFORMANCE FINANCIAL PERFORMANCE24 25Danske Commodities Annual Report 2018
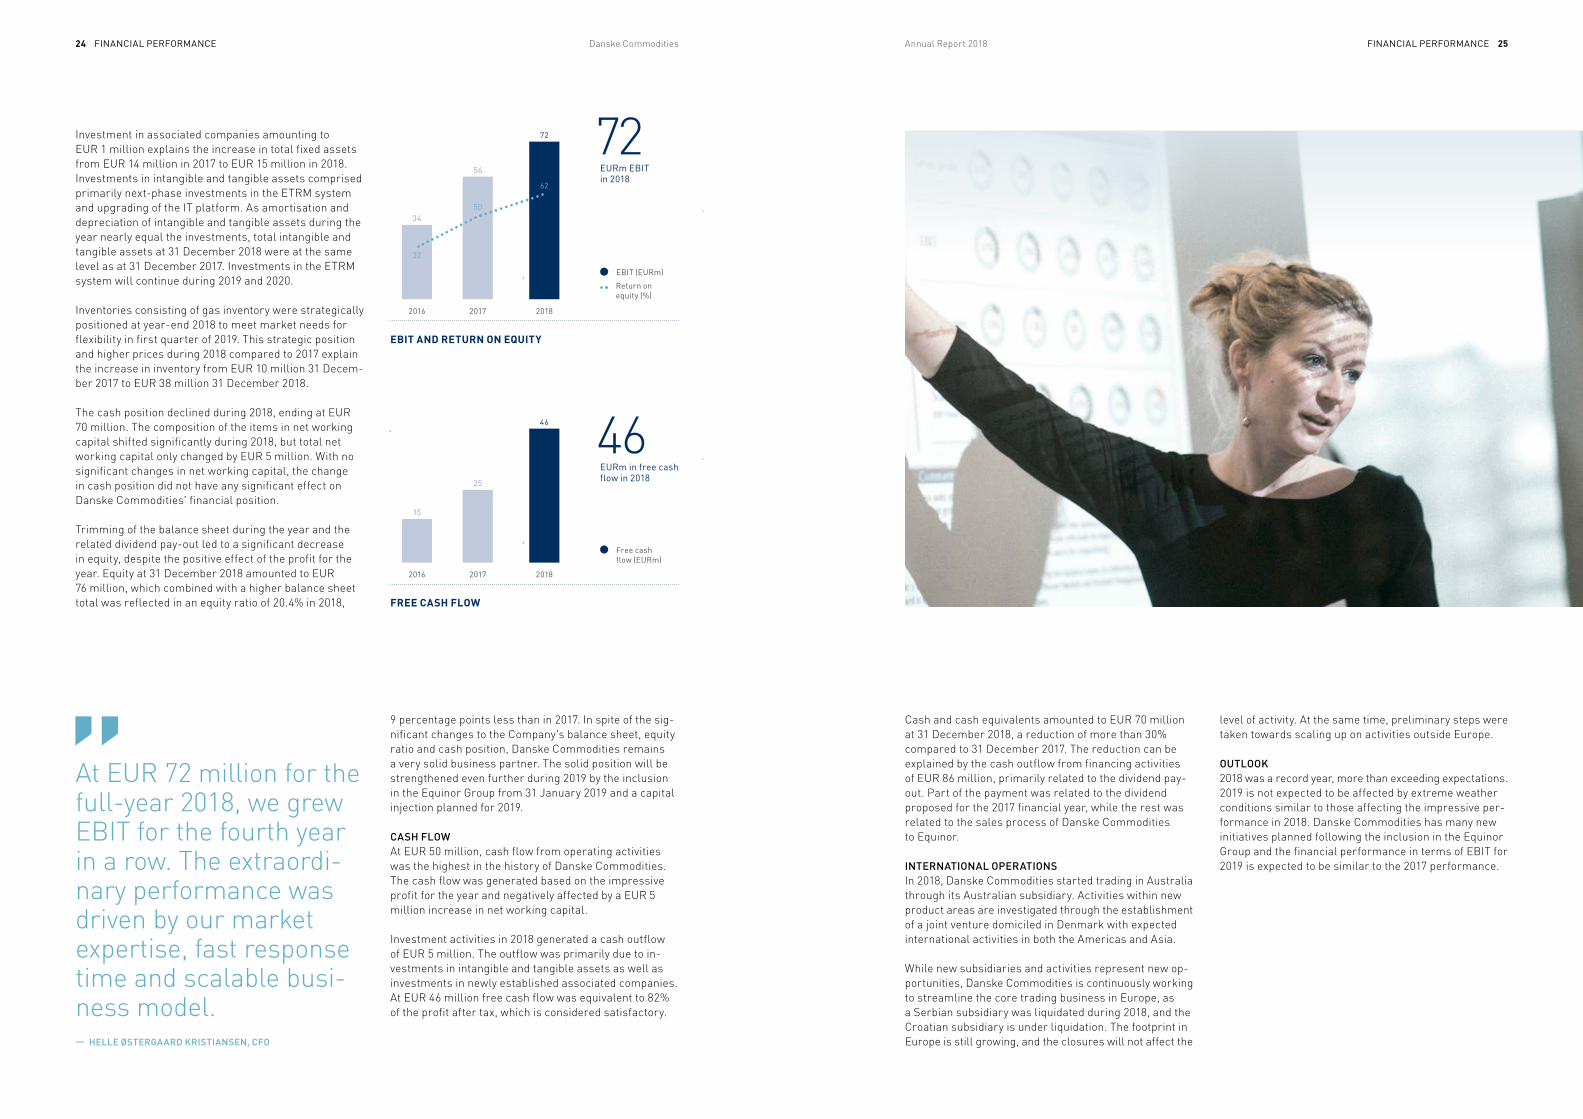
At EUR 72 million for the full-year 2018, we grew EBIT for the fourth year in a row. The extraordi-nary performance was driven by our market expertise, fast response time and scalable busi-ness model.— HELLE ØSTERGAARD KRISTIANSEN, CFO
Investment in associated companies amounting to EUR 1 million explains the increase in total fixed assets from EUR 14 million in 2017 to EUR 15 million in 2018. Investments in intangible and tangible assets comprised primarily next-phase investments in the ETRM system and upgrading of the IT platform. As amortisation and depreciation of intangible and tangible assets during the year nearly equal the investments, total intangible and tangible assets at 31 December 2018 were at the same level as at 31 December 2017. Investments in the ETRM system will continue during 2019 and 2020.
Inventories consisting of gas inventory were strategically positioned at year-end 2018 to meet market needs for flexibility in first quarter of 2019. This strategic position and higher prices during 2018 compared to 2017 explain the increase in inventory from EUR 10 million 31 Decem-ber 2017 to EUR 38 million 31 December 2018.
The cash position declined during 2018, ending at EUR 70 million. The composition of the items in net working capital shifted significantly during 2018, but total net working capital only changed by EUR 5 million. With no significant changes in net working capital, the change in cash position did not have any significant effect on Danske Commodities' financial position.
Trimming of the balance sheet during the year and the related dividend pay-out led to a significant decrease in equity, despite the positive effect of the profit for the year. Equity at 31 December 2018 amounted to EUR 76 million, which combined with a higher balance sheet total was reflected in an equity ratio of 20.4% in 2018,
9 percentage points less than in 2017. In spite of the sig-nificant changes to the Company's balance sheet, equity ratio and cash position, Danske Commodities remains a very solid business partner. The solid position will be strengthened even further during 2019 by the inclusion in the Equinor Group from 31 January 2019 and a capital injection planned for 2019.
CASH FLOWAt EUR 50 million, cash flow from operating activities was the highest in the history of Danske Commodities. The cash flow was generated based on the impressive profit for the year and negatively affected by a EUR 5 million increase in net working capital.
Investment activities in 2018 generated a cash outflow of EUR 5 million. The outflow was primarily due to in - vest ments in intangible and tangible assets as well as invest ments in newly established associated companies. At EUR 46 million free cash flow was equivalent to 82% of the profit after tax, which is considered satisfactory.
Cash and cash equivalents amounted to EUR 70 million at 31 December 2018, a reduction of more than 30% com pared to 31 December 2017. The reduction can be explained by the cash outflow from financing activities of EUR 86 million, primarily related to the dividend pay-out. Part of the payment was related to the dividend proposed for the 2017 financial year, while the rest was related to the sales process of Danske Commodities to Equinor.
INTERNATIONAL OPERATIONSIn 2018, Danske Commodities started trading in Australia through its Australian subsidiary. Activities within new product areas are investigated through the establishment of a joint venture domiciled in Denmark with expected international activities in both the Americas and Asia.
While new subsidiaries and activities represent new op - portunities, Danske Commodities is continuously working to stream line the core trading business in Europe, as a Serbian subsidiary was liquidated during 2018, and the Croatian subsidiary is under liquidation. The footprint in Europe is still growing, and the closures will not affect the
level of activity. At the same time, preliminary steps were taken towards scaling up on activities outside Europe.
OUTLOOK2018 was a record year, more than exceeding expectations. 2019 is not expected to be affected by extreme weather conditions similar to those affecting the impressive per-formance in 2018. Danske Commodities has many new initiatives planned following the inclusion in the Equinor Group and the financial performance in terms of EBIT for 2019 is expected to be similar to the 2017 performance.
EBIT AND RETURN ON EQUITY
FREE CASH FLOW
2016
2016
34
15
2017
2017
56
25
2018
2018
72
46
72EURm EBIT in 2018
46EURm in free cash flow in 2018
32
62
50
EBIT (EURm)
Return on equity (%)
Free cash flow (EURm)
RISk MANAGEMENT RISk MANAGEMENT26 27Danske Commodities Annual Report 2018
RISKS AND RISK MANAGEMENT Danske Commodities is exposed to a variety of risks through its daily trading activities. The risk strategy supports Danske Commodities’ strategic objectives by appropriately balancing risk and expected return. This balance is enforced through risk capital allo cation. The definition and allocation of risk capital ensure a clear alignment of the Company’s risk appetite with the mandates allocated to its trading activities. Applied risk is monitored continually, and daily, monthly and quarterly reporting on exposure levels, thresholds, risk measures and available headroom in the Company’s risk capital ensure mature and consistent fulfilment of its risk control responsibility.
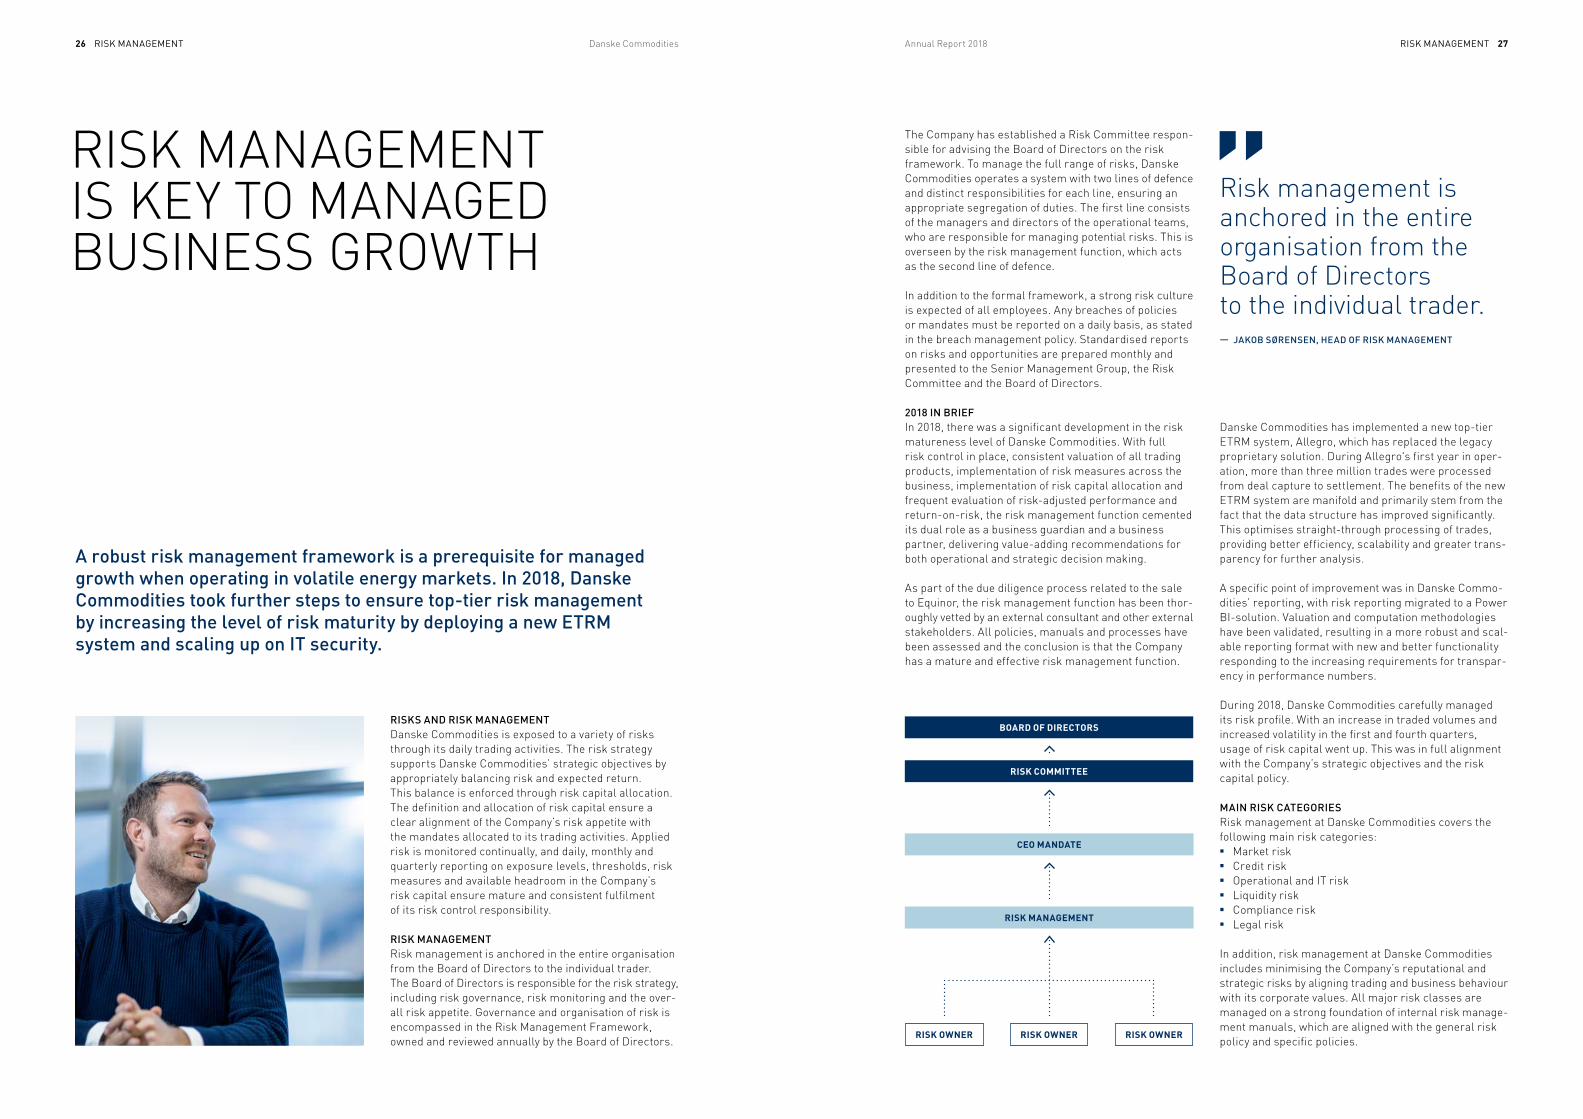
RISK MANAGEMENT Risk management is anchored in the entire organisation from the Board of Directors to the individual trader. The Board of Directors is responsible for the risk strategy, including risk governance, risk monitoring and the over-all risk appetite. Governance and organisation of risk is encompassed in the Risk Management Framework, owned and reviewed annually by the Board of Directors.
RISK MANAGEMENT IS KEY TO MANAGED BUSINESS GROWTH
A robust risk management framework is a prerequisite for managed growth when operating in volatile energy markets. In 2018, Danske Commodities took further steps to ensure top-tier risk management by increasing the level of risk maturity by deploying a new ETRM system and scaling up on IT security.
The Company has established a Risk Committee respon - sible for advising the Board of Directors on the risk framework. To manage the full range of risks, Danske Commodities operates a system with two lines of defence and distinct responsibilities for each line, ensuring an appropriate segregation of duties. The first line consists of the managers and directors of the operational teams, who are responsible for managing potential risks. This is overseen by the risk management function, which acts as the second line of defence.
In addition to the formal framework, a strong risk culture is expected of all employees. Any breaches of policies or mandates must be reported on a daily basis, as stated in the breach management policy. Standardised reports on risks and opportunities are prepared monthly and presented to the Senior Management Group, the Risk Committee and the Board of Directors.
2018 IN BRIEF In 2018, there was a significant development in the risk matureness level of Danske Commodities. With full risk control in place, consistent valuation of all trading products, implementation of risk measures across the business, implementation of risk capital allocation and frequent evaluation of risk-adjusted performance and return-on-risk, the risk management function cemented its dual role as a business guardian and a business partner, delivering value-adding recommendations for both operational and strategic decision making.
As part of the due diligence process related to the sale to Equinor, the risk management function has been thor-oughly vetted by an external consultant and other external stakeholders. All policies, manuals and processes have been assessed and the conclusion is that the Company has a mature and effective risk management function.
Danske Commodities has implemented a new top-tier ETRM system, Allegro, which has replaced the legacy proprietary solution. During Allegro's first year in oper-ation, more than three million trades were processed from deal capture to settlement. The benefits of the new ETRM system are manifold and primarily stem from the fact that the data structure has improved significantly. This optimises straight-through processing of trades, providing better efficiency, scalability and greater trans-parency for further analysis.
A specific point of improvement was in Danske Commo-dities’ reporting, with risk reporting migrated to a Power BI-solution. Valuation and computation metho dologies have been validated, resulting in a more robust and scal - able reporting format with new and better functionality responding to the increasing requirements for trans par-ency in performance numbers.
During 2018, Danske Commodities carefully managed its risk profile. With an increase in traded volumes and increased volatility in the first and fourth quarters, usage of risk capital went up. This was in full alignment with the Company’s strategic objectives and the risk capital policy.
MAIN RISK CATEGORIES Risk management at Danske Commodities covers the following main risk categories: ■ Market risk ■ Credit risk ■ Operational and IT risk ■ Liquidity risk ■ Compliance risk ■ Legal risk
In addition, risk management at Danske Commodities includes minimising the Company’s reputational and strategic risks by aligning trading and business behaviour with its corporate values. All major risk classes are managed on a strong foundation of internal risk manage - ment manuals, which are aligned with the general risk policy and specific policies.
Risk management is anchored in the entire organisation from the Board of Directors to the individual trader.— JAKOB SØRENSEN, HEAD OF RISK MANAGEMENT
BOARD OF DIRECTORS
RISK COMMITTEE
RISK MANAGEMENT
RISK OWNER RISK OWNER RISK OWNER
CEO MANDATE
RISk MANAGEMENT RISk MANAGEMENT28 29Danske Commodities Annual Report 2018
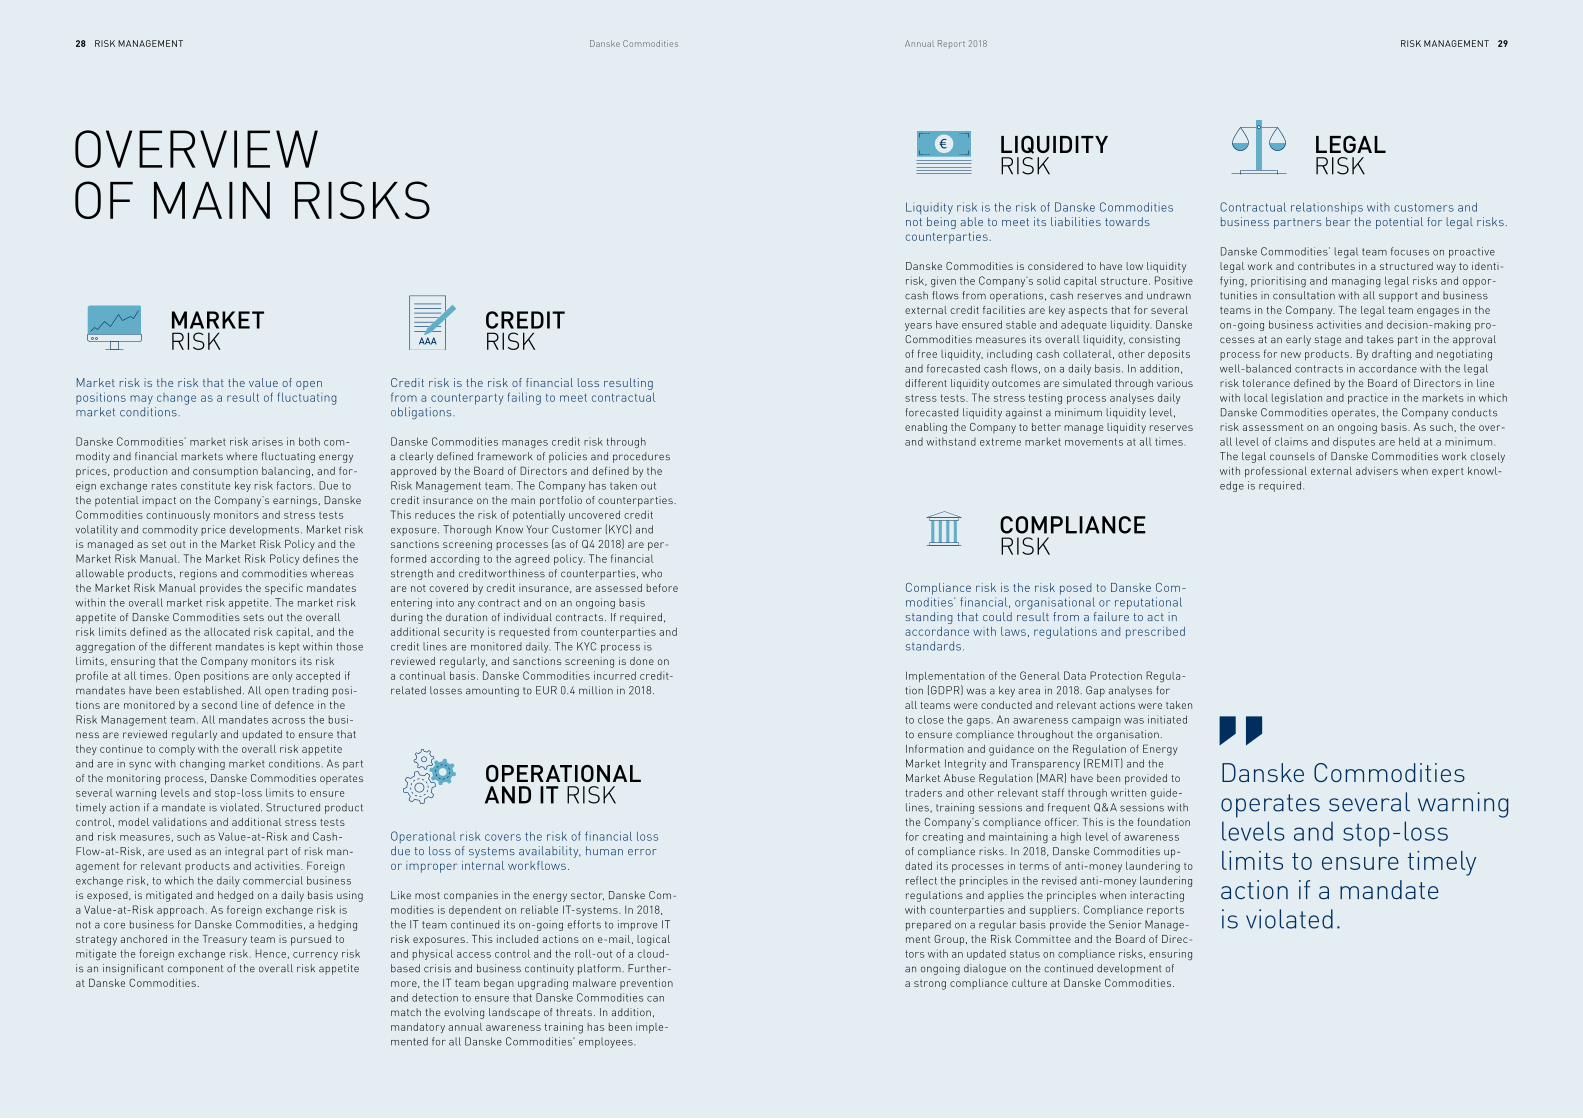
MARKET RISK
Market risk is the risk that the value of open positions may change as a result of fluctuating market conditions.
Danske Commodities’ market risk arises in both com-modity and financial markets where fluctuating energy prices, production and consumption balancing, and for-eign exchange rates constitute key risk factors. Due to the potential impact on the Company’s earnings, Danske Commodities continuously monitors and stress tests volatility and commodity price developments. Market risk is managed as set out in the Market Risk Policy and the Market Risk Manual. The Market Risk Policy defines the allowable products, regions and commodities where as the Market Risk Manual provides the specific mandates within the overall market risk appetite. The market risk appetite of Danske Commodities sets out the overall risk limits defined as the allocated risk capital, and the aggre gation of the different mandates is kept within those limits, ensuring that the Company monitors its risk profile at all times. Open positions are only accepted if mandates have been established. All open trading posi-tions are monitored by a second line of defence in the Risk Management team. All mandates across the busi-ness are reviewed regularly and updated to ensure that they continue to comply with the overall risk appetite and are in sync with changing market conditions. As part of the monitoring process, Danske Commodities operates several warning levels and stop-loss limits to ensure timely action if a mandate is violated. Structured product control, model validations and additional stress tests and risk measures, such as Value-at-Risk and Cash-Flow-at-Risk, are used as an integral part of risk man-agement for relevant products and activities. Foreign exchange risk, to which the daily commercial business is exposed, is mitigated and hedged on a daily basis using a Value-at-Risk approach. As foreign exchange risk is not a core business for Danske Commodities, a hedging strategy anchored in the Treasury team is pursued to mitigate the foreign exchange risk. Hence, currency risk is an insignificant component of the overall risk appetite at Danske Commodities.
OVERVIEW OF MAIN RISKS
CREDIT RISK
Credit risk is the risk of financial loss resulting from a counterparty failing to meet contractual obligations.
Danske Commodities manages credit risk through a clearly defined framework of policies and procedures approved by the Board of Directors and defined by the Risk Management team. The Company has taken out credit insurance on the main portfolio of counterparties. This reduces the risk of potentially uncovered credit exposure. Thorough Know Your Customer (KYC) and sanctions screening processes (as of Q4 2018) are per-formed according to the agreed policy. The financial strength and creditworthiness of counterparties, who are not covered by credit insurance, are assessed before entering into any contract and on an ongoing basis during the duration of individual contracts. If required, addition al security is requested from counterparties and credit lines are monitored daily. The KYC process is reviewed regularly, and sanctions screening is done on a continual basis. Danske Commodities incurred credit- related losses amounting to EUR 0.4 million in 2018.
OPERATIONAL AND IT RISK
Operational risk covers the risk of financial loss due to loss of systems availability, human error or improper internal workflows.
Like most companies in the energy sector, Danske Com-modities is dependent on reliable IT-systems. In 2018, the IT team continued its on-going efforts to improve IT risk exposures. This included actions on e-mail, logical and physical access control and the roll-out of a cloud-based crisis and business continuity platform. Further-more, the IT team began upgrading malware prevention and detection to ensure that Danske Commodities can match the evolving landscape of threats. In addition, mandatory annual awareness training has been imple-mented for all Danske Commodities' employees.
LIQUIDITY RISK
Liquidity risk is the risk of Danske Commodities not being able to meet its liabilities towards counterparties.
Danske Commodities is considered to have low liquidity risk, given the Company’s solid capital structure. Positive cash flows from operations, cash reserves and undrawn external credit facilities are key aspects that for several years have ensured stable and adequate liquidity. Danske Commodities measures its overall liquidity, consisting of free liquidity, including cash collateral, other deposits and forecasted cash flows, on a daily basis. In addition, different liquidity outcomes are simulated through various stress tests. The stress testing process analyses daily forecasted liquidity against a minimum liquidity level, enabling the Company to better manage liquidity reserves and withstand extreme market movements at all times.
COMPLIANCE RISK
Compliance risk is the risk posed to Danske Com-modities’ financial, organisational or reputational standing that could result from a failure to act in accordance with laws, regulations and prescribed standards.
Implementation of the General Data Protection Regula-tion (GDPR) was a key area in 2018. Gap analyses for all teams were conducted and relevant actions were taken to close the gaps. An awareness campaign was initiated to ensure compliance throughout the organisation. Information and guidance on the Regulation of Energy Market Integrity and Transparency (REMIT) and the Market Abuse Regulation (MAR) have been provided to traders and other relevant staff through written guide-lines, training sessions and frequent Q&A sessions with the Company’s compliance officer. This is the foundation for creating and maintaining a high level of awareness of compliance risks. In 2018, Danske Commodities up-dated its processes in terms of anti-money laundering to reflect the principles in the revised anti-money laundering regulations and applies the principles when interacting with counterparties and suppliers. Compliance reports prepared on a regular basis provide the Senior Manage-ment Group, the Risk Committee and the Board of Direc - tors with an updated status on compliance risks, ensuring an ongoing dialogue on the continued development of a strong compliance culture at Danske Commodities.
LEGAL RISK
Contractual relationships with customers and business partners bear the potential for legal risks.
Danske Commodities’ legal team focuses on proactive legal work and contributes in a structured way to identi-fying, prioritising and managing legal risks and oppor-tunities in consultation with all support and business teams in the Company. The legal team engages in the on-going business activities and decision-making pro-cesses at an early stage and takes part in the approval process for new products. By drafting and negotiating well-balanced contracts in accordance with the legal risk tolerance defined by the Board of Directors in line with local legislation and practice in the markets in which Danske Commodities operates, the Company conducts risk assessment on an ongoing basis. As such, the over-all level of claims and disputes are held at a minimum. The legal counsels of Danske Commodities work closely with professional external advisers when expert knowl-edge is required.
Danske Commodities operates several warning levels and stop-loss limits to ensure timely action if a mandate is violated.
€
AAA
INSIGHT — INDIVIDUAL DEVELOPMENT PLANS 30 31Danske Commodities Annual Report 2018
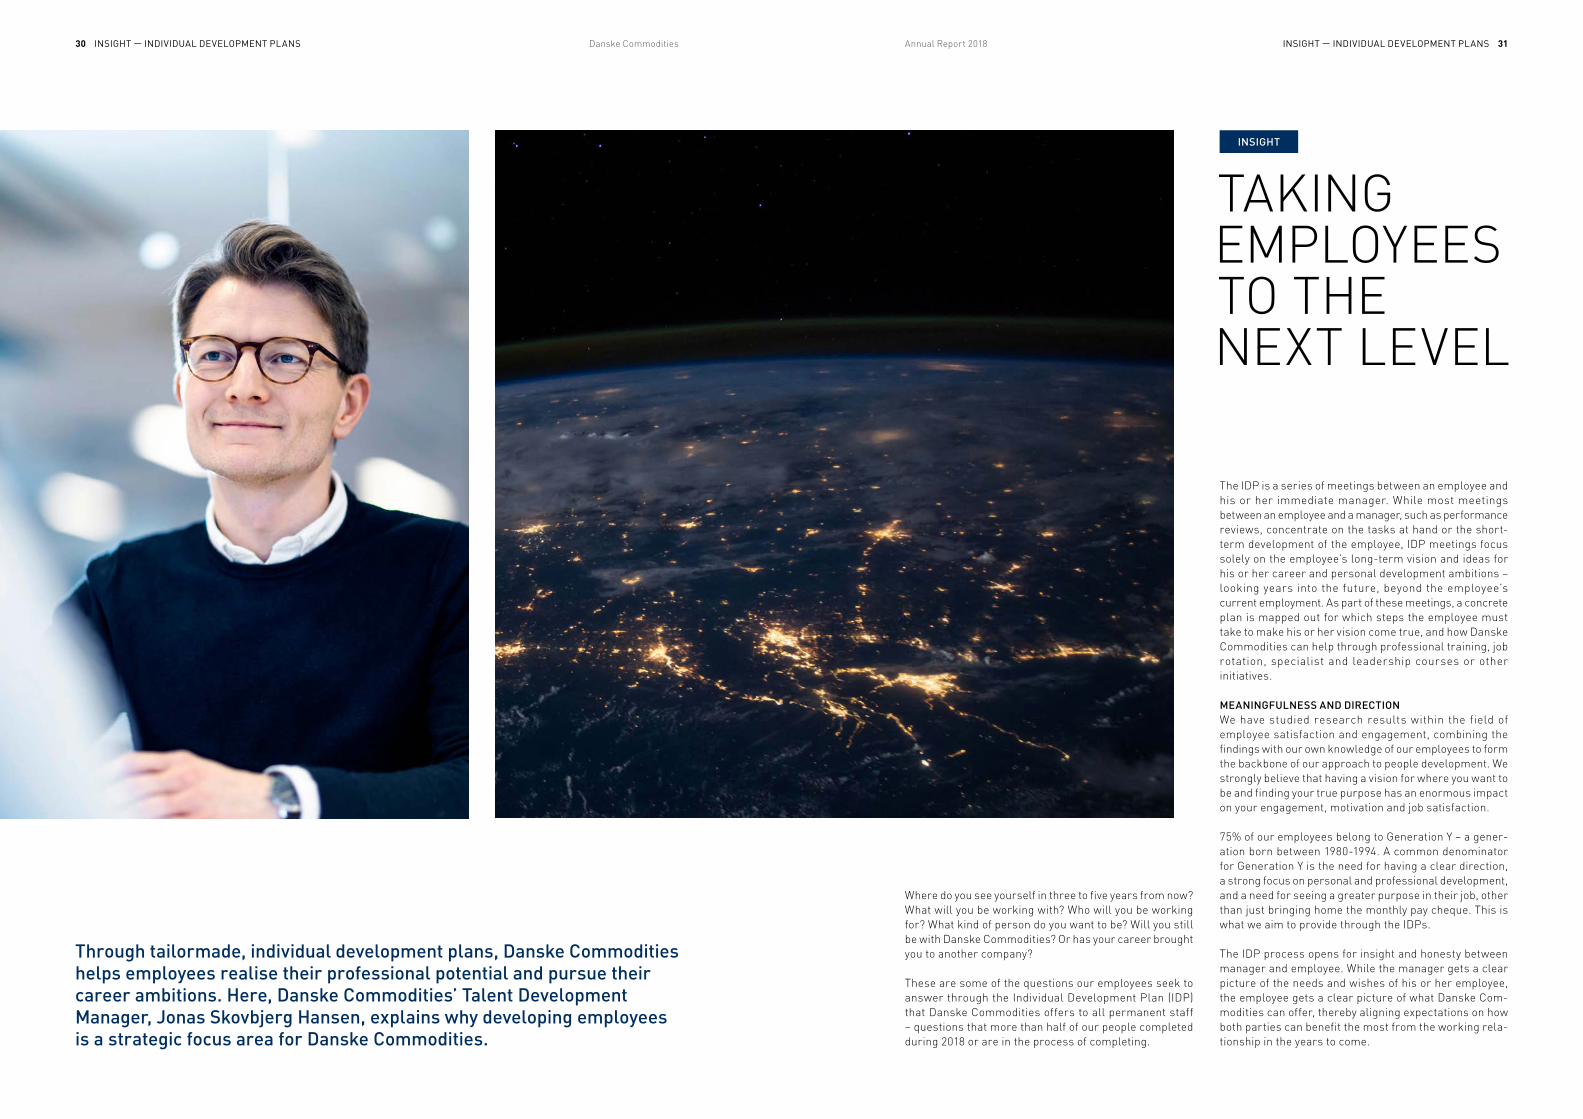
Through tailormade, individual development plans, Danske Commodities helps employees realise their professional potential and pursue their career ambitions. Here, Danske Commodities’ Talent Development Manager, Jonas Skovbjerg Hansen, explains why developing employees is a strategic focus area for Danske Commodities.
TAKING EMPLOYEES TO THE NEXT LEVEL
INSIGHT — INDIVIDUAL DEVELOPMENT PLANS
Where do you see yourself in three to five years from now? What will you be working with? Who will you be working for? What kind of person do you want to be? Will you still be with Danske Commodities? Or has your career brought you to another company?
These are some of the questions our employees seek to answer through the Individual Development Plan (IDP) that Danske Commodities offers to all permanent staff – questions that more than half of our people completed during 2018 or are in the process of completing.
The IDP is a series of meetings between an employee and his or her immediate manager. While most meetings between an employee and a manager, such as performance reviews, concentrate on the tasks at hand or the short-term development of the employee, IDP meetings focus solely on the employee’s long-term vision and ideas for his or her career and personal development ambitions – looking years into the future, beyond the employee’s current employment. As part of these meetings, a concrete plan is mapped out for which steps the employee must take to make his or her vision come true, and how Danske Commodities can help through professional training, job rotation, specialist and leadership courses or other initiatives.
MEANINGFULNESS AND DIRECTIONWe have studied research results within the field of employee satisfaction and engagement, combining the findings with our own knowledge of our employees to form the backbone of our approach to people development. We strongly believe that having a vision for where you want to be and finding your true purpose has an enormous impact on your engagement, motivation and job satisfaction.
75% of our employees belong to Generation Y – a gener-ation born between 1980-1994. A common denominator for Generation Y is the need for having a clear direction, a strong focus on personal and professional development, and a need for seeing a greater purpose in their job, other than just bringing home the monthly pay cheque. This is what we aim to provide through the IDPs.
The IDP process opens for insight and honesty between manager and employee. While the manager gets a clear picture of the needs and wishes of his or her employee, the employee gets a clear picture of what Danske Com-modities can offer, thereby aligning expectations on how both parties can benefit the most from the working rela-tionship in the years to come.
INSIGHT
PEOPLE 33Annual Report 2018PEOPLE32 Danske Commodities
In 2018, Danske Commodities accelerated people growth by establishing an in-house university, introducing Indi-vidual Development Plans (IDPs), strengthening trading expertise and implementing several initiatives aimed at talent development.
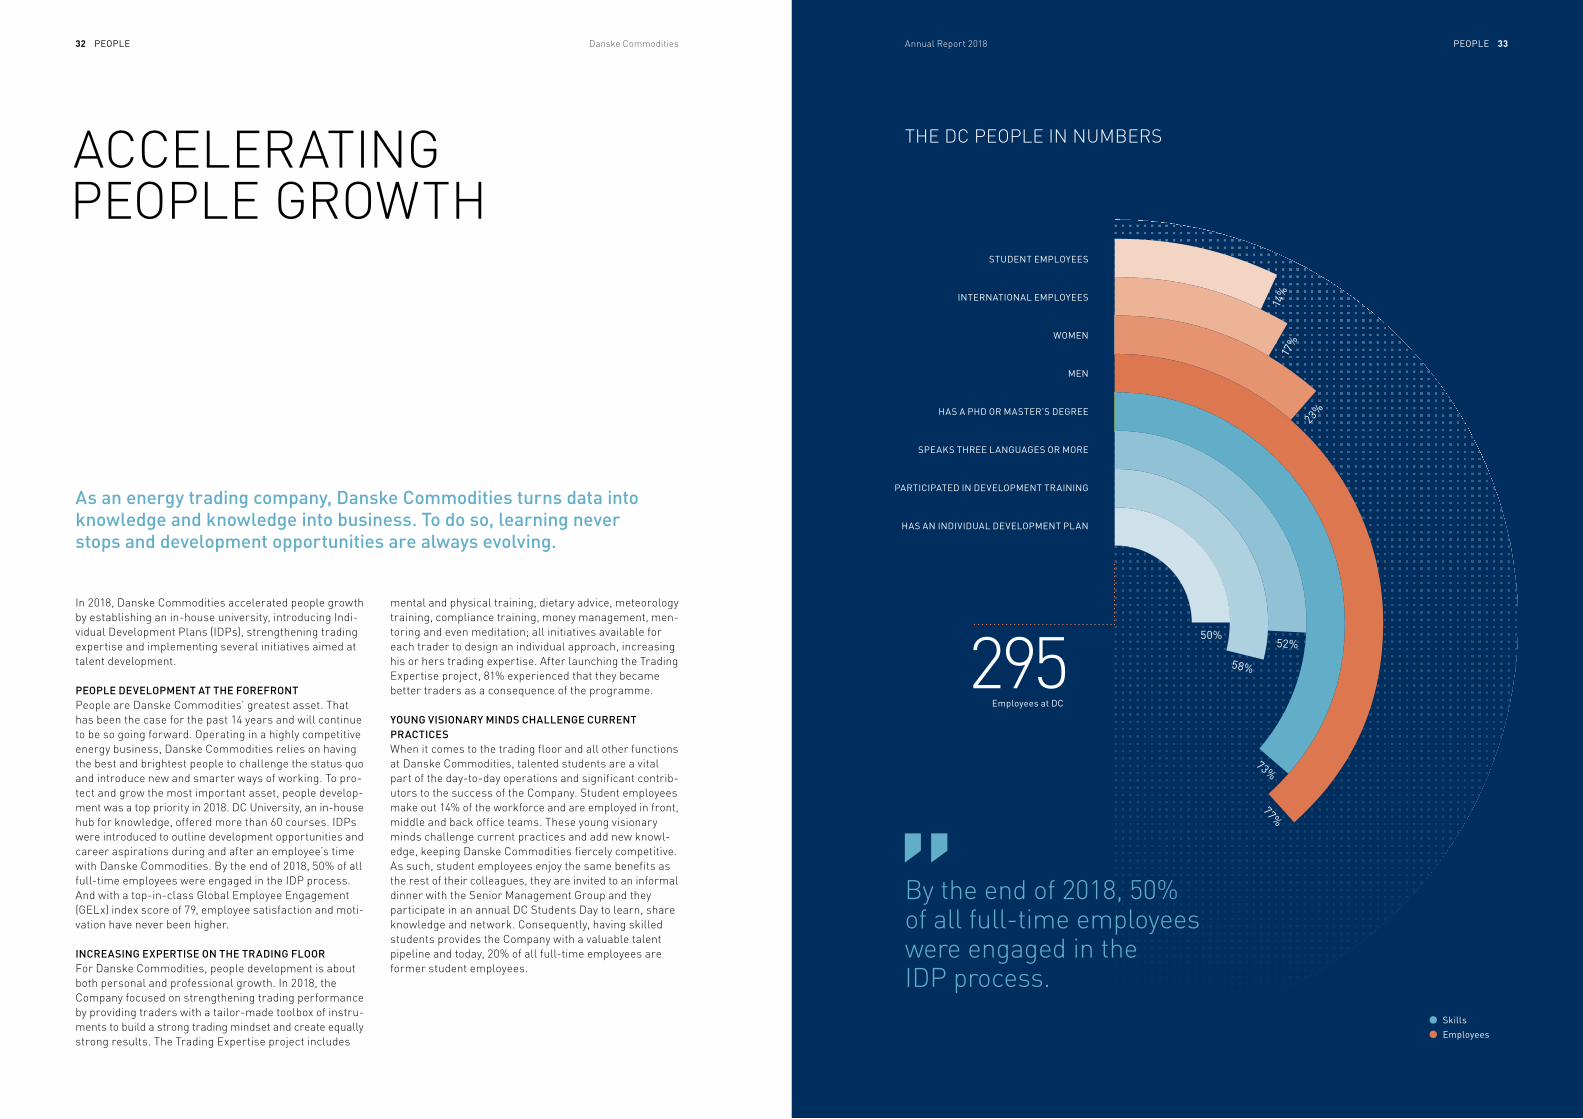
PEOPLE DEVELOPMENT AT THE FOREFRONT People are Danske Commodities’ greatest asset. That has been the case for the past 14 years and will continue to be so going forward. Operating in a highly competitive energy business, Danske Commodities relies on having the best and brightest people to challenge the status quo and introduce new and smarter ways of working. To pro-tect and grow the most important asset, people develop-ment was a top priority in 2018. DC University, an in-house hub for knowledge, offered more than 60 courses. IDPs were introduced to outline development opportunities and career aspirations during and after an employee’s time with Danske Commodities. By the end of 2018, 50% of all full-time employees were engaged in the IDP process. And with a top-in-class Global Employee Engage ment (GELx) index score of 79, employee satisfaction and moti - vation have never been higher.
INCREASING EXPERTISE ON THE TRADING FLOORFor Danske Commodities, people development is about both personal and professional growth. In 2018, the Company focused on strengthening trading performance by providing traders with a tailor-made toolbox of instru - ments to build a strong trading mindset and create equally strong results. The Trading Expertise project includes
ACCELERATING PEOPLE GROWTH
As an energy trading company, Danske Commodities turns data into knowledge and knowledge into business. To do so, learning never stops and development opportunities are always evolving.
mental and physical training, dietary advice, meteorology training, compliance training, money management, men - toring and even meditation; all initiatives available for each trader to design an individual approach, increasing his or hers trading expertise. After launching the Trading Expertise project, 81% experienced that they became better traders as a consequence of the programme.
YOUNG VISIONARY MINDS CHALLENGE CURRENT PRACTICES When it comes to the trading floor and all other functions at Danske Commodities, talented students are a vital part of the day-to-day operations and significant contrib-utors to the success of the Company. Student employees make out 14% of the workforce and are employed in front, middle and back office teams. These young visionary minds challenge current practices and add new knowl-edge, keeping Danske Commodities fiercely competitive. As such, student employees enjoy the same benefits as the rest of their colleagues, they are invited to an informal dinner with the Senior Management Group and they participate in an annual DC Students Day to learn, share knowledge and network. Consequently, having skilled students provides the Company with a valuable talent pipeline and today, 20% of all full-time employees are former student employees.
By the end of 2018, 50% of all full-time employees were engaged in the IDP process.
THE DC PEOPLE IN NUMBERS
Skills
Employees
STUDENT EMPLOyEES
INTERNATIONAL EMPLOyEES
WOMEN
MEN
HAS A PHD OR MASTER’S DEGREE
SPEAkS THREE LANGUAGES OR MORE
PARTICIPATED IN DEVELOPMENT TRAINING
HAS AN INDIVIDUAL DEVELOPMENT PLAN
295Employees at DC
17%
23%
77%
73%
58%
52%50%
14%
PEOPLE 35Annual Report 2018
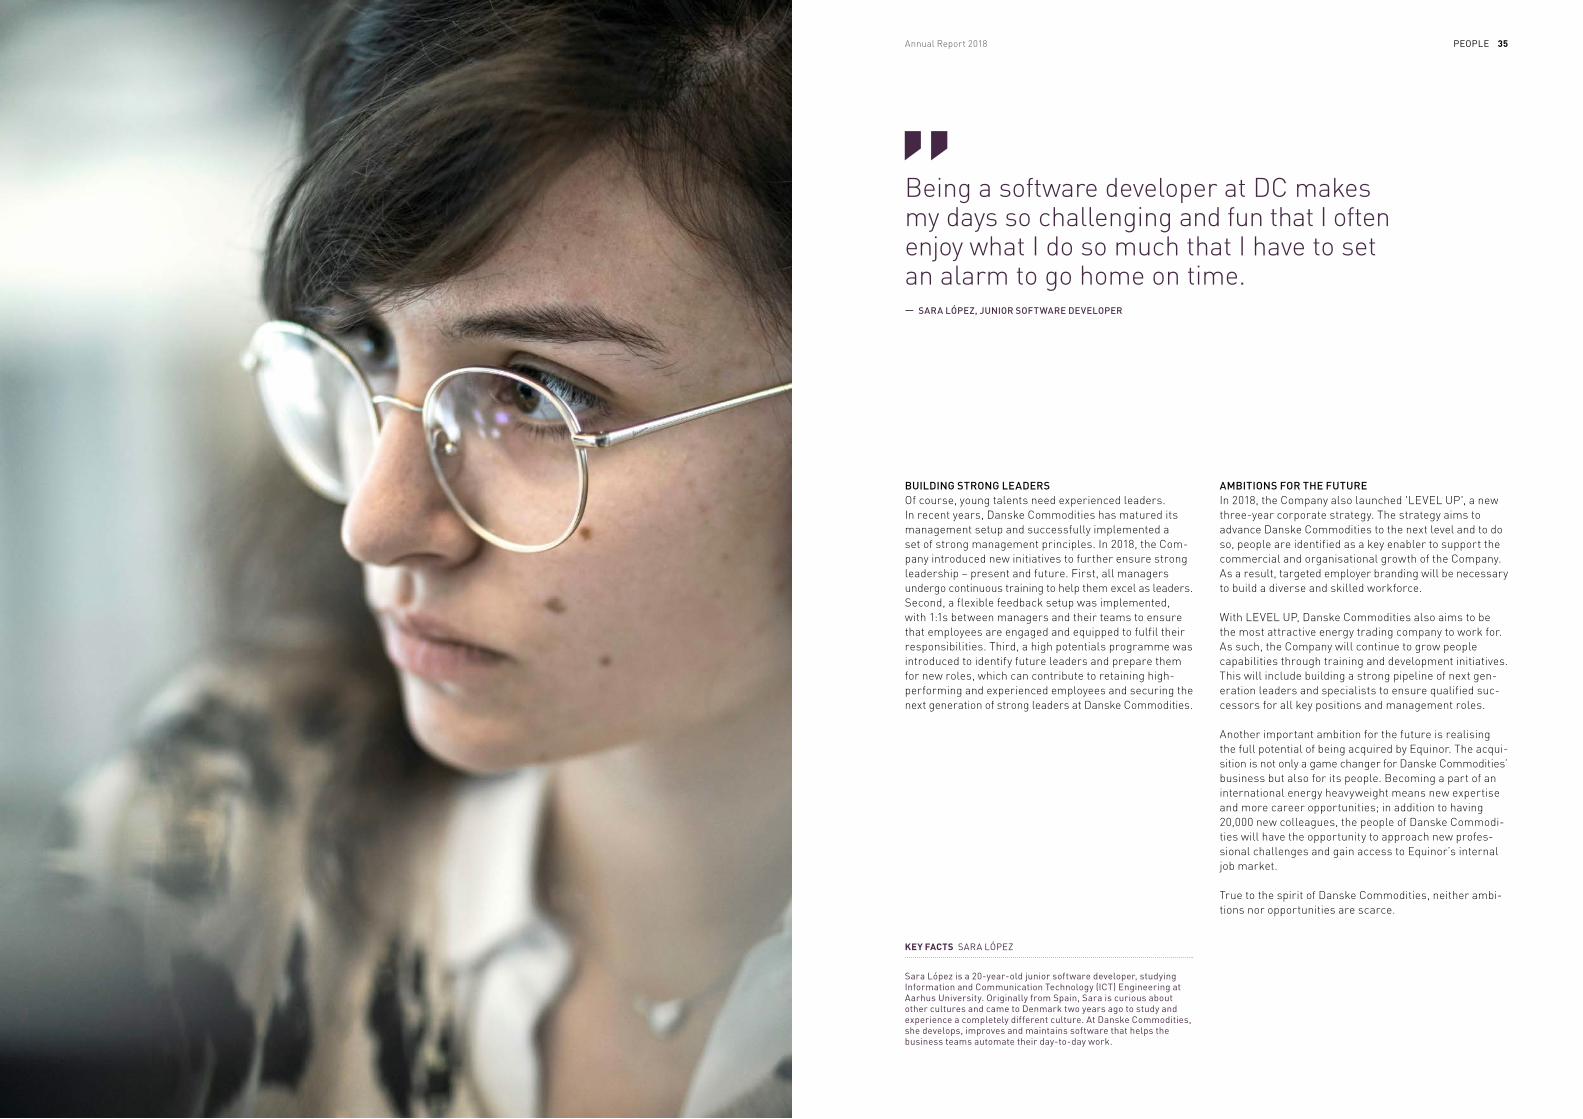
Being a software developer at DC makes my days so challenging and fun that I often enjoy what I do so much that I have to set an alarm to go home on time.— SARA LÓPEZ, JUNIOR SOFTWARE DEVELOPER
BUILDING STRONG LEADERSOf course, young talents need experienced leaders. In recent years, Danske Commodities has matured its management setup and successfully implemented a set of strong management principles. In 2018, the Com-pany introduced new initiatives to further ensure strong leadership – present and future. First, all managers undergo continuous training to help them excel as leaders. Second, a flexible feedback setup was implemented, with 1:1s between managers and their teams to ensure that em ployees are engaged and equipped to fulfil their responsibilities. Third, a high potentials programme was introduced to identify future leaders and prepare them for new roles, which can contribute to retaining high- performing and experienced employees and securing the next generation of strong leaders at Danske Commodities.
Sara López is a 20-year-old junior software developer, studying Information and Communication Technology (ICT) Engineering at Aarhus University. Originally from Spain, Sara is curious about other cultures and came to Denmark two years ago to study and experience a completely different culture. At Danske Commodities, she develops, improves and maintains software that helps the business teams automate their day-to-day work.
KEY FACTS SARA LÓPEZ
AMBITIONS FOR THE FUTUREIn 2018, the Company also launched 'LEVEL UP', a new three-year corporate strategy. The strategy aims to ad vance Danske Commodities to the next level and to do so, people are identified as a key enabler to support the commercial and organisational growth of the Company. As a result, targeted employer branding will be necessary to build a diverse and skilled workforce.
With LEVEL UP, Danske Commodities also aims to be the most attractive energy trading company to work for. As such, the Company will continue to grow people ca pa bilities through training and development initiatives. This will include building a strong pipeline of next gen-eration leaders and specialists to ensure qualified suc-cessors for all key positions and management roles.
Another important ambition for the future is realising the full potential of being acquired by Equinor. The acqui - sition is not only a game changer for Danske Commodities’ business but also for its people. Becoming a part of an international energy heavyweight means new expertise and more career opportunities; in addition to having 20,000 new colleagues, the people of Danske Commodi-ties will have the opportunity to approach new profes-sional challenges and gain access to Equinor’s internal job market.
True to the spirit of Danske Commodities, neither ambi-tions nor opportunities are scarce.
STATUTORy REPORTING ON CORPORATE SOCIAL RESPONSIBILITy STATUTORy REPORTING ON CORPORATE SOCIAL RESPONSIBILITy36 37Danske Commodities Annual Report 2018
ETHICS
RELEVANT POLICIES According to Danske Commodities’ ethical standards, the Company does not tolerate its employees’ using of or accepting bribery or corruption. The compliance policy defines the relevant areas of work for Danske Com - modities’ compliance programme. This in - cludes anti-abuse regulations and anti-crime (money laundering, VAT fraud, bribery and corruption). The Company monitors the developments in market practice and the industry’s interpretation of the regulations closely to ensure compliance. This will remain a key focus area going forward.
IMPLEMENTATIONCompliance guidelines and relevant training courses are available to all employees on Danske Commodities’ intranet. Training in anti-abuse regulations is mandatory for traders and portfolio managers and in 2018, the Company conducted training in anti- money laundering. Furthermore, all counter- parties with whom the Company engages undergo a know your Customer (kyC) process, which includes the performance of thorough background checks and finan - cial assessments.
Danske Commodities has a whistle-blower procedure which gives employees and other stakeholders related to the Company a channel to freely and anonymously express any irregularities or violations of the law.
RISKSCompliance risk at Danske Commodities is defined as the risks posed to Danske Commodities’ financial, organisational or reputational standing, resulting from failure to act in accordance with laws, regulations, internal policies and prescribed standards and practices related to the energy markets industry. Thus, the Company has a strict focus on mitigating compliance risk.
Danske Commodities is committed to being a responsible market participant, to sup - porting a well-functioning and stable market and to mitigating the risk of market abuse. This is done in close interaction between the Compliance team and the front office and through training sessions and guidelines.
KPIS/RESULTS IN 2018Anti-abuse training conducted for all traders and portfolio managers.
MiFID II compliance programme imple - mented.
Control measures carried out, showing that traders have a robust approach to and understanding of anti-abuse regulations.
PRIORITIES FOR 2019Enhance and refine the regulatory reporting setup (reporting of transaction under EMIR and REMIT).
Refine the monitoring and control setup (trade surveillance and internal controls).
Participate in the industry’s efforts to ensure a well-functioning energy market.
TRADING FOR AN EFFICIENT TOMORROW
Acting with responsibility is firmly embedded in the culture, values and business practices of Danske Commodities. Danske Commodities supports the transition towards more green energy across Europe by connecting wind turbines and solar panels to the markets, thereby making renewable energy more efficient. Supported by the Company’s vision of trading for an efficient tomorrow, Danske Commodities employs a Corporate Social Responsibility (CSR) approach covering four main themes: Ethics, equality, people and planet.
EQUALITY
RELEVANT POLICIES Danske Commodities respects human rights and continuously embeds human rights in its business processes. The Company does not accept the violation of human rights by its employees, customers, partners or other stakeholders, neither through direct parti - cipation nor by silently standing by. For infor - mation about Danske Commodities’ gender policy for management, see the group policy of Lind Invest: https://lind-invest.dk/wp-content/uploads/2019/02/Diversification-in-management-in-the-Lind-Invest-group-2018.pdf.
The Company’s focus areas in relation to human rights are to avoid discrimination, maintain a high level of personal safety and security and to protect the privacy of the individual. Danske Commodities believes that a diversified workforce benefits inno va - tion and outperforms homogeneous teams. The Company’s recruitment process sup - ports finding the right candidate in relation to the strategic challenges and objectives without discriminating. As such, Danske Commodities evaluates applicants equally regardless of age, gender, nationality, reli - gion and sexual orientation.
Furthermore, Danske Commodities’ IT secu rity policy defines how the company
handles and protects information. For Danske Commodities, it is vital to have a reliable data protection setup internally and externally, protecting both personal infor - mation and business-critical information in accordance with the General Data Protection Regulation (GDPR).
IMPLEMENTATIONIn order to proactively maintain high per - sonal safety, the Company has an emergency contingency plan and an established Work Environment Organisation (WEO), along with a safety committee dealing with strategic issues. Danske Commodities does not accept discrimination and has a zero-tolerance policy for workplace harassment. This is outlined in the Company’s People Handbook, which is read and signed by all employees.
The Company implemented GDPR in 2018, leading to an increased awareness of handling and protecting personal data at Danske Commodities.
Danske Commodities took measures to strengthen its IT security by introducing IT security awareness training. The training was mandatory for all employees and super - vised by Danish transmission system operator (TSO) Energinet.
RISKSAs a growing company, securing data and protecting the business becomes increas - ingly important, as corporate cyber-attacks can have serious consequences. Accidents and privacy violations can cause harm in many ways, which is why Danske Commo - dities has preventive processes, a People Handbook and carries out informative cam - paigns to uphold high safety and security levels. Moreover, discrimination is a risk to both the individual employee and to the reputation of Danske Commodities.
KPIS/RESULTS IN 2018No violations of human rights or cases related to discrimination were reported in 2018.
IT security awareness training courses were conducted from June to August 2018 with a 100% attendance rate.
A GDPR awareness campaign was conducted and GDPR compliant processes and proce - dures were implemented.
PRIORITIES FOR 2019Improve paternity leave conditions from 2 to 16 weeks with full pay.
Intensify focus on gender diversity.
PEOPLE
POLICIES AND IMPLEMENTATIONIn 2018, Danske Commodities focused on employee development, health and on pro actively boosting performance and motivation.
EMPLOYEE DEVELOPMENTResearch into the younger generations of the workforce confirms that direction and a continuous feeling of progression is at the top of their agenda. Given that Danske Commodities has a very young and ambitious workforce, providing longer-term career perspectives is essential for keeping employ - ees engaged and on board.
All permanent staff in Danske Commodities were offered Individual Development Plans (IDPs) in 2018. 50% are now engaged in the IDP process in cooperation with their imme - diate manager. All managers have com pleted courses and workshops quali fying them to facilitate development and career talks.
HEALTHDanske Commodities provides a safe and healthy working environment. Each year, the Company conducts employee surveys and in 2018, Danske Commodities also carried out a workplace assessment. On a day-to-day basis, the Work Environment Organisation (WEO) ensures that the em - ployees work in a healthy working environ - ment – both physically and mentally.
Danske Commodities takes responsibility for the well-being of its employees. In 2018, the Company introduced monthly topics from its DC Health ambassadors to inspire all employees to lead a healthy lifestyle. Sporting events were organised throughout the year by DC Sports volunteers.
KPIS/RESULTS IN 201850% of all permanent staff are engaged in an IDP process.
A total of 134 events for mental and physical health were carried out in 2018.
An Ennova survey on overall motivation was conducted.
RISKSOperating in a traditionally male dominated industry, it has at times proven difficult for Danske Commodities to attract female candidates. Consequently, in the coming fiscal year, the Company will among other things focus on renewing the recruitment process as well as training managers to avoid bias when recruiting.
PRIORITIES FOR 2019Boost business maturity by employing more senior profiles.
Improve employer contribution to pension scheme for employees from 5% to 10%.
Leverage career opportunities in and beyond Danske Commodities.
Grow next generation leaders.
STATUTORy REPORTING ON CORPORATE SOCIAL RESPONSIBILITy 39Annual Report 2018STATUTORy REPORTING ON CORPORATE SOCIAL RESPONSIBILITy38 Danske Commodities
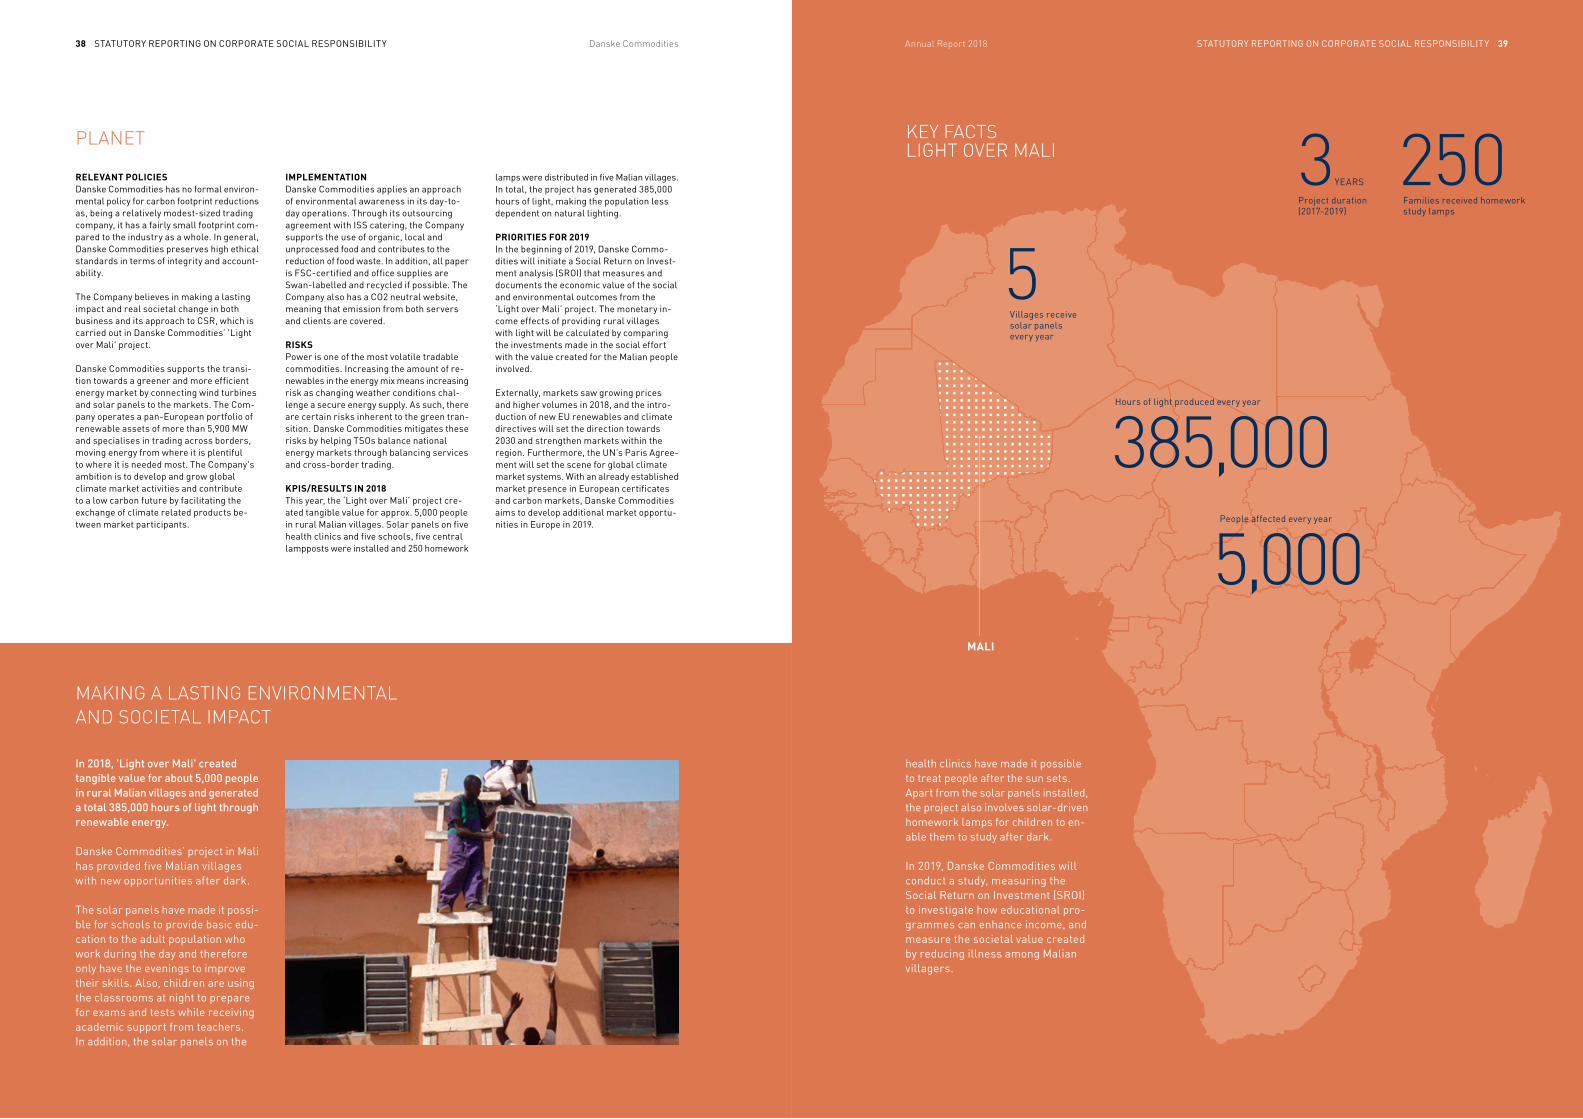
In 2018, 'Light over Mali' created tangible value for about 5,000 people in rural Malian villages and generated a total 385,000 hours of light through renewable energy.
Danske Commodities’ project in Mali has provided five Malian villages with new opportunities after dark.
The solar panels have made it possi - ble for schools to provide basic edu-cation to the adult population who work during the day and therefore only have the evenings to im prove their skills. Also, children are using the classrooms at night to prepare for exams and tests while receiving academic support from teachers. In addition, the solar panels on the
MAKING A LASTING ENVIRONMENTAL AND SOCIETAL IMPACT
PLANET
RELEVANT POLICIES Danske Commodities has no formal environ - mental policy for carbon footprint reductions as, being a relatively modest-sized trading company, it has a fairly small footprint com - pared to the industry as a whole. In general, Danske Commodities preserves high ethical standards in terms of integrity and account - ability.
The Company believes in making a lasting impact and real societal change in both business and its approach to CSR, which is carried out in Danske Commodities’ 'Light over Mali' project.
Danske Commodities supports the transi - tion towards a greener and more efficient energy market by connecting wind turbines and solar panels to the markets. The Com - pany operates a pan-European portfolio of renew able assets of more than 5,900 MW and spe cialises in trading across borders, moving energy from where it is plentiful to where it is needed most. The Company's ambition is to develop and grow global cli mate market activities and contribute to a low carbon fu ture by facilitating the ex change of climate related products be - tween market parti ci pants.
IMPLEMENTATIONDanske Commodities applies an approach of environmental awareness in its day-to- day operations. Through its outsourcing agree ment with ISS catering, the Company sup ports the use of organic, local and un pro cessed food and contributes to the re duc tion of food waste. In addition, all paper is FSC-certified and office supplies are Swan-labelled and recycled if possible. The Company also has a CO2 neutral website, meaning that emission from both servers and clients are covered.
RISKSPower is one of the most volatile tradable commodities. Increasing the amount of re - newables in the energy mix means increasing risk as changing weather conditions chal - lenge a secure energy supply. As such, there are certain risks inherent to the green tran - sition. Danske Commodities mitigates these risks by helping TSOs balance national energy markets through balancing services and cross-border trading.
KPIS/RESULTS IN 2018 This year, the ‘Light over Mali’ project cre - ated tangible value for approx. 5,000 people in rural Malian villages. Solar panels on five health clinics and five schools, five central lampposts were installed and 250 homework
lamps were distributed in five Malian villages. In total, the project has generated 385,000 hours of light, making the popu lation less dependent on natural lighting.
PRIORITIES FOR 2019In the beginning of 2019, Danske Commo - dities will initiate a Social Return on Invest - ment analysis (SROI) that measures and documents the economic value of the social and environmental outcomes from the ‘Light over Mali’ project. The monetary in - come effects of providing rural villages with light will be calculated by comparing the investments made in the social effort with the value created for the Malian people involved.
Externally, markets saw growing prices and higher volumes in 2018, and the intro - duction of new EU renewables and climate directives will set the direction towards 2030 and strengthen markets within the region. Furthermore, the UN’s Paris Agree - ment will set the scene for global climate market systems. With an already estab lished market presence in European certif icates and carbon markets, Danske Com modities aims to develop additional market opportu - nities in Europe in 2019.
2503
5Families received homework study lamps
Project duration (2017-2019)
yEARS
Villages receive solar panels every year
health clinics have made it possible to treat people after the sun sets. Apart from the solar panels installed, the project also involves solar-driven homework lamps for children to en - able them to study after dark.
In 2019, Danske Commodities will conduct a study, measuring the Social Return on Investment (SROI) to investigate how educational pro-grammes can enhance income, and measure the societal value created by reducing illness among Malian villagers.
385,000
5,000
Hours of light produced every year
People affected every year
KEY FACTS LIGHT OVER MALI
MALI
CORPORATE GOVERNANCE40
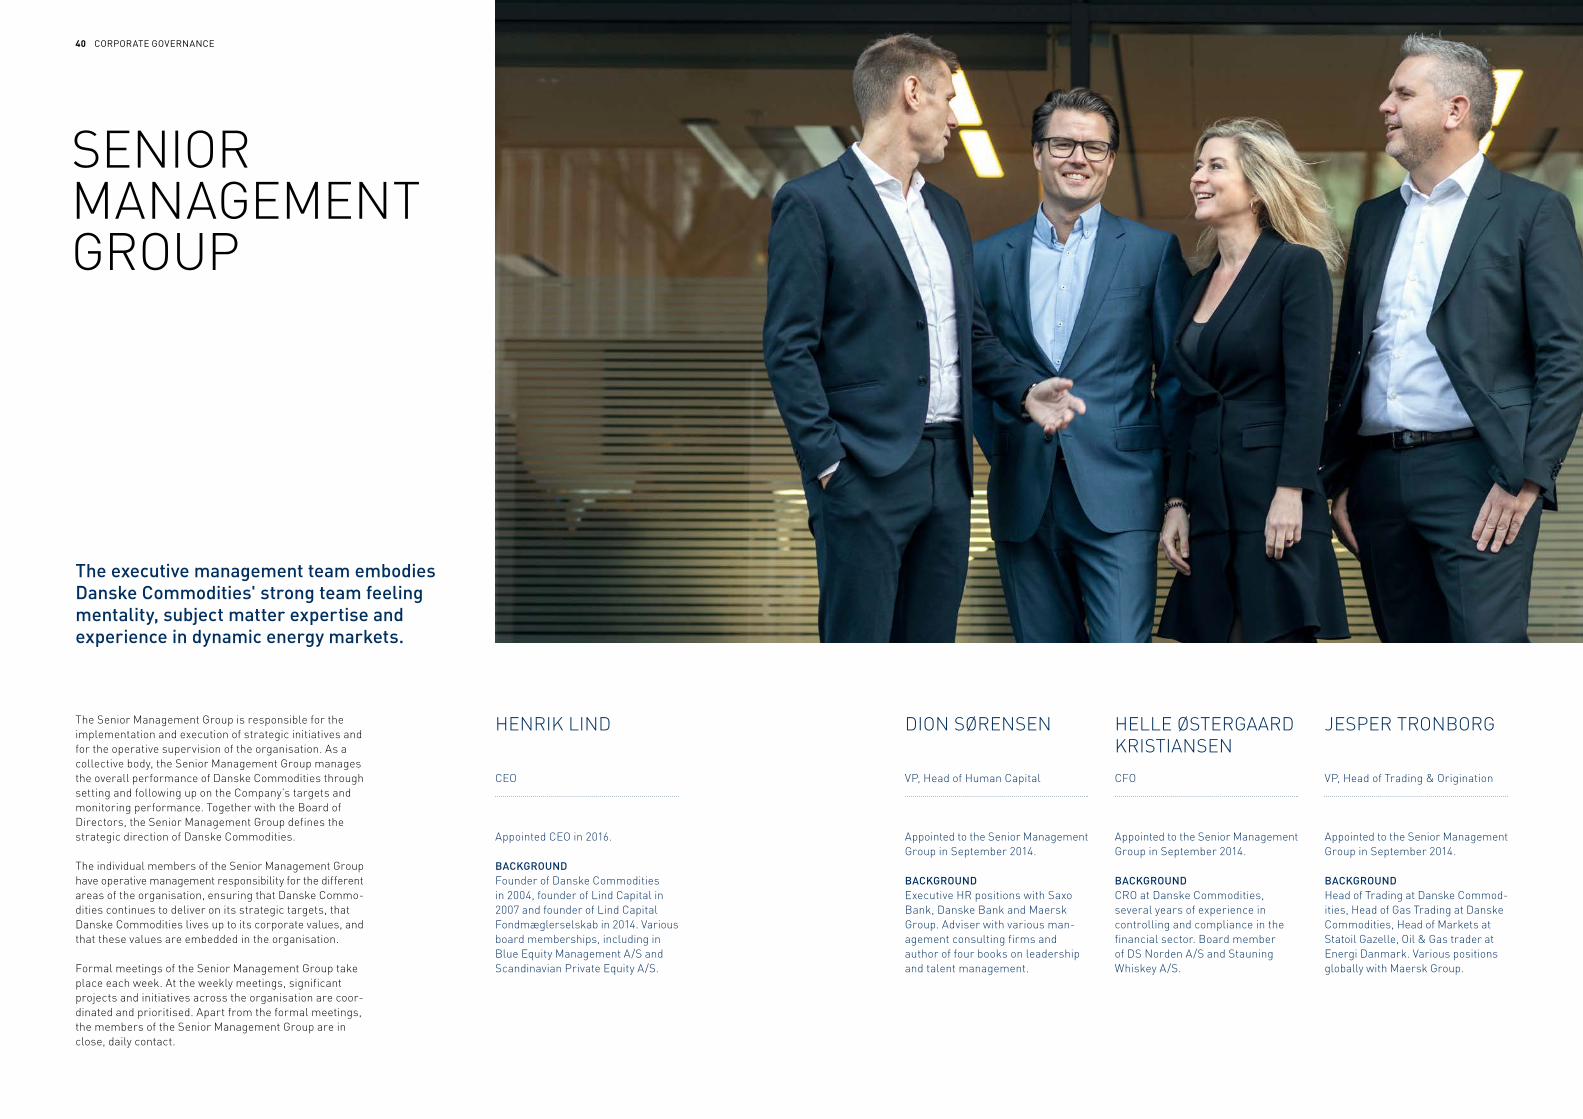
SENIOR MANAGEMENT GROUP
The executive management team embodies Danske Commodities' strong team feeling mentality, subject matter expertise and experience in dynamic energy markets.
The Senior Management Group is responsible for the implementation and execution of strategic initiatives and for the operative supervision of the organisation. As a collective body, the Senior Management Group manages the overall performance of Danske Commodities through setting and following up on the Company’s targets and monitoring performance. Together with the Board of Directors, the Senior Management Group defines the strategic direction of Danske Commodities.
The individual members of the Senior Management Group have operative management responsibility for the different areas of the organisation, ensuring that Danske Commo - dities continues to deliver on its strategic targets, that Danske Commodities lives up to its corporate values, and that these values are embedded in the organisation.
Formal meetings of the Senior Management Group take place each week. At the weekly meetings, significant projects and initiatives across the organisation are coor-dinated and prioritised. Apart from the formal meetings, the members of the Senior Management Group are in close, daily contact.
HENRIK LIND
CEO
Appointed CEO in 2016.
BACKGROUND Founder of Danske Commodities in 2004, founder of Lind Capital in 2007 and founder of Lind Capital Fondmæglerselskab in 2014. Various board memberships, including in Blue Equity Management A/S and Scandinavian Private Equity A/S.
DION SØRENSEN
VP, Head of Human Capital
Appointed to the Senior Management Group in September 2014.
BACKGROUND Executive HR positions with Saxo Bank, Danske Bank and Maersk Group. Adviser with various man-agement consulting firms and author of four books on leadership and talent management.
HELLE ØSTERGAARD KRISTIANSEN
CFO
Appointed to the Senior Management Group in September 2014.
BACKGROUNDCRO at Danske Commodities, several years of experience in controlling and compliance in the financial sector. Board member of DS Norden A/S and Stauning Whiskey A/S.
JESPER TRONBORG
VP, Head of Trading & Origination
Appointed to the Senior Management Group in September 2014.
BACKGROUNDHead of Trading at Danske Commod-ities, Head of Gas Trading at Danske Commodities, Head of Markets at Statoil Gazelle, Oil & Gas trader at Energi Danmark. Various positions globally with Maersk Group.
CORPORATE GOVERNANCE CORPORATE GOVERNANCE42 43Danske Commodities Annual Report 2018
The objective of the Board of Directors is to promote the long-term interests of Danske Commodities. As part of creating long-term, sustainable value, Danske Com-modities establishes and maintains strong, constructive relationships with its primary stakeholders. This includes shareholders, customers, counterparties, regulatory entities and other relevant external partners.
The Board of Directors is responsible for the overall strategic direction of Danske Commodities and oversees that the financial and general management of the Group is conducted effectively in all respects. In this role, the
Board acts as formal advisers to the Company’s Senior Management Group in relation to strategic initiatives and monitors the Group’s financial condition, risk man-agement and business activities on an ongoing basis.
The members of the Board of Directors have been ap-pointed with a view to ensuring the Board’s independence of any special interests. Formal meetings of the Board of Directors are held six times a year.
BOARD OF DIRECTORSMembers of the Board of Directors combine key industry insights, expertise from European energy markets, risk management and financial skills with several years of management experience from international businesses.
KEY SKILLSIT, risk management, corporate governance, leadership and internationalisation.
BACKGROUNDLong-standing career at SimCorp (1983-2012), including 11 years as CEO. MSc in Engineering and PhD in System Science. Diploma in Business Administration (Finance and Credit).
BOARD MEMBERSHIPSSystematic A/S (Chairman), Stibo A/S (Chairman) and Adform A/S (Chairman).
Appointed to the Board in 2013
KEY SKILLSFinance, strategy, valuations, risk management, performance management, M&A and upstream oil and gas.
BACKGROUNDVice President Finance & Control, Marketing, Midstream and Processing, Equinor ASA. MSc in Economics and Finance. Joined Equinor in 2003. Previously held the role as CFO for Equinor’s US business.
BOARD MEMBERSHIPSEquinor UK. Previously served on the boards of various Equinor ASA subsidiaries.
Appointed to the Board in 2019
KEY SKILLSGeneral management, sales, internationalisation, energy and growth.
BACKGROUNDPresident & CEO, Rambøll Group, Denmark. Former President and CEO, Siemens Wind Power, Denmark. Dipl. Ing. Energy and Process Technology.
BOARD MEMBERSHIPSThe Danish-German Chamber of Commerce (Chairman) and Confederation of Danish Industry’s Committee on Business Policy.
Appointed to the Board in 2014
KEY SKILLSCorporate governance, anti- corruption and ethics, corporate law, M&A, general management, emergency preparedness, petroleum law including midstream and downstream.
BACKGROUNDVice President Communications, CEO Office, Equinor ASA. MSc in Law. Joined Equinor in 1998. Previous legal experience from the private and public sectors.
BOARD MEMBERSHIPSCurrently none. Previously served on the boards of various Equinor ASA subsidiaries.
Appointed to the Board in 2019
KEY SKILLSEnergy sales and markets, business development, strategy and management.
BACKGROUNDSenior Vice President Business Development, New Energy Solutions, Equinor ASA. MSc in Business. Joined Equinor in 1994. Experienced leader with broad knowledge of the entire energy value chain.
BOARD MEMBERSHIPSCurrently none.
Appointed to the Board in 2019
KEY SKILLSEnergy trading and marketing, energy value chains, strategy, business and people management.
BACKGROUNDSenior Vice President Marketing and Trading, Marketing, Midstream and Processing, Equinor ASA. BSc. in Business (hon). Joined Equinor in 1991. More than 20 years of management experience from the energy sector.
BOARD MEMBERSHIPS Synergen – Dublin Bay Power. Eurogas. Various positions as chairman and board member of Equinor subsidiaries.
Appointed to the Board in 2019
TOR MARTIN ANFINNSEN
PETER LORENS RAVNHELGE HAUGANE
CHAIRMAN BOARD MEMBER BOARD MEMBER BOARD MEMBERBOARD MEMBERVICE CHAIRMAN
JENS-PETER SAUL SIV HELEN RYGH TORSTENSEN
JENS ØKLAND
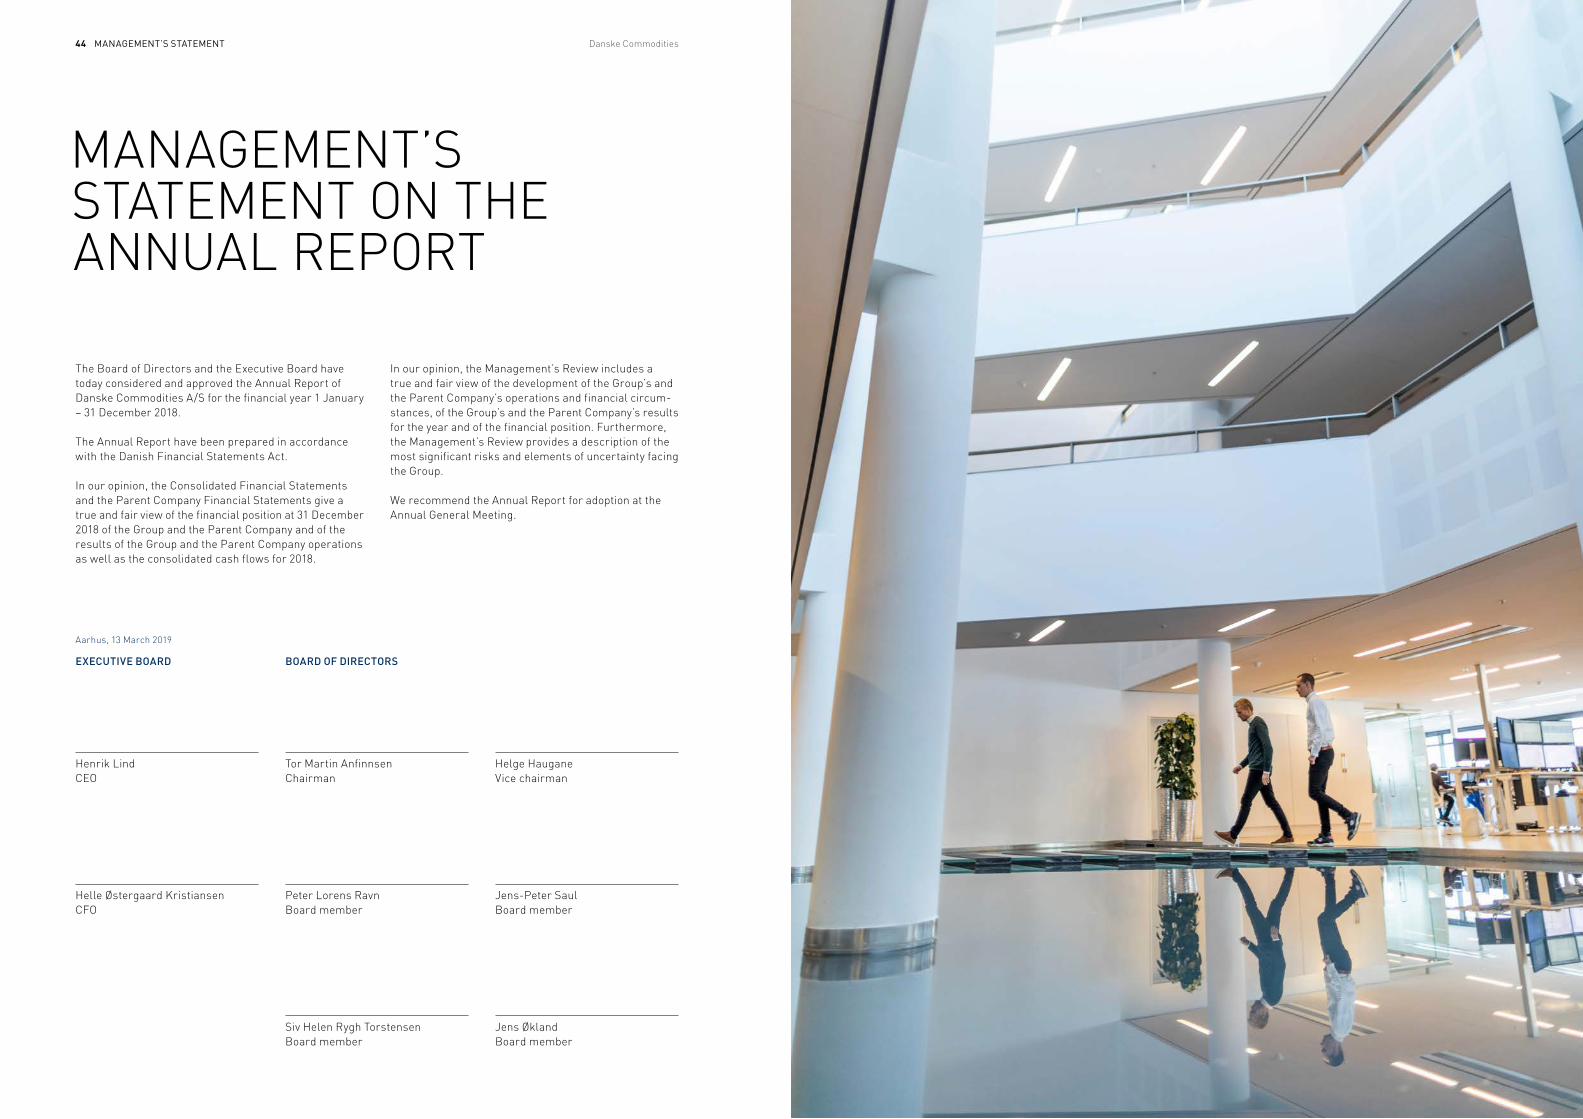
MANAGEMENT’S STATEMENT44 Danske Commodities
MANAGEMENT’S STATEMENT ON THE ANNUAL REPORT
The Board of Directors and the Executive Board have today considered and approved the Annual Report of Danske Commodities A/S for the financial year 1 January – 31 December 2018.
The Annual Report have been prepared in accordance with the Danish Financial Statements Act.
In our opinion, the Consolidated Financial Statements and the Parent Company Financial Statements give a true and fair view of the financial position at 31 December 2018 of the Group and the Parent Company and of the results of the Group and the Parent Company operations as well as the consolidated cash flows for 2018.
Aarhus, 13 March 2019
EXECUTIVE BOARD BOARD OF DIRECTORS
Jens Økland Board member
Siv Helen Rygh Torstensen Board member
Jens-Peter Saul Board member
Helge Haugane Vice chairman
Helle Østergaard Kristiansen CFO
Tor Martin AnfinnsenChairman
Henrik Lind CEO
Peter Lorens Ravn Board member
In our opinion, the Management’s Review includes a true and fair view of the development of the Group’s and the Parent Company’s operations and financial circum-stances, of the Group’s and the Parent Company’s results for the year and of the financial position. Furthermore, the Man agement’s Review provides a description of the most signi ficant risks and elements of uncertainty facing the Group.
We recommend the Annual Report for adoption at the Annual General Meeting.
INDEPENDENT AUDITOR’S REPORT INDEPENDENT AUDITOR’S REPORT46 47Danske Commodities Annual Report 2018
AUDITOR’S RESPONSIBILITIES FOR THE AUDIT OF THE FINANCIAL STATEMENTS Our objectives are to obtain reasonable assurance about whether the financial statements as a whole are free from material misstatement, whether due to fraud or error, and to issue an auditor’s report that includes our opinion. Reasonable assurance is a high level of assurance, but is not a guarantee that an audit conducted in accordance with ISAs and the additional requirements applicable in Denmark will always detect a material misstatement when it exists. Misstatements can arise from fraud or error and are considered material if, individually or in the aggregate, they could reasonably be expected to influence the economic decisions of users taken on the basis of these financial statements.
As part of an audit conducted in accordance with ISAs and the additional requirements applicable in Denmark, we exercise professional judgment and maintain profes-sional skepticism throughout the audit. We also:
■ Identify and assess the risks of material misstatement of the financial statements, whether due to fraud or error, design and perform audit procedures responsive to those risks, and obtain audit evidence that is suffi-cient and appropriate to provide a basis for our opinion. The risk of not detecting a material misstatement resulting from fraud is higher than for one resulting from error as fraud may involve collusion, forgery, intentional omissions, misrepresentations, or the over - ride of internal control.
■ Obtain an understanding of internal control relevant to the audit in order to design audit procedures that are appropriate in the circumstances, but not for the pur-pose of expressing an opinion on the effectiveness of the Group’s and the Parent Company’s internal control.
■ Evaluate the appropriateness of accounting policies used and the reasonableness of accounting estimates and related disclosures made by Management.
■ Conclude on the appropriateness of Management’s use of the going concern basis of accounting in pre-paring the financial statements and, based on the audit evidence obtained, whether a material uncer-tainty exists related to events or conditions that may cast significant doubt on the Group’s and the Parent Company’s ability to continue as a going concern. If we con clude that a material uncertainty exists, we are required to draw attention in our auditor’s report to the related disclosures in the financial statements or, if such disclosures are inadequate, to modify our opinion. Our conclusions are based on the audit evi-dence obtained up to the date of our auditor’s report. However, future events or conditions may cause the Group and the Parent Company to cease to continue as a going concern.
■ Evaluate the overall presentation, structure and con-tents of the financial statements, including the disclo-sures, and whether the financial statements represent the underlying transactions and events in a manner that gives a true and fair view.
■ Obtain sufficient appropriate audit evidence regarding the financial information of the entities or business activities within the Group to express an opinion on the Consolidated Financial Statements. We are respon-sible for the direction, supervision and performance of the group audit. We remain solely responsible for our audit opinion.
We communicate with those charged with governance regarding, among other matters, the planned scope and timing of the audit and significant audit findings, including any significant deficiencies in internal control that we identify during our audit.
INDEPENDENT AUDITOR’S REPORT
To the Shareholders of Danske Commodities A/S
OPINIONIn our opinion, the Consolidated Financial Statements and the Parent Company Financial Statements give a true and fair view of the financial position of the Group and the Parent Company at 31 December 2018, and of the results of the Group’s and the Parent Company’s operations as well as the consolidated cash flows for the financial year 1 January – 31 December 2018 in accordance with the Danish Financial Statements Act.
We have audited the Consolidated Financial Statements and the Parent Company Financial Statements of Danske Commodities A/S for the financial year 1 January – 31 December 2018, which comprise income statement, balance sheet, statement of changes in equity and notes, including a summary of significant accounting policies, for both the Group and the Parent Company, as well as consolidated statement of cash flows (“financial statements”).
BASIS FOR OPINIONWe conducted our audit in accordance with International Standards on Auditing (ISAs) and the additional require-ments applicable in Denmark. Our responsibilities under those standards and requirements are further described in the Auditor’s Responsibilities for the Audit of the Finan - cial Statements section of our report. We are independ-ent of the Group in accordance with the International Ethics Standards Board for Accountants’ Code of Ethics for Professional Accountants (IESBA Code) and the addi-tional requirements applicable in Denmark, and we have fulfilled our other ethical responsibilities in accordance with these requirements. We believe that the audit evi-dence we have obtained is sufficient and appropriate to provide a basis for our opinion.
STATEMENT ON MANAGEMENT’S REVIEWManagement is responsible for Management’s Review.
Our opinion on the financial statements does not cover Management’s Review, and we do not express any form of assurance conclusion thereon.
In connection with our audit of the financial statements, our responsibility is to read Management’s Review and, in doing so, consider whether Management’s Review is materially inconsistent with the financial statements or our knowledge obtained during the audit, or otherwise appears to be materially misstated.
Moreover, it is our responsibility to consider whether Management’s Review provides the information required under the Danish Financials Statements Act.
Based on the work we have performed, in our view, Management’s Review is in accordance with the Consoli-dated Financial Statements and the Parent Company Financial Statements and has been prepared in accor-dance with the requirements of the Danish Financial Statement Act. We did not identify any material misstate - ment in Management’s Review.
MANAGEMENT’S RESPONSIBILITIES FOR THE FINANCIAL STATEMENTSManagement is responsible for the preparation of Consol idated Financial Statements and Parent Company Financial Statements that give a true and fair view in ac cordance with the Danish Financial Statements Act, and for such internal control as Management determines is necessary to enable the preparation of financial statements that are free from material misstatement, whether due to fraud or error.
In preparing the financial statements, Management is responsible for assessing the Group’s and the Parent Company’s ability to continue as a going concern, dis-closing, as applicable, matters related to going concern and using the going concern basis of accounting in pre-paring the financial statements unless Management either intends to liquidate the Group or the Parent Com-pany or to cease operations, or has no realistic alternative but to do so.
Aarhus, 13 March 2019
PricewaterhouseCoopers
Statsautoriseret
Revisionspartnerselskab
CVR.-no. 33 77 12 31
Rune Kjeldsen State Authorised Public Accountant mne34160
Henrik Kragh State Authorised Public Accountant mne26783
financial statements 49Annual Report 2018
income statement ............................................................................................ 51
Balance sheet ................................................................................................. 52
statement of changes in equity ...................................................................... 54
cash flow statement ....................................................................................... 55
notes ................................................................................................................. 56
1. Basis of Preparation and General Policies ........................................ 56
2. Revenue ................................................................................................ 57
3. costs ..................................................................................................... 57
4. financial income and expenses ......................................................... 58
5. tax on Profit/loss for the Year ........................................................... 59
6. intangible assets ................................................................................. 60
7. Property, Plant and equipment .......................................................... 61
8. investments in subsidiaries ................................................................ 62
9. investments in associated companies .............................................. 64
10. Other fixed asset investments ........................................................... 65
11. inventories ........................................................................................... 65
12. Receivables .......................................................................................... 65
13. current and Deferred tax ................................................................... 66
14. Prepayments ........................................................................................ 66
15. current asset investments ................................................................. 66
16. equity .................................................................................................... 67
17. long-term Debt ................................................................................... 67
18. short-term Debt .................................................................................. 67
19. Proposed Distribution of Profit ........................................................... 68
20. cash flow ............................................................................................. 68
21. Derivative financial instruments and fair Value measures ............. 69
22. security and Other financial Obligations .......................................... 71
23. Ownership and Related Parties .......................................................... 72
24. events after the Balance sheet Date .................................................. 72
25. Definitions of financial Ratios ............................................................ 72
FINANCIAL STATEMENTS
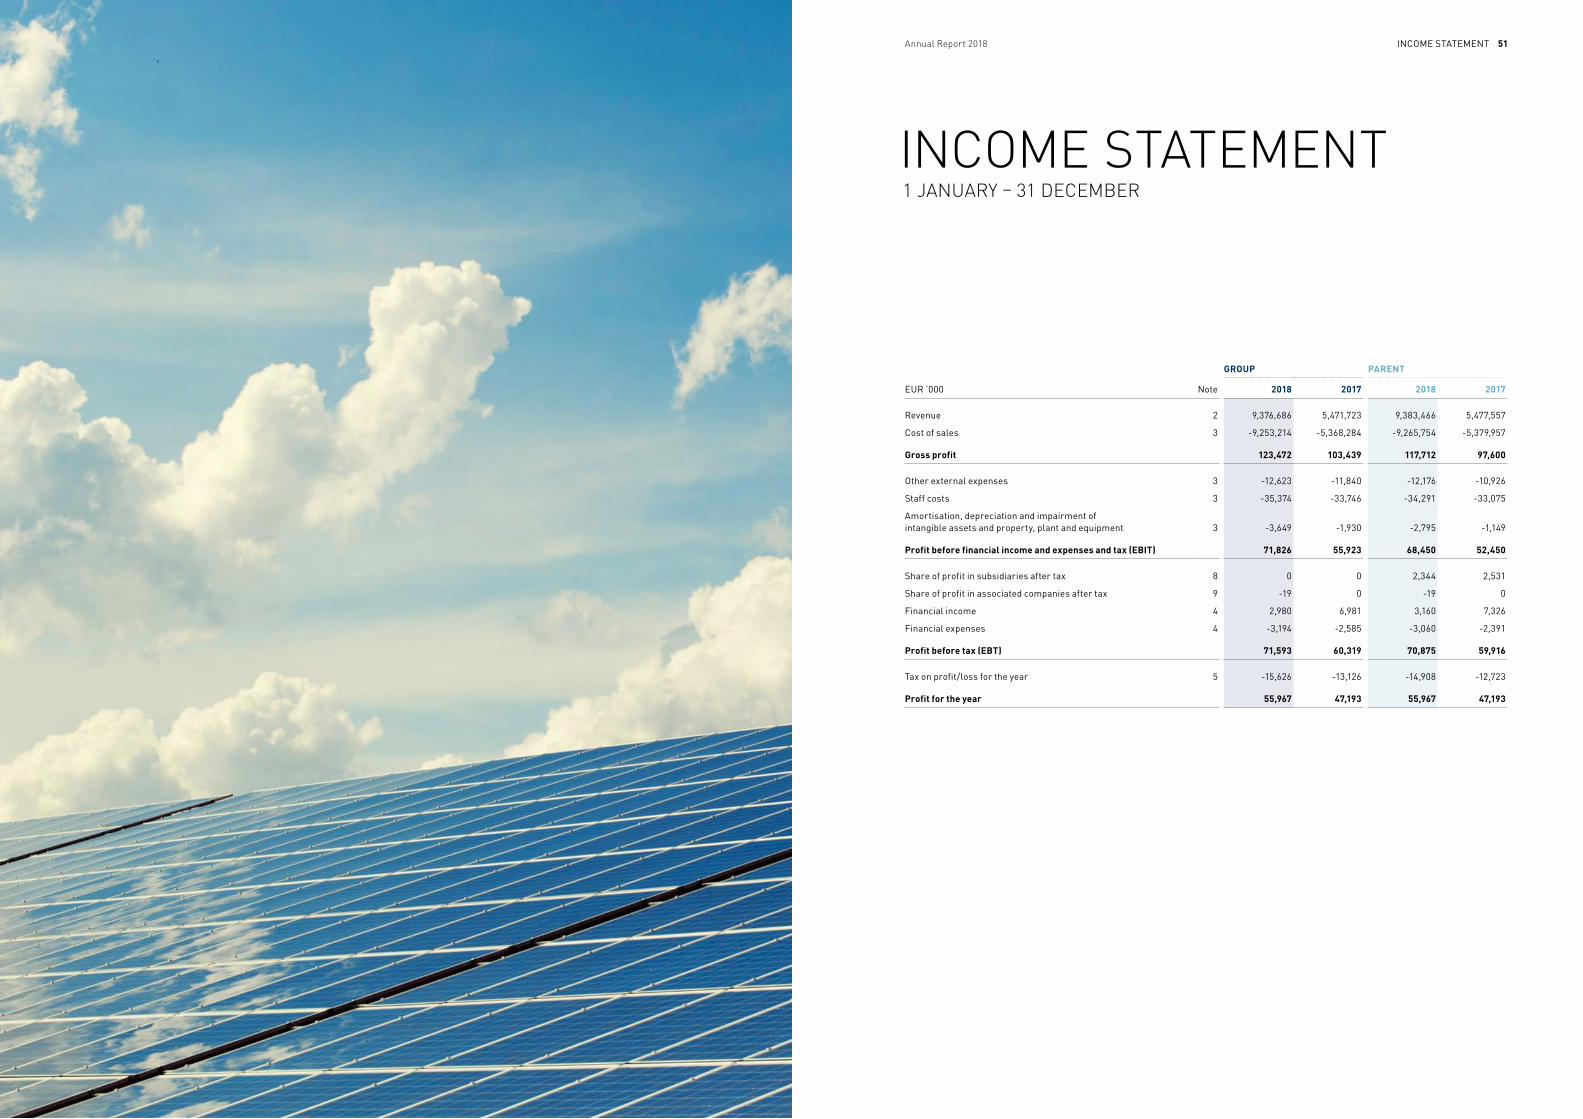
incOme statement 51Annual Report 2018
GROUP PARENT
eUR ’000 note 2018 2017 2018 2017
Revenue 2 9,376,686 5,471,723 9,383,466 5,477,557
cost of sales 3 -9,253,214 -5,368,284 -9,265,754 -5,379,957
Gross profit 123,472 103,439 117,712 97,600
Other external expenses 3 -12,623 -11,840 -12,176 -10,926
staff costs 3 -35,374 -33,746 -34,291 -33,075
amortisation, depreciation and impairment of intangible assets and property, plant and equipment 3 -3,649 -1,930 -2,795 -1,149
Profit before financial income and expenses and tax (EBIT) 71,826 55,923 68,450 52,450
share of profit in subsidiaries after tax 8 0 0 2,344 2,531
share of profit in associated companies after tax 9 -19 0 -19 0
financial income 4 2,980 6,981 3,160 7,326
financial expenses 4 -3,194 -2,585 -3,060 -2,391
Profit before tax (EBT) 71,593 60,319 70,875 59,916
tax on profit/loss for the year 5 -15,626 -13,126 -14,908 -12,723
Profit for the year 55,967 47,193 55,967 47,193
INCOME STATEMENT1 JANUARY – 31 DECEMBER
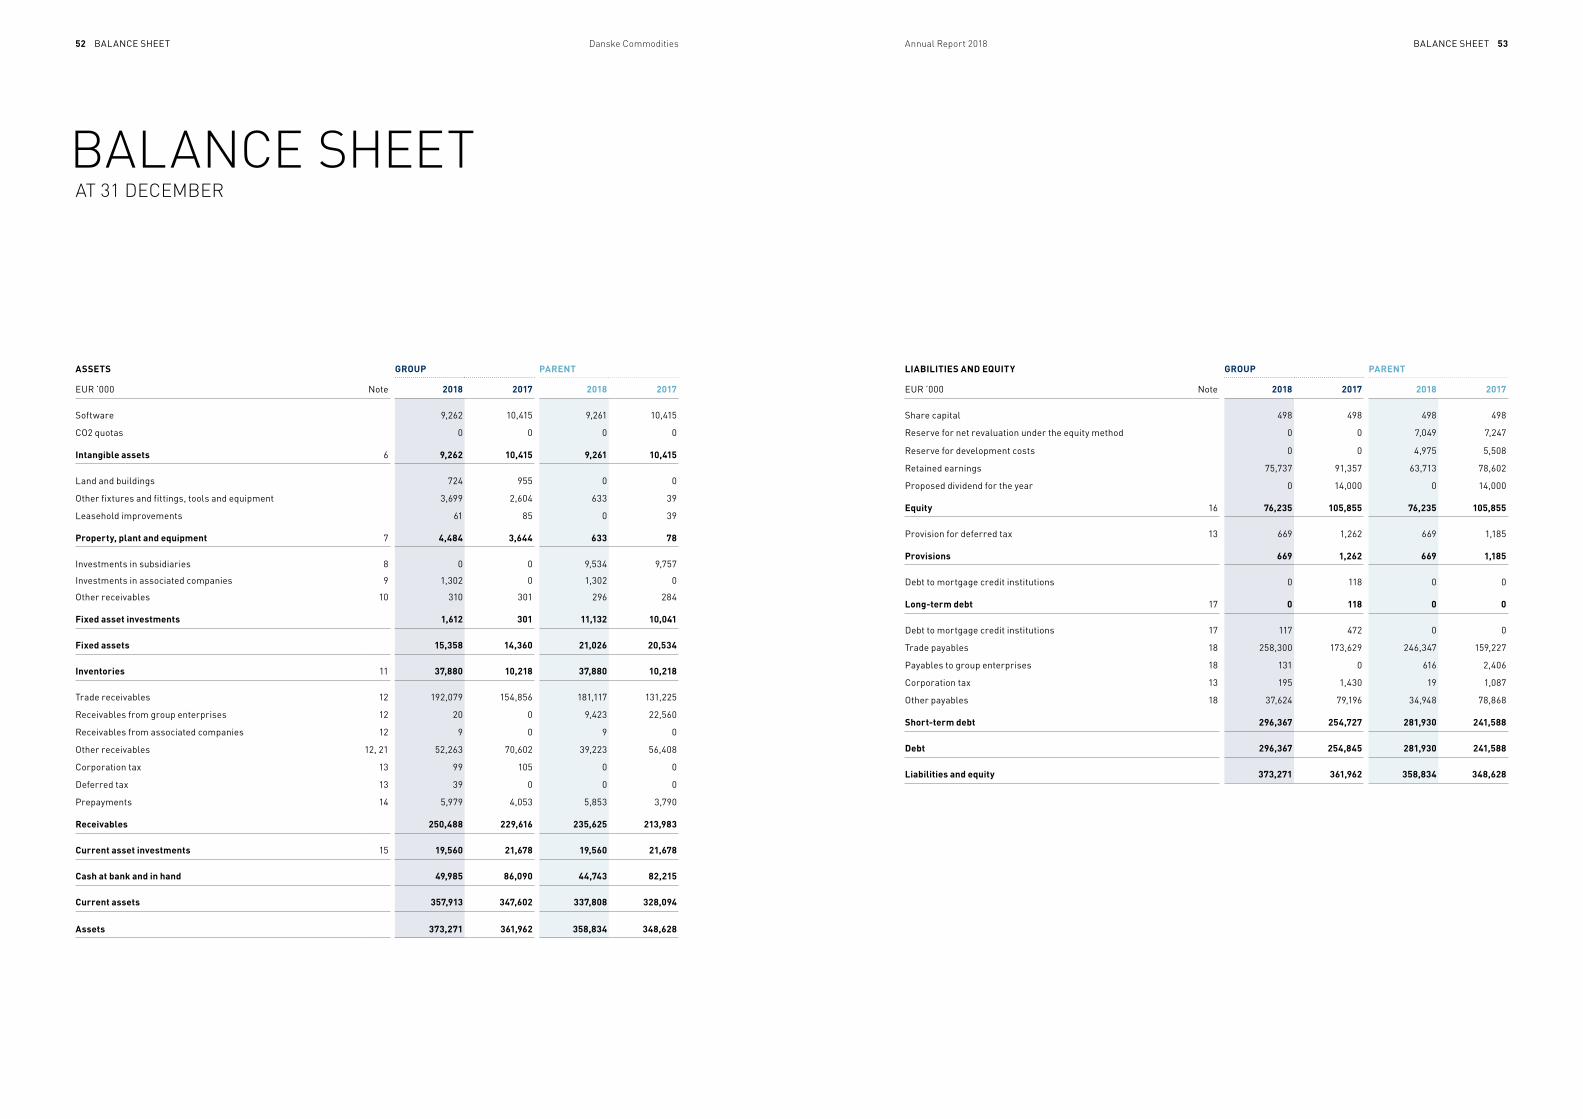
Balance sHeet Balance sHeet52 53Danske Commodities Annual Report 2018
BALANCE SHEET
ASSETS GROUP PARENT
eUR ’000 note 2018 2017 2018 2017
software 9,262 10,415 9,261 10,415
cO2 quotas 0 0 0 0
Intangible assets 6 9,262 10,415 9,261 10,415
land and buildings 724 955 0 0
Other fixtures and fittings, tools and equipment 3,699 2,604 633 39
leasehold improvements 61 85 0 39
Property, plant and equipment 7 4,484 3,644 633 78
investments in subsidiaries 8 0 0 9,534 9,757
investments in associated companies 9 1,302 0 1,302 0
Other receivables 10 310 301 296 284
Fixed asset investments 1,612 301 11,132 10,041
Fixed assets 15,358 14,360 21,026 20,534
Inventories 11 37,880 10,218 37,880 10,218
trade receivables 12 192,079 154,856 181,117 131,225
Receivables from group enterprises 12 20 0 9,423 22,560
Receivables from associated companies 12 9 0 9 0
Other receivables 12, 21 52,263 70,602 39,223 56,408
corporation tax 13 99 105 0 0
Deferred tax 13 39 0 0 0
Prepayments 14 5,979 4,053 5,853 3,790
Receivables 250,488 229,616 235,625 213,983
Current asset investments 15 19,560 21,678 19,560 21,678
Cash at bank and in hand 49,985 86,090 44,743 82,215
Current assets 357,913 347,602 337,808 328,094
Assets 373,271 361,962 358,834 348,628
LIABILITIES AND EQUITY GROUP PARENT
eUR ’000 note 2018 2017 2018 2017
share capital 498 498 498 498
Reserve for net revaluation under the equity method 0 0 7,049 7,247
Reserve for development costs 0 0 4,975 5,508
Retained earnings 75,737 91,357 63,713 78,602
Proposed dividend for the year 0 14,000 0 14,000
Equity 16 76,235 105,855 76,235 105,855
Provision for deferred tax 13 669 1,262 669 1,185
Provisions 669 1,262 669 1,185
Debt to mortgage credit institutions 0 118 0 0
Long-term debt 17 0 118 0 0
Debt to mortgage credit institutions 17 117 472 0 0
trade payables 18 258,300 173,629 246,347 159,227
Payables to group enterprises 18 131 0 616 2,406
corporation tax 13 195 1,430 19 1,087
Other payables 18 37,624 79,196 34,948 78,868
Short-term debt 296,367 254,727 281,930 241,588
Debt 296,367 254,845 281,930 241,588
Liabilities and equity 373,271 361,962 358,834 348,628
AT 31 DECEMBER
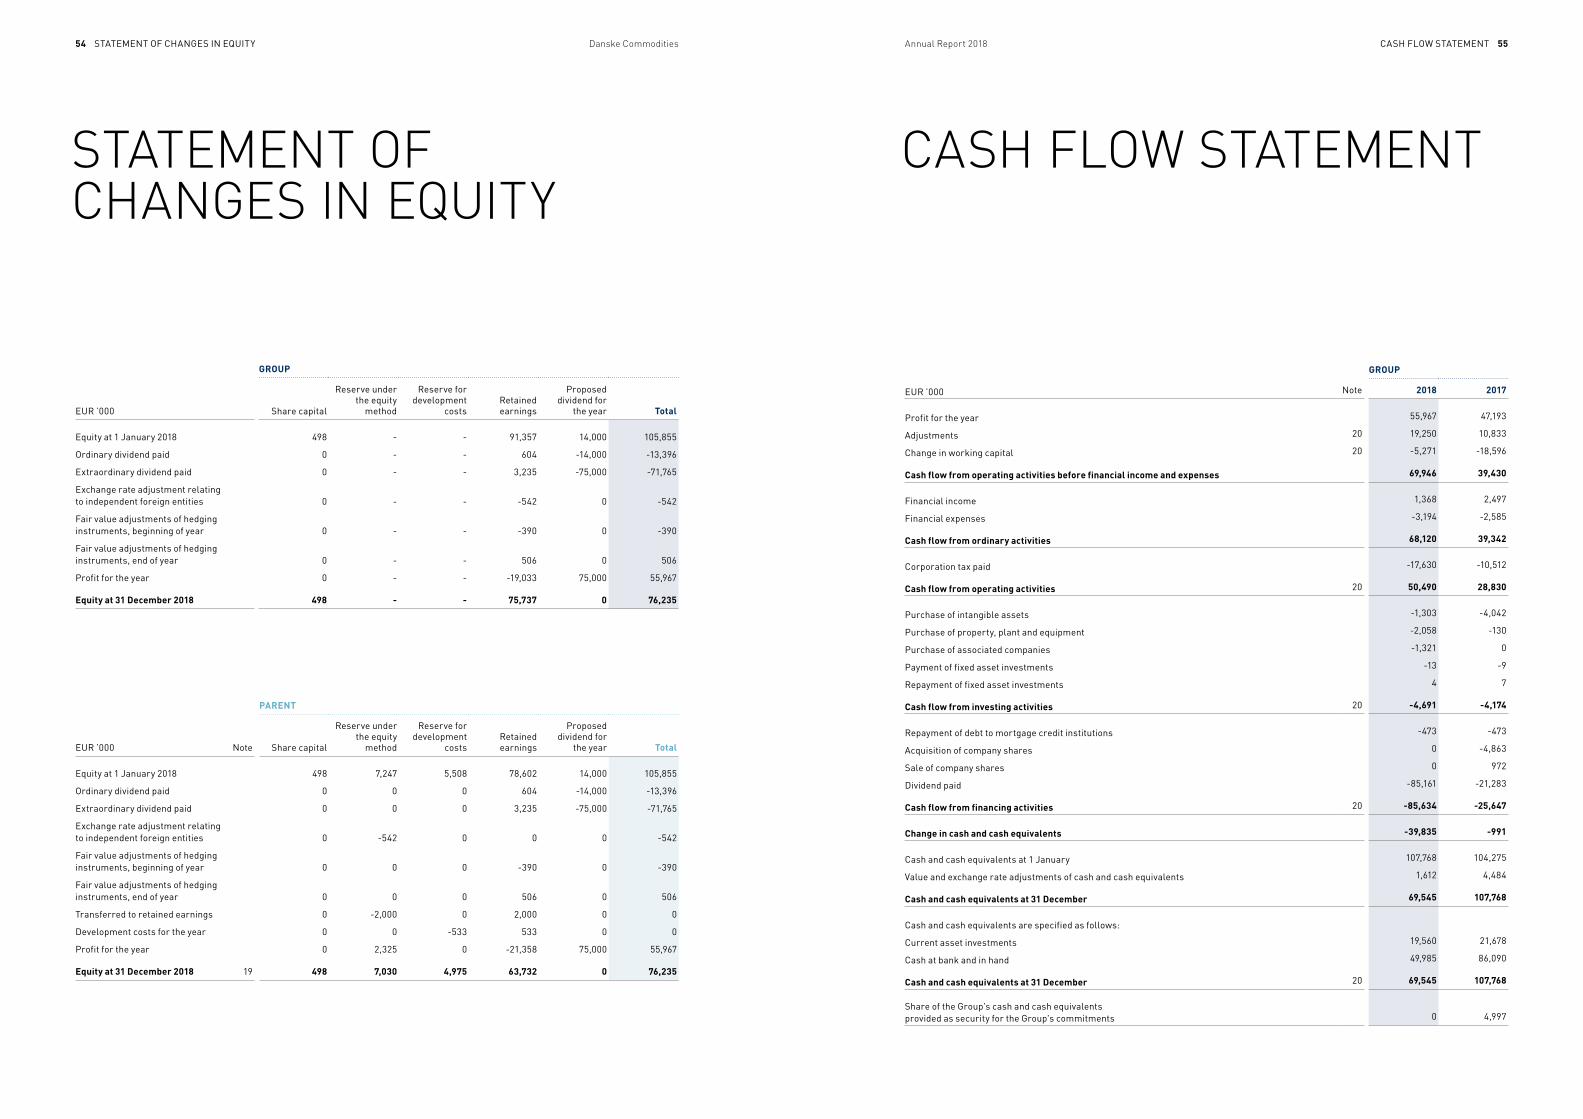
statement Of cHanGes in eQUitY casH flOW statement54 55Danske Commodities Annual Report 2018
GROUP
eUR ’000 share capital
Reserve under the equity
method
Reserve for development
costsRetained earnings
Proposed dividend for
the year Total
equity at 1 January 2018 498 - - 91,357 14,000 105,855
Ordinary dividend paid 0 - - 604 -14,000 -13,396
extraordinary dividend paid 0 - - 3,235 -75,000 -71,765
exchange rate adjustment relating to independent foreign entities 0 - - -542 0 -542
fair value adjustments of hedging instruments, beginning of year 0 - - -390 0 -390
fair value adjustments of hedging instruments, end of year 0 - - 506 0 506
Profit for the year 0 - - -19,033 75,000 55,967
Equity at 31 December 2018 498 - - 75,737 0 76,235
PARENT
eUR ’000 note share capital
Reserve under the equity
method
Reserve for development
costsRetained earnings
Proposed dividend for
the year Total
equity at 1 January 2018 498 7,247 5,508 78,602 14,000 105,855
Ordinary dividend paid 0 0 0 604 -14,000 -13,396
extraordinary dividend paid 0 0 0 3,235 -75,000 -71,765
exchange rate adjustment relating to independent foreign entities 0 -542 0 0 0 -542
fair value adjustments of hedging instruments, beginning of year 0 0 0 -390 0 -390
fair value adjustments of hedging instruments, end of year 0 0 0 506 0 506
transferred to retained earnings 0 -2,000 0 2,000 0 0
Development costs for the year 0 0 -533 533 0 0
Profit for the year 0 2,325 0 -21,358 75,000 55,967
Equity at 31 December 2018 19 498 7,030 4,975 63,732 0 76,235
GROUP
eUR ’000 note 2018 2017
Profit for the year 55,967 47,193
adjustments 20 19,250 10,833
change in working capital 20 -5,271 -18,596
Cash flow from operating activities before financial income and expenses 69,946 39,430
financial income 1,368 2,497
financial expenses -3,194 -2,585
Cash flow from ordinary activities 68,120 39,342
corporation tax paid -17,630 -10,512
Cash flow from operating activities 20 50,490 28,830
Purchase of intangible assets -1,303 -4,042
Purchase of property, plant and equipment -2,058 -130
Purchase of associated companies -1,321 0
Payment of fixed asset investments -13 -9
Repayment of fixed asset investments 4 7
Cash flow from investing activities 20 -4,691 -4,174
Repayment of debt to mortgage credit institutions -473 -473
acquisition of company shares 0 -4,863
sale of company shares 0 972
Dividend paid -85,161 -21,283
Cash flow from financing activities 20 -85,634 -25,647
Change in cash and cash equivalents -39,835 -991
cash and cash equivalents at 1 January 107,768 104,275
Value and exchange rate adjustments of cash and cash equivalents 1,612 4,484
Cash and cash equivalents at 31 December 69,545 107,768
cash and cash equivalents are specified as follows:
current asset investments 19,560 21,678
cash at bank and in hand 49,985 86,090
Cash and cash equivalents at 31 December 20 69,545 107,768
share of the Group's cash and cash equivalents provided as security for the Group's commitments 0 4,997
STATEMENT OF CHANGES IN EQUITY
CASH FLOW STATEMENT
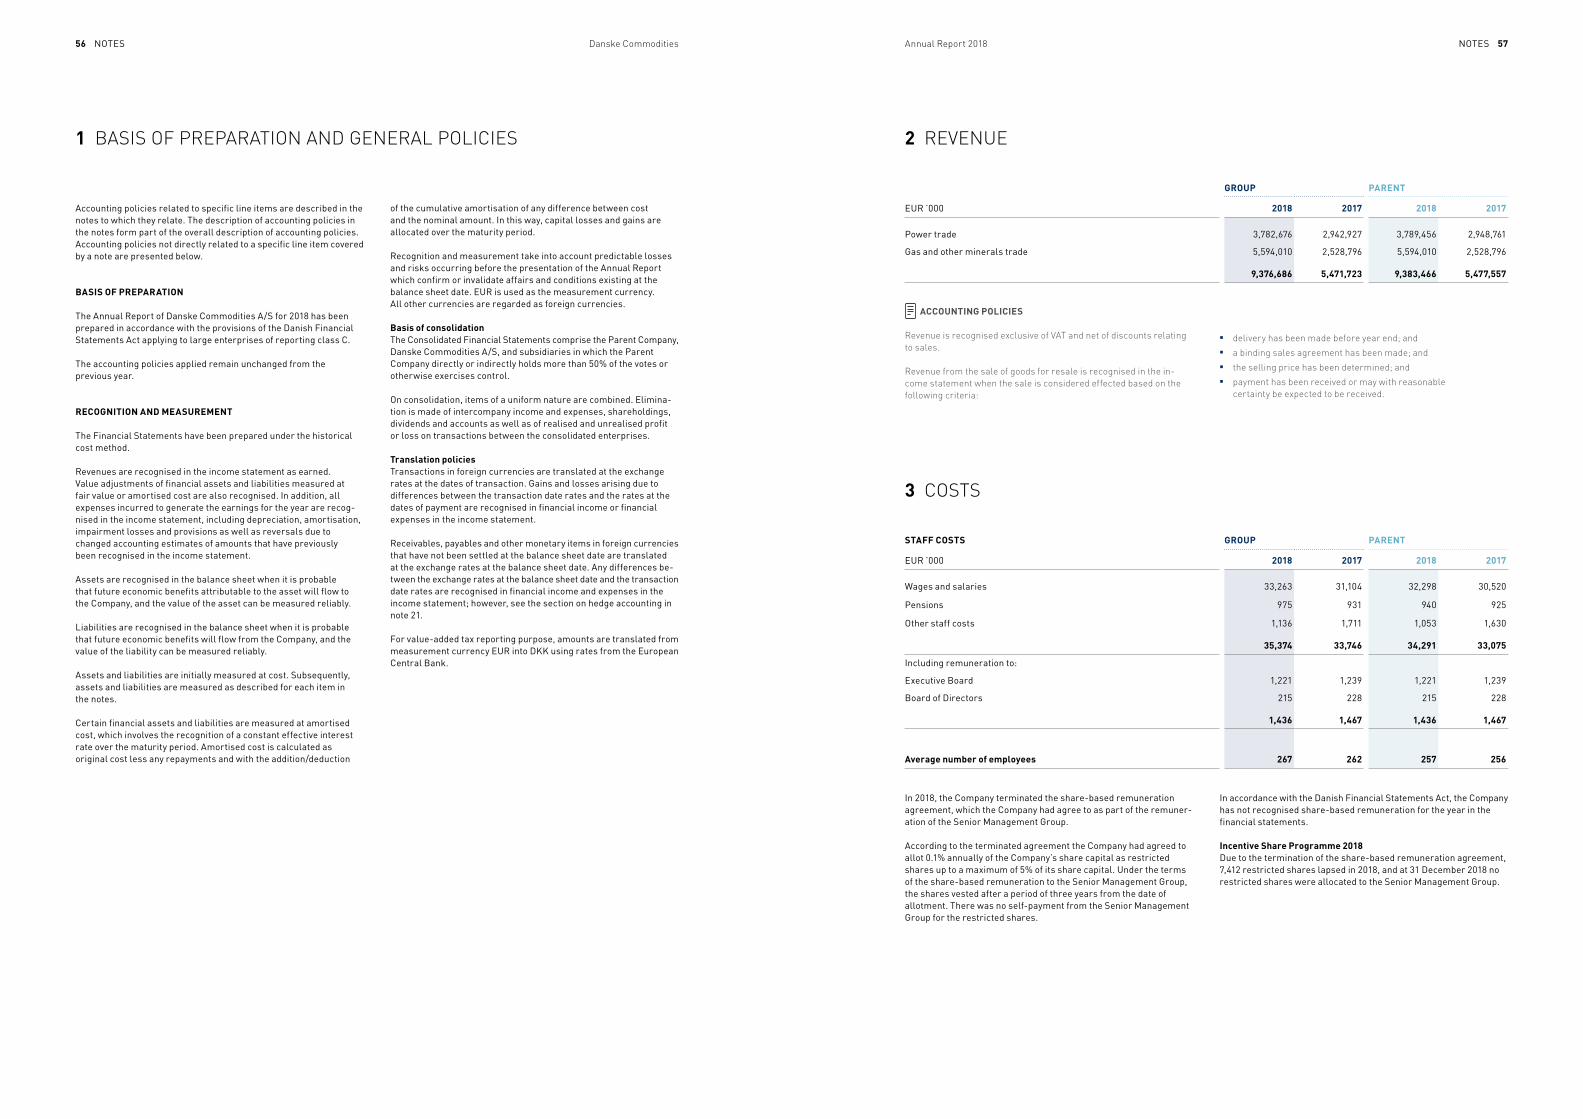
nOtes nOtes56 57Danske Commodities Annual Report 2018
accounting policies related to specific line items are described in the notes to which they relate. the description of accounting policies in the notes form part of the overall description of accounting policies. accounting policies not directly related to a specific line item covered by a note are presented below.
BASIS OF PREPARATION
the annual Report of Danske commodities a/s for 2018 has been prepared in accordance with the provisions of the Danish financial statements act applying to large enterprises of reporting class c.
the accounting policies applied remain unchanged from the previous year.
RECOGNITION AND MEASUREMENT
the financial statements have been prepared under the historical cost method.
Revenues are recognised in the income statement as earned. Value adjustments of financial assets and liabilities measured at fair value or amortised cost are also recognised. in addition, all expenses incurred to generate the earnings for the year are recog - nised in the income statement, including depreciation, amortisation, impairment losses and provisions as well as reversals due to changed accounting estimates of amounts that have previously been recognised in the income statement.
assets are recognised in the balance sheet when it is probable that future economic benefits attributable to the asset will flow to the company, and the value of the asset can be measured reliably.
liabilities are recognised in the balance sheet when it is probable that future economic benefits will flow from the company, and the value of the liability can be measured reliably.
assets and liabilities are initially measured at cost. subsequently, assets and liabilities are measured as described for each item in the notes.
certain financial assets and liabilities are measured at amortised cost, which involves the recognition of a constant effective interest rate over the maturity period. amortised cost is calculated as original cost less any repayments and with the addition/deduction
1 BASIS OF PREPARATION AND GENERAL POLICIES 2 REVENUE
3 COSTS
GROUP PARENT
eUR ’000 2018 2017 2018 2017
Power trade 3,782,676 2,942,927 3,789,456 2,948,761
Gas and other minerals trade 5,594,010 2,528,796 5,594,010 2,528,796
9,376,686 5,471,723 9,383,466 5,477,557
STAFF COSTS GROUP PARENT
eUR ’000 2018 2017 2018 2017
Wages and salaries 33,263 31,104 32,298 30,520
Pensions 975 931 940 925
Other staff costs 1,136 1,711 1,053 1,630
35,374 33,746 34,291 33,075
including remuneration to:
executive Board 1,221 1,239 1,221 1,239
Board of Directors 215 228 215 228
1,436 1,467 1,436 1,467
Average number of employees 267 262 257 256
ACCOUNTING POLICIES
Revenue is recognised exclusive of VAT and net of discounts relating to sales.
Revenue from the sale of goods for resale is recognised in the in - come statement when the sale is considered effected based on the following criteria:
■ delivery has been made before year end; and ■ a binding sales agreement has been made; and■ the selling price has been determined; and■ payment has been received or may with reasonable
certainty be expected to be received.
in 2018, the company terminated the share-based remuneration agreement, which the company had agree to as part of the remuner- ation of the senior management Group.
according to the terminated agreement the company had agreed to allot 0.1% annually of the company’s share capital as restricted shares up to a maximum of 5% of its share capital. Under the terms of the share-based remuneration to the senior management Group, the shares vested after a period of three years from the date of allotment. there was no self-payment from the senior management Group for the restricted shares.
of the cumulative amortisation of any difference between cost and the nominal amount. in this way, capital losses and gains are allocated over the maturity period.
Recognition and measurement take into account predictable losses and risks occurring before the presentation of the annual Report which confirm or invalidate affairs and conditions existing at the balance sheet date. eUR is used as the measurement currency. all other currencies are regarded as foreign currencies.
Basis of consolidationthe consolidated financial statements comprise the Parent company, Danske commodities a/s, and subsidiaries in which the Parent company directly or indirectly holds more than 50% of the votes or otherwise exercises control.
On consolidation, items of a uniform nature are combined. elimina - tion is made of intercompany income and expenses, share holdings, dividends and accounts as well as of realised and unrealised profit or loss on transactions between the consolidated enterprises.
Translation policiestransactions in foreign currencies are translated at the exchange rates at the dates of transaction. Gains and losses arising due to differences between the transaction date rates and the rates at the dates of payment are recognised in financial income or financial expenses in the income statement.
Receivables, payables and other monetary items in foreign currencies that have not been settled at the balance sheet date are translated at the exchange rates at the balance sheet date. any differences be - tween the exchange rates at the balance sheet date and the trans action date rates are recognised in financial income and expenses in the income statement; however, see the section on hedge accounting in note 21.
for value-added tax reporting purpose, amounts are translated from measurement currency eUR into DKK using rates from the european central Bank.
in accordance with the Danish financial statements act, the company has not recognised share-based remuneration for the year in the financial statements.
Incentive Share Programme 2018Due to the termination of the share-based remuneration agreement, 7,412 restricted shares lapsed in 2018, and at 31 December 2018 no restricted shares were allocated to the senior management Group.
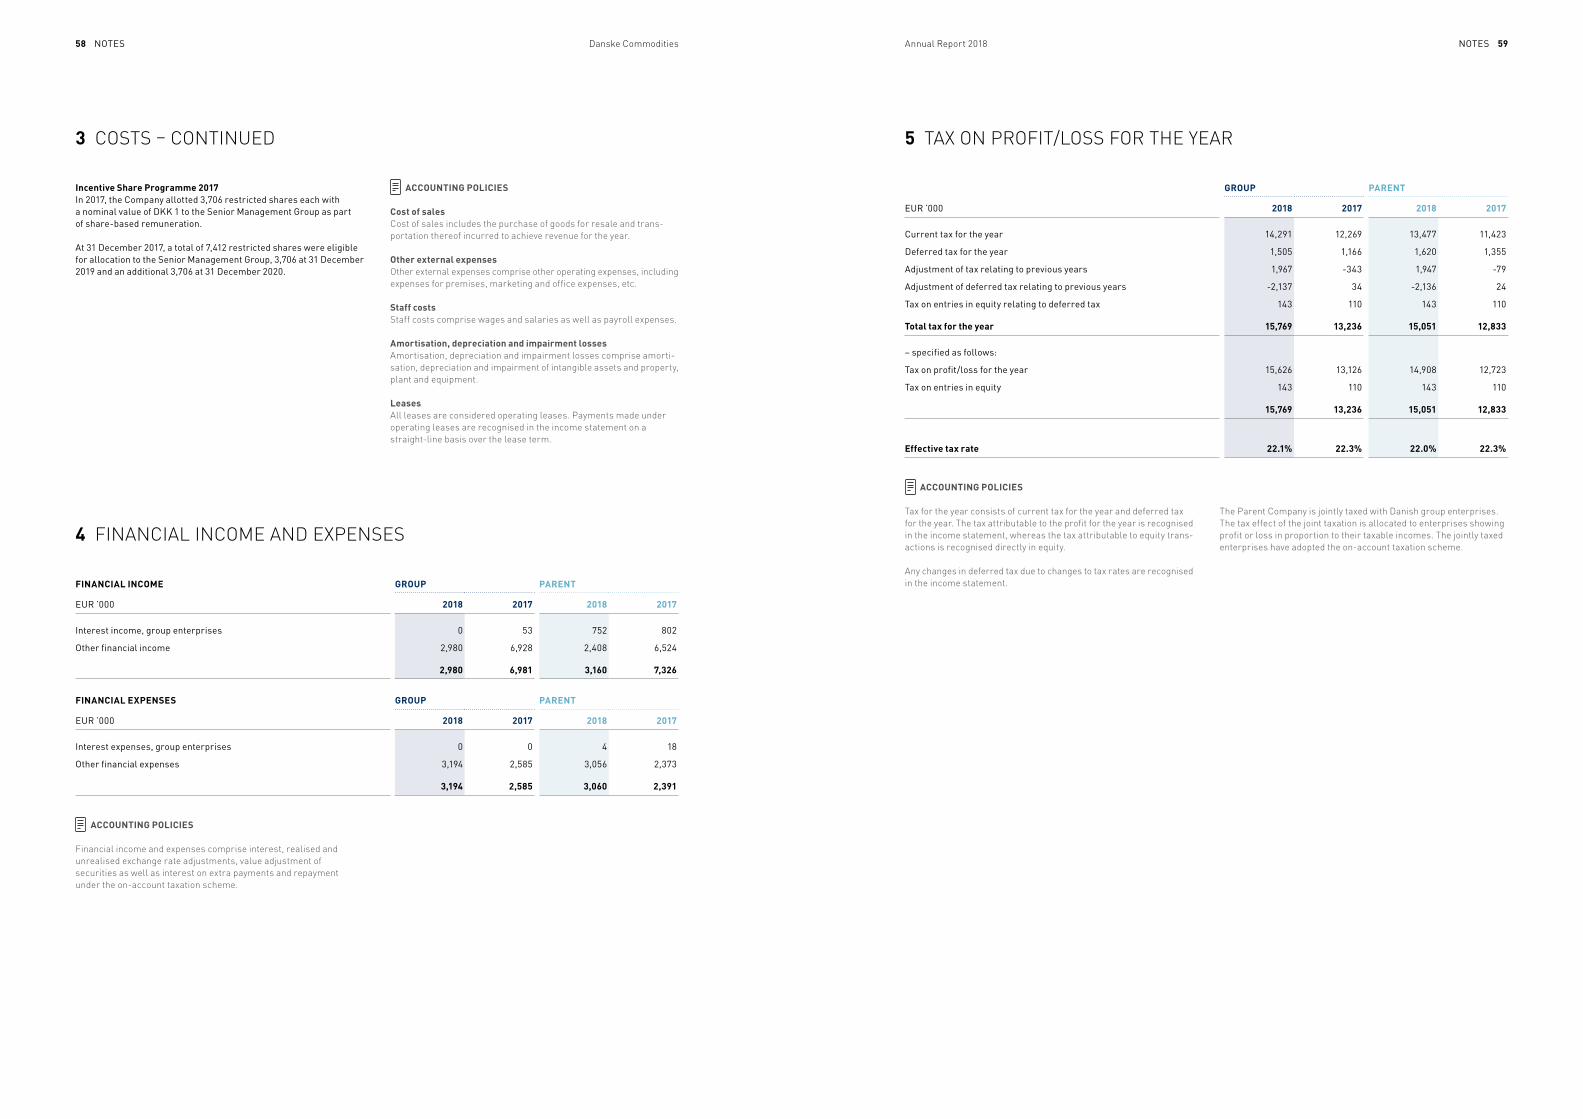
nOtes nOtes58 59Danske Commodities Annual Report 2018
Incentive Share Programme 2017in 2017, the company allotted 3,706 restricted shares each with a nominal value of DKK 1 to the senior management Group as part of share-based remuneration.
at 31 December 2017, a total of 7,412 restricted shares were eligible for allocation to the senior management Group, 3,706 at 31 December 2019 and an additional 3,706 at 31 December 2020.
ACCOUNTING POLICIES
Cost of salesCost of sales includes the purchase of goods for resale and trans- portation thereof incurred to achieve revenue for the year.
Other external expenses Other external expenses comprise other operating expenses, including expenses for premises, marketing and office expenses, etc.
Staff costsStaff costs comprise wages and salaries as well as payroll expenses.
Amortisation, depreciation and impairment losses Amortisation, depreciation and impairment losses comprise amor ti - sation, depreciation and impairment of intangible assets and property, plant and equipment.
LeasesAll leases are considered operating leases. Payments made under operating leases are recognised in the income statement on a straight-line basis over the lease term.
ACCOUNTING POLICIES
Financial income and expenses comprise interest, realised and unrealised exchange rate adjustments, value adjustment of securities as well as interest on extra payments and repayment under the on-account taxation scheme.
ACCOUNTING POLICIES
Tax for the year consists of current tax for the year and deferred tax for the year. The tax attributable to the profit for the year is recognised in the income statement, whereas the tax attributable to equity trans - actions is recognised directly in equity.
Any changes in deferred tax due to changes to tax rates are recognised in the income statement.
The Parent Company is jointly taxed with Danish group enterprises. The tax effect of the joint taxation is allocated to enterprises showing profit or loss in proportion to their taxable incomes. The jointly taxed enterprises have adopted the on-account taxation scheme.
4 FINANCIAL INCOME AND EXPENSES
5 TAX ON PROFIT/LOSS FOR THE YEAR
FINANCIAL INCOME GROUP PARENT
eUR ’000 2018 2017 2018 2017
interest income, group enterprises 0 53 752 802
Other financial income 2,980 6,928 2,408 6,524
2,980 6,981 3,160 7,326
GROUP PARENT
eUR ’000 2018 2017 2018 2017
current tax for the year 14,291 12,269 13,477 11,423
Deferred tax for the year 1,505 1,166 1,620 1,355
adjustment of tax relating to previous years 1,967 -343 1,947 -79
adjustment of deferred tax relating to previous years -2,137 34 -2,136 24
tax on entries in equity relating to deferred tax 143 110 143 110
Total tax for the year 15,769 13,236 15,051 12,833
– specified as follows:
tax on profit/loss for the year 15,626 13,126 14,908 12,723
tax on entries in equity 143 110 143 110
15,769 13,236 15,051 12,833
Effective tax rate 22.1% 22.3% 22.0% 22.3%
FINANCIAL EXPENSES GROUP PARENT
eUR ’000 2018 2017 2018 2017
interest expenses, group enterprises 0 0 4 18
Other financial expenses 3,194 2,585 3,056 2,373
3,194 2,585 3,060 2,391
3 COSTS – CONTINUED
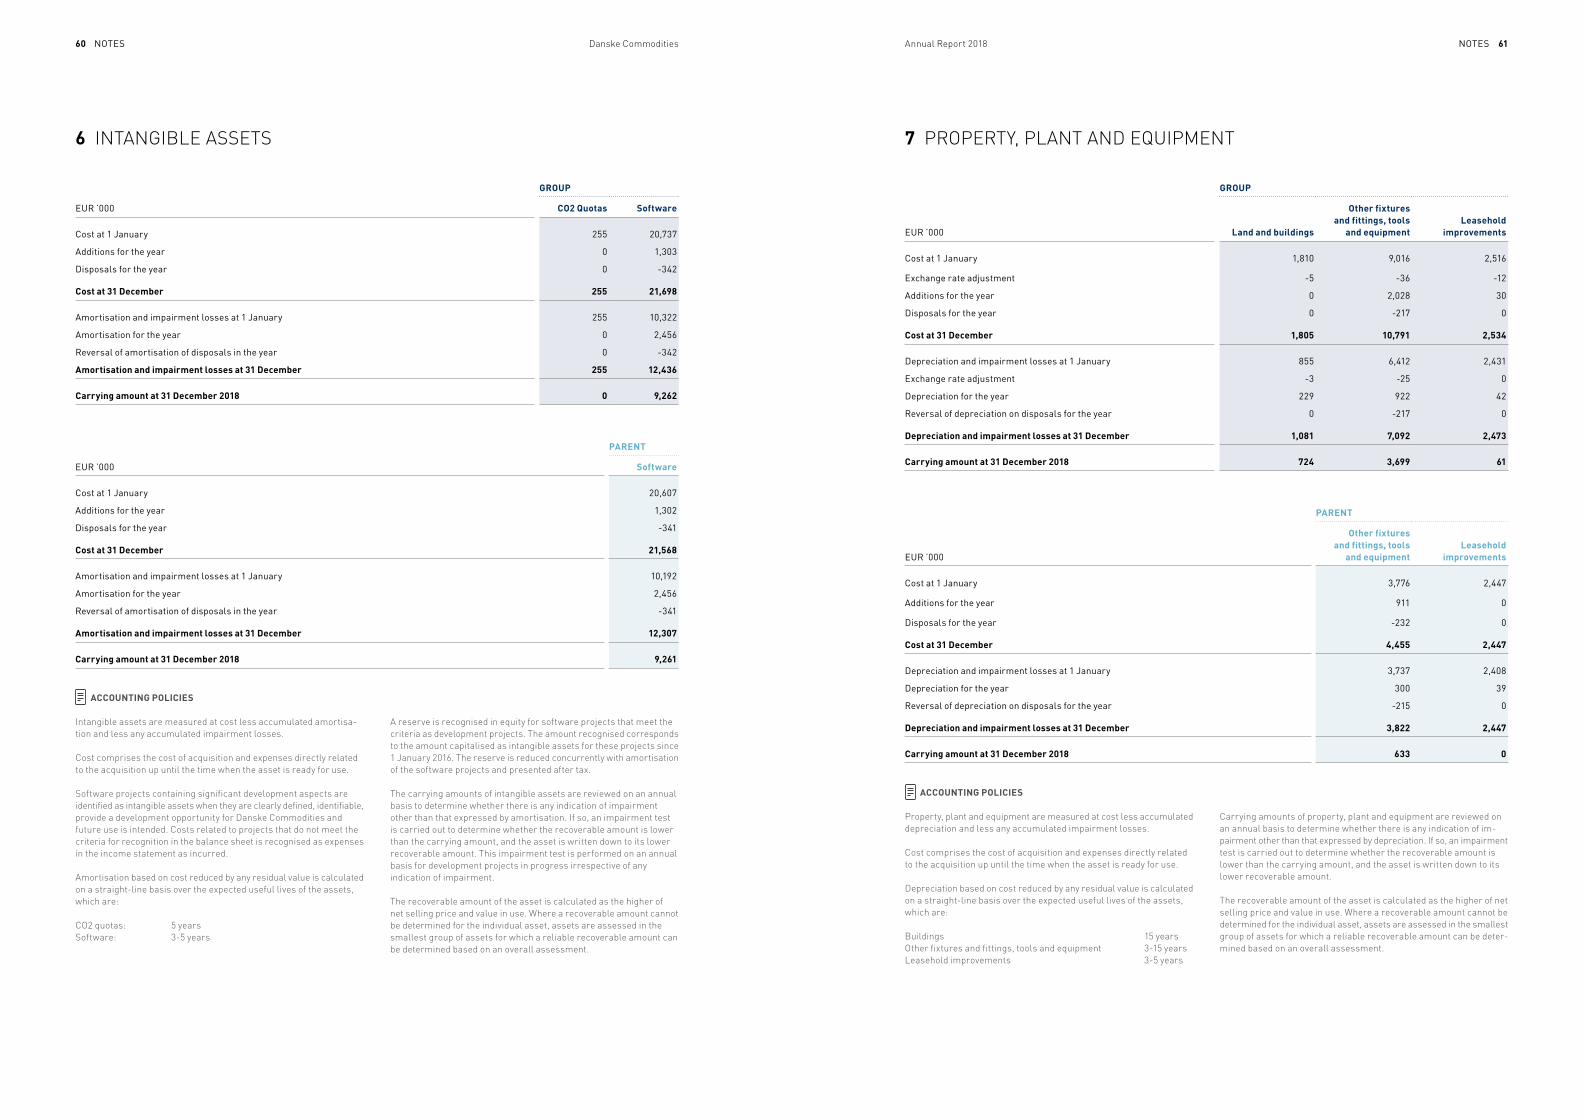
nOtes nOtes60 61Danske Commodities Annual Report 2018
6 INTANGIBLE ASSETS 7 PROPERTY, PLANT AND EQUIPMENT
GROUP
eUR ’000 CO2 Quotas Software
cost at 1 January 255 20,737
additions for the year 0 1,303
Disposals for the year 0 -342
Cost at 31 December 255 21,698
amortisation and impairment losses at 1 January 255 10,322
amortisation for the year 0 2,456
Reversal of amortisation of disposals in the year 0 -342
Amortisation and impairment losses at 31 December 255 12,436
Carrying amount at 31 December 2018 0 9,262
GROUP
eUR ’000 Land and buildings
Other fixtures and fittings, tools
and equipmentLeasehold
improvements
cost at 1 January 1,810 9,016 2,516
exchange rate adjustment -5 -36 -12
additions for the year 0 2,028 30
Disposals for the year 0 -217 0
Cost at 31 December 1,805 10,791 2,534
Depreciation and impairment losses at 1 January 855 6,412 2,431
exchange rate adjustment -3 -25 0
Depreciation for the year 229 922 42
Reversal of depreciation on disposals for the year 0 -217 0
Depreciation and impairment losses at 31 December 1,081 7,092 2,473
Carrying amount at 31 December 2018 724 3,699 61
PARENT
eUR ’000
Other fixtures and fittings, tools
and equipmentLeasehold
improvements
cost at 1 January 3,776 2,447
additions for the year 911 0
Disposals for the year -232 0
Cost at 31 December 4,455 2,447
Depreciation and impairment losses at 1 January 3,737 2,408
Depreciation for the year 300 39
Reversal of depreciation on disposals for the year -215 0
Depreciation and impairment losses at 31 December 3,822 2,447
Carrying amount at 31 December 2018 633 0
PARENT
eUR ’000 Software
cost at 1 January 20,607
additions for the year 1,302
Disposals for the year -341
Cost at 31 December 21,568
amortisation and impairment losses at 1 January 10,192
amortisation for the year 2,456
Reversal of amortisation of disposals in the year -341
Amortisation and impairment losses at 31 December 12,307
Carrying amount at 31 December 2018 9,261
ACCOUNTING POLICIES
Intangible assets are measured at cost less accumulated amortisa- tion and less any accumulated impairment losses.
Cost comprises the cost of acquisition and expenses directly related to the acquisition up until the time when the asset is ready for use.
Software projects containing significant development aspects are identified as intangible assets when they are clearly defined, identifiable, provide a development opportunity for Danske Commodities and future use is intended. Costs related to projects that do not meet the criteria for recognition in the balance sheet is recognised as expenses in the income statement as incurred.
Amortisation based on cost reduced by any residual value is calculated on a straight-line basis over the expected useful lives of the assets, which are:
CO2 quotas: 5 yearsSoftware: 3-5 years
A reserve is recognised in equity for software projects that meet the criteria as development projects. The amount recognised corre sponds to the amount capitalised as intangible assets for these projects since 1 January 2016. The reserve is reduced concurrently with amortisation of the software projects and presented after tax.
The carrying amounts of intangible assets are reviewed on an annual basis to determine whether there is any indication of impairment other than that expressed by amortisation. If so, an impairment test is carried out to determine whether the recoverable amount is lower than the carrying amount, and the asset is written down to its lower recoverable amount. This impairment test is performed on an annual basis for development projects in progress irrespective of any indication of impairment.
The recoverable amount of the asset is calculated as the higher of net selling price and value in use. Where a recoverable amount cannot be determined for the individual asset, assets are assessed in the smallest group of assets for which a reliable recoverable amount can be determined based on an overall assessment.
ACCOUNTING POLICIES
Property, plant and equipment are measured at cost less accumulated depreciation and less any accumulated impairment losses.
Cost comprises the cost of acquisition and expenses directly related to the acquisition up until the time when the asset is ready for use.
Depreciation based on cost reduced by any residual value is calculated on a straight-line basis over the expected useful lives of the assets, which are:
Buildings 15 yearsOther fixtures and fittings, tools and equipment 3-15 yearsLeasehold improvements 3-5 years
Carrying amounts of property, plant and equipment are reviewed on an annual basis to determine whether there is any indication of im - pairment other than that expressed by depreciation. If so, an im pairment test is carried out to determine whether the recoverable amount is lower than the carrying amount, and the asset is written down to its lower recover able amount.
The recoverable amount of the asset is calculated as the higher of net selling price and value in use. Where a recoverable amount cannot be determined for the individual asset, assets are assessed in the smallest group of assets for which a reliable recoverable amount can be deter - mined based on an overall assessment.
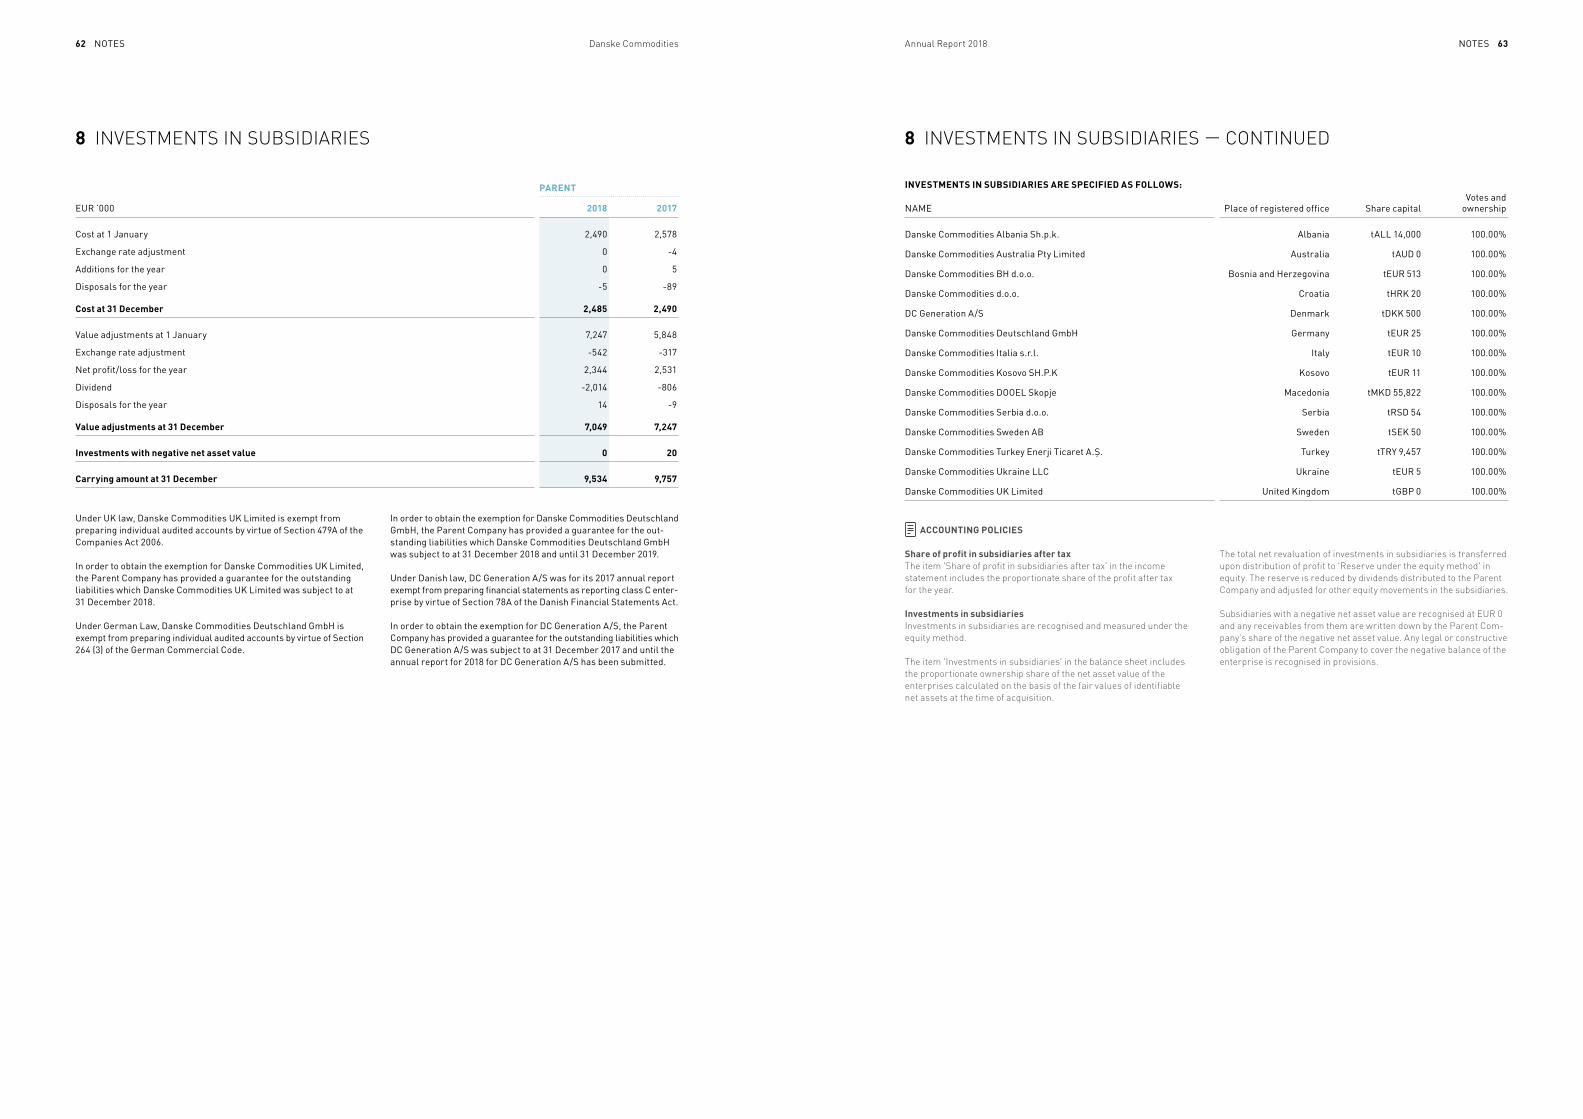
nOtes nOtes62 63Danske Commodities Annual Report 2018
8 INVESTMENTS IN SUBSIDIARIES 8 INVESTMENTS IN SUBSIDIARIES — CONTINUED
INVESTMENTS IN SUBSIDIARIES ARE SPECIFIED AS FOLLOWS:
name Place of registered office share capitalVotes and
ownership
Danske commodities albania sh.p.k. albania tall 14,000 100.00%
Danske commodities australia Pty limited australia taUD 0 100.00%
Danske commodities BH d.o.o. Bosnia and Herzegovina teUR 513 100.00%
Danske commodities d.o.o. croatia tHRK 20 100.00%
Dc Generation a/s Denmark tDKK 500 100.00%
Danske commodities Deutschland GmbH Germany teUR 25 100.00%
Danske commodities italia s.r.l. italy teUR 10 100.00%
Danske commodities Kosovo sH.P.K Kosovo teUR 11 100.00%
Danske commodities DOOel skopje macedonia tmKD 55,822 100.00%
Danske commodities serbia d.o.o. serbia tRsD 54 100.00%
Danske commodities sweden aB sweden tseK 50 100.00%
Danske commodities turkey enerji ticaret a.Ş. turkey ttRY 9,457 100.00%
Danske commodities Ukraine llc Ukraine teUR 5 100.00%
Danske commodities UK limited United Kingdom tGBP 0 100.00%
PARENT
eUR ’000 2018 2017
cost at 1 January 2,490 2,578
exchange rate adjustment 0 -4
additions for the year 0 5
Disposals for the year -5 -89
Cost at 31 December 2,485 2,490
Value adjustments at 1 January 7,247 5,848
exchange rate adjustment -542 -317
net profit/loss for the year 2,344 2,531
Dividend -2,014 -806
Disposals for the year 14 -9
Value adjustments at 31 December 7,049 7,247
Investments with negative net asset value 0 20
Carrying amount at 31 December 9,534 9,757
ACCOUNTING POLICIES
Share of profit in subsidiaries after taxThe item 'Share of profit in subsidiaries after tax' in the income statement includes the proportionate share of the profit after tax for the year.
Investments in subsidiariesInvestments in subsidiaries are recognised and measured under the equity method.
The item 'Investments in subsidiaries' in the balance sheet includes the proportionate ownership share of the net asset value of the enterprises calculated on the basis of the fair values of identifiable net assets at the time of acquisition.
The total net revaluation of investments in subsidiaries is transferred upon distribution of profit to 'Reserve under the equity method' in equity. The reserve is reduced by dividends distributed to the Parent Company and adjusted for other equity movements in the subsidiaries.
Subsidiaries with a negative net asset value are recognised at EUR 0 and any receivables from them are written down by the Parent Com - pany’s share of the negative net asset value. Any legal or constructive obligation of the Parent Company to cover the negative balance of the enterprise is recognised in provisions.
Under UK law, Danske commodities UK limited is exempt from preparing individual audited accounts by virtue of section 479a of the companies act 2006.
in order to obtain the exemption for Danske commodities UK limited, the Parent company has provided a guarantee for the outstanding liabilities which Danske commodities UK limited was subject to at 31 December 2018.
Under German law, Danske commodities Deutschland GmbH is exempt from preparing individual audited accounts by virtue of section 264 (3) of the German commercial code.
in order to obtain the exemption for Danske commodities Deutschland GmbH, the Parent company has provided a guarantee for the out - standing liabilities which Danske commodities Deutschland GmbH was subject to at 31 December 2018 and until 31 December 2019.
Under Danish law, Dc Generation a/s was for its 2017 annual report exempt from preparing financial statements as reporting class c en ter - prise by virtue of section 78a of the Danish financial state ments act.
in order to obtain the exemption for Dc Generation a/s, the Parent company has provided a guarantee for the outstanding liabilities which Dc Generation a/s was subject to at 31 December 2017 and until the annual report for 2018 for Dc Generation a/s has been submitted.
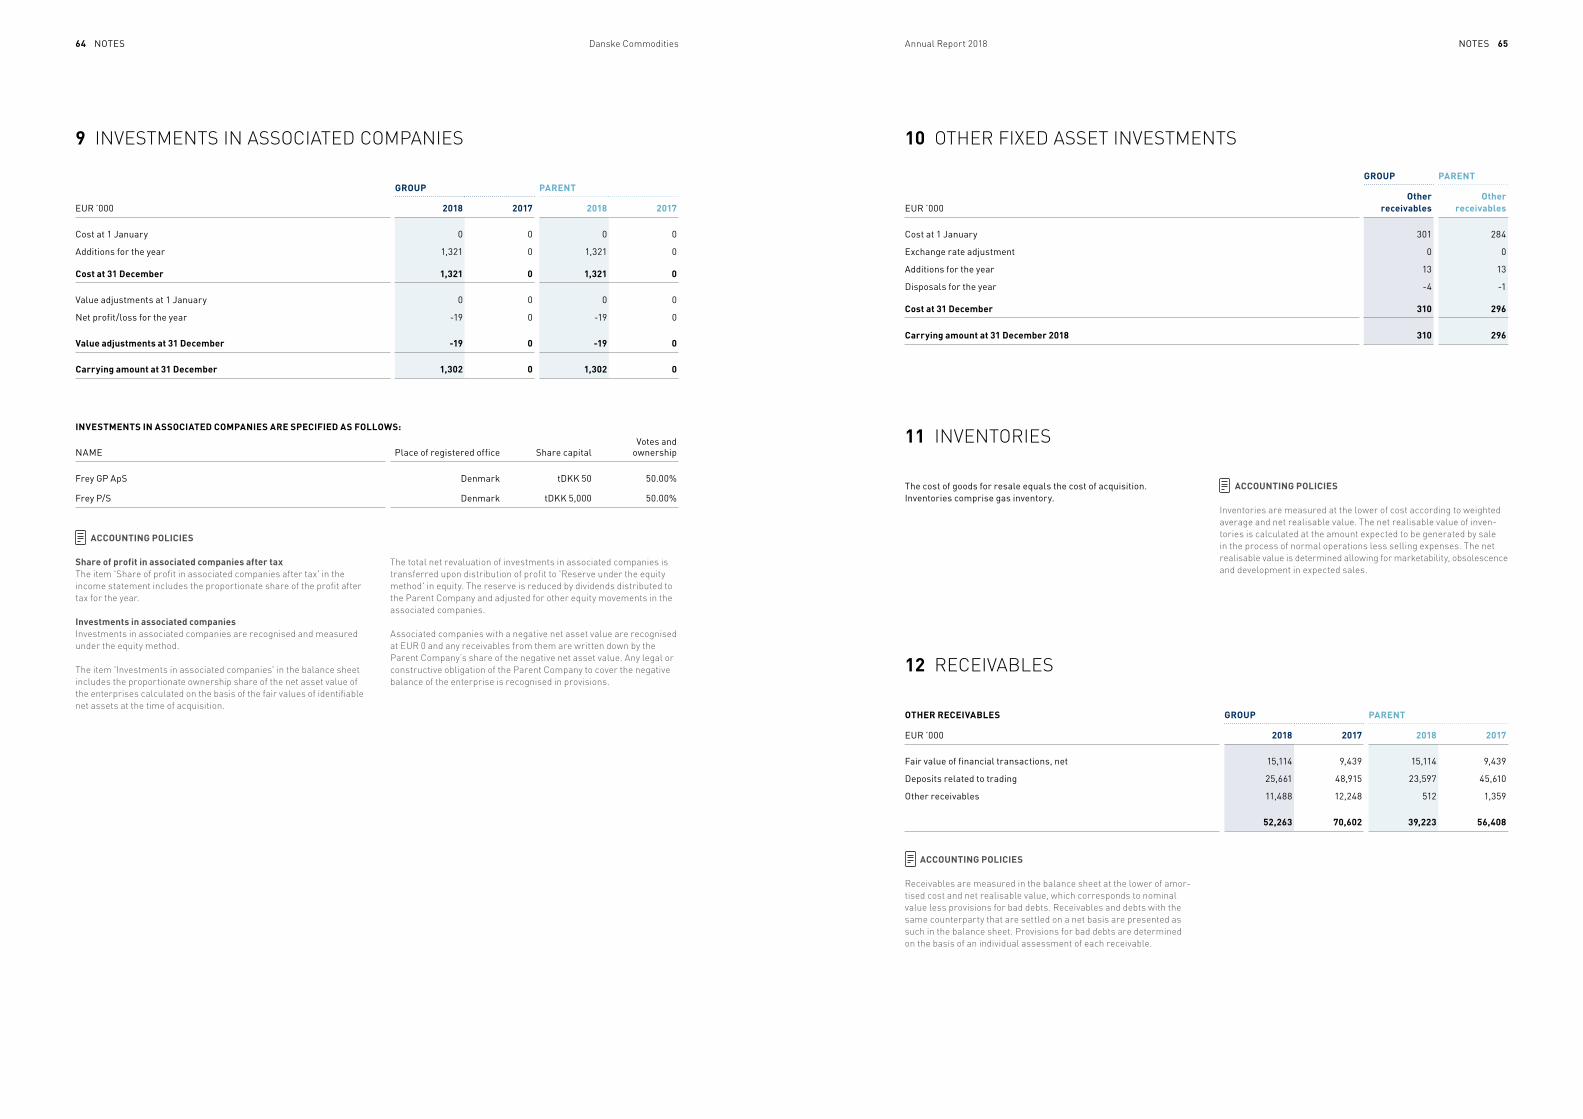
nOtes nOtes64 65Danske Commodities Annual Report 2018
10 OTHER FIXED ASSET INVESTMENTS
11 INVENTORIES
12 RECEIVABLES
GROUP PARENT
eUR ’000Other
receivablesOther
receivables
cost at 1 January 301 284
exchange rate adjustment 0 0
additions for the year 13 13
Disposals for the year -4 -1
Cost at 31 December 310 296
Carrying amount at 31 December 2018 310 296
the cost of goods for resale equals the cost of acquisition. inventories comprise gas inventory.
ACCOUNTING POLICIES
Inventories are measured at the lower of cost according to weighted average and net realisable value. The net realisable value of inven - tories is calculated at the amount expected to be generated by sale in the process of normal operations less selling expenses. The net realisable value is determined allowing for marketability, obsoles cence and development in expected sales.
ACCOUNTING POLICIES
Receivables are measured in the balance sheet at the lower of amor - tised cost and net realisable value, which corresponds to nominal value less provisions for bad debts. Receivables and debts with the same counterparty that are settled on a net basis are presented as such in the balance sheet. Provisions for bad debts are determined on the basis of an individual assessment of each receivable.
OTHER RECEIVABLES GROUP PARENT
eUR ’000 2018 2017 2018 2017
fair value of financial transactions, net 15,114 9,439 15,114 9,439
Deposits related to trading 25,661 48,915 23,597 45,610
Other receivables 11,488 12,248 512 1,359
52,263 70,602 39,223 56,408
9 INVESTMENTS IN ASSOCIATED COMPANIES
GROUP PARENT
eUR ’000 2018 2017 2018 2017
cost at 1 January 0 0 0 0
additions for the year 1,321 0 1,321 0
Cost at 31 December 1,321 0 1,321 0
Value adjustments at 1 January 0 0 0 0
net profit/loss for the year -19 0 -19 0
Value adjustments at 31 December -19 0 -19 0
Carrying amount at 31 December 1,302 0 1,302 0
INVESTMENTS IN ASSOCIATED COMPANIES ARE SPECIFIED AS FOLLOWS:
name Place of registered office share capitalVotes and
ownership
frey GP aps Denmark tDKK 50 50.00%
frey P/s Denmark tDKK 5,000 50.00%
ACCOUNTING POLICIES
Share of profit in associated companies after taxThe item 'Share of profit in associated companies after tax' in the income statement includes the proportionate share of the profit after tax for the year.
Investments in associated companiesInvestments in associated companies are recognised and measured under the equity method. The item 'Investments in associated companies' in the balance sheet includes the proportionate ownership share of the net asset value of the enterprises calculated on the basis of the fair values of identifiable net assets at the time of acquisition.
The total net revaluation of investments in associated companies is transferred upon distribution of profit to 'Reserve under the equity method' in equity. The reserve is reduced by dividends distributed to the Parent Company and adjusted for other equity movements in the associated companies. Associated companies with a negative net asset value are recognised at EUR 0 and any receivables from them are written down by the Parent Company’s share of the negative net asset value. Any legal or constructive obligation of the Parent Company to cover the negative balance of the enterprise is recognised in provisions.
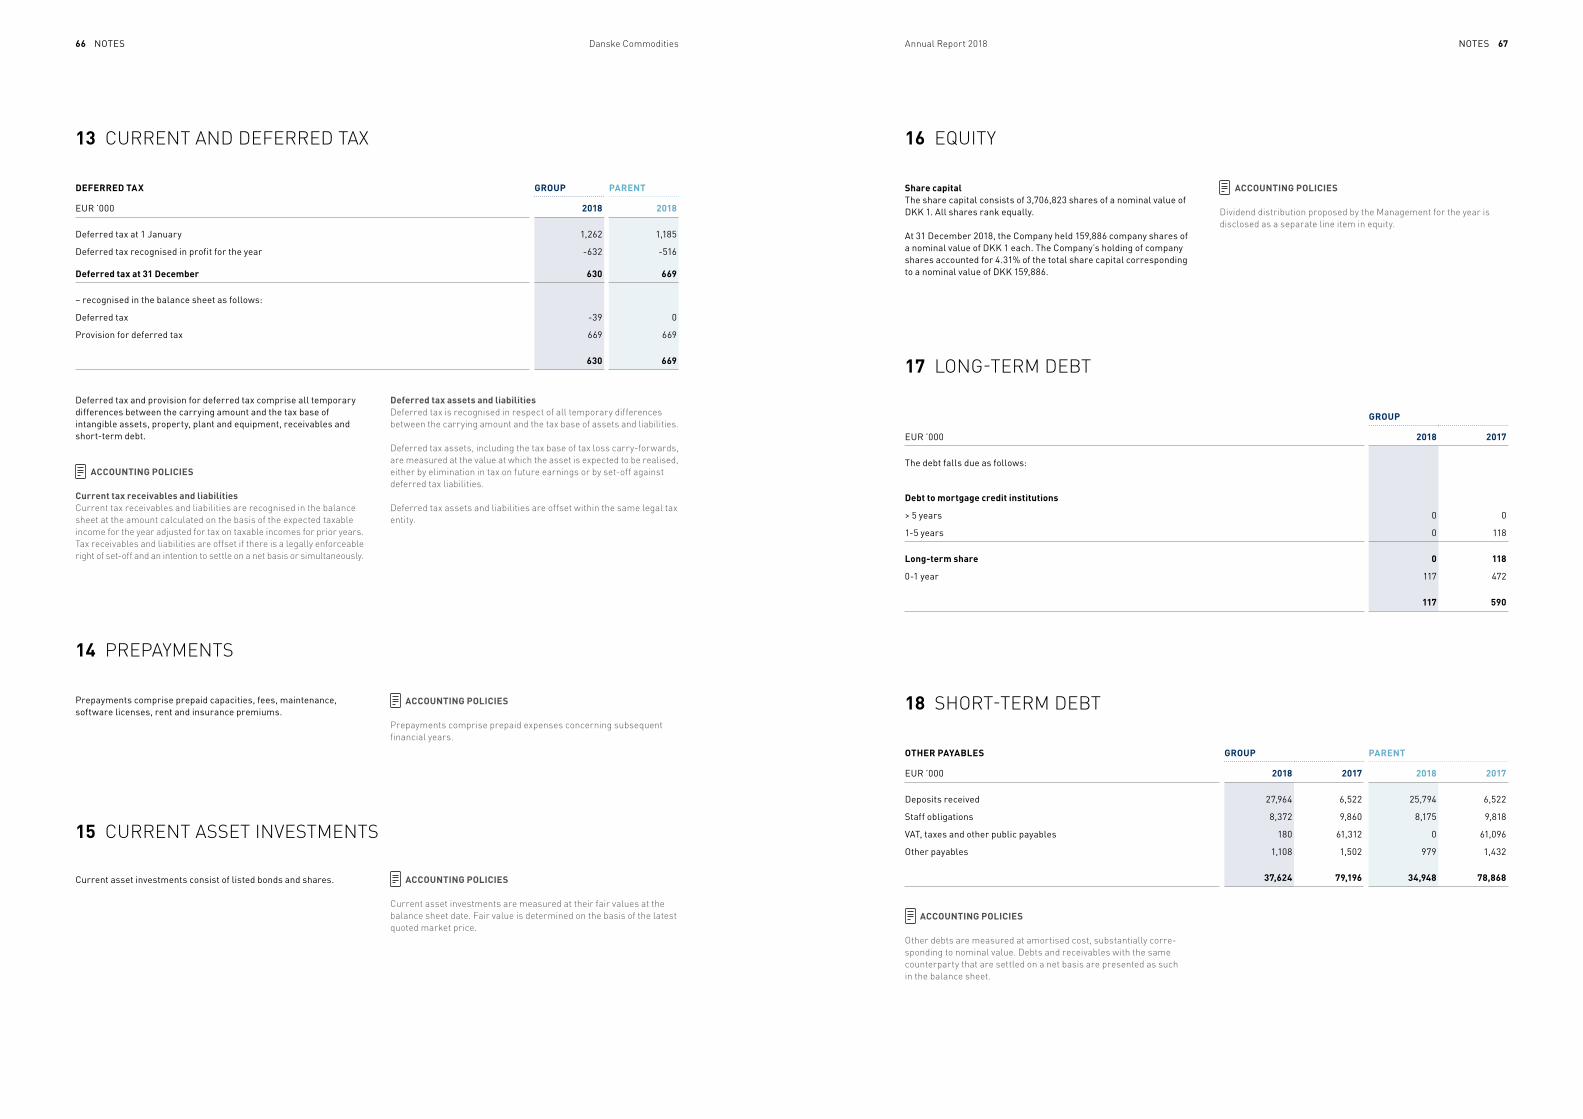
nOtes nOtes66 67Danske Commodities Annual Report 2018
16 EQUITY
17 LONG-TERM DEBT
Share capitalthe share capital consists of 3,706,823 shares of a nominal value of DKK 1. all shares rank equally.
at 31 December 2018, the company held 159,886 company shares of a nominal value of DKK 1 each. the company’s holding of company shares accounted for 4.31% of the total share capital corresponding to a nominal value of DKK 159,886.
ACCOUNTING POLICIES
Dividend distribution proposed by the Management for the year is disclosed as a separate line item in equity.
GROUP
eUR ’000 2018 2017
the debt falls due as follows:
Debt to mortgage credit institutions
> 5 years 0 0
1-5 years 0 118
Long-term share 0 118
0-1 year 117 472
117 590
18 SHORT-TERM DEBT
ACCOUNTING POLICIES
Other debts are measured at amortised cost, substantially corre - sponding to nominal value. Debts and receivables with the same counterparty that are settled on a net basis are presented as such in the balance sheet.
OTHER PAYABLES GROUP PARENT
eUR ’000 2018 2017 2018 2017
Deposits received 27,964 6,522 25,794 6,522
staff obligations 8,372 9,860 8,175 9,818
Vat, taxes and other public payables 180 61,312 0 61,096
Other payables 1,108 1,502 979 1,432
37,624 79,196 34,948 78,868
13 CURRENT AND DEFERRED TAX
14 PREPAYMENTS
15 CURRENT ASSET INVESTMENTS
DEFERRED TAX GROUP PARENT
eUR ’000 2018 2018
Deferred tax at 1 January 1,262 1,185
Deferred tax recognised in profit for the year -632 -516
Deferred tax at 31 December 630 669
– recognised in the balance sheet as follows:
Deferred tax -39 0
Provision for deferred tax 669 669
630 669
Prepayments comprise prepaid capacities, fees, maintenance, software licenses, rent and insurance premiums.
current asset investments consist of listed bonds and shares.
ACCOUNTING POLICIES
Prepayments comprise prepaid expenses concerning subsequent financial years.
ACCOUNTING POLICIES
Current asset investments are measured at their fair values at the balance sheet date. Fair value is determined on the basis of the latest quoted market price.
Deferred tax and provision for deferred tax comprise all temporary differences between the carrying amount and the tax base of intangible assets, property, plant and equipment, receivables and short-term debt.
ACCOUNTING POLICIES
Current tax receivables and liabilitiesCurrent tax receivables and liabilities are recognised in the balance sheet at the amount calculated on the basis of the expected taxable income for the year adjusted for tax on taxable incomes for prior years. Tax receivables and liabilities are offset if there is a legally enforceable right of set-off and an intention to settle on a net basis or simultaneously.
Deferred tax assets and liabilities Deferred tax is recognised in respect of all temporary differences between the carrying amount and the tax base of assets and liabilities.
Deferred tax assets, including the tax base of tax loss carry-forwards, are measured at the value at which the asset is expected to be realised, either by elimination in tax on future earnings or by set-off against deferred tax liabilities.
Deferred tax assets and liabilities are offset within the same legal tax entity.
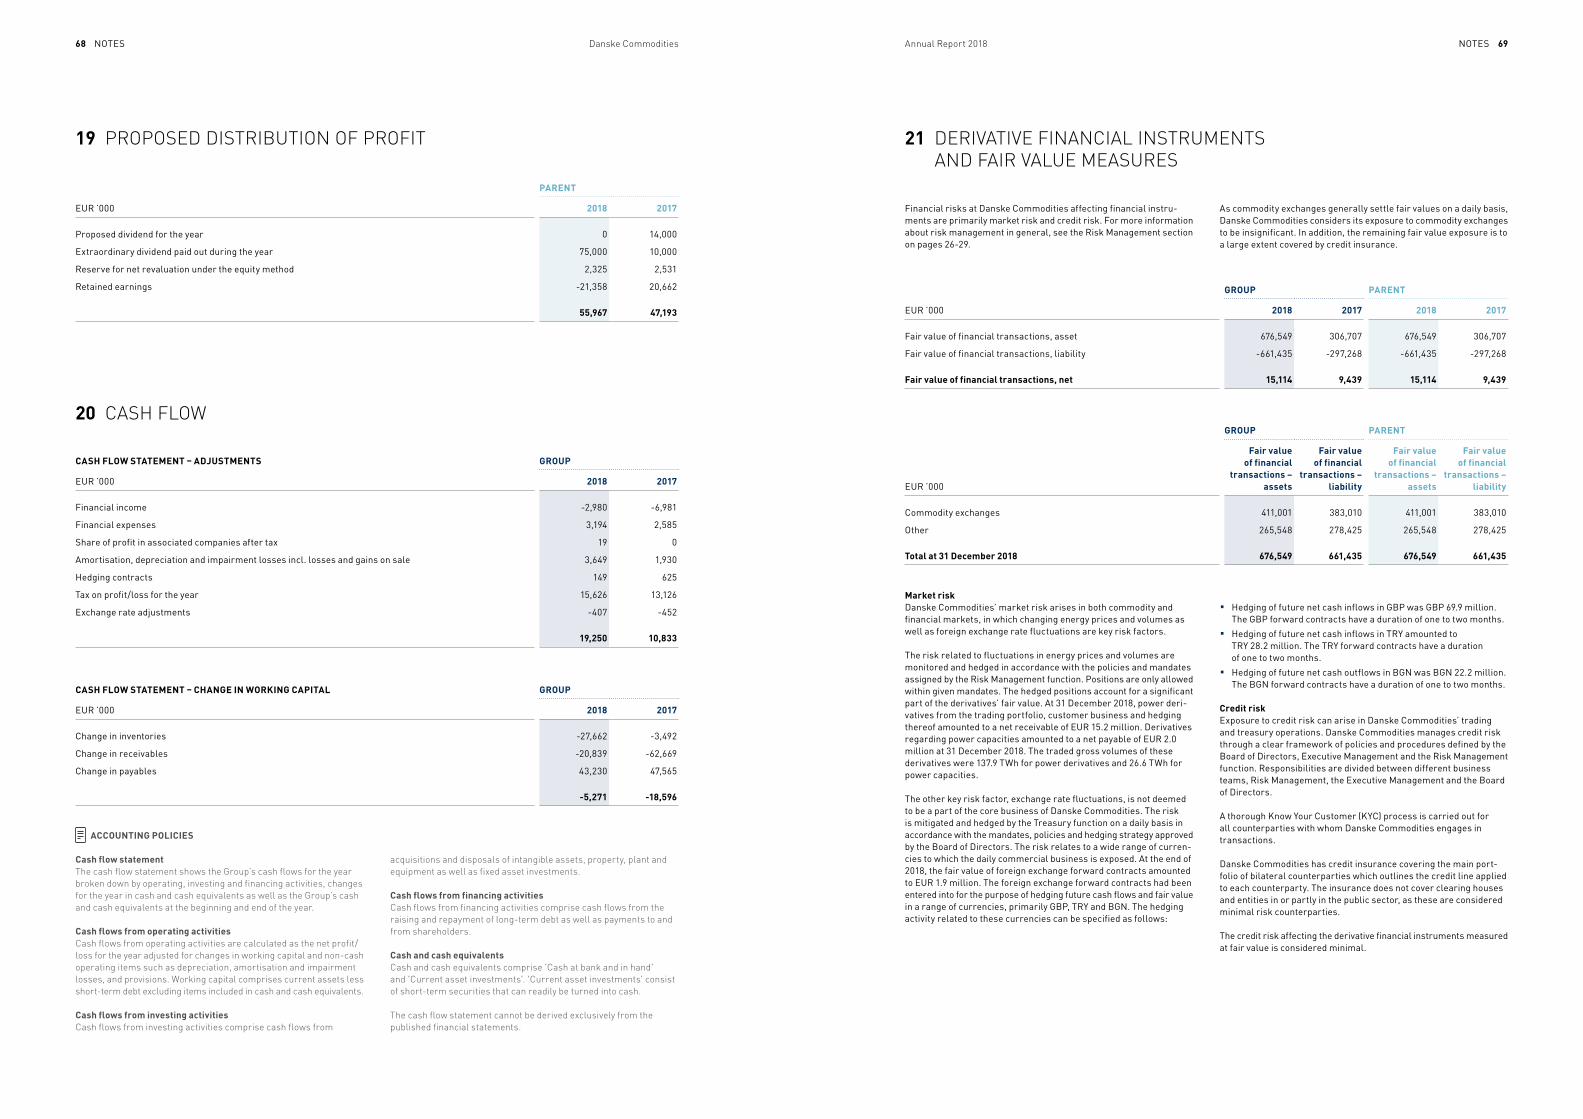
nOtes nOtes68 69Danske Commodities Annual Report 2018
19 PROPOSED DISTRIBUTION OF PROFIT 21 DERIVATIVE FINANCIAL INSTRUMENTS AND FAIR VALUE MEASURES
20 CASH FLOW
PARENT
eUR ’000 2018 2017
Proposed dividend for the year 0 14,000
extraordinary dividend paid out during the year 75,000 10,000
Reserve for net revaluation under the equity method 2,325 2,531
Retained earnings -21,358 20,662
55,967 47,193
CASH FLOW STATEMENT – ADJUSTMENTS GROUP
eUR ’000 2018 2017
financial income -2,980 -6,981
financial expenses 3,194 2,585
share of profit in associated companies after tax 19 0
amortisation, depreciation and impairment losses incl. losses and gains on sale 3,649 1,930
Hedging contracts 149 625
tax on profit/loss for the year 15,626 13,126
exchange rate adjustments -407 -452
19,250 10,833
CASH FLOW STATEMENT – CHANGE IN WORKING CAPITAL GROUP
eUR ’000 2018 2017
change in inventories -27,662 -3,492
change in receivables -20,839 -62,669
change in payables 43,230 47,565
-5,271 -18,596
ACCOUNTING POLICIES
Cash flow statement The cash flow statement shows the Group’s cash flows for the year broken down by operating, investing and financing activities, changes for the year in cash and cash equivalents as well as the Group’s cash and cash equivalents at the beginning and end of the year.
Cash flows from operating activitiesCash flows from operating activities are calculated as the net profit/loss for the year adjusted for changes in working capital and non-cash operating items such as depreciation, amortisation and impairment losses, and provisions. Working capital comprises current assets less short-term debt excluding items included in cash and cash equivalents.
Cash flows from investing activities Cash flows from investing activities comprise cash flows from
acquisitions and disposals of intangible assets, property, plant and equipment as well as fixed asset investments.
Cash flows from financing activities Cash flows from financing activities comprise cash flows from the raising and repayment of long-term debt as well as payments to and from shareholders.
Cash and cash equivalents Cash and cash equivalents comprise 'Cash at bank and in hand' and 'Current asset investments'. 'Current asset investments' consist of short-term securities that can readily be turned into cash.
The cash flow statement cannot be derived exclusively from the published financial statements.
financial risks at Danske commodities affecting financial instru - ments are primarily market risk and credit risk. for more information about risk management in general, see the Risk management section on pages 26-29.
Market riskDanske commodities’ market risk arises in both commodity and financial markets, in which changing energy prices and volumes as well as foreign exchange rate fluctuations are key risk factors.
the risk related to fluctuations in energy prices and volumes are monitored and hedged in accordance with the policies and mandates assigned by the Risk management function. Positions are only allowed within given mandates. the hedged positions account for a significant part of the derivatives’ fair value. at 31 December 2018, power deri - vatives from the trading portfolio, customer business and hedging thereof amounted to a net receivable of eUR 15.2 million. Derivatives regarding power capacities amounted to a net payable of eUR 2.0 million at 31 December 2018. the traded gross volumes of these derivatives were 137.9 tWh for power derivatives and 26.6 tWh for power capacities.
the other key risk factor, exchange rate fluctuations, is not deemed to be a part of the core business of Danske commodities. the risk is mitigated and hedged by the treasury function on a daily basis in accordance with the mandates, policies and hedging strategy approved by the Board of Directors. the risk relates to a wide range of curren - cies to which the daily commercial business is exposed. at the end of 2018, the fair value of foreign exchange forward contracts amounted to eUR 1.9 million. the foreign exchange forward contracts had been entered into for the purpose of hedging future cash flows and fair value in a range of currencies, primarily GBP, tRY and BGn. the hedging activity related to these currencies can be specified as follows:
as commodity exchanges generally settle fair values on a daily basis, Danske commodities considers its exposure to commodity exchanges to be insignificant. in addition, the remaining fair value exposure is to a large extent covered by credit insurance.
GROUP PARENT
eUR ’000 2018 2017 2018 2017
fair value of financial transactions, asset 676,549 306,707 676,549 306,707
fair value of financial transactions, liability -661,435 -297,268 -661,435 -297,268
Fair value of financial transactions, net 15,114 9,439 15,114 9,439
GROUP PARENT
eUR ’000
Fair value of financial
transactions – assets
Fair value of financial
transactions – liability
Fair value of financial
transactions – assets
Fair value of financial
transactions – liability
commodity exchanges 411,001 383,010 411,001 383,010
Other 265,548 278,425 265,548 278,425
Total at 31 December 2018 676,549 661,435 676,549 661,435
■ Hedging of future net cash inflows in GBP was GBP 69.9 million. the GBP forward contracts have a duration of one to two months.
■ Hedging of future net cash inflows in tRY amounted to tRY 28.2 million. the tRY forward contracts have a duration of one to two months.
■ Hedging of future net cash outflows in BGn was BGn 22.2 million. the BGn forward contracts have a duration of one to two months.
Credit riskexposure to credit risk can arise in Danske commodities’ trading and treasury operations. Danske commodities manages credit risk through a clear framework of policies and procedures defined by the Board of Directors, executive management and the Risk management function. Responsibilities are divided between different business teams, Risk management, the executive management and the Board of Directors.
a thorough Know Your customer (KYc) process is carried out for all counterparties with whom Danske commodities engages in transactions.
Danske commodities has credit insurance covering the main port - folio of bilateral counterparties which outlines the credit line applied to each counterparty. the insurance does not cover clearing houses and entities in or partly in the public sector, as these are considered minimal risk counterparties.
the credit risk affecting the derivative financial instruments measured at fair value is considered minimal.
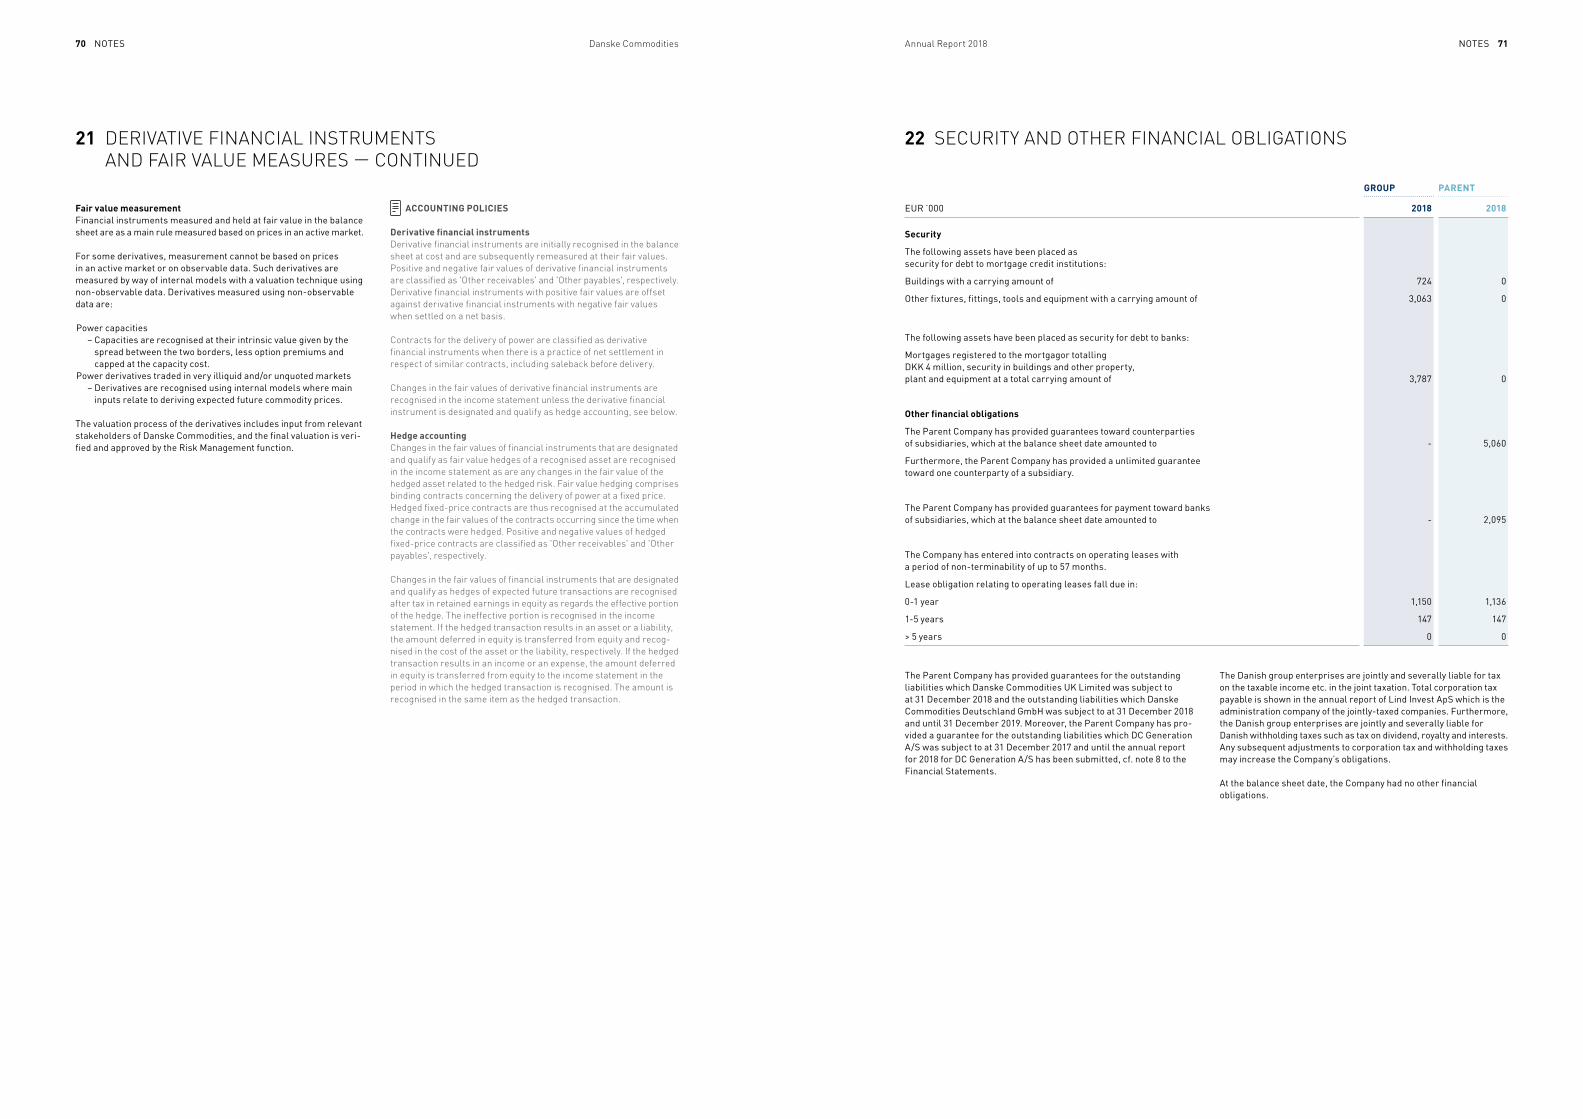
nOtes nOtes70 71Danske Commodities Annual Report 2018
Fair value measurementfinancial instruments measured and held at fair value in the balance sheet are as a main rule measured based on prices in an active market.
for some derivatives, measurement cannot be based on prices in an active market or on observable data. such derivatives are measured by way of internal models with a valuation technique using non-observable data. Derivatives measured using non-observable data are:
Power capacities – capacities are recognised at their intrinsic value given by the
spread between the two borders, less option premiums and capped at the capacity cost.
Power derivatives traded in very illiquid and/or unquoted markets – Derivatives are recognised using internal models where main
inputs relate to deriving expected future commodity prices.
the valuation process of the derivatives includes input from relevant stakeholders of Danske commodities, and the final valuation is veri - fied and approved by the Risk management function.
the Parent company has provided guarantees for the outstanding liabilities which Danske commodities UK limited was subject to at 31 December 2018 and the outstanding liabilities which Danske commodities Deutschland GmbH was subject to at 31 December 2018 and until 31 December 2019. moreover, the Parent company has pro - vided a guarantee for the outstanding liabilities which Dc Generation a/s was subject to at 31 December 2017 and until the annual report for 2018 for Dc Generation a/s has been submitted, cf. note 8 to the financial statements.
ACCOUNTING POLICIES
Derivative financial instrumentsDerivative financial instruments are initially recognised in the balance sheet at cost and are subsequently remeasured at their fair values. Positive and negative fair values of derivative financial instruments are classified as 'Other receivables' and 'Other payables', respectively. Derivative financial instruments with positive fair values are offset against derivative financial instruments with negative fair values when settled on a net basis.
Contracts for the delivery of power are classified as derivative financial instruments when there is a practice of net settlement in respect of similar contracts, including saleback before delivery.
Changes in the fair values of derivative financial instruments are recognised in the income statement unless the derivative financial instrument is designated and qualify as hedge accounting, see below.
Hedge accountingChanges in the fair values of financial instruments that are designated and qualify as fair value hedges of a recognised asset are recognised in the income statement as are any changes in the fair value of the hedged asset related to the hedged risk. Fair value hedging comprises binding contracts concerning the delivery of power at a fixed price. Hedged fixed-price contracts are thus recognised at the accumulated change in the fair values of the contracts occurring since the time when the contracts were hedged. Positive and negative values of hedged fixed-price contracts are classified as 'Other receivables' and 'Other payables', respectively.
Changes in the fair values of financial instruments that are designated and qualify as hedges of expected future transactions are recognised after tax in retained earnings in equity as regards the effective portion of the hedge. The ineffective portion is recognised in the income statement. If the hedged transaction results in an asset or a liability, the amount deferred in equity is transferred from equity and recog - nised in the cost of the asset or the liability, respectively. If the hedged transaction results in an income or an expense, the amount deferred in equity is transferred from equity to the income statement in the period in which the hedged transaction is recognised. The amount is recognised in the same item as the hedged transaction.
22 SECURITY AND OTHER FINANCIAL OBLIGATIONS
GROUP PARENT
eUR ’000 2018 2018
Security
the following assets have been placed as security for debt to mortgage credit institutions:
Buildings with a carrying amount of 724 0
Other fixtures, fittings, tools and equipment with a carrying amount of 3,063 0
the following assets have been placed as security for debt to banks:
mortgages registered to the mortgagor totalling DKK 4 million, security in buildings and other property, plant and equipment at a total carrying amount of 3,787 0
Other financial obligations
the Parent company has provided guarantees toward counterparties of subsidiaries, which at the balance sheet date amounted to - 5,060
furthermore, the Parent company has provided a unlimited guarantee toward one counterparty of a subsidiary.
the Parent company has provided guarantees for payment toward banks of subsidiaries, which at the balance sheet date amounted to - 2,095
the company has entered into contracts on operating leases with a period of non-terminability of up to 57 months.
lease obligation relating to operating leases fall due in:
0-1 year 1,150 1,136
1-5 years 147 147
> 5 years 0 0
the Danish group enterprises are jointly and severally liable for tax on the taxable income etc. in the joint taxation. total corporation tax payable is shown in the annual report of lind invest aps which is the administration company of the jointly-taxed companies. furthermore, the Danish group enterprises are jointly and severally liable for Danish withholding taxes such as tax on dividend, royalty and interests. any subsequent adjustments to corporation tax and withholding taxes may increase the company’s obligations.
at the balance sheet date, the company had no other financial obligations.
21 DERIVATIVE FINANCIAL INSTRUMENTS AND FAIR VALUE MEASURES — CONTINUED
nOtes72 Danske Commodities
23 OWNERSHIP AND RELATED PARTIES
24 EVENTS AFTER THE BALANCE SHEET DATE
25 DEFINITIONS OF FINANCIAL RATIOS
Control at 31 December 2018lind invest aps (Parent company)
the company is included in the consolidated financial statements of the Parent company.
the consolidated financial statements of lind invest aps can be obtained at the following address:Vaerkmestergade 25, 14., DK-8000 aarhus c
Other related partiesOther related parties in the period 1 January 2018 to 31 December 2018 comprise the management of lind invest aps as well as the Board of Directors, executive Board and senior management Group
no events have occured since the balance sheet date which could materially affect the company's financial position.
of the company, together with their immediate families. furthermore, related parties include companies in which lind invest aps and the aforementioned individuals have significant influence or control.
in accordance with section 98c, seventh paragraph of the Danish financial statements act, the company only reports on transactions with related parties not completed on an arm’s length basis.
Ownershipfrom 31 January 2019 equinor Refining norway as, 5954 mongstad, 1263 lindås, norway is registered in the company’s register of shareholders as holding more than 95% of the votes and shares.
Gross margin =Gross profit x 100
Revenue
eBit margin =eBit x 100
Revenue
scalability =eBit x 100
Gross profit
Return on assets =eBit x 100
total assets
Return on capital employed =eBit x 100
average total assets less non-interest bearing debt
equity ratio =equity at year end x 100
total assets
Return on equity =net profit for the year x 100
average equity
average number of employees: calculated as average number of full-time employees
number of employees, end of year: calculated as number of employees at end of year
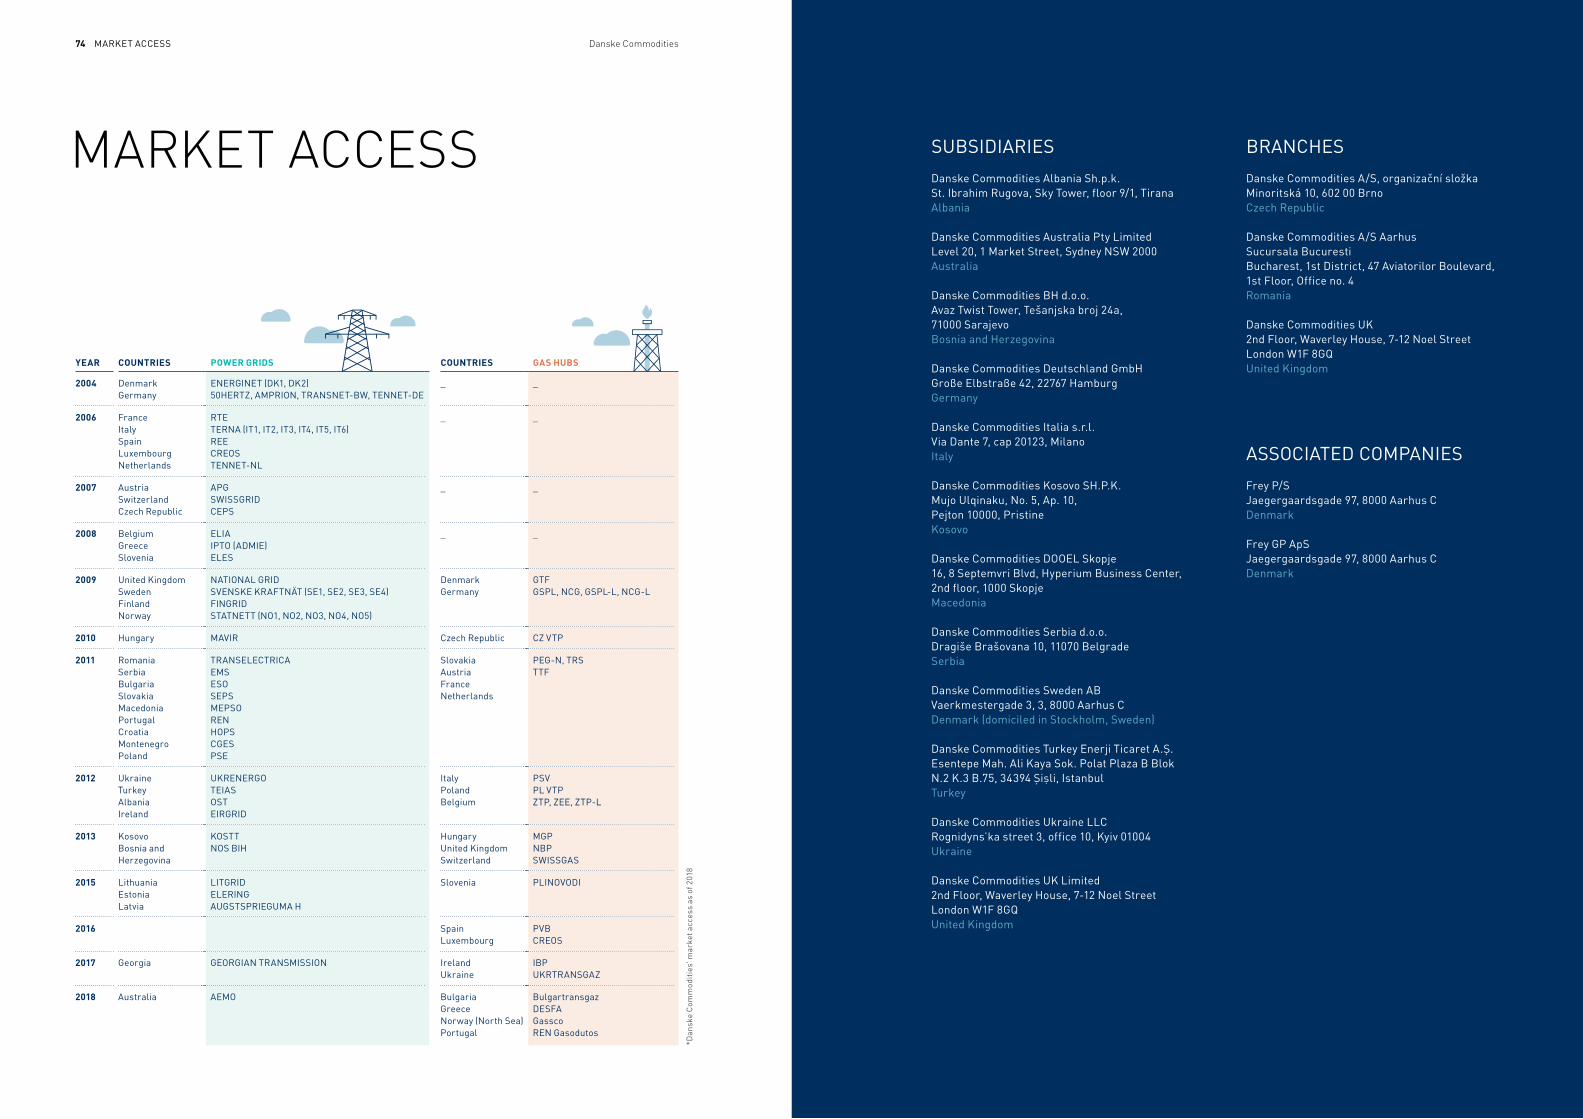
maRKet access74 Danske Commodities
MARKET ACCESS
YEAR COUNTRIES POWER GRIDS COUNTRIES GAS HUBS
2004 DenmarkGermany
eneRGinet (DK1, DK2)50HeRtZ, amPRiOn, tRansnet-BW, tennet-De
_ _
2006 franceitalyspainluxembourgnetherlands
RteteRna (it1, it2, it3, it4, it5, it6)ReecReOstennet-nl
_ _
2007 austriaswitzerlandczech Republic
aPGsWissGRiDcePs
_ _
2008 BelgiumGreeceslovenia
eliaiPtO (aDmie)eles
_ _
2009 United Kingdomswedenfinlandnorway
natiOnal GRiDsVensKe KRaftnÄt (se1, se2, se3, se4)finGRiDstatnett (nO1, nO2, nO3, nO4, nO5)
DenmarkGermany
GtfGsPl, ncG, GsPl-l, ncG-l
2010 Hungary maViR czech Republic cZ VtP
2011 RomaniaserbiaBulgariaslovakiamacedoniaPortugalcroatiamontenegroPoland
tRanselectRicaemsesOsePsmePsORenHOPscGesPse
slovakiaaustriafrancenetherlands
PeG-n, tRsttf
2012 Ukraineturkeyalbaniaireland
UKReneRGOteiasOsteiRGRiD
italyPolandBelgium
PsVPl VtPZtP, Zee, ZtP-l
2013 KosovoBosnia and Herzegovina
KOsttnOs BiH
HungaryUnited Kingdomswitzerland
mGPnBPsWissGas
2015 lithuaniaestonialatvia
litGRiDeleRinGaUGstsPRieGUma H
slovenia PlinOVODi
2016 spain luxembourg
PVBcReOs
2017 Georgia GeORGian tRansmissiOn ireland Ukraine
iBPUKRtRansGaZ
2018 australia aemO BulgariaGreecenorway (north sea)Portugal
BulgartransgazDesfaGasscoRen Gasodutos
*Dan
ske
com
mod
itie
s' m
arke
t acc
ess
as o
f 201
8
sUBsiDiaRies Danske commodities albania sh.p.k. st. ibrahim Rugova, sky tower, floor 9/1, tiranaalbania
Danske commodities australia Pty limitedlevel 20, 1 market street, sydney nsW 2000australia
Danske commodities BH d.o.o.avaz twist tower, tešanjska broj 24a,71000 sarajevoBosnia and Herzegovina
Danske commodities Deutschland GmbHGroβe elbstraβe 42, 22767 HamburgGermany
Danske commodities italia s.r.l.Via Dante 7, cap 20123, milanoitaly
Danske commodities Kosovo sH.P.K.mujo Ulqinaku, no. 5, ap. 10, Pejton 10000, PristineKosovo
Danske commodities DOOel skopje16, 8 septemvri Blvd, Hyperium Business center,2nd floor, 1000 skopjemacedonia
Danske commodities serbia d.o.o.Dragiše Brašovana 10, 11070 Belgradeserbia
Danske commodities sweden aBVaerkmestergade 3, 3, 8000 aarhus cDenmark (domiciled in stockholm, sweden)
Danske commodities turkey enerji ticaret a.Ş.esentepe mah. ali Kaya sok. Polat Plaza B Blok n.2 K.3 B.75, 34394 Şiṣli, istanbulturkey
Danske commodities Ukraine llcRognidyns’ka street 3, office 10, Kyiv 01004Ukraine
Danske commodities UK limited2nd floor, Waverley House, 7-12 noel streetlondon W1f 8GQUnited Kingdom
BRancHes
Danske commodities a/s, organizační složkaminoritská 10, 602 00 Brnoczech Republic
Danske commodities a/s aarhussucursala BucurestiBucharest, 1st District, 47 aviatorilor Boulevard,1st floor, Office no. 4Romania
Danske commodities UK2nd floor, Waverley House, 7-12 noel streetlondon W1f 8GQUnited Kingdom
assOciateD cOmPanies
frey P/sJaegergaardsgade 97, 8000 aarhus cDenmark
frey GP apsJaegergaardsgade 97, 8000 aarhus cDenmark
Danske Commodities challenges market inefficiencies with international trade, moving energy from where there is more than needed to where it is needed most.
As an agile energy trading house, we compete with established players to bring freedom of choice and fair energy prices to producers, suppliers and consumers.
We trade across borders, ensuring that energy markets stay competitive, efficient and balanced. Every minute of the day. Every day of the year.
WE CHALLENGE. WE COMPETE. AND THEN WE REPEAT.
HEADQUARTERSDansKe cOmmODitiesVaeRKmesteRGaDe 3DK 8000 aaRHUs cDenmaRK
PHONE +45 8833 8181FAX +45 8612 2430
WWW.DansKecOmmODities.cOmVAT NO. DK28113951