Eating for the Health of It Gwenn M. Snow, MS, RD Health Program Specialist I UNR Department of...
41
Eating for the Eating for the Health of It Health of It Gwenn M. Snow, MS, RD Gwenn M. Snow, MS, RD Health Program Specialist Health Program Specialist I I UNR Department of UNR Department of Nutrition Nutrition
-
Upload
wilfrid-charles -
Category
Documents
-
view
213 -
download
0
Transcript of Eating for the Health of It Gwenn M. Snow, MS, RD Health Program Specialist I UNR Department of...

Eating for the Health of ItEating for the Health of It
Gwenn M. Snow, MS, RDGwenn M. Snow, MS, RD
Health Program Specialist IHealth Program Specialist I
UNR Department of NutritionUNR Department of Nutrition
Presentation OverviewPresentation Overview
• Diet and Disease Relationships
• Dietary Guidance– Dietary Guidelines for Americans, 2005
• Diet Planning Tools– USDA’s Food Guide Pyramid– Nutrition Information in Food Labels
• Balance, Variety, and Moderation
Prevalence of Chronic DiseasePrevalence of Chronic Disease
• Chronic diseases– 7 of 10 deaths in the US– 75% of medical care expenditures
• 400,000 deaths attributable to physical inactivity and unhealthy eating
• Diseases with Dietary Associations
•Obesity•Cancer•Cardiovascular disease•Diabetes
•Hypertension•Osteoporosis•Osteoarthritis

Changes in Obesity
Prevalencein the US
1991 - 2002

Basic Nutrition in a NutshellBasic Nutrition in a Nutshell
• Aim for Nutrient Dense Foods– Macronutrients (protein, fat, carbohydrates)– Vitamins/Minerals– Fiber– Phytochemicals
• “All Foods Can Fit”– Balance– Variety– Moderation
• Calories In = Calories Out• Limit Intake of Empty Calories• To Lose Weight:
– Eat Less, Move More

Dietary Guidelines for Americans, Dietary Guidelines for Americans, BackgroundBackground
• DGA Revised Every 5 Years
• Designed to Promote Health and Reduce Risk of Chronic Disease
• Basis for Public Policy, Nutrition/Food Assistance Programs, and Nutrition Education
• Science-Based Dietary Advice for Healthy Americans >2 years old
Dietary Guidelines for Americans, Dietary Guidelines for Americans, 2005: Major Points2005: Major Points
• Released January 2005• Stronger Emphasis
– Reducing calorie consumption– Increasing physical activity– “Nutrient-dense” foods and beverages
• Variety Among Vegetable Subgroups- Dark green - Starchy vegetables- Orange, red, purple - Other vegetables- Legumes
• Whole Grain Foods– Quantified recommendation (at least 3, 1 oz servings/day)
• Dairy Foods– Increased recommendation (from 2 to 3 servings/day)

USDA’s Food Guide PyramidUSDA’s Food Guide Pyramid
• The Food Guide Pyramid is a visual tool to help people choose what and how much to eat each day
• Foods are divided into groups on the basis of nutrients provided
• Foods in one group cannot replace foods in another group
• No one food group is more important than another group

Pyramid ServingsPyramid Servings
• Each of the food groups contains a range of servings– Minimum number of servings = 1,600 calories
(moderate fat, sugar)– Maximum number of servings = 2,800 calories
(moderate fat, sugar)
• Eating the minimum number of servings from each food group provides the nutrients necessary for good health

Pyramid Servings: Bread, Cereal, Pyramid Servings: Bread, Cereal, Rice, & Pasta GroupRice, & Pasta Group
• Recommended number of servings = 6 – 11• Serving size: 1 slice bread; 1 oz dry cereal; ½ c
cooked cereal, rice, or pasta
Mean Number of Daily Servings
12-19 y.o. 20-29 y.o. All adults(≥ 20 y.o.)
Males 9.2 (1.1) 8.7 (1.1) 7.9 (1.1)
Females 6.3 (0.9) 5.9 (0.8) 5.5 (0.9)
NOTE: Number of servings in parenthesis are from whole grains

Pyramid Servings:Pyramid Servings:Vegetable GroupVegetable Group
• Recommended number of servings: 3 – 5• Serving size: 1 c raw leafy vege; ½ c other vege,
raw or cooked; ¾ c vege juice
Mean Number of Daily Servings
12-19 y.o. 20-29 y.o. All adults(≥ 20 y.o.)
Males 3.7 (1.7) 4.3 (1.7) 4.1 (1.4)
Females 2.7 (1.2) 3.0 (1.0) 3.1 (0.8)
NOTE: Number of servings in parenthesis are from white potatoes

Pyramid Servings:Pyramid Servings:Fruit GroupFruit Group
• Recommended number of servings: 2 – 4• Serving size: 1 med apple, orange, or banana; ½
c chopped, cooked, canned fruit; ¾ c fruit juice
Mean Number of Daily Servings
12-19 y.o. 20-29 y.o. All adults(≥ 20 y.o.)
Males 1.4 1.3 1.5
Females 1.3 1.2 1.5

Pyramid Servings:Pyramid Servings:Milk, Yogurt, and Cheese GroupMilk, Yogurt, and Cheese Group
• Recommended number of servings: 2 - 3• Serving size: 1 c milk or yogurt; 1 ½ oz natural
cheese; 2 oz processed cheese
Mean Number of Daily Servings
12-19 y.o. 20-29 y.o. All adults(≥ 20 y.o.)
Males 2.4 1.7 1.5
Females 1.5 1.3 1.5

Pyramid Servings: Meat, Poultry, Pyramid Servings: Meat, Poultry, Fish, Dry Beans, Eggs, & Nuts GroupFish, Dry Beans, Eggs, & Nuts Group• Recommended number of servings: 5 – 7 oz• Serving size: 1 oz
(One 3-oz portion of cooked meat = the size of a deck of cards)
Mean Number of Daily Servings
12-19 y.o. 20-29 y.o. All adults(≥ 20 y.o.)
Males 5.9 6.6 6.4
Females 3.7 3.8 3.9

Nutrition Information onNutrition Information onFood LabelsFood Labels
• Health Claims
• Ingredient Lists
• Nutrient Claims
• Nutrition Facts
• Percent Daily Values

Food Labels: QualifiedFood Labels: QualifiedHealth ClaimsHealth Claims
• Statements Describing Foods/Nutrients Associated with Chronic Disease Risk
• “As part of an overall healthy diet”– Monounsaturated fats and coronary heart disease*– Calcium and osteoporosis– Dietary fat and cancer– Dietary saturated fat and cholesterol and coronary heart disease– Dietary soluble fiber, such as that found in whole oats and psyllium seed
husk, and coronary heart disease– Fiber-containing grain products, fruits, and vegetables and cancer– Folate and neural tube birth defects– Fruits, vegetables, and grain products that contain fiber, particularly
soluble fiber, and risk of coronary heart disease – Sodium and hypertension

Food Labels: Using Ingredient ListsFood Labels: Using Ingredient Lists
• Ingredients are listed by descending order of weight
• Useful for people with food allergies or sensitivities
• Margarines: Choose those with water or liquid vegetable oil as the first ingredient
• Breads/Cereals: Choose those with the word “whole” as the first ingredient

Food Labels: Nutrient ClaimsFood Labels: Nutrient Claims
Nutrient Claim DefinitionHigh 20% DV or more of specified nutrient
Good source 10 – 19% DV of specified nutrient
Low fat 3 g or less fat per serving
Low sodium 140 mg or less sodium per serving

Food Labels: Using Food Labels: Using Nutrition FactsNutrition Facts
• Evaluate the healthfulness of individual foods
• Compare similar foods• Assess how a food fits
into one day’s worth of meals/snacks
What you need to know:• Serving size
– Household measurements
– Grams
• Number of servings per container
Nutrition Facts:Nutrition Facts:Mandatory NutrientsMandatory Nutrients
• Calories
• Calories from fat
• Total fat
• Saturated fat
• Cholesterol
• Sodium
• Total Carbohydrate
• Dietary fiber
• Sugars
• Protein
• Vitamin A
• Vitamin C
• Calcium
• Iron

Nutrition Facts:Nutrition Facts:Percent Daily ValuesPercent Daily Values
• Based on the amount of food eaten in one day– Assuming a 2000 calorie diet
• Show how a single food fits into one day’s worth of eating
• Useful tool for comparing foods
• To use, think of it as having a dollar to spend every day – for each nutrient

Percent Daily Values:Percent Daily Values:Getting Your “Dollars’ Worth”Getting Your “Dollars’ Worth”
Every day, aim for 100% DV of these nutrients:
• Vitamin A
• Vitamin C
• Calcium
• Iron

Percent Daily Values: Watching Percent Daily Values: Watching Your “Nutrient Budget”Your “Nutrient Budget”
Every day, keep these nutrients at 100% DV or less:
• Total fat
• Saturated fat
• Cholesterol
• Sodium

Healthful Eating with the Food Guide Healthful Eating with the Food Guide Pyramid and Percent Daily ValuesPyramid and Percent Daily Values
• Balance– Between food groups– Nutritional adequacy of total diet
• Variety– Between food groups– Within food groups
• “Nutrient density”
• Moderation– Portion sizes– Fats, oils, and sweets

Balance: It All Adds Up, 1Balance: It All Adds Up, 1
0
20
40
60
80
100
Per
cen
t D
aily
Val
ue
WW Bread 2 slices

Balance: It All Adds Up, 2Balance: It All Adds Up, 2
0
20
40
60
80
100
Per
cen
t D
aily
Val
ue
WW Bread 2 slices Peanut butter 2 tbsp
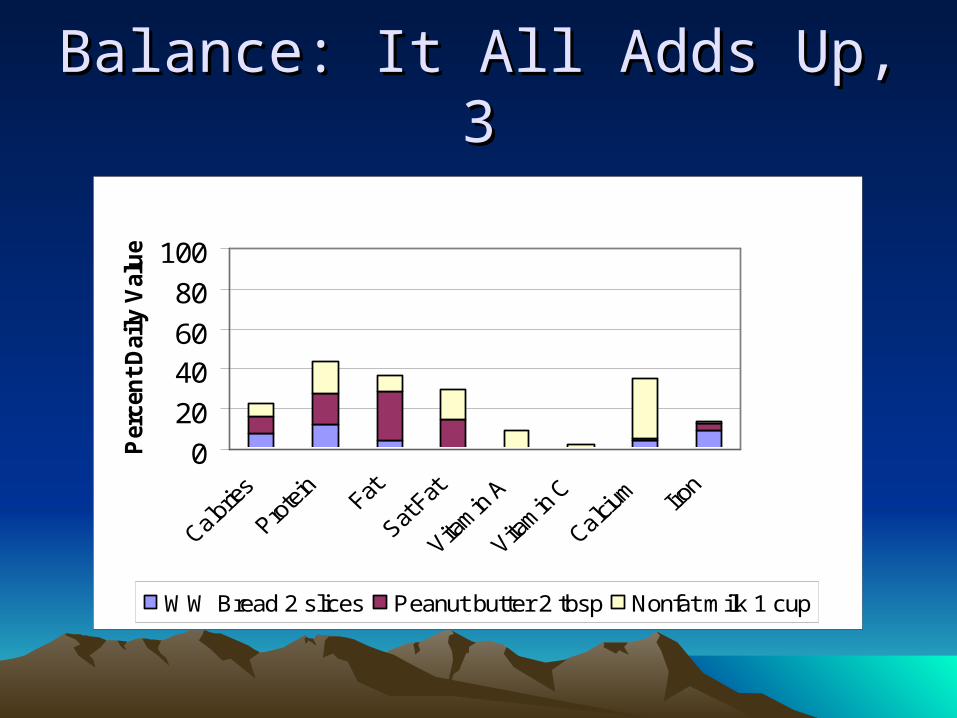
Balance: It All Adds Up, 3Balance: It All Adds Up, 3
0
20
4060
80
100
Per
cen
t D
aily
Val
ue
WW Bread 2 slices Peanut butter 2 tbsp Nonfat milk 1 cup

Balance: It All Adds Up, 4Balance: It All Adds Up, 4
0
20
40
60
80
100
Per
cen
t D
aily
Val
ue
WW Bread 2 slices Peanut butter 2 tbsp
Nonfat milk 1 cup Banana 1 medium

Balance: It All Adds Up, 5Balance: It All Adds Up, 5
0
20
40
60
80
100
Perc
en
t D
ail
y V
alu
e
WW Bread 2 slices Peanut butter 2 tbsp
Nonfat milk 1 cup Banana 1 medium
Carrot sticks 1 medium

Variety: Nutrient Density, BreakfastVariety: Nutrient Density, BreakfastWhite toast with 1 tsp jelly compared to ½ cup oatmeal, with ½ cup 1% milk, 2 tbsp raisins, and 1 tsp sugar
0
20
40
60
80
100
Nutrients
Per
cen
t D
aily
Val
ue
Toast
Oatmeal

Variety: Nutrient Density, Lunch, 1Variety: Nutrient Density, Lunch, 1
0
20
40
60
80
100
Nutrients
Per
cen
t D
aily
Val
ue Soup and
Crackers
1/2 TunaSandwich
1 c chicken soup with 4 saltines compared to ½ tuna sandwich
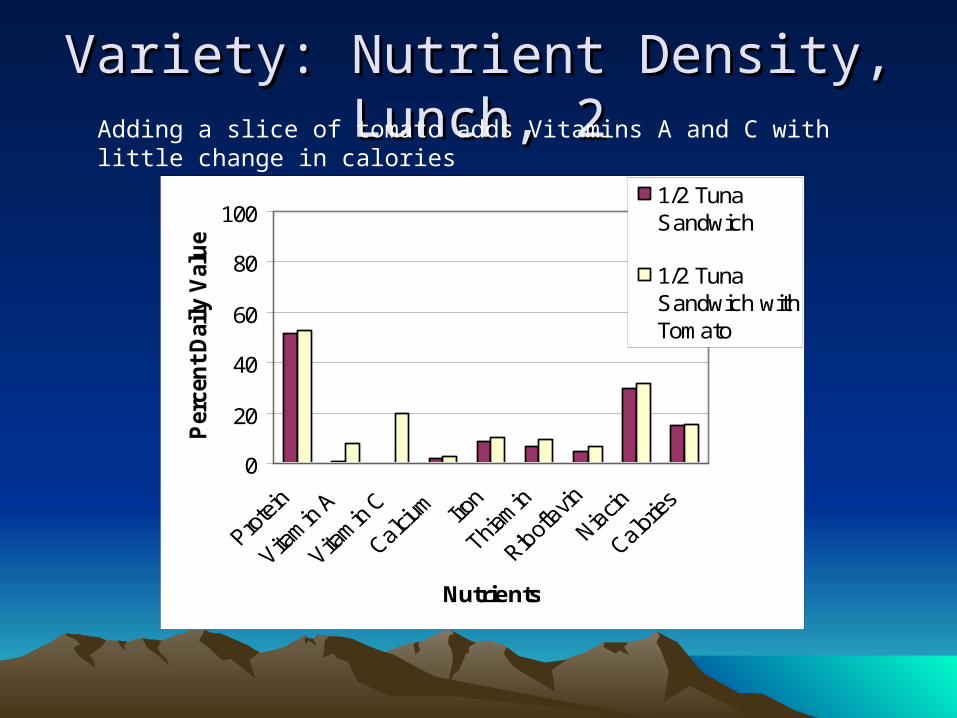
Variety: Nutrient Density, Lunch, 2Variety: Nutrient Density, Lunch, 2Adding a slice of tomato adds Vitamins A and C with little change in calories
0
20
40
60
80
100
Nutrients
Per
cen
t D
aily
Val
ue
1/2 TunaSandwich
1/2 TunaSandwich withTomato

Variety: Nutrient Density, MilkVariety: Nutrient Density, Milk
0
20
40
60
80
100
Nutrients
Per
cen
t D
aily
Val
ue
Whole Milk
2% Milk
1% Milk

Variety: Nutrient Density, LettuceVariety: Nutrient Density, Lettuce
0
20
40
60
80
100
Nutrients
Per
cen
t D
aily
Val
ue
Iceberg
Romaine
*Less than 1% DV

Variety: Nutrient Density, Frozen Variety: Nutrient Density, Frozen DessertDessert
0
20
40
60
80
100
Nutrients
Per
cen
t D
aily
Val
ue
Ice Cream
Frozen Yogurt

Moderation: Big Mac/Large Fry and Moderation: Big Mac/Large Fry and Daily Sodium AllowanceDaily Sodium Allowance
37
1281
42Big Mac
Large Fry
Catsup, 3 pkts
Med Coke 21 fl oz
% DV Remaining

Moderation: Big Mac/Large Fry and Moderation: Big Mac/Large Fry and Daily Fat AllowanceDaily Fat Allowance
43
33
0
0
24
Big Mac
Large Fry
Catsup, 3 pkts
Med Coke 21 fl oz
% DV Remaining

Moderation: Nutrient Content of Moderation: Nutrient Content of Select Starbucks BeveragesSelect Starbucks Beverages
050
100
150200250
Coffee Apple Cider Capp, Whole Milk Capp, Nonfat Milk

Effects of Changes in Energy Effects of Changes in Energy Intake (1 Year)Intake (1 Year)
• 1 pound = 3,500 Calories (kilocalories)
• 100 kcal/day for one year = 36,500 kcals
• 36,500 kcals/year ÷ 3,500 kcals/pound = 10.43 pounds per year
• Kcal content of foods/beverages– Chocolate chip cookie (2 ¼“ dia) = 78 kcals– Carbonated beverage (12 oz) = 155 kcals (13 kcals/oz)– Small banana = 90 kcals
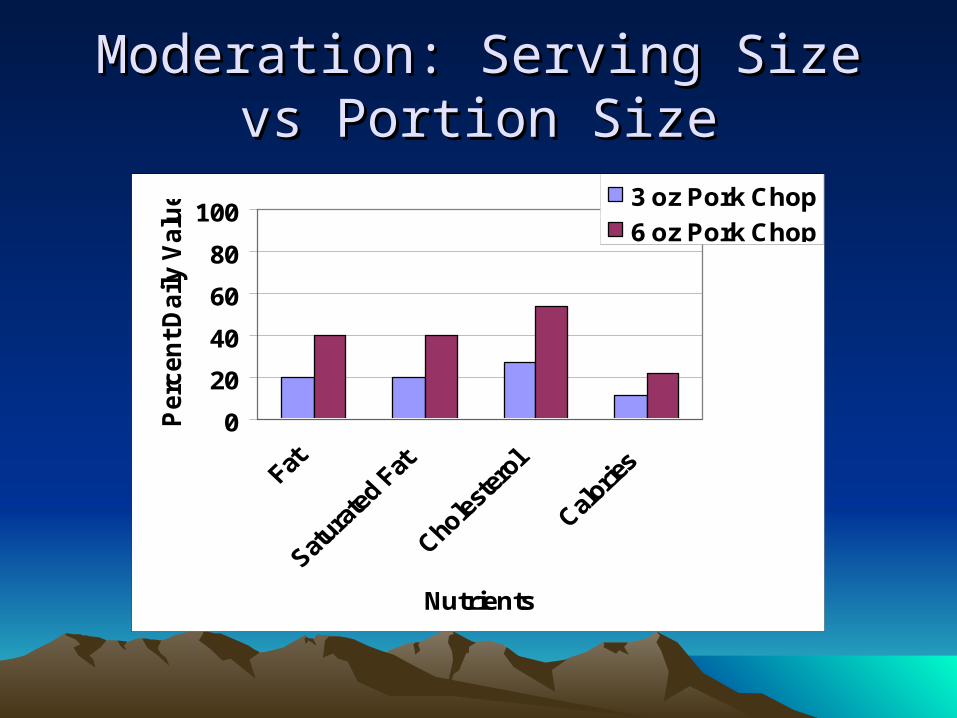
Moderation: Serving Size vs Moderation: Serving Size vs Portion SizePortion Size
0
20
40
60
80
100
Nutrients
Perc
en
t D
aily
Valu
e 3 oz Pork Chop
6 oz Pork Chop
Summing It UpSumming It Up
• Every food choice counts• Balancing food choices helps to insure a
diet rich in nutrients• When faced with a variety of choices, opt
for nutrient-dense foods/beverages• Practice moderation in food choices and
portion sizes• With knowledge and planning, all foods
can fit into an overall healthful diet!


![STFTTfT ^ 05/2017/f^^ 12.12.2017 WT-WT ^ ^ ^x]^|^'...2 102718 rachna sharma f unrf unr 3 104316 rajnandini sharma f unrf unr 4 100278 ravindra parmar m unr obc 5 102066 kiran singh](https://static.fdocuments.in/doc/165x107/5ed1ca87451b173a8139019a/stfttft-052017f-12122017-wt-wt-x-2-102718-rachna-sharma-f.jpg)