EasySense Android software guide - Data...
15
EasySense Android software guide This manual may be freely copied for use with the EasySense software. Copyright: all rights reserved. Data Harvest's policy is to continually improve products and services, so we reserve the right to make changes without notice. It is acknowledged that there may be errors or omissions in this publication for which responsibility cannot be assumed. No liability will be accepted for loss or damage resulting from use of information contained in this manual or from uses as described. Data Harvest Group Ltd. 1 Eden Court, Leighton Buzzard Bedfordshire LU7 4FY [email protected] www.data-harvest.co.uk DO254 Issue 2
Transcript of EasySense Android software guide - Data...

EasySense Android
software guide
This manual may be freely copied for use with the EasySense software.
Copyright: all rights reserved.
Data Harvest's policy is to continually improve products and services, so we reserve the right to make changes
without notice. It is acknowledged that there may be errors or omissions in this publication for which
responsibility cannot be assumed. No liability will be accepted for loss or damage resulting from use of
information contained in this manual or from uses as described.
Data Harvest Group Ltd. 1 Eden Court, Leighton Buzzard Bedfordshire LU7 4FY [email protected] www.data-harvest.co.uk
DO254 Issue 2

EasySense Android software DO254 (2)
© Data Harvest Ltd. 2
Contents
Compatibility .......................................................................................................................................................... 2
To connect to a data logger .................................................................................................................................... 3
The logging window ................................................................................................................................................ 4
Recording data ........................................................................................................................................................ 4
New recording ........................................................................................................................................................ 4
Sensors................................................................................................................................................................ 5
Test Mode ........................................................................................................................................................... 5
EasyLog ............................................................................................................................................................... 5
Manual ................................................................................................................................................................ 5
Snapshot ............................................................................................................................................................. 6
Timing ................................................................................................................................................................. 7
Analysing captured data ......................................................................................................................................... 9
Values ................................................................................................................................................................. 9
Interval/ Difference ............................................................................................................................................ 9
Gradient ............................................................................................................................................................ 10
Area .................................................................................................................................................................. 10
Statistics .................................................................................................................................................... 11
Best Fit Line ...................................................................................................................................................... 11
Displaying data ..................................................................................................................................................... 12
Data Value boxes .............................................................................................................................................. 12
The Table display .............................................................................................................................................. 12
Zoom ................................................................................................................................................................. 12
X and Y axis ....................................................................................................................................................... 12
Show/Hide sensor, Autoscale, Sensor settings ................................................................................................. 13
Options: Grid, Overlay, Line thickness, Line or Bar graph, Show Data As ........................................................ 13
Title ................................................................................................................................................................... 14
Changing a sensor’s range .................................................................................................................................... 14
Retrieve ................................................................................................................................................................ 14
Share ..................................................................................................................................................................... 14
File options ........................................................................................................................................................... 15
Open file ........................................................................................................................................................... 15
Delete file ......................................................................................................................................................... 15
Saving files ........................................................................................................................................................ 15
File name .......................................................................................................................................................... 15
EasySense Software Multi-user Site Licence ........................................................................................................ 15
Compatibility
Computer
Model Operating System
Android OS 4.4 or later For Bluetooth device must support Bluetooth Low Energy (BLE)

EasySense Android software DO254 (2)
© Data Harvest Ltd. 3
Data Loggers
Model Product No. Connection
VISION 2020 BLE Requires a Bluetooth Smart USB Adaptor (Product No. 2070)
VISION Wi-Fi 2021 Wi-Fi Built in Wi-Fi
BLE Requires a Bluetooth Smart USB Adaptor (Product No. 2070)
V-Log 4 or 8 2404 or 2408
Add either Wi-Fi or Bluetooth module
Wi-Fi Requires a Wi-Fi module (Product No. 2401)
BLE Requires Bluetooth BLE module (Product No. 2400VL)
V-Log 4 or 8 Wi-Fi 2405 or 2409 Wi-Fi Built in Wi-Fi
V-Hub 4 or 8 2504 or 2508 BLE Built in Bluetooth
Wi-Fi Requires a V-Hub Wi-Fi module (Product No. 2501)
V-Hub 4 or 8 Wi-Fi 2505 or 2509 BLE Built in Bluetooth
Wi-Fi Built in Wi-Fi
Vu+ 2305 BLE Built in Bluetooth
To connect to a data logger
1) When connecting via Wi-Fi ensure the Android is connected to the same network as the data logger
(Settings, Wi-Fi). If connecting via Bluetooth ensure Bluetooth is On but do not pair the device.
2) Start the EasySense App on the Android.
The first device (Android, iOS or PC Windows) that connects to a data logger becomes the Controller and has
access to set up a new recording and start and stop logging. Subsequent devices that connect will have
Viewing rights only.
Notes: Once a connection is established the connect icon will move to the overflow list. If you select Connect to..
while Controlling or Viewing xx, it will automatically disconnect the logger.
3) Tap on the connect icon
4) Select a data logger
from the list that opens
5) The status information will change
from Not Connected to show it is
‘Controlling xx’ or ‘Viewing xx’.
(12.3.4.56)
(12.3.4.55)
(12.3.4.76)
(12.3.4.66)
(12.3.4.11)
(12.3.4.10)

EasySense Android software DO254 (2)
© Data Harvest Ltd. 4
The logging window
Recording data
To begin recording, simply tap on the Start icon.
During logging the icon will show a square. Tap on this icon to stop data being recorded before the
selected duration has passed.
If you want to repeat the last experiment (clear data but keep all the settings the same) simply tap on
the Start icon again.
If you want to graph a new set of data, without the previous set of data being erased select Overlay
before you select Start.
New recording
Select the New icon to set up a new investigation e.g. to change logging mode, duration of a recording, or to
identify a change of sensors or change a sensor’s range
Set up a New recording (Test Mode,
EasyLog, Snapshot, Manual and Timing)
This icon is only available to the device
controlling the logger
Tap here to Start
or Stop logging
Analysis tools (Values, Interval /
Difference, Gradient,
Area, Statistics, Best Fit
Line)
Connected logger’s name
Sensor (Hide/Show,
Scale axis)
Open (Saved Files)
Overflow:
Options for display (Grid,
Overlay, Line Thickness, Graph type)
Share (e.g. Dropbox, Gmail,
Beam, Save to Drive)
Retrieve (a stored data set from a
logger)
Connect to … (to disconnect and
connect to a logger)
About (Network currently
connected, Version No.)

EasySense Android software DO254 (2)
© Data Harvest Ltd. 5
Scroll to the
interval
between the
samples being
taken
The number of samples that will be taken with
this set up will alter automatically
Scroll to the
time span
required for
the experiment
Sensors – use to deselect any sensors from which readings are not required or to change a sensor’s range
Choose your mode of logging:
Test Mode – use to establish the sensor/s current value.
EasyLog
Pre-set to record sensor values continuously as a line graph until stopped.
With EasyLog selected tap on Done.
To begin recording select the Start icon ►. Logging will start with a time
span of 30 seconds and when it has elapsed the time span will double
automatically. This will continue until the recording is stopped by selecting
the Stop icon .
Manual
Use to record sensor values against a chosen time span as a line graph display. Choose the time span and interval between samples.
To change a sensor’s
range, tap on the arrow
Drag left to switch a
sensor OFF (so no
readings will be taken
from this sensor)
A tick will mark the
range currently
selected
Select a new range from the list that
opens, then either Back to return to
the previous screen or Done to finish
Tap in the
Sensors: x row
Select
Manual Select
duration
or sample
rate
Select Done at any
stage when your
selection is complete

EasySense Android software DO254 (2)
© Data Harvest Ltd. 6
If FAST logging (with a sample rate of less than 20 ms) then the option to set a start condition will become available.
Select the Start icon ►. Recording will start when the start condition is met. The recording will stop when the selected time span has passed.
Note: While FAST logging there is no screen display of data until the recording has finished.
Select the Stop icon ■ to stop data being recorded before the selected duration has passed.
Snapshot
Use to record sensor values on demand (manual sampling) with a bar graph display.
Click on the Start icon ► to begin recording. Click within the graph area to collect a sample. Click on the Stop icon to stop data being recorded.
If you click on the Start icon again you will be given the option to add the new readings to the end of the existing data (if No is selected the existing data will be deleted).
Higher than - start recording when the value is above the set level.
SET LEVEL
Lower than - start recording when the value is below the set level.
SET LEVEL
Rises above – logging will
not start until the value
from a sensor rises up
above the set level.
SET LEVEL
Falls below - logging will
not start until the value
from a sensor falls below
the set level.
SET LEVEL
Select ‘None’ for recording
to begin as soon as you tap
on the Start icon.
(Default condition)
b
Select ‘On Level’ to delay the start until a set condition is reached.
Select: a. The trigger sensor b. Whether the value should be higher
than, lower than, rises above or falls below
c. Enter the sensor’s trigger value
c
a

EasySense Android software DO254 (2)
© Data Harvest Ltd. 7
Timing
Timing is used to handle data from switch-type sensors such as Light gates and Timing mats. Measurements can
be taken from either a single sensor connected to Input A, or from two sensors connected to both Input A and B.
Select New to set up an investigation. To perform calculations for Speed/Velocity, Acceleration, Distance,
Momentum and Kinetic Energy, select the type and size of apparatus used in an experiment.
Select New
Select Timing,
then Timing type
to open the
choices available.
Select Done at
any time to finish
your selection
Tap on the apparatus row
and select the type to be
used and enter any
measurements required
for calculation
Select Columns to display any data used in calculating this timing type from the list (this will vary depending on the timing type selected).
Select Display to alter the number of decimals
displayed and the unit of measurement
From Experiment tap on a row to select what
it is you want to measure
Step 1
Step 2
Step 3
Step 4

EasySense Android software DO254 (2)
© Data Harvest Ltd. 8
Choices are:
Apparatus Measurement to enter
Time at A - -
from A to B - -
from A to A e.g. Stopwatch - -
at A or B - -
at A then B - -
period at A e.g. Pendulum - -
Speed /Velocity at A Single interrupt card - length of card (m)
Double interrupt card - segment length (m)
Picket fence - fence pitch (m) & calculation increment
Pulley - none
from A to B - - distance from A to B (m)
at A or B Single interrupt card - length of card (m)
at A then B Single interrupt card - length of card (m)
Distance at A Picket fence - fence pitch (m) & calculation increment
Pulley -
Acceleration at A Double interrupt card - segment length (m)
Picket fence - fence pitch (m) & calculation increment
Pulley - none
at A or B Double interrupt card - segment length (m)
from A to B Single interrupt card - length of card (m)
at A then B Double interrupt card - segment length (m)
change from A to B Double interrupt card - segment length (m)
Momentum and Kinetic Energy
at A Single interrupt card
- length of card (m) - mass of object through A (kg)
Double interrupt card
- segment length (m) - mass of object through A (kg)
Picket fence
- fence pitch (m) - calculation increment - mass of object through A (kg)
Pulley - mass of object through A (kg)
at A or B Single interrupt card
- length of card (m) - mass of object through A (kg) + B (kg)
from A to B - distance from A to B (m) - mass of through A (kg)
at A then A Single interrupt card
- length of card (m) - mass of through A (kg)
change from A to A Single interrupt card
- length of card (m) - mass of object through A (kg)
at A then B Single interrupt card
- length of card (m) - mass of object through A (kg) + B (kg)
change from A to B Single interrupt card
- length of card (mm) - mass of object through A (kg) + B (kg)
Raw Times (interrupt edge
times)
at A - -
at A or B - -

EasySense Android software DO254 (2)
© Data Harvest Ltd. 9
Analysing captured data
The Tools menu has a number of Analysis tools to study captured data.
Values
Drag the marker to select a data point.
Interval/ Difference Drag the 2 markers to choose two points. (Not available in Snapshot or Timing mode)
The Difference
between the data
at these two points
is shown here
The time elapsed between the two points is shown here
2 markers
Marker
The Value at the marker point is shown in the data box and highlighted in the table

EasySense Android software DO254 (2)
© Data Harvest Ltd. 10
Gradient Drag the 2 markers to choose two points. (Not available in Snapshot or Timing mode)
Area (Not available in Snapshot or Timing mode)
This feature is used to calculate and display the area under a chosen section of the graph. The calculation for area is performed on the data from all channels. The units correspond to the product of the Y and X-axis.
2 markers
The gradient line indicates the
slope for whichever sensor is
selected on the Y-axis
To alter the sensor displayed
on this axis, tap in the area
left of the axis and select.
This should be done before you
select the Area tool
The Area is
shown here
The Gradient for the data between
the two markers is shown here
To alter the sensor displayed on this axis,
tap in the area left of the axis and select
This should be done before you select the
Gradient tool
Drag the markers, shading lines will mark the section under
the graph for whichever sensor is selected on the Y-axis
EasySense Android software DO254 (2)
© Data Harvest Ltd. 11
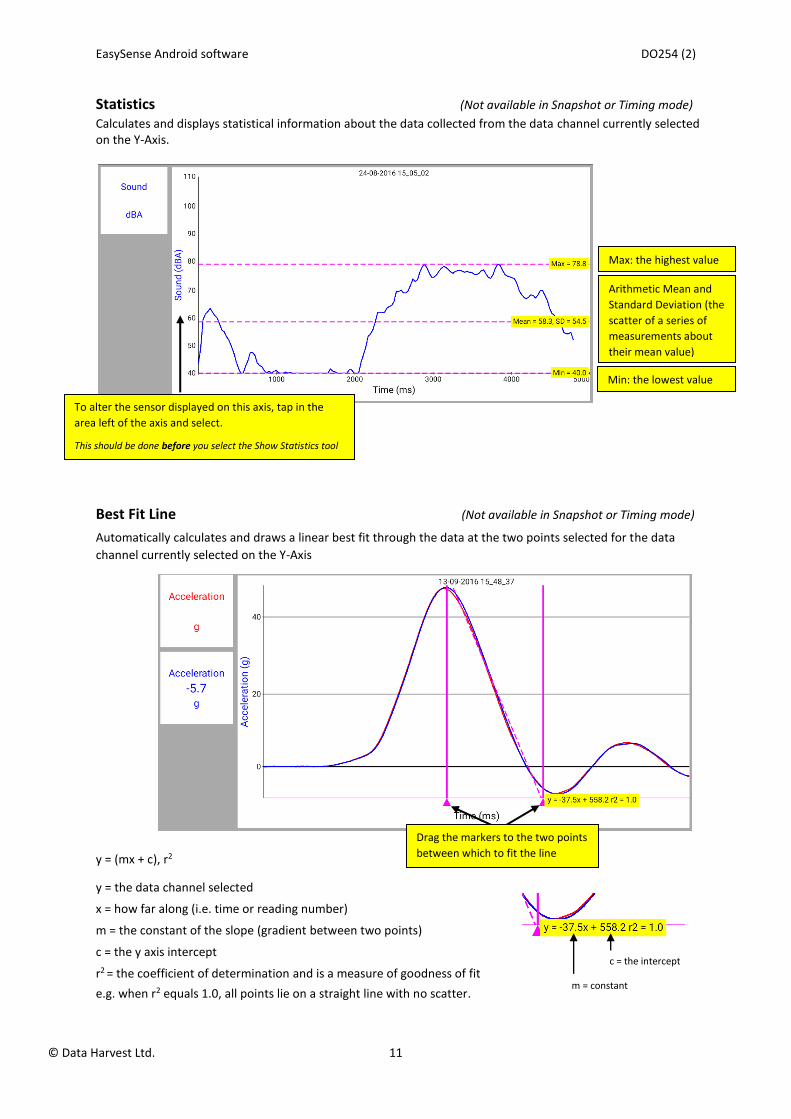
Statistics (Not available in Snapshot or Timing mode) Calculates and displays statistical information about the data collected from the data channel currently selected on the Y-Axis.
Best Fit Line (Not available in Snapshot or Timing mode)
Automatically calculates and draws a linear best fit through the data at the two points selected for the data
channel currently selected on the Y-Axis
y = (mx + c), r2
y = the data channel selected
x = how far along (i.e. time or reading number)
m = the constant of the slope (gradient between two points)
c = the y axis intercept
r2 = the coefficient of determination and is a measure of goodness of fit
e.g. when r2 equals 1.0, all points lie on a straight line with no scatter.
c = the intercept
m = constant
Max: the highest value
Min: the lowest value
Arithmetic Mean and
Standard Deviation (the
scatter of a series of
measurements about
their mean value)
To alter the sensor displayed on this axis, tap in the
area left of the axis and select.
This should be done before you select the Show Statistics tool
Drag the markers to the two points
between which to fit the line

EasySense Android software DO254 (2)
© Data Harvest Ltd. 12
Displaying data
Data Value boxes
The value recorded by a sensor is displayed in a data value
box. The colour used in a data value box corresponds to the
colour of the plotted line and the y-axis label on the graph.
The Table display
When the Android is landscape the graph area will automatically
fill the window. To expose the table rotate to portrait.
Drag in the table area to scroll the data.
When the Values tool is used, data selected on the graph will be highlighted in the table.
Zoom
To magnify an area so that it can be seen in greater detail, pinch two fingers and move apart to zoom in or
pinch together to zoom out on both the X and Y axis. To expand the magnified area further, repeat the above.
Double tap to switch zoom OFF and return to the original graph.
X and Y axis
(2) Select the sensor to
display from the list
This option will not be available
while an Analysis tool is in use
Drag left (OFF) to hide this sensor’s graph line and
value box from view, drag right (ON) to show
Tap below the graph area for the x-axis options.
Time:
• Time - elapsed time in milliseconds (ms), seconds (s), minutes (m), hours (h) and days (d)
• Absolute Time - clock time for the duration of the recording [Absolute Time (hh:mm:ss)
• Seconds - elapsed time in seconds
Reading Number
(1) To alter the
sensor displayed
on the axis, tap in
the area left of
the y-axis.

EasySense Android software DO254 (2)
© Data Harvest Ltd. 13
Show/Hide sensor, Autoscale, Sensor settings
Tap in the
sensor’s data
value box.
(Data value box)
Options: Grid, Overlay, Line thickness, Line or Bar graph, Show Data As
In Timing mode a Show Data As option will also be available. It can be used to recalculate data in another form
without having to repeat an experiment. Select how you want to show the current data and enter any
measurements required for the calculation. E.g. recalculate Distance data collected using a picket fence to
show Speed.
Drag left (OFF) to hide this sensor’s graph line and value box from view.
To show again tap in the area left of the y-axis and drag to ON
Applies Auto scale to this sensor’s data using
the minimum and maximum value
a minimum of zero to maximum value
Select User to let you alter this sensor’s minimum and maximum limits manually
Apply the same scale to any sensors of the same type connected
Set to its original scale
Tap Options for Overlay,
Grid, Line thickness and
graph type menu
With Overlay selected a new set of data can be added to the graph without the previous set of data being erased - useful for repeating an experiment to compare data
Select Grid to mark the graph area
with a faint grating
Overflow icon
(top right of
screen)
Drag to increase or decrease
the thickness of the graph line Use to change between
a line or bar graph
EasySense Android software DO254 (2)
© Data Harvest Ltd. 14
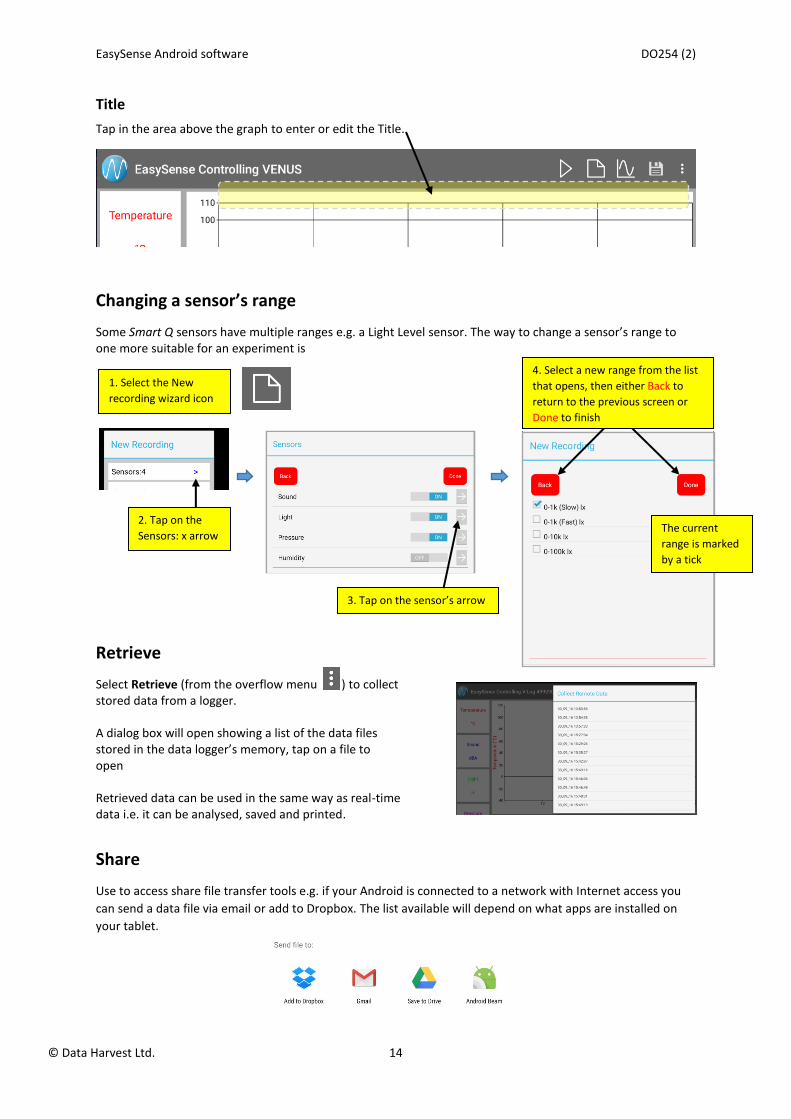
Title
Tap in the area above the graph to enter or edit the Title.
Changing a sensor’s range
Some Smart Q sensors have multiple ranges e.g. a Light Level sensor. The way to change a sensor’s range to one more suitable for an experiment is
Retrieve
Select Retrieve (from the overflow menu ) to collect stored data from a logger. A dialog box will open showing a list of the data files stored in the data logger’s memory, tap on a file to open Retrieved data can be used in the same way as real-time data i.e. it can be analysed, saved and printed.
Share
Use to access share file transfer tools e.g. if your Android is connected to a network with Internet access you
can send a data file via email or add to Dropbox. The list available will depend on what apps are installed on
your tablet.
1. Select the New
recording wizard icon
3. Tap on the sensor’s arrow
The current
range is marked
by a tick
2. Tap on the
Sensors: x arrow
4. Select a new range from the list
that opens, then either Back to
return to the previous screen or
Done to finish

EasySense Android software DO254 (2)
© Data Harvest Ltd. 15
File options
Open file
To load previously saved data files select or Open from overflow menu and tap on a file to open.
Delete file
Select Open file, locate the file in the saved file list, touch and long hold the file and select Delete.
Saving files
Data is auto-saved within the program. The file name auto-defaults to the creation date & time.
File name
Select Open file, locate the file (default name is the creation date & time), touch and long hold the file, select
Move, then Rename and type in a new name.
EasySense Software Multi-user Site Licence
Definitions
The following expressions have the meanings given here:
‘DHG’ means Data Harvest Group Limited, being owner of all intellectual property rights in the Software
‘Documentation’ means both printed and electronic user documentation.
‘Software’ means the program supplied.
Licence
This software package may be freely used, copied, and disseminated. This includes any associated documentation and user guides.
The software may not be amended, changed or altered in anyway.
Limited Warranty and Disclaimer of Liability
The Software is supplied ‘as is’; DHG makes no warranty, whether express or implied, as to the merchant ability of the Software or its fitness for any particular purpose. In no circumstances will DHG be liable for any damage, loss of profits, goodwill or for any indirect or consequential loss arising out of your use of the Software, or inability to use the Software, even if DHG has been advised of the possibility of such loss. General
These conditions supersede any prior agreement, oral or written, between the licensee and DHG relating to the software.