Family of Transit Modes University of Washington CE 589 – Transit Planning March 26, 2007.

ISSN 1055-1425
October 2008
This work was performed as part of the California PATH Program of the University of California, in cooperation with the State of California Business, Transportation, and Housing Agency, Department of Transportation, and the United States Department of Transportation, Federal Highway Administration.
The contents of this report reflect the views of the authors who are responsible for the facts and the accuracy of the data presented herein. The contents do not necessarily reflect the official views or policies of the State of California. This report does not constitute a standard, specification, or regulation.
Final Report for Task Order 6113
CALIFORNIA PATH PROGRAMINSTITUTE OF TRANSPORTATION STUDIESUNIVERSITY OF CALIFORNIA, BERKELEY
EasyConnect: Low-Speed Modes Linked to Transit Planning Project
UCB-ITS-PRR-2008-17California PATH Research Report
Susan A. Shaheen, Caroline J. Rodier
CALIFORNIA PARTNERS FOR ADVANCED TRANSIT AND HIGHWAYS

EasyConnect:
Low-Speed Modes Linked to Public Transit Field Test Results
Final Report
Task Order 6113
Caroline J. Rodier, Ph.D. Senior Researcher, Transportation Sustainability Research Center
Institute of Transportation Studies University of California, Berkeley 1301 S. 46th Street, Building 190
Richmond, CA 94804 Ph/Fx: 510-665-3524/2183
Email: [email protected]
and
Susan A. Shaheen, Ph.D. Acting Co-Director, Transportation Sustainability Research Center
Institute of Transportation Studies University of California, Berkeley 1301 S. 46th Street, Building 190
Richmond, CA 94804 Ph/Fx: 510-665-3483/2183
Email: [email protected]
September 2008

ii
ACKNOWLEDGMENTS The authors would like to thank the California Department of Transportation, California PATH, Bay Area Rapid Transit (BART) District, Metropolitan Transportation Commission, Bay Area Air Quality Management District, Contra Costa Centre, Contra Costa County, Toyota Motor Company, General Motors Corporation, Air Products & Chemicals, Inc., Millennium Partners, Segway LLC, and Giant Bicycle for their generous contributions to the EasyConnect program. The Institute of Transportation Studies-Berkeley faculty, staff, and students also deserve special credit for their assistance with the EasyConnect project including: Timothy Lipman, Linda Novick, Denise Allen, Charlene Kemmerer, Adam Cohen, Joshua Seelig, Amanda Eaken, and Kamill Wipyewski. Thanks also go to Steven Grover, Bryce Nesbitt, and Herbert Diamant of eLock Technologies for their contributions to this project. This work was performed as part of the California PATH program of the University of California in cooperation with the State of California Business, Transportation, and Housing Agency; California Department of Transportation; the United States Department of Transportation; and Federal Highway Administration. The contents of this report reflect the views of the authors who are responsible for the facts and the accuracy of the data presented herein. The contents do not necessarily reflect the official views or policies of the State of California. This report does not constitute a standard, specification, or regulation.
iii

iv
TABLE OF CONTENTS Abstract ....................................................................................................................3 Executive Summary .................................................................................................4 Introduction ..............................................................................................................7 The Field Test ..........................................................................................................7 Background ............................................................................................................10 Evaluation Methods ...............................................................................................13 Evaluation Results .................................................................................................13 Conclusions ............................................................................................................28 References ..............................................................................................................32 Appendix A ............................................................................................................33 Appendix B ............................................................................................................34 Appendix C ............................................................................................................35
v

vi

ABSTRACT Access from public transit stations to employment and home locations can be a significant barrier to public transportation use in many urban regions, which is also commonly known as the “first and last mile” problem. The EasyConnect field test operated from August 2005 to December 2006 to introduce shared-use electric bicycles, non-motorized bicycles, and Segway® Human Transporters (HTs) to employment centers in and around the Pleasant Hill BART District stations. EasyConnect linked 36 employees of 14 companies at the Contra Costa Centre and Fresenius Medical. Contra Costa Centre took over the management of the EasyConnect program, which is now called “Green Fleet” and is operating an expanded and upgraded fleet of Segway HTs, electric bicycles, and bikes. Although the EasyConnect program was initially designed to bridge the barriers to access from public transit stations to employment locations, the results of the field test indicated higher participation demand by Day Users (e.g., lunch, business meetings, errands) rather than by commuters. This may have been a function of the institutional support available for the program in the area. The Contra Costa Centre, which is walking distance from the Pleasant Hill BART station, was able to provide significantly more support to the program relative to employers and business centers further away from the station. The availability of the low-speed modes for Day Use at the Contra Costa Centre, however, may have allowed for a higher level of public transit use and carpool commuting. Even without accounting for such mode shifts, the evaluation results indicate net benefits for both commute and Day Use program participants from reduced vehicle travel and increased physical activity. In the future, shared-use low speed mode programs, like EasyConnect, should continue to examine pedestrian concerns about the use of these modes on trails and sidewalks.
KEYWORDS Share-use modes, low-speed modes or devices, bicycle sharing, last mile, public transportation, intelligent transportation systems
vii

viii

EXECUTIVE SUMMARY Access from public transit stations to employment and home locations can be a significant barrier to public transportation use in many urban regions, which is also commonly known as the “first and last mile” problem. The 16-month EasyConnect field test was launched in August 2005 to introduce shared-use electric bicycles, non-motorized bicycles, and Segway® Human Transporters (HTs) to employment centers in and around the Pleasant Hill BART District stations. The goals of the field test were to test and evaluate the potential for a shared-use low-speed mode vehicle service at bridging the “last mile” from a public transit station to the workplace. The field test ended in December 2006. EasyConnect linked 36 employees of 14 companies at the Contra Costa Centre and Fresenius Medical. Contra Costa Centre took over the management of the EasyConnect program, which is now called “Green Fleet” and is operating an expanded and upgraded fleet of Segway HTs, electric bicycles, and bikes. The exploratory evaluation of the EasyConnect project included analysis of initial questionnaires and travel diaries to gain insight into participants’ socio-economic attributes and travel patterns. Program participant service use logs also were collected. Finally, intercept surveys of travelers on the Iron Horse and Canal Trails and in downtown Pleasant Hill were conducted to understand potential bystander concerns. The following are the key results of the initial evaluation of the EasyConnect field test:
• Most participants were men aged 30 to 39 who reported relatively high general health levels and exercised frequently by walking, gym work-outs, and biking.
• Participants’ transportation-related attitudes indicated they were concerned about air pollution from vehicle travel, willing to change their own travel behavior to improve air quality, and were dissatisfied with their current commute mode.
• Participants primarily commuted by driving alone (67 percent) prior to joining the program; however, a number also sometimes commuted by bicycle or motorcycle (47 percent).
• Workplace parking availability and cost did not appear to be a significant problem for the majority of participants.
• Many participants made personal trips relatively frequently on weekdays, but fewer made business trips; most of the personal and business trips were made by a private vehicle with an average distance of 2.5 miles, which is within the range of the low-speed modes.
• Most participants joined the program to try new transportation modes and avoid driving during lunch or to run errands.
• Only six of the participants from one company planned to regularly use the program for commuting; the remaining participants worked very close to the Pleasant Hill BART station at the Contra Costa Centre and thus planned to use the program largely for Day Use (e.g., lunch, business meetings, errands).
ix

For commute travel the analysis of participants’ use patterns yielded a number of interesting findings:
• The electric bicycle had the highest low-speed mode share (68 percent) relative to the bicycle (20 percent) and Segway HT (12 percent) modes.
• Most participants used the program weekly; had a one-way commute trip distance of one-half to five miles; and would have commuted by car or bicycle if the EasyConnect low-speed modes were not available to them, indicating a likely net reduction in vehicle travel and health benefits among participants.
• The electric bicycle’s speed and range are greater than that of the bicycle and Segway HT and thus appear to be used more frequently for longer commute trips.
For Day Use travel the analysis of participants’ use patterns also yielded a number of results:
• The Segway HT had the highest low-speed mode share (52 percent) relative to the electric bicycle (36 percent) and bicycle (12 percent) modes.
• For shorter average distance Day Use trips, the Segway HTs had the highest use. • Lunch was the most frequent purpose of travel (42 percent), followed by personal
business, then by work-related business (17 percent), and finally for exercise and fun (6 percent).
• Seventy percent used the program with some regularity (at least once a month and at most four days a week), and thirty percent did not (less than once a month).
• Sixty-three percent of these trips would have been made by car, 19 percent by walking, 17 percent would not have made the trip, and one percent would have made the trip by bicycle.
• The mean trip distance for those trips that would have been made by car was 2.6 miles and by walking/biking was 1.4 miles, indicating a likely net reduction in vehicle travel among participants.
• Twelve percent of trips resulted in an increase in bicycle travel, and 36 percent resulted in an increase in electric bicycle travel, indicating an overall health benefit for participants.
Participants in the EasyConnect field test were allowed to travel on the Iron Horse and Canal Trails and in downtown Pleasant Hill. When the Segway HTs were first made available to the public there was significant debate about allowing this low-speed mode to share the sidewalks with pedestrians. As a result, a survey was conducted with individuals traveling on the Iron Horse Trail and in downtown Pleasant Hill to explore their attitudes towards low-speed modes. The survey results pointed to some key findings:
• About 20 percent indicated that they would stop using the trail or use it less if the Segway HT and the electric bicycle were commonly used on the trail, and about 70 percent indicated that this would have no effect on their use of the trail.
• The top concerns were accidents, the fast speed and quiet operation of low-speed modes, and improper use; however, many did appreciate the potential for these devices to reduce air pollution and reliance on petroleum-based fuels.
• Respondents indicated that Segway HT and electric bicycle users should be required to follow the same rules as bicycles (25 percent), slow down when approaching a pedestrian
x
xi
(20 percent), use a noise device or callout when approaching pedestrians (18 percent), and take training courses (10 to 15 percent).
• Many respondents indicated that special lanes should be provided for the Segway HTs (30 to 32 percent), and some also responded that these modes should be allowed on the trails (22 to 23 percent), streets (15 to 18 percents), and sidewalks (14 to 15 percent).
Although the EasyConnect program was initially designed to bridge the barriers to access from public transit stations to employment locations or the “first and last mile” problem, the results of the field test indicated higher participation demand by Day Users rather than by commuters. This may have been a function of the institutional support available for the program in the area. The Contra Costa Centre, which is walking distance from the Pleasant Hill BART station, was able to provide significantly more support to the program relative to employers and business centers further away from the station. The availability of the low-speed modes for Day Use at the Contra Costa Centre, however, may have allowed for a higher level of public transit use and carpool commuting. Even without accounting for such mode shifts, the results of the evaluation indicate net benefits for both commute and Day Use program participants from reduced vehicle travel and increased physical activity. In the future, shared-use low speed mode programs like EasyConnect should continue to examine pedestrian concerns about the use of these modes on trails and sidewalks.


1.0 INTRODUCTION Access from transit stations to employment and home locations can be a significant barrier to public transit use in many urban regions, which is also commonly known as the “first and last mile” problem. Most people are only willing to walk about a quarter of a mile from transit stations to their destination. Bus feeder services can increase access, but fixed routes and schedules significantly limit their appeal. An effective demand-responsive, easy-to-use system that links home, work, and other activity destinations with public transit stations may encourage greater use of transit and reduce both vehicle travel and emissions. The EasyConnect field test was launched in August 2005 to introduce shared-use electric bicycles, non-motorized bicycles, and Segway® Human Transporters (Segway HTs) (collectively known as the “low-speed modes”) at the Pleasant Hill Bay Area Rapid Transit (BART) District station. The goals of the field test were to test and evaluate the potential for a shared-use low-speed modes service to bridge the “last mile” from a transit station to the workplace. EasyConnect enabled businesses within a four-mile radius of the Pleasant Hill BART station to access shared-use bicycles, electric bicycles, and Segway HTs for their employees to use for commute and daytime travel (or what we call “Day Use”). Instead of driving all the way to work, participants were able to take transit and carpool and thus potentially reduce fuel use, emissions, congestion, and demand for the limited parking in the area. Each morning, employees could check out a bicycle or Segway HT from an electronic locker at the Pleasant Hill BART station and then ride to work along the scenic Iron Horse and Canals Trails, for instance. Units were also available for use from nearby offices as well for off-site meetings, errands, or lunch appointments. At the end of the day, employees could ride the bicycles or Segway HTs back to the station, where they were stored and recharged in electronic lockers. This field test was the result of a partnership among the University of California, Berkeley; the California Department of Transportation; the San Francisco BART District; the Metropolitan Transportation Commission; the Bay Area Quality Management District; the Contra Costa Centre; Contra Costa County; 511 Contra Costa; Segway, Inc.; and Giant Bicycles. This report begins with a description of the field test and it operation, as well as background on similar programs internationally. Next, the methods of evaluation are described and followed by a discussion of the evaluation results. Finally, major findings are summarized in the conclusion. 2.0 FIELD TEST August 2005 marked the debut of the EasyConnect field test, which provided shared-use electric bicycles, non-motorized bicycles, and Segway HTs to employment centers in and around the Pleasant Hill BART station. See Figure 1 below for a photograph of the existing Pleasant Hill BART station. The field test ended in December 2006, 16 months later. Contra Costa Centre took over the management of the EasyConnect program, which is now called “Green Fleet” and is operating an expanded and upgraded fleet of Segway HTs, electric bicycles, and bikes. For more information, see: www.contracostacentre.com/com_pro5.html).
1

FIGURE 1 Current site conditions, Pleasant Hill BART station. EasyConnect linked employees of Contra Costa Centre-based ABD Insurance, Avandae, Bank of the West, Great American Insurance Company, Kforce, Moody’s Investor Services, Reply, CB Richard Ellis, Central Garden, MWH, WildPackets, Vodafone, WWAL, and Insco Dico, as well as Fresenius Medical. The low-speed vehicles were stored nightly at the Pleasant Hill BART station in electronic lockers. Commuters were able to ride the units from the BART station to their offices in surrounding employment centers in the morning and back to the station at the end of the day (“Commuter Use”). The devices also were used to run personal and business errands during the day (Day Use). Some units were located directly at employment locations at the Contra Costa Centre to provide Day Use options to encourage commuting by vanpool or carpools. The field test included 36 active members. There is an extensive paved trail network in the Pleasant Hill BART area. The East Bay Parks District granted permission to the research project to use the low-speed modes on the Iron Horse and Canal Trails. Access to the trails greatly enhanced the BART, employment, and shopping connections for the field test. See Figure 2 of rider on a bicycle trail in Pleasant Hill.
2

FIGURE 2 Bicycle rider in Pleasant Hill. 2.1 Attributes of the Segway HT and Electric Bicycles The maximum distance for the electric bicycles (the Giant Lite model) on one charge is 28 miles. The maximum distance for the Segway HT for a single charge is four miles under strenuous conditions (i.e., start-up driving and use on inclines and uneven terrain), eight miles under good conditions, and 12 miles under test conditions. It takes approximately four hours to charge The Giant Lite, which uses a nickel metal hydride battery, with a life of 500 charges. It can take four to six hours to charge the Segway HT batteries, which are either lithium or nickel. Segway HTs, which weigh 83 to 95 pounds, have three different keys that control top speed: six miles per hour (black), eight miles per hour (yellow), and 12.5 miles per hour (red). The EasyConnect field test only allowed the two lower speed keys. Segway HTs can go up and down hills with gradients as steep as 36 percent and turn with a curve radii as low as 15 feet. Its stopping distance is 18 feet. The electric bicycle’s top assisted speed is 17 miles per hour. It weights 45 pounds with its battery, which weighs seven pounds. Its hill climbing ability tops at a six percent slope. 2.2 Safety Safety concerns about the interaction of the low-speed modes and pedestrians during the initial phase of the project prompted a literature review. The results of a literature review conducted as part of an initial report for this project indicated that the risk of crashing on low-speed devices (bicycles, scooters, skates, and skateboards) is relatively small (less than three percent across all low-speed devices per 10,000 days of use) (Rodier et al., 2004). The crashes that do occur are most frequently the result of poor surface conditions, user error, obscured driver vision, and the design of the low-speed mode (Rodier et al., 2004). Many of these risk factors were minimized in the field test by careful selection of routes (in consultation with local police and planners), by required participant training, and by requiring participants to use safety equipment (Rodier et al., 2004).
3
3.0 BACKGROUND 3.1 Segway HT Shared-Use Programs Shared-use Segway HT programs have been used by many public and private organizations in the U.S. including, for example, postal delivery, meter reading, national park supervision, police and security services, warehouse and factory mobility, and tourism rentals. One other city-based program that explicitly links Segway HTs to transit stations and transit use is the “Oxygen Network” in Lille, France. An “Oxygen Station” and “Oxygen Boutique,” operated by a private company and funded by government subsidies, allow individuals to rent any of the 16 Segways HTs and 25 electric bicycles available in intervals ranging from one half-hour to monthly. Discounts are given to those who use public transportation. The Oxygen Boutique is conveniently located at a railway station, while the Oxygen Station resides near a parking lot, increasing the likelihood that the devices will be used to finish the final leg of trips. 3.2 Bicycle Sharing Programs According to DeMaio (2001) and DeMaio and Gifford (2004), community bicycle sharing system have evolved over three generations during the last 35 years. In 1968, the first generation began in Amsterdam, The Netherlands, with the “White Bicycle” program; however, this program lasted only a few days because of bicycle thefts. More than ten years later, in Milan, Italy, another bicycle sharing program was launched (1,000 bicycles), but this program also failed due to unreturned bicycles. Bicycle sharing programs also had a presence in the U.S. in the early 1990s, for example, in Portland, Oregon; Minneapolis/St. Paul, Minnesota; Boulder, Colorado; and Princeton, New Jersey. However, most of these programs are no longer in operation. (DeMaio, 2001; DeMaio and Gifford, 2004). The key characteristics of these first generation bicycle sharing programs are described by DeMaio (2001):
1. Donated mass-market bicycles painted one color; 2. No specific location to return bicycles; 3. Free to users; and 4. Administered by community group sometimes with financial help from local
government. (p. 2) The advantage of these programs was that they were inexpensive to run due to donated materials and labor. However, drawbacks included unreliable service due to the absence of fixed parking locations as well as the lack of a security system that resulted in thefts and program closures (DeMaio, 2001). The second generation was launched in 1995, in Copenhagen, Denmark, with a program named Bycklen. The program provided 2,000 bicycles (1 bicycle per 400 citizens) and 110 stations (DeMaio, 2001; DeMaio and Gifford, 2004). The key characteristics of the second generation programs included:
4

1. Bicycles specially designed, i.e., utilitarian and less maintenance; 2. Racks strategically located with displays in high density neighborhoods and central
business districts; 3. Coin deposits to check out bicycles with deposits due upon the return of the bicycles; and 4. Administered by a non-profit organization, sometimes with financial help from local
government and through advertising on wheels and displays. (p. 3) The second generation programs tended to be more expensive than the first generation programs because of specially designed bicycles and racks. The fixed rack locations made these programs more reliable. However, theft continued to be a major problem because the coin deposit did not prove to be a strong enough deterrent, and there was no mechanism to track the bicycles (DeMaio, 2001). The third generation, or “smart bicycle sharing,” was largely initiated in the early 2000s used technology to address the theft problems that plagued the first two generations. The leading programs are described in Table 1 below. The third generation programs have “electronic locking racks or bicycle locks, telecommunications systems, and smartcards or magnetic stripe cards to identify customer and improve tracking.” (DeMaio and Gifford, 2004, p. 3). Moreover, “customers who do not return the bicycle within the allotted time are required to pay for replacement costs” (DeMaio and Gifford, 2004, p. 3). In general, these programs are relatively expensive because of their advanced technology and specially designed equipment, but they are more reliable and secure because of fixed rack locations and tracking technology. These programs are typically run by advertising companies for local governments (DeMaio, 2001; DeMaio and Gifford, 2004). Similar programs are in the planning stages throughout the U.S. in cities such as New York City, Seattle, and San Francisco. One program launched in Washington, D.C. in August 2008. Internationally, advanced bicycled sharing programs are planned to launch in Beijing for the 2008 Olympics, London, Seoul, and Cordoba and Seville in Spain. The only empirical studies of third generation programs are the user survey evaluations of 1) the pilot OYBike program in London by Noland and Ishaque (2006) and 2) the Vélib program in Paris by TNS Sofres (2008). It is important to note that results are dependent on the qualities of the service location. In London, Noland and Isahque (2006) found that users most frequently used the service rather than taking public transit and walking and less frequently rather than driving. Some also used the service to make trips that would not be possible without it. OYBike also was used as access and egress public transportation. It also was found that some used OYBike for commuting (11 percent) but many more for social and recreational trips (68 percent). The authors predict that this is likely to be the largest market for future use. TNS Sofres (2008) found that 61 percent of long-term Vélib members use the program to go to work or school. In addition, 84 percent of users ride the bicycles to complement their use of public transportation and 20 percent drive their personal automobiles less often.
5

6
TABLE 1 Examples of third generation bicycle sharing programs. PROGRAM (LAUNCH DATE)
SIZE COST PAYMENT/RESERVATION TECHNOLOGY
OPERATING COMPANY
Velib Paris, France (2007)
20,600 bicycles and 1,450 stations (every 330yds); 135 citizens/bicycle, 190,000 subscribers,
First ½ hour free; additional ½ hour paid; one-day, weekly & annual cards available
Smart card payment and reservation technology
JC Decaux
Bicing in Barcelona, Spain (2007); similar program, Nbici, in Pamplona
1500 bicycles and 100 stations; 1000 citizens/bicycle; attracted at least 62,000 registered users; expand to 3,000 bicycles by 2007
First ½ hour free; additional ½ hours; annual subscription
Smart card and optional credit card payment technology
Clear Channel Adshel
Storstockholms Lokaltrafik in Stockholm, Sweden (2006)
100 bicycles and 80 stations; 80 citizens/bicycle; complement to congestion pricing program
Daily and seasonal passes; initial check out free but penalties after three hour maximum rental time
Smart card payment Clear Channel Adshel
Velo’v in Lyon, France (2005)
1500 bicycles & 350 stations First ½ hour free; additional ½ hours paid
Smart card payment JC Decaux
OYBike in London Borough of Hammersmith and Fulham, England (2004)
25 locking stations with 70 bicycles
First ½ hour free; additional ½ hour paid; 1-day, weekly, & annual cards available
Mobile phone technology Public Agency
Call-a-Bike in Frankfurt (2003), Cologne and Munich, Germany
In Frankfurt: 720 bicycles, 66 stations, 900 citizens/bicycle; recently opened in two additional German cities
First ½ hour free; additional ½ hour paid; one-day, weekly, and annual cards available
Mobile phone technology Die Bahn, national transportation agency
Source: http://www.nybikeshare.org

4.0 Evaluation Methods An exploratory analysis of participants’ use of the EasyConnect project was conducted as part of the field test. Thirty-six in-take questionnaires and travel diaries were completed by individuals who attended the field test training class. These instruments were implemented from June 2005 to November 2006. The objective of the questionnaire and travel diary was to gain a preliminary understanding of participants’ socio-economic attributes and their travel patterns, and thus the potential travel effects of the program. In addition, researchers collected daily use logs to represent typical weekly program use by participants. Logs from 29 participants were collected, and the field test manager reviewed the results. Finally, to understand potential concerns about sharing trails and sidewalks with the low-speed modes, researchers conducted intercept surveys on the Iron Horse and Canal Trails as well as in downtown Pleasant Hill during October and November 2006. See Appendices A to C. 5.0 EVALUATION RESULTS 5.1 Demographic Attributes The initial questionnaires explored the demographic attributes of EasyConnect participants. As presented in Table 2, participants were more likely to be male (77 percent) than female (23 percent). Most fell within the 30 to 39 age category (40 percent); however, the distribution ranged from the 19 to 23 years of age (6 percent) to 50 to 59 (17 percent). Given the median age category, not surprisingly, participants most typically belonged to a household with a partner and children (40 percent). On average, participant households included 1.8 commuters, two drivers, and 2.5 vehicles. These households also were likely to have a gross income over $110,000 (62.5 percent), and over 90 percent of participants had attained a college degree or higher. A high number of participants indicated recent Internet and mobile phone use.
7

TABLE 2 Demographic Attributes of Participants ATTRIBUTES DISTRIBUTION
OR MEAN Gender N=35 Male 77.1%Female 22.9%Age N=35 19 to 23 5.7%24 to 29 11.4%30 to 39 40.0%40 to 49 25.7%50 to 59 17.1%Household Members N=35 Self only 20.0%Self and partner 28.6%Self, partner, and child(ren) 40.0%Self and child(ren) 8.6%Self and roommate(s) 2.9%Household Commuters N=35 Mean 1.8Household Drivers N=35Mean 2.0Household Vehicles N=35Mean 2.5Household Income N=32 $10,000 to $49,999 9.4%$50,000 to $79,999 15.6%$80,000 to $109,999 12.5%More than $110,000 62.5%Highest Level of Education N=35 High/Trade School 8.6%College 65.7%Graduate/Professional School 25.7%Technology within Last Week N=36 Internet at work and home 94.4%Mobile phone 88.9%PDA 36.1%Percentages may not add up to one hundred because of rounding error and multiple responses allowed.
8

5.2 Health As shown in Table 3 below, more than 90 percent of participants in the EasyConnect project described their health as good to excellent, and most indicated that it was very good (40 percent). Over 50 percent of participants exercised three or more times a week, and the most popular methods of exercise include walking, gym workouts, and biking. TABLE 3 Health Attributes of Participants ATTRIBUTES DISTRIBUTIONGeneral Health Rating N=35 Poor 2.9%Fair 5.7%Good 31.4%Very good 40.0%Excellent 20.0%Average Weekly Frequency of Physical Exercise
N=35
None 2.9%1 to 2 times 37.1%3 to 4 times 42.9%5 or more times 17.1%Top Five Primary Modes of Physical Activity N=34 Walking 41.2%Gym workouts 26.5%Jogging/running 8.8%Other (work, squash) 8.8%Aerobics/dance class/spin class 5.9%Top Six Secondary Modes of Physical Activity N=34 Biking 23.5%Other (work, squash) 17.6%Walking 11.8%Aerobics/dance class/spin class 8.8%Gym workouts 8.8%Jogging/running 8.8%Percentages may not add up to one hundred, as not all participants noted physical activity in the top five primary or six secondary modes of activity. 5.3 Transportation-Related Attitudes As part of the initial survey, participants were asked a range of questions that explored transportation-related attitudes. See Table 4 below. Interestingly, the participants in this project indicated a relatively high level of concern about transportation-related air pollution and a willingness to change their travel behavior to reduce air pollution. However, many indicated a low level of comfort traveling by transit. Participants also were likely to agree that they were satisfied with their current commute mode, their commute mode provided freedom of movement,
9

and was too expensive. On average, participants did not agree that they were adventurous or seek new experiences. TABLE 4 Participants’ Transportation-Related Attitudes ATTITUDES SCOREConcerned about transportation-related pollution 1.1Willing to change travel behavior to reduce pollution 1.1Satisfied with current commute mode 0.9Commute mode provides freedom of movement 0.8Commute mode is too expensive 0.6Adventurous or seeks new experiences 0.6Auto ownership is a hassle 0.5Comfortable using transit 0.2Score: Average of -2 to +2 for answers that ranged from strongly disagree, disagree, neutral, agree, strongly agree. 5.4 Travel Patterns 5.4.1 Commute Travel Most participants’ households were located in cities in the East San Francisco Bay Area, specifically in Walnut Creek, Pleasant Hill, Concord, Danville, and Lafayette. These participants, as shown in Table 5, commuted typically by their primary travel mode five or more days a week (65.7 percent), some of them three to four days a week (28.6 percent), and fewer participants only one to two days a week (5.7 percent). The primary commute mode, as presented in Table 6, was most likely to be drive alone (66.7 percent) with a mean travel time of 18.7 minutes and 11.29 miles or BART (19.4) with a mean travel time of 34 minutes and distance of 20.4 miles. Among those reporting use of a secondary commute mode, almost 80 percent used it one day or less a week. The secondary commute mode was most likely to be bicycle (35.3 percent), with a mean travel time of 24.2 minutes and distance of three miles or driving alone (23.5 percent), with a mean travel time of 27.8 minutes and distance of 16.8 miles. TABLE 5 Frequency of Use: Primary and Secondary Commute Mode FREQUENCY DISTRIBUTION Primary Distribution N=35 1 to 2 days 5.7%3 to 4 days 28.6%5 or more days 65.7%Secondary Distribution N=18 Less than 1 day a week 33.3%1 to 3 days a week 33.3%1 day a week 11.1%2 days a week 16.7%3 or more days a week 5.6%
10

TABLE 6 Primary and Secondary Commute Mode Share and Mean Travel Time and Distance (One Way) PRIMARY COMMUTE (N=36) MODE
SHARE MEAN TIME (MINUTES)
MEAN DISTANCE (MILES)
Drive Alone 66.7% 18.7 11.3BART 19.4% 34.3 20.4Walk 5.6% 6.0 0.18Carpool 5.6% 30.0 22.3Bus 2.8% 40.0 2.50SECONDARY COMMUTE (N=17) MODE
SHARE MEAN TIME (MINUTES)
MEAN DISTANCE (MILES)
Bicycle 35.3% 24.2 3.1Drive Alone 23.5% 27.7 16.8BART 17.7% 31.2 21.0Walk 11.8% 25.0 2.8Other (motorcycle, telecommute) 11.8% 25.0 17.0Bus 5.9% 20.0 3.5Percentages may not add up to one hundred because of rounding error. In Table 7 below, the daily commute results from the three-day travel diary are presented. These results are relatively consistent with those reported in Table 6, which represent participants reported typical commute travel. Most participants commuted by driving alone (67.2 percent) or by BART (20.9 percent), but fewer commuted by motorcycle (six percent), carpool (three percent), bicycle (1.5 percent), or walking (1.5 percent). The average commute travel distance was shorter for the drive alone mode (5.9 miles) relative to motorcycle (30.4 miles), BART (20.2 miles), and carpool (17.6) modes. TABLE 7 Daily Commute from Travel Diary: Trips, Mode Share, and Average and Total Distance (One Way) DAILY TRAVEL (N=36) DRIVE
ALONEBART MOTOR-
CYCLE CARPOOL BICYCLE WALK
Total Trips 45 14 4 2 1 1
Mode Share 67.2% 20.9% 6.0% 3.0% 1.5% 1.5%
Average Distance (miles) 5.9 20.2 30.4 17.6 5.0 0.5Total Distance (miles) 451.3 282.1 60.8 35.2 10.0 1.0Percentages may not add up to one hundred because of rounding error. 5.4.2 Parking at Work As indicated in Table 8, most participants were provided free workplace parking by employers (84 percent), and most drove and parked at work regularly (more than 50 percent). Among those few participants who paid for parking, the mean daily cost was 8.4 dollars. In general, participants indicated that their workplace parking was easy to find and only a short walking distance from their office. Only about 15 percent indicated that if they left their parking space
11

during the work day, then it would be somewhat or very difficult to find parking upon their return. TABLE 8 Attributes of Workplace Parking ATTRIBUTES DISTRIBUTIONFrequency of Driving and Parking at Work N=36 Never 11.1%Less than 1 day a month 8.3%1 to 3 days a week 13.9%1 to 3 days a month 11.1%4 to 5 days a week 38.9%More than 5 days a week 16.7%Type of Workplace Parking N=31 Free parking provided by my employer 83.9%Free parking not provided by my employer 9.7%Paid parking not provided by my employer 6.5%Parking Cost N=4 Mean dollars 8.4Finding Parking at Work N=32 0 to 5 minutes 93.8%6 to 10 minutes 6.3%Walking from Parking to Workplace N=32 0 to 5 minutes 96.9%6 to 10 minutes 3.1%If leave parking before 5:00 pm, how difficult to find a space when returning?
N=32
Not difficult 84.4%Somewhat difficult 12.5%Very difficult 3.1%
Percentages may not add up to one hundred because of rounding error. 5.4.3 Workday Travel As presented in Table 9, about 53 percent of participants made personal trips during the workday three or more days a week, and 47 percent made personal trips two or fewer days per week. Business trips during the workday were made less frequently than personal trips; 95 percent made these trips two or fewer days per week. The average one-way travel time of personal trips was 14.5 minutes and of business trips was 24.9 minutes. Business trips and personal trips were made most frequently by driving in the participant’s vehicles (59.4 percent for business and 39.2 percent for personal). Walking and carpooling also were used frequently for personal trips (24.3 and 21.6 percent, respectively).
12

TABLE 9 Attributes of Personal and Business Trips Made by Participants During The Workday ATTRIBUTES BUSINESS PERSONAL Frequency (weekly) N=23 N=35 Less than 1 day 47.8% 22.2% 1 to 2 days 47.8% 25.0% 3 to 4 days 4.3% 27.8% 5 or more days 0.0% 25.0% One-Way Travel Time N=18 N=33 Mean minutes 24.9 14.5 Modes N=23 N=35 My Vehicle 59.4% 39.2% Public Transit 15.6% 5.4% Friend/Coworker/Carpool Partner's Vehicle 9.4% 21.6%
Company Vehicle 6.3% 0% Walking 6.3% 24.3% Bicycle 3.1% 4.1% Taxi 0% 1.4% Other (running, razor scooter) 0% 4.1% Percentages may not add up to one hundred because of rounding error. In Table 10 below, the daily commute results from the travel diary are presented. These results are relatively consistent with those reported in Table 9. Most participants traveled to their personal or business activity by driving alone (62.2 percent) and fewer traveled by walking (20 percent) and by carpool (17.8 percent). The average travel distance was longer for the drive alone mode (2.5 miles) and carpool mode (1.8 miles) relative the bicycle mode (0.6 miles). TABLE 10 Daily Work-Based Personal and Business Trips Travel Diary: Trips, Mode Share, Average and Total Distance (One Way) DRIVE ALONE CARPOOL WALKTotal Trips 28 8 9Mode Share 62.2% 17.8% 20.0%Average Distance (miles) 2.5 1.8 0.6Total Distance (miles) 70.89 14.7 5.7 5.5 EasyConnect: Attitudes and Expected Use Participants were asked about their motivations for joining and their concerns about the EasyConnect field test. The results are presented in Table 11. The top motivations for joining EasyConnect included access to the Segway HT (28.6 percent), interest in exploring new methods of transportation (25.7 percent), not driving during lunch to run errands (20 percent), improving the environment (11.4 percent), and saving money on gas (11.4 percent). Participants indicated some concern about the safety of Segways HT during adverse weather conditions (26.7 percent) and difficulty obtaining a low-speed mode when they wanted it (20 percent). Most
13

participants anticipated using the program for personal and business trips during the day and fewer for commute trips, as described in Table 12. TABLE 11 Participants’ Motivations for and Concerns about Joining MOTIVATIONS PERCENT (N=35) Access to Segway HTs 28.6%Interesting/explore new methods of transportation 25.7%Not driving during lunch to run errands 20.0%Environmental 11.4%Save money/gas 11.4%Efficiency 8.6%Access to bicycle 5.7%Access to electric bicycle 2.9%Less driving 2.9%Exercise 2.9%CONCERNS PERCENT (N=15) Safety on Segway HTs/ poor weather 26.7%Limited availability 20.0%Too time consuming 13.3%Funding/maintenance costs 13.3%Not convenient 6.7%Commuting with others difficult on a Segway HT 6.7%Program will end 6.7%Acceptance 6.7%Note that the survey allowed more than one response. TABLE 12 Anticipated Frequency of Use
FREQUENCY COMMUTER:BART TO
WORKPLACE (N=34) DAY-USER: PERSONAL/WORK
BUSINESS (N=36) Never 64.7% 2.8% Less than 1 day a month 5.9% 8.3% 1 to 3 days a month 8.8% 27.8% 1 to 2 days a week 8.8% 41.7% 3 to 4 days a month 11.8% 19.4%
5.5 EasyConnect Use Patterns During the operation of the program, participants were asked to complete travel logs that documented their use of the available low-speed modes. Figure 3 below indicates the share of trips made by the low-speed modes for commute trips. Only six of the program participants, from one company, regularly used the program for commuting. The remaining participants worked very close to the Pleasant Hill BART station at the Contra Costa Centre. The electric bicycle had the highest low-speed mode share (68 percent) relative to the bicycle (20 percent) and Segway HT (12 percent) modes. The electric bicycle’s speed and range are greater to that of the bicycle and Segway HT and appeared to attract ,more use for commute trips. The maximum
14
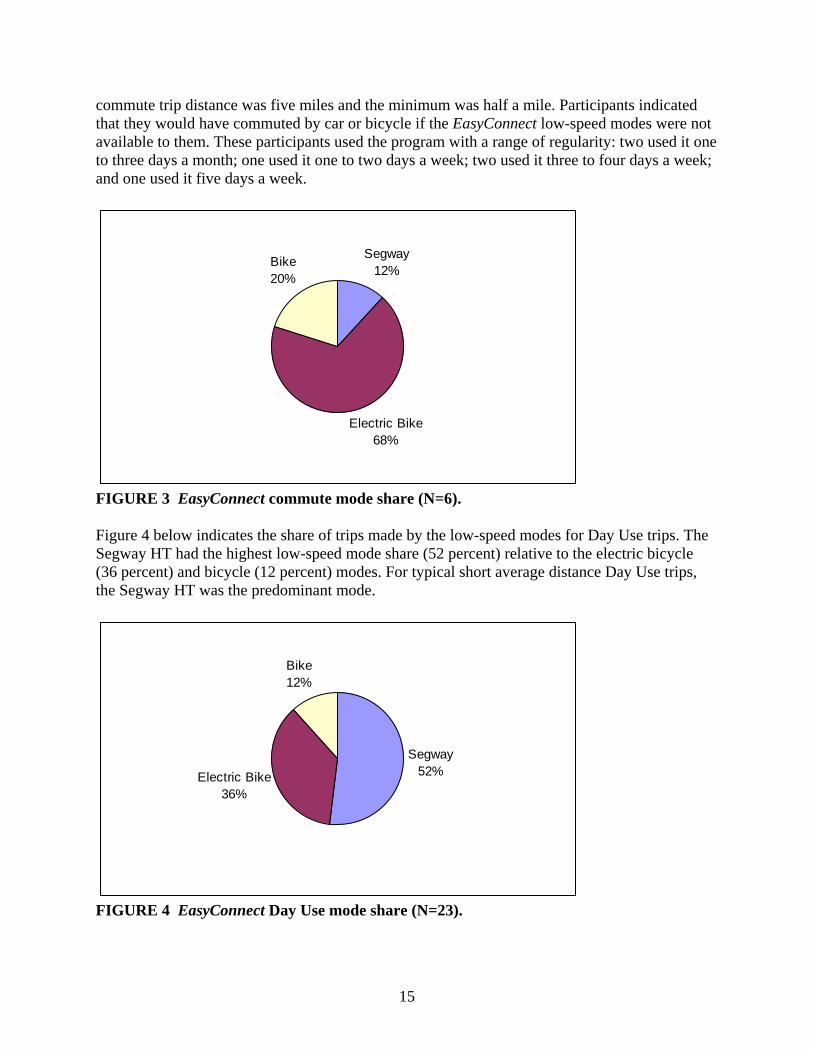
commute trip distance was five miles and the minimum was half a mile. Participants indicated that they would have commuted by car or bicycle if the EasyConnect low-speed modes were not available to them. These participants used the program with a range of regularity: two used it one to three days a month; one used it one to two days a week; two used it three to four days a week; and one used it five days a week.
Segway12%
Electric Bike68%
Bike20%
FIGURE 3 EasyConnect commute mode share (N=6). Figure 4 below indicates the share of trips made by the low-speed modes for Day Use trips. The Segway HT had the highest low-speed mode share (52 percent) relative to the electric bicycle (36 percent) and bicycle (12 percent) modes. For typical short average distance Day Use trips, the Segway HT was the predominant mode.
Segway52%Electric Bike
36%
Bike12%
FIGURE 4 EasyConnect Day Use mode share (N=23).
15

Figure 5 below illustrates participants’ purposes for traveling by the EasyConnect modes. Lunch was the most frequent travel purpose (42 percent), followed by personal business, then by work-related business (17 percent), and finally for exercise and fun (6 percent).
lunch42%
personal35%
work related 17%
exercise/fun6%
FIGURE 5 Purpose of travel for EasyConnect Day Use (N=23). Frequency of use as estimated from the daily travel logs is presented in Table 13 below. Sixty-eight percent used the program with some regularity (at least once a month and at most four days a week), and thirty percent did not (less than once a month). The mean frequency of use was one day per week. TABLE 13 Frequency of Day Use Travel with EasyConnect (N=23) FREQUENCY PERCENT 3 to 4 days per week 21%1 to 2 days a week 17%1 to 3 days a month 30%Less than once a month 30%Percentages may not add up to one hundred because of rounding error. Figure 6 below indicates the modes participants would have used if EasyConnect modes were not available to them. Sixty-three percent of these trips would have been made by car, 19 percent by walking, 17 would not have made the trip, and one percent would have made the trip by bicycle. The mean trip distance for those trips that would have been made by car was 2.6 miles and by walking/biking was 1.4 miles.
16

Car63%
Walk19%
No Trip17%
Bike1%
FIGURE 6 Modes used for Day Use without EasyConnect (N=23). 5.6 Results of EasyConnect Bystander Surveys Participants in the EasyConnect program were allowed to travel on the Iron-Horse and Canal Trails and in downtown Pleasant Hill. When the Segway HTs were first made available to the public there was significant debate about allowing this low-speed mode to share the sidewalks with pedestrians. As a result, a survey was conducted with individuals traveling on the Iron-Horse Trail and in downtown Pleasant Hill to explore their attitudes towards low-speed modes. The demographic characteristics of survey respondents are documented in Table 14. Respondents were somewhat more likely to be men than women (55 and 45 percent, respectively). Most respondents were also between the ages of 40 to 69. Respondents also were most likely to have a bachelor’s degree or higher.
17

TABLE 14 Demographic Attributes of Bystanders ATTRIBUTES DISTRIBUTION Gender N=109 Male 55.1%Female 44.9%Age N=106 up to 18 years old 1.0%24 – 29 7.6%30 – 39 12.3%40 – 49 24.5%50 – 59 24.5%60 – 69 22.6%70 – 79 5.7%80 years or older 0.9%Decline to respond 0.9%Highest Level of Education N=103 High school 8.7%Trade school/Associate degree 12.6%Bachelor's degree 35.9%Graduate/Professional degree 41.8%Other 1.0% Respondents reported use of the trail is presented in Table 15. Over 50 percent used the trail four or more times a week. Most walked on the trail (48 percent) or rode a bicycle (38 percent) and fewer jogged or ran (13 percent) for recreation or exercise (approximately 75 percent).
18

TABLE 15 Bystanders’ Trail Use ATTRIBUTE DISTRIBUTION Frequency of Travel N=110 Less than once a month 4.6%1 to 3 days a month 5.5%1 to 3 days a week 35.5%4 or more days a week 54.6%Travel Mode N=104 Walk 48.1%Jog/run 13.5%Ride a bicycle 38.5% Purpose N=110 To commute to work 6.6%To commute to school 2.2%For exercise 49.2%To go shopping 8.8%For recreation 24.9%Other 8.3%Percentages may not add up to one hundred because of rounding error. Respondents’ previous experiences of the Segway HT and electric bicycles also were explored in the survey, and the results are documented in Table 16. Most respondents indicated that they had seen the Segway HT and the electric bicycle (78 and 65 percent, respectively) infrequently on the Iron Horse and Canal Trails, in downtown Pleasant Hill, and/or in the media. However, the electric bicycle was more likely to been seen on the Iron Horse and Canal Trails than in downtown Pleasant Hill and in the media. The opposite was true for the Segway HT. Few respondents reported seeing or experiencing a conflict with the Segway HT (3.3 percent) and electric bicycle (2.4 percent). About 20 percent indicated that they would stop using the trail or use it less if the Segway HT and the electric bicycle were commonly used on the trail, and about 70 percent indicated that this would have not effect on their use of the trail.
19
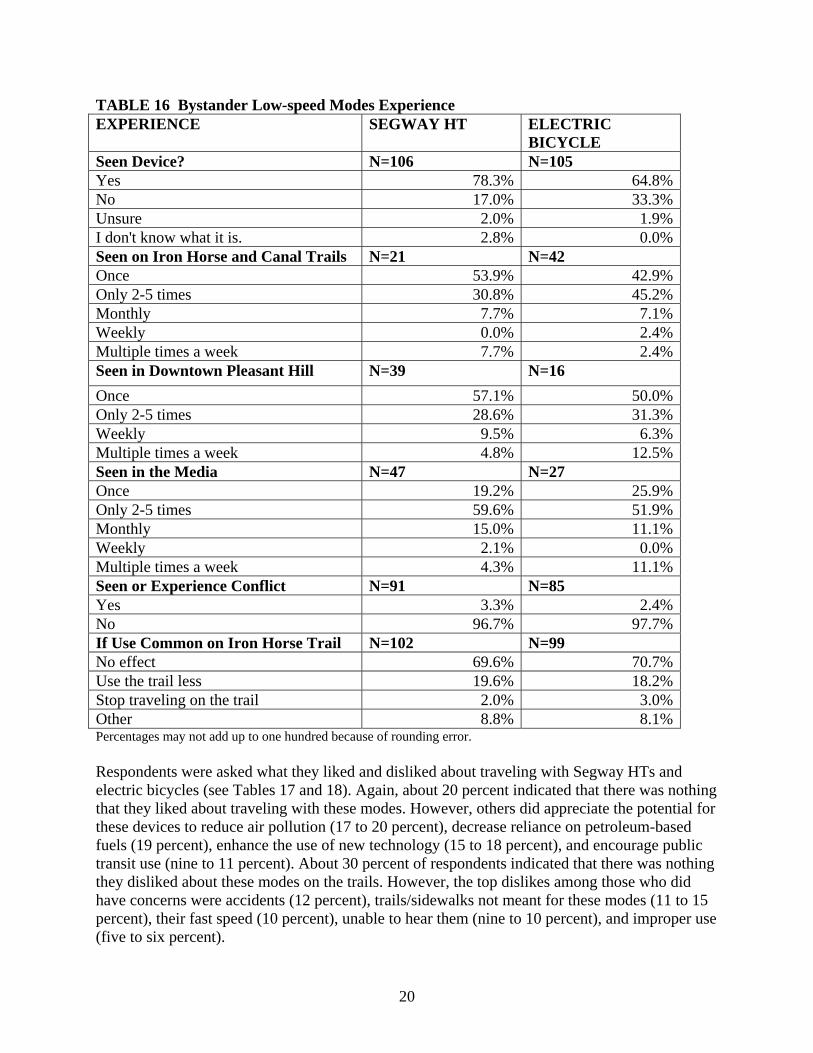
TABLE 16 Bystander Low-speed Modes Experience EXPERIENCE SEGWAY HT ELECTRIC
BICYCLE Seen Device? N=106 N=105 Yes 78.3% 64.8%No 17.0% 33.3%Unsure 2.0% 1.9%I don't know what it is. 2.8% 0.0%Seen on Iron Horse and Canal Trails N=21 N=42 Once 53.9% 42.9%Only 2-5 times 30.8% 45.2%Monthly 7.7% 7.1%Weekly 0.0% 2.4%Multiple times a week 7.7% 2.4%Seen in Downtown Pleasant Hill N=39 N=16 Once 57.1% 50.0%Only 2-5 times 28.6% 31.3%Weekly 9.5% 6.3%Multiple times a week 4.8% 12.5%Seen in the Media N=47 N=27 Once 19.2% 25.9%Only 2-5 times 59.6% 51.9%Monthly 15.0% 11.1%Weekly 2.1% 0.0%Multiple times a week 4.3% 11.1%Seen or Experience Conflict N=91 N=85 Yes 3.3% 2.4%No 96.7% 97.7%If Use Common on Iron Horse Trail N=102 N=99 No effect 69.6% 70.7%Use the trail less 19.6% 18.2%Stop traveling on the trail 2.0% 3.0%Other 8.8% 8.1%Percentages may not add up to one hundred because of rounding error. Respondents were asked what they liked and disliked about traveling with Segway HTs and electric bicycles (see Tables 17 and 18). Again, about 20 percent indicated that there was nothing that they liked about traveling with these modes. However, others did appreciate the potential for these devices to reduce air pollution (17 to 20 percent), decrease reliance on petroleum-based fuels (19 percent), enhance the use of new technology (15 to 18 percent), and encourage public transit use (nine to 11 percent). About 30 percent of respondents indicated that there was nothing they disliked about these modes on the trails. However, the top dislikes among those who did have concerns were accidents (12 percent), trails/sidewalks not meant for these modes (11 to 15 percent), their fast speed (10 percent), unable to hear them (nine to 10 percent), and improper use (five to six percent).
20
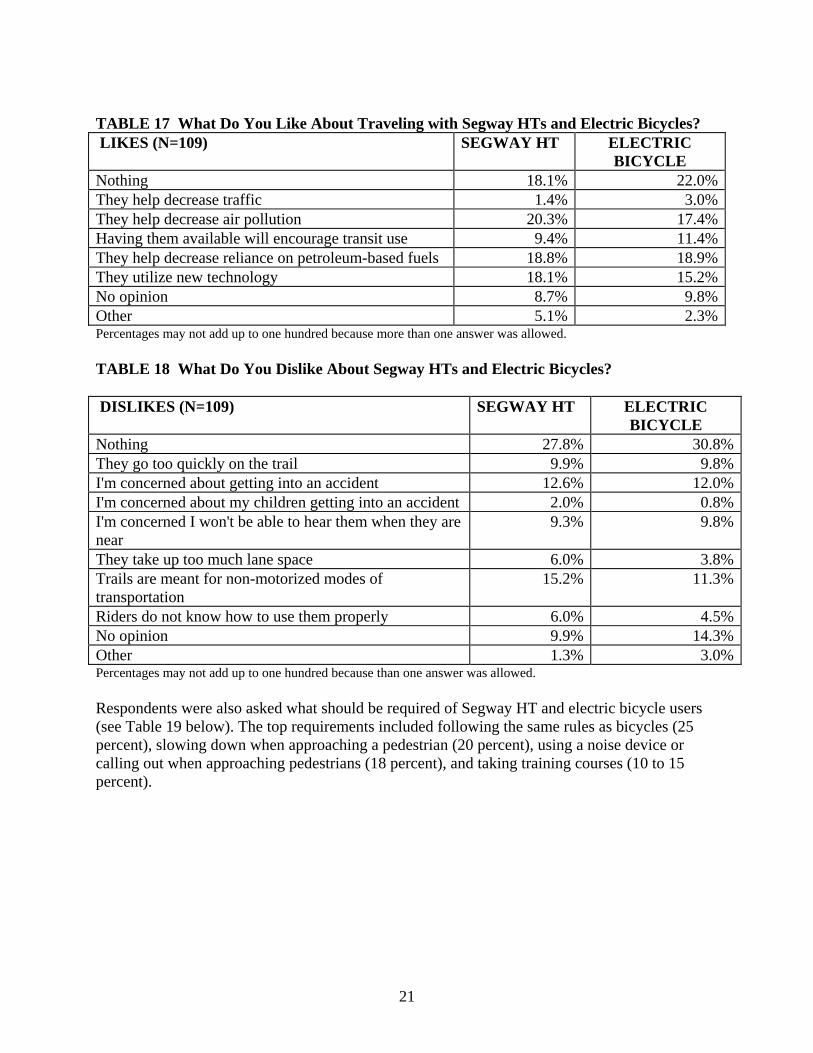
TABLE 17 What Do You Like About Traveling with Segway HTs and Electric Bicycles? LIKES (N=109) SEGWAY HT ELECTRIC
BICYCLE Nothing 18.1% 22.0%They help decrease traffic 1.4% 3.0%They help decrease air pollution 20.3% 17.4%Having them available will encourage transit use 9.4% 11.4%They help decrease reliance on petroleum-based fuels 18.8% 18.9%They utilize new technology 18.1% 15.2%No opinion 8.7% 9.8%Other 5.1% 2.3%Percentages may not add up to one hundred because more than one answer was allowed. TABLE 18 What Do You Dislike About Segway HTs and Electric Bicycles? DISLIKES (N=109) SEGWAY HT ELECTRIC
BICYCLE Nothing 27.8% 30.8%They go too quickly on the trail 9.9% 9.8%I'm concerned about getting into an accident 12.6% 12.0%I'm concerned about my children getting into an accident 2.0% 0.8%I'm concerned I won't be able to hear them when they are near
9.3% 9.8%
They take up too much lane space 6.0% 3.8%Trails are meant for non-motorized modes of transportation
15.2% 11.3%
Riders do not know how to use them properly 6.0% 4.5%No opinion 9.9% 14.3%Other 1.3% 3.0%Percentages may not add up to one hundred because than one answer was allowed. Respondents were also asked what should be required of Segway HT and electric bicycle users (see Table 19 below). The top requirements included following the same rules as bicycles (25 percent), slowing down when approaching a pedestrian (20 percent), using a noise device or calling out when approaching pedestrians (18 percent), and taking training courses (10 to 15 percent).
21
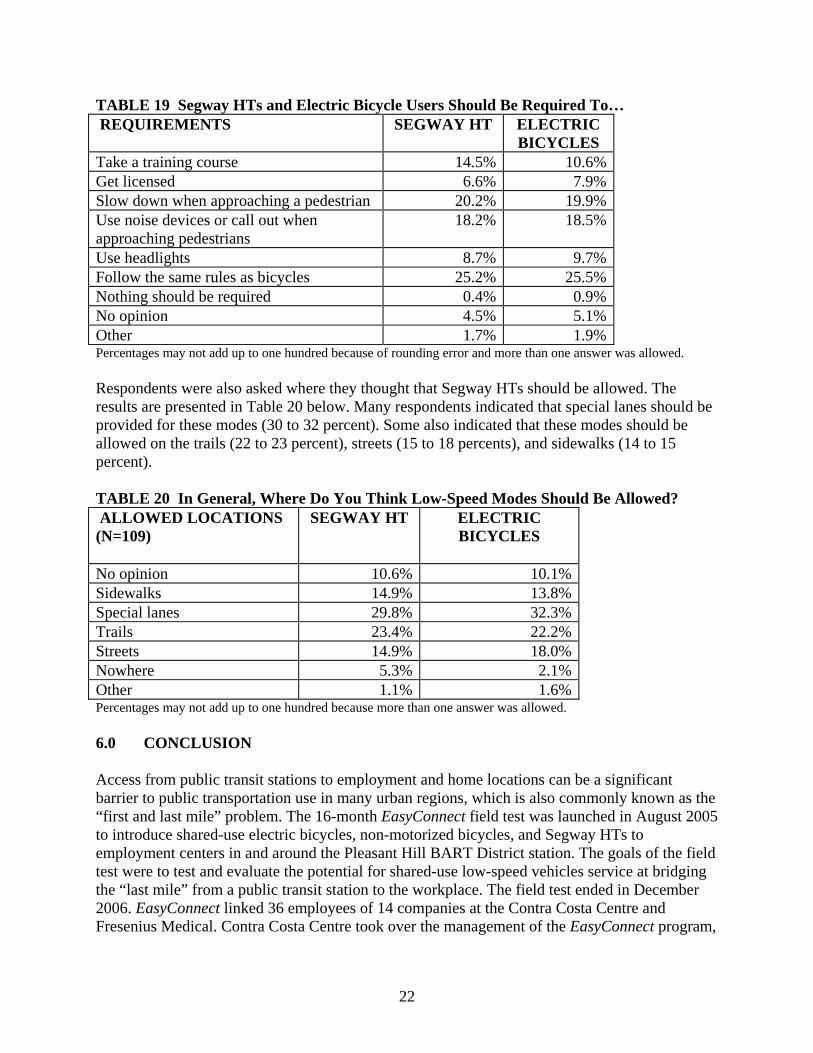
TABLE 19 Segway HTs and Electric Bicycle Users Should Be Required To… REQUIREMENTS SEGWAY HT ELECTRIC
BICYCLES Take a training course 14.5% 10.6% Get licensed 6.6% 7.9% Slow down when approaching a pedestrian 20.2% 19.9% Use noise devices or call out when approaching pedestrians
18.2% 18.5%
Use headlights 8.7% 9.7% Follow the same rules as bicycles 25.2% 25.5% Nothing should be required 0.4% 0.9% No opinion 4.5% 5.1% Other 1.7% 1.9% Percentages may not add up to one hundred because of rounding error and more than one answer was allowed. Respondents were also asked where they thought that Segway HTs should be allowed. The results are presented in Table 20 below. Many respondents indicated that special lanes should be provided for these modes (30 to 32 percent). Some also indicated that these modes should be allowed on the trails (22 to 23 percent), streets (15 to 18 percents), and sidewalks (14 to 15 percent). TABLE 20 In General, Where Do You Think Low-Speed Modes Should Be Allowed? ALLOWED LOCATIONS (N=109)
SEGWAY HT
ELECTRIC BICYCLES
No opinion 10.6% 10.1% Sidewalks 14.9% 13.8% Special lanes 29.8% 32.3% Trails 23.4% 22.2% Streets 14.9% 18.0% Nowhere 5.3% 2.1% Other 1.1% 1.6% Percentages may not add up to one hundred because more than one answer was allowed. 6.0 CONCLUSION Access from public transit stations to employment and home locations can be a significant barrier to public transportation use in many urban regions, which is also commonly known as the “first and last mile” problem. The 16-month EasyConnect field test was launched in August 2005 to introduce shared-use electric bicycles, non-motorized bicycles, and Segway HTs to employment centers in and around the Pleasant Hill BART District station. The goals of the field test were to test and evaluate the potential for shared-use low-speed vehicles service at bridging the “last mile” from a public transit station to the workplace. The field test ended in December 2006. EasyConnect linked 36 employees of 14 companies at the Contra Costa Centre and Fresenius Medical. Contra Costa Centre took over the management of the EasyConnect program,
22

which is now called “Green Fleet” and is operating an expanded and upgraded fleet of Segway HTs, electric bicycles, and bikes. The exploratory evaluation of the EasyConnect project included analysis of initial questionnaires and travel diaries to gain insight into participants’ socio-economic attributes and travel patterns. Program participant EasyConnect travel logs were also collected. Finally, intercept surveys of travelers on the Iron Horse and Canal Trails and in downtown Pleasant Hill were conducted to understand potential bystander concerns. The following are the key results of the initial evaluation of the EasyConnect program:
• Most participants were men aged 30 to 39 who reported relatively high general health levels and exercised frequently by walking, gym work outs, and biking.
• Participants’ transportation-related attitudes indicated they were concerned about air pollution from vehicle travel, willing to change their own travel behavior to improve air quality, and were dissatisfied with their current commute mode.
• Participants’ primarily commuted by driving alone (67 percent) prior to joining the program; however, a number also sometimes commuted by bicycle or motorcycle (47 percent).
• Workplace parking availability and cost did not appear to be a significant problem for the majority of participants.
• Many participants made personal trips relatively frequently during the week day, but fewer made business trips; most of the personal and business trips were made by a private vehicle with an average distance of 2.5 miles, which is within the range of the low-speed modes.
• Most participants joined the program to try new transportation modes and avoid driving during lunch or to run errands.
• Only six of the participants from one company planned to regularly use the program for commuting; the remaining participants worked very close to the Pleasant Hill BART station at the Contra Costa Centre and thus planned to use the program largely for Day Use.
For commute travel the analysis of participants’ use patterns yielded a number of interesting findings:
• The electric bicycle had the highest low-speed mode share (68 percent) relative to the bicycle (20 percent) and Segway HT (12 percent) modes.
• Most participants used the program weekly; had a one-way commute trip distance of one-half to five miles; and would have commuted by car or bicycle if the EasyConnect low-speed modes were not available to them, indicating a likely net reduction in vehicle travel and health benefits among participants.
• The electric bicycle’s speed and range are greater than that of the bicycle and Segway HT and thus appear to be used more frequently for longer commute trips.
23
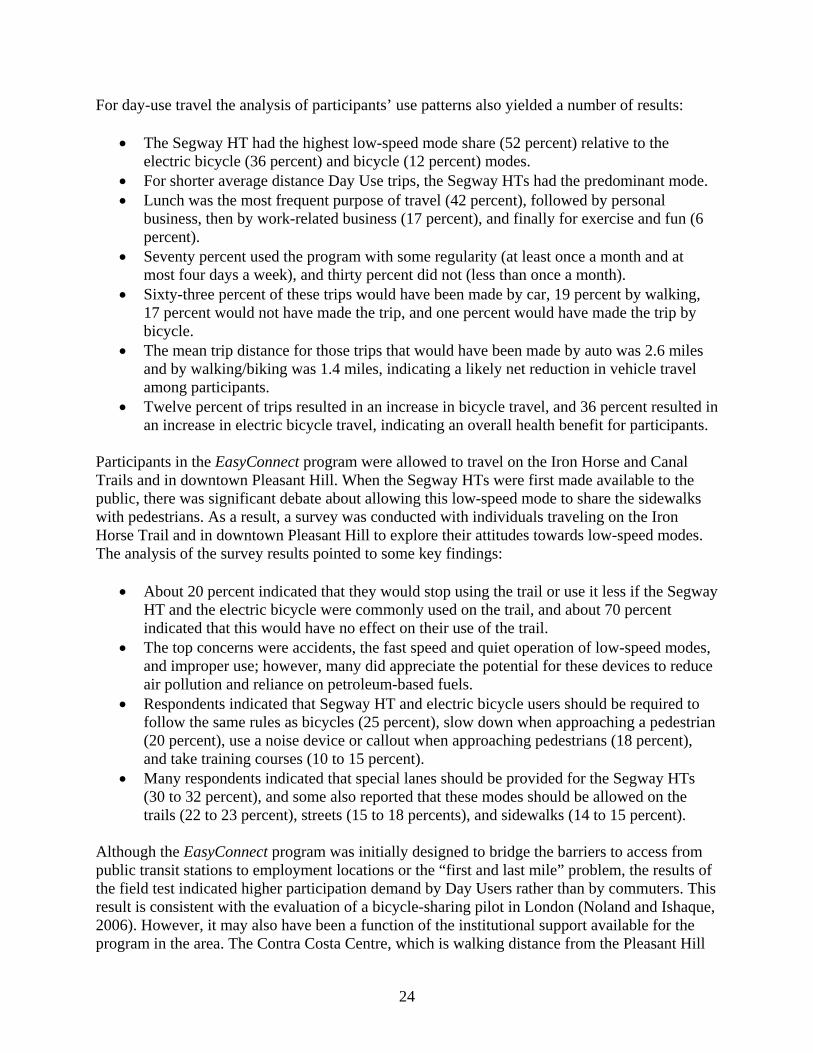
For day-use travel the analysis of participants’ use patterns also yielded a number of results:
• The Segway HT had the highest low-speed mode share (52 percent) relative to the electric bicycle (36 percent) and bicycle (12 percent) modes.
• For shorter average distance Day Use trips, the Segway HTs had the predominant mode. • Lunch was the most frequent purpose of travel (42 percent), followed by personal
business, then by work-related business (17 percent), and finally for exercise and fun (6 percent).
• Seventy percent used the program with some regularity (at least once a month and at most four days a week), and thirty percent did not (less than once a month).
• Sixty-three percent of these trips would have been made by car, 19 percent by walking, 17 percent would not have made the trip, and one percent would have made the trip by bicycle.
• The mean trip distance for those trips that would have been made by auto was 2.6 miles and by walking/biking was 1.4 miles, indicating a likely net reduction in vehicle travel among participants.
• Twelve percent of trips resulted in an increase in bicycle travel, and 36 percent resulted in an increase in electric bicycle travel, indicating an overall health benefit for participants.
Participants in the EasyConnect program were allowed to travel on the Iron Horse and Canal Trails and in downtown Pleasant Hill. When the Segway HTs were first made available to the public, there was significant debate about allowing this low-speed mode to share the sidewalks with pedestrians. As a result, a survey was conducted with individuals traveling on the Iron Horse Trail and in downtown Pleasant Hill to explore their attitudes towards low-speed modes. The analysis of the survey results pointed to some key findings:
• About 20 percent indicated that they would stop using the trail or use it less if the Segway HT and the electric bicycle were commonly used on the trail, and about 70 percent indicated that this would have no effect on their use of the trail.
• The top concerns were accidents, the fast speed and quiet operation of low-speed modes, and improper use; however, many did appreciate the potential for these devices to reduce air pollution and reliance on petroleum-based fuels.
• Respondents indicated that Segway HT and electric bicycle users should be required to follow the same rules as bicycles (25 percent), slow down when approaching a pedestrian (20 percent), use a noise device or callout when approaching pedestrians (18 percent), and take training courses (10 to 15 percent).
• Many respondents indicated that special lanes should be provided for the Segway HTs (30 to 32 percent), and some also reported that these modes should be allowed on the trails (22 to 23 percent), streets (15 to 18 percents), and sidewalks (14 to 15 percent).
Although the EasyConnect program was initially designed to bridge the barriers to access from public transit stations to employment locations or the “first and last mile” problem, the results of the field test indicated higher participation demand by Day Users rather than by commuters. This result is consistent with the evaluation of a bicycle-sharing pilot in London (Noland and Ishaque, 2006). However, it may also have been a function of the institutional support available for the program in the area. The Contra Costa Centre, which is walking distance from the Pleasant Hill
24

BART station, was able to provide significantly more support to the program relative to employers and business centers further away from the station. The availability of the low-speed modes for Day Use at the Contra Costa Centre, however, may have allowed for a higher level of public transit use and carpool commuting. Even without accounting for such mode shifts, the evaluation results indicate net benefits for both commute and Day Use program participants from reduced vehicle travel and increased physical activity. In the future, shared-use low speed mode programs, like EasyConnect, should continue to examine pedestrian concerns about the use of these modes on trails and sidewalks.
25

REFERENCES DeMaio, P. (2001). Public Transportation for the 21st Century, Commuter Choice/Bicycling Programs. City of Alexandria, Virginia. July. DeMaio, P. and J. Gifford. (2004). Will smart bicycles succeed as public transportation in the United Stated? Journal of Public Transportation 7(2): 1-15. Forum for Urban Design and Storefront for Art and Architecture. The New York Bike-Sharing Project. Retrieved September 4, 2007. www.nybikeshare.org Noland, Robert B. and Ishaque, Muhammad M. (2006). Smart bicycles in an urban area: evaluation of a pilot scheme in London. Will smart bicycles succeed as public transportation in the United Stated? Journal of Public Transportation 9(5): 71-94. Rodier, C. J., Shaheen, S.A., and L. Novick. (2004). Improving Bay Area Rapid Transit (BART) District Connectivity and Access with the Segway Human Transporter and Other Low-Speed Modes. California PATH Research Report. UCB-ITS-PRR-2004-27.
Vélib. (2008) Aujourd’hui, nous vous connaissons mieux. Retrieved August 25, 2008. http://www.velib.paris.fr/paris/les_newsletters/10_aujourd_hui_nous_vous_connaissons_mieux.
26

APPENDIX A: QUESTIONNAIRE

Participant’s Name:___________________________ Please Print
EasyConnect Program “Before” Questionnaire Thank you for participating in the California Partners for Advanced Transit and Highways (PATH) EasyConnect research program. Your answers to this questionnaire are vital to helping us develop and evaluate the effectiveness of this program with respect to enhanced transportation services in and around the Pleasant Hill area. Please read and answer each question, unless otherwise noted to skip certain questions. All questions refer to your typical travel patterns before the start of this program. The questionnaire should take about 20 minutes to complete. Your responses will remain completely confidential. If you have any questions about this survey, please contact Caroline Rodier at [email protected]. First, we begin by asking you some questions about your commute travel.
1. For your most frequent commute method to your primary work location, please provide the amount of time and number of miles you typically spend on each mode of travel for your one-way door-to-door commute trip. It is important to separately include all the distinct modes that make up your total commute: for example, 10 min and 5 miles to drive to BART; 25 min and 15 miles on BART; and 10 min and 0.5 miles to walk from BART to the office. Include any waiting times in your estimate: for example, a total BART travel time of 25 min could be 20 min riding time and 5 min waiting time. Estimate all distances to the best of your ability. Transportation Modes for Primary Commute Minutes Miles Drive by myself Carpool Vanpool Bus BART Amtrak MUNI Caltrain Taxi Walk Bicycle Dropped off to ride Transit/Vanpool/Carpool Other, please specify:
2. How many days a week do you use your primary commute method? ____ Less than 1 day ____ 1 to 2 days ____ 3 to 4 days ____ 5 or more days
3. Do you sometimes commute to work by a different method? ____ Yes ____ No If you use BART as part of your commute and answered NO to Question 3, please SKIP to Question 6 on page 2.
If you do NOT use BART as part of your commute and answered NO to Question 3, please SKIP to Question 12 on page 4.
A-1

4. For your second most frequent commute mode to your primary work location, please provide the amount of time and number of miles you typically spend on a one-way commute trip. Transportation Modes for Secondary Commute Minutes Miles Drive by myself Carpool Vanpool Bus BART Amtrak MUNI Caltrain Taxi Walk Bicycle Dropped off to ride Transit/Vanpool/Carpool Other, please specify:
5. How often do you use your secondary commute method? ____ Less than 1 day a month ____ 1 to 3 days a month ____ 1 day a week ____ 2 days a week ____ 3 or more days a week
If you have not used BART to commute to work within the last year, then SKIP to Question 12 on page 4. 6. How do you typically get from your home to your most frequently used BART station?
____ Drive myself and park at or near the station ____ Dropped off by someone ____ Carpool ____ Walk ____ Bus ____ Bicycle ____ Other, please specify: __________________________
7. What is your most frequently used home-end BART station? ______________________
If you have not driven to and parked at your home-end BART station within the last year, please SKIP to Question 9 on page 3.
A-2

8. Please check the response or responses that best represent your experience of parking at your most frequently used home-end BART station. Check all that apply. ____ Parking is available when I want it ____ Parking is not available when I want it ____ Searching for parking is a hassle ____ Walking from my car to the BART station takes too long ____ The cost of BART monthly reserved parking is too high ____ No opinion ____ Other, please specify: ___________________________________________
9. Overall, how satisfied are you with the services provided by BART? ____ Very unsatisfied ____ Somewhat unsatisfied ____ Neutral ____ Somewhat satisfied ____ Very satisfied
10. Please rank the three primary advantages of using BART for your commute trip (#1 would be
the most important, #2 the second most important, and #3 the third most important). ____ Reduces the time I sit in traffic ____ Fits with my schedule better than buses/shuttles ____ Gives me time to work or relax during my commute ____ Saves me money ____ Means I do not have to buy another car ____ Helps me do my part to reduce congestion and air pollution ____ Parking at BART is easier than parking at my workplace ____ Parking at BART is less expensive than parking at my workplace ____ No opinion ____ Other, please specify: ___________________________________________
11. Please rank the three primary disadvantages of using BART for your commute trip (#1 would be what you like least, #2 your secondary dislike, and #3 your tertiary dislike). ____ The fares are too high ____ It takes me more time to go places ____ I’m unfamiliar with the transit systems ____ I can’t easily transport personal items (e.g. gym bag, groceries, etc.) ____ I’m not able to be as spontaneous as I might like ____ I have concerns about station area safety at night ____ The trains don’t run on time ____ The trains don’t run frequently enough ____ I can’t get a seat ____ No opinion ____ Other, please specify: ___________________________________________
A-3

12. Please indicate how frequently you have used any type of public transit (e.g., BART, MUNI, bus, AMTRAK, etc.) within the past year for non-work travel (e.g., shopping, recreation, etc.). ____ Never ____ Less than 1 day a month ____ 1 to 3 days a month ____ 1 to 3 days a week ____ 4 to 5 days a week ____ More than 5 days a week Now, we ask you some questions about parking at your workplace.
13. Within the last year, how often have you driven to and parked at or near your workplace? ____ Never ____ Less than 1 day a month ____ 1 to 3 days a month ____ 1 to 3 days a week ____ 4 to 5 days a week ____ More than 5 days a week
If you answered NEVER to Question 13, please SKIP to Question 19 on page 5.
14. Please indicate which of the following best represents the type of parking you typically use at
or near your workplace. ____ Free parking provided by my employer ____ Parking provided by my employer that I pay for ____ Free parking not provided by my employer ____ Paid parking not provided by my employer
If you typically park for FREE at or near your work, please SKIP to Question 16.
15. Please provide the typical cost of parking for whichever ONE of the time periods below is
most familiar to you. $ __________ per hour $ __________ per day $ __________ per week $ __________ per month $ __________ per year
16. How long does it typically take you to find parking at your workplace in the morning? ____ 0 to 5 minutes ____ 6 to 10 minutes ____ 11 to 15 minutes ____ 16 to 20 minutes ____ More than 20 minutes
A-4

17. How long does it typically take you to walk from your parking space to your workplace? ____ 0 to 5 minutes ____ 6 to 10 minutes ____ 11 to 15 minutes ____ 16 to 20 minutes ____ More than 20 minutes
18. If you leave your parking space at or near work and return before 5:00 pm (e.g., for business or personal purposes), how difficult is it for you to find a space when you return? ____ Not difficult ____ Somewhat difficult ____ Very difficult ____ I never leave my space
Now, we ask you some questions about your workplace related travel.
19. Do you ever leave your workplace during the day for business purposes (e.g., meetings, sales calls, etc.) and return again? ____ Yes ____ No
If you answered NO to Question 19, please SKIP to Question 23.
20. How many days a week do you leave your workplace for business purposes on average? ____ Less than 1 day ____ 1 to 2 days ____ 3 to 4 days ____ 5 or more days
21. What is the typical one-way travel time for these business trips?
_______minutes/hours (circle one)
22. Please check all modes of transportation that you use to complete these business trips. ____ My vehicle ____ Taxi ____ Company vehicle ____ Walking ____ Friend/coworker/carpool partner’s vehicle ____ Bicycle ____ Public Transit ____ Other, please specify: _____________
23. Do you ever leave your workplace during the day for personal business (e.g., lunch, errands,
doctor’s appointments, etc.) and return again? ____ Yes ____ No If you checked NO to Question 23, please SKIP to Question 27 on page 6.
24. How many days a week do you leave your workplace for personal business on average?
____ Less than 1 day ____ 1 to 2 days ____ 3 to 4 days ____ 5 or more days
25. What is the typical one-way travel time for these personal business trips? _______ minutes/hours (circle one)
A-5

26. Please check all modes of transportation that you use to complete these personal trips. ____ My vehicle ____ Taxi ____ Company vehicle ____ Walking ____ Friend/coworker/carpool partner’s vehicle ____ Bicycle ____ Public Transit ____ Other, please specify: _____________
Next, we have a few questions related to your household vehicles.
27. How many working motor vehicles (including cars, trucks, minivans, and motorcycles) are available to your household?
28. Consider the next vehicle your household might acquire. When do you think your household might buy or lease your next vehicle? Check one box below. ____ less than 1 year ____ 1 to 2 years ____ 2 to 3 years ____ 3 to 5 years ____ More than 5 years ____ Not applicable
29. What do you plan to do with your personal motor vehicle(s) once you have joined the EasyConnect program? ____ No change in vehicle use ____ Someone in my immediate family will use a vehicle more frequently. ____ I plan to loan a vehicle to someone outside my immediate family. ____ I plan to sell or store one or more of my personal vehicles. ____ Other, please specify: _______________________________
A-6

Next, we have some questions related to your participation in the EasyConnect program.
30. How long have you wanted to try a new method of traveling to work and/or around work?
____ less than 1 year ____ 1 to 2 years ____ 2 to 3 years ____ 3 to 5 years ____ More than 5 years
31. Please indicate if one of the following particular events or life changes influenced you to try a
different travel mode. ____ Starting at a new job ____ Moving to a new home ____ Family changes (e.g., childbirth, marriage, etc.) ____ My car broke down/I got rid of a car ____ Other, please specify: ____________________________________________ ____ No, there was no particular life event
32. Please describe your primary motivation(s) for joining the EasyConnect program. ____________________________________________________________________ ____________________________________________________________________ ____________________________________________________________________
33. Please describe any concern(s) that you might have about the EasyConnect program. ____________________________________________________________________ ____________________________________________________________________ ____________________________________________________________________
34. How often do you anticipate using the bicycle, electric bicycle, and/or Segway HT? As a commuter from the Pleasant Hill BART station to your workplace: ____ Never ____ Less than 1 day a month ____ 1 to 3 days a month ____ 1 to 2 days a week ____ 3 to 4 days a week ____ 5 days a week As a day-user from your workplace to conduct personal and/or work related business: ____ Never ____ Less than 1 day a month ____ 1 to 3 days a month ____ 1 to 2 days a week ____ 3 to 4 days a week ____ 5 days a week
A-7

Next, we have some questions about your attitudes and opinions.
35. For each of the following statements, please check the one response that best expresses how strongly you disagree or agree with: “My primary commute method (that is, the transportation mode(s) I typically use to get to work)…
Strongly Disagree
Disagree Neutral Agree Strongly Agree
…is enjoyable to me.”
…allows me to visit friends when I want.”
…fits my budget.”
…allows me to be spontaneous.”
…helps me go everywhere.”
…says a lot about who I am.”
…does not make me feel safe.”
…gives me a sense of independence.”
…is great for my lifestyle needs.”
…allows me to quickly respond in an emergency.”
…is comfortable.”
…gives me a sense of freedom.”
36. Please rank the three things that you like least about your current transportation methods
(#1 would be your primary dislike, #2 your secondary dislike, and #3 your tertiary dislike). ____ It’s too expensive. ____ Parking is a hassle. ____ I waste too much time in traffic. ____ Vehicle maintenance is a hassle. ____ It’s not reliable enough. ____ It takes too long to get places. ____ It’s not environmentally-friendly. ____ It’s not flexible enough. ____ Other, please specify: __________________________________________________
A-8

37. For each of the following statements, please check the one response that best expresses how strongly you disagree or agree.
Strongly Disagree
Disagree Neutral Agree Strongly Agree
Does Not Apply
I like to experiment with new ways of doing things.
I sometimes don’t drive because finding a parking space is difficult and frustrating.
Transit is too expensive, so I don’t use it much.
I would like to reduce my auto use to reduce congestion and improve air quality.
Once I am happy with something, I don’t want to change it.
I spend too much time dealing with car maintenance.
Keeping licenses and smog checks current is relatively easy.
I usually do not wait too long for buses and trains.
I am willing to drive an electric or other clean-fuel vehicle to improve air quality if I can afford it.
I use transit when it goes where I want to go.
I’d be willing to ride a bicycle or take transit to help improve air quality.
If friends and neighbors reduced their driving, I would follow their example.
I know transit schedules and routes relatively well.
It is time to change the way we live to help address environmental problems.
The benefits of owning a car are higher than the costs.
Traffic fumes are a major contributor to global warming, smog, and other environmental problems.
I sometimes do not feel safe while using public transportation.
Next, we have some questions about your heath and exercise.
38. How would you rate your general health? ____ Poor ____ Very good ____ Fair ____ Excellent ____ Good ____ Not sure
39. On average, how many times per week do you participate in physical exercise? ____ None ____ 3 to 4 times ____ 1 to 2 times ____ 5 or more times
A-9

40. Please indicate your primary mode of physical activity. Check one category below. ____ Walking ____ Aerobics/dance class/spin class ____ Jogging/running ____ Climbing/hiking ____ Biking ____ Kayaking/canoeing/sailing ____ Swimming ____ Rollerblading/skating ____ Gym workouts ____ Other, please specify: __________________
____ None
41. Please indicate your secondary mode of physical activity. Check one category below. ____ Walking ____ Aerobics/dance class/spin class ____ Jogging/running ____ Climbing/hiking ____ Biking ____ Kayaking/canoeing/sailing ____ Swimming ____ Rollerblading/skating ____ Gym workouts ____ Other, please specify: __________________ ____ None Finally, we have some demographic questions that help us categorize our data. The information you provide will remain completely confidential.
42. What is the address of your primary residence? Remember to include zip code.
_______________________ _______________________ _______________________
43. Nearest cross-street to your primary residence: ____________________
44. Gender: ____ Female ____ Male
45. Please check the category below that best describes your household. ____ Self only ____ Self with spouse/partner ____ Self with spouse/partner and child(ren) ____ Self with child(ren) ____ Self with roommate(s) ____ Other, please specify: __________________________
46. How many commuters, including yourself, are in your household? (A commuter is an adult who travels three or more days per week to and from work or school.) __________
47. How many people in your household drive a motor vehicle? __________
48. What is the highest level of school that you have completed? ____ Grade School ____ College ____ High School ____ Graduate/Professional ____ Trade School ____ Other, please specify: _____________________
A-10

A-11
49. What is your employment status? ____ Employed full-time ____ Student ____ Employed part-time ____ Other, please specify: _____________________
50. What category best describes your occupation? ____ Manager/administrator ____ Service/repair ____ Clerical/administrative support ____ Sales ____ Professional/technical ____ Production/construction/crafts ____ Other, please specify: __________________________
51. Please indicate if you have used any of the following technologies within the last week. Check all that apply. ____ Internet at work ____ Internet at home ____ Mobile telephone ____ PDA (hand-held electronic organizer)
52. What is your age? ____ 19 to 23 years old ____ 40 to 49 years old ____ 24 to 29 years old ____ 50 to 59 years old ____ 30 to 39 years old
53. How many individuals in your household are in each of the following age groups below, including yourself? In the spaces below, please indicate the number of people in each age group. ____ 0 to 5 years old ____ 30 to 39 years old ____ 6 to 15 years old ____ 40 to 49 years old ____ 16 to 18 years old ____ 50 to 59 years old ____ 19 to 23 years old ____ 60 to 69 years old ____ 24 to 29 years old ____ 70 years old or older
54. What was your household’s 2005 gross (before taxes) income? ____ Under $10,000 ____ $10,000 to $19,999 ____ $20,000 to $49,999 ____ $50,000 to $79,999 ____ $80,000 to $109,999 ____ More than $110,000 Thank you very much for taking the time to complete this questionnaire!


APPENDIX B: TRAVEL DIARY


EasyConnect Three-Day Travel Diary Thank you for agreeing to participate in the EasyConnect research program. The travel diary is a critical tool in helping the research staff evaluate current travel patterns in the Bay Area. Please record your travel for either a Thursday/Friday/Saturday or a Sunday/Monday/ Tuesday combination of three consecutive days. (In other words, you must start the diary on a Thursday or Sunday.) Please do not use if you are taking an out-of-region business trip or vacation, or over a holiday weekend. Here are some situations that should help clarify some questions you might have about filling out the diary:
• Note: Each destination should be recorded on a separate line , even if you stop at a
location for a very short time, or are stopping en route to somewhere else. For example, if you leave work and drop a friend off at the BART station, then drive to the bank, then walk from the bank to buy a coffee, then walk back from the coffee shop to your car, and then drive home, these are all separate trips.
• Remember to record all walking trips. To help you remember, think of any walking trip
that takes you from one location to another. Under-reported walking trips are the most common error associated with travel diaries.
• If you walk more than 5 minutes after parking your car to get to your destination, this is a
new trip.
• Most trips on public transit have smaller ‘access trips’ on either side. For example, if someone drives you to the BART station in the morning, then you take BART to the station closest to your office, and then you walk from BART to your office, these are three separate trips. The Destination/Activity for all of these trips will be “Going to primary work place”
• Do not count bus-to-bus transfers as another trip. However, if you transfer between
modes (e.g., from BART to bus), these should be indicated as separate trips.
• If you are driving, and you stop – even momentarily – to pick someone up, that constitutes the start of a new trip.
• If you ride in a carpool/vanpool, you do not need to show the stops to pick up or drop off
riders. If you are the driver of a carpool/vanpool, please write down all of your stops.
• Please be as specific as possible (e.g., $1.25 for one-way transit fare, or $12 for 9 hours of parking) when entering the costs associated with a trip. If you pay for parking, enter the amount with the trip that you feel is most appropriate (i.e., either the trip that precedes or comes after the parking).
Please fill out the diary to the best of your ability. If there is a confusing situation, please jot down the details and we will be happy to help you figure out what is the best way to fill out the form. Feel free to contact Caroline Rodier at [email protected] with any questions. Thank you very much for your cooperation.


Please Remember:
A. Going to primary A. Private Car/work place Truck
B. Work-related travel B. Carpool/(off-site meeting, etc.) Vanpool
C. Shopping/Errands/ C. Taxi/ShuttleStopping for gas D. Motorcycle/
D. Personal business MopedE. BART/
the home F. Public Bus
Recreation H. WalkG. Z. other, H. Picking up/Dropping describe on
off someone else appropriate I. Home line belowZ. other, describe on
appropriate line below
11
12
13
14
15
16
17
18
19
20D R
D R
D R
D R
D R
D R
D R
D R
D R
Orinda BART; Long's on Mt. Diablo Blvd in Lafayette;2901 Ygnacio Valley Rd, Walnut Creek; etc.
D R
How many
total in group?
$$$?F. Social/Entertainment/ G. Bicycle
Civic/Religious activities
If you paid anything, such as parking, transit fare,
tolls (but not gas) for this trip, indicate how much,
and per what unit of usage.
Circle 'D' or 'R' if
appropriate
Count yourself and others riding
with you
I LEFT AT:
TO GO TO: I GOT THERE
AT:
Driver or
rider?Name and full address of destination. For address, be as specific
as possible. If you do not know the exact address, list cross streets, zip code, or describe location as best as possible.
Time you began
your trip
Time you finished your trip
Examples: Work; Home; Oak Grove @ Whitman in Concord;
E. Meal/Snack outside other train(medical, banking, etc.)
DESTINATION / ACTIVITY: MODE?
page 2
every mode switch constitutes a new trip.
TRAVEL DIARY - DAY 1 ● Do not forget about walking trips.
● Every stop, no matter how short, and Date: _______________, 2005
Name: ___________________________
● Use a new line for every 'leg' of a trip. Circle day of week: Thursday / Sunday

Please Remember:
A. Going to primary A. Private Car/work place Truck
B. Work-related travel B. Carpool/(off-site meeting, etc.) Vanpool
C. Shopping/Errands/ C. Taxi/ShuttleStopping for gas D. Motorcycle/
D. Personal business MopedE. BART/
the home F. Public Bus
Recreation H. WalkG. Z. other, H. Picking up/Dropping describe on
off someone else appropriate I. Home line belowZ. other, describe on
appropriate line below
1
2
3
4
5
6
7
8
9
10D R
D R
D R
D R
D R
D R
D R
D R
D R
Orinda BART; Long's on Mt. Diablo Blvd in Lafayette;2901 Ygnacio Valley Rd, Walnut Creek; etc.
D R
How many
total in group?
$$$?F. Social/Entertainment/ G. Bicycle
Civic/Religious activities
If you paid anything, such as parking, transit fare,
tolls (but not gas) for this trip, indicate how much,
and per what unit of usage.
Circle 'D' or 'R' if
appropriate
Count yourself and others riding
with you
I LEFT AT:
TO GO TO: I GOT THERE
AT:
Driver or
rider?Name and full address of destination. For address, be as specific
as possible. If you do not know the exact address, list cross streets, zip code, or describe location as best as possible.
Time you began
your trip
Time you finished your trip
Examples: Work; Home; Oak Grove @ Whitman in Concord;
E. Meal/Snack outside other train(medical, banking, etc.) ________________________________
DESTINATION / ACTIVITY: MODE?
page 1
every mode switch constitutes a new trip.
TRAVEL DIARY - DAY 2I started the day at: □ home
● Do not forget about walking trips. □ other, please indicate address:
● Every stop, no matter how short, and Date: _______________, 2005
Name: ___________________________
● Use a new line for every 'leg' of a trip. Circle day of week: Friday / Monday
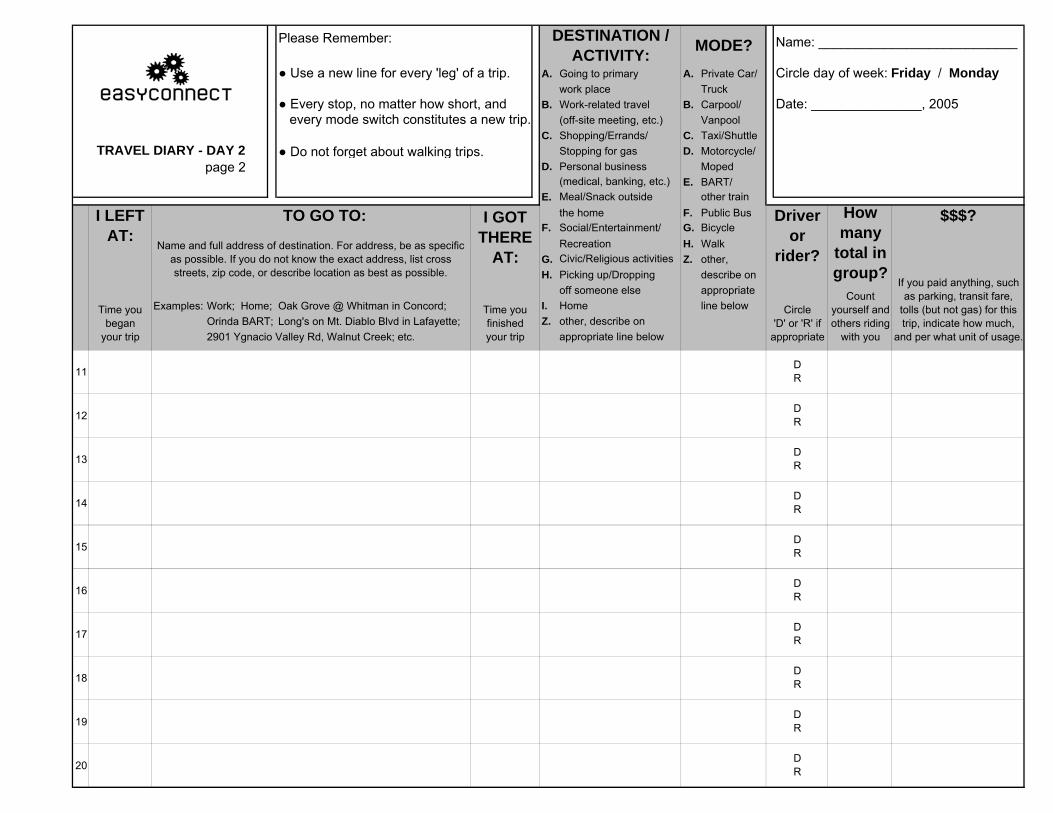
Please Remember:
A. Going to primary A. Private Car/work place Truck
B. Work-related travel B. Carpool/(off-site meeting, etc.) Vanpool
C. Shopping/Errands/ C. Taxi/ShuttleStopping for gas D. Motorcycle/
D. Personal business MopedE. BART/
the home F. Public Bus
Recreation H. WalkG. Z. other, H. Picking up/Dropping describe on
off someone else appropriate I. Home line belowZ. other, describe on
appropriate line below
11
12
13
14
15
16
17
18
19
20D R
D R
D R
D R
D R
D R
D R
D R
D R
Orinda BART; Long's on Mt. Diablo Blvd in Lafayette;2901 Ygnacio Valley Rd, Walnut Creek; etc.
D R
How many
total in group?
$$$?F. Social/Entertainment/ G. Bicycle
Civic/Religious activities
If you paid anything, such as parking, transit fare,
tolls (but not gas) for this trip, indicate how much,
and per what unit of usage.
Circle 'D' or 'R' if
appropriate
Count yourself and others riding
with you
I LEFT AT:
TO GO TO: I GOT THERE
AT:
Driver or
rider?Name and full address of destination. For address, be as specific
as possible. If you do not know the exact address, list cross streets, zip code, or describe location as best as possible.
Time you began
your trip
Time you finished your trip
Examples: Work; Home; Oak Grove @ Whitman in Concord;
E. Meal/Snack outside other train(medical, banking, etc.)
DESTINATION / ACTIVITY: MODE?
page 2
every mode switch constitutes a new trip.
TRAVEL DIARY - DAY 2 ● Do not forget about walking trips.
● Every stop, no matter how short, and Date: _______________, 2005
Name: ___________________________
● Use a new line for every 'leg' of a trip. Circle day of week: Friday / Monday

Please Remember:
A. Going to primary A. Private Car/work place Truck
B. Work-related travel B. Carpool/(off-site meeting, etc.) Vanpool
C. Shopping/Errands/ C. Taxi/ShuttleStopping for gas D. Motorcycle/
D. Personal business MopedE. BART/
the home F. Public Bus
Recreation H. WalkG. Z. other, H. Picking up/Dropping describe on
off someone else appropriate I. Home line belowZ. other, describe on
appropriate line below
1
2
3
4
5
6
7
8
9
10D R
D R
D R
D R
D R
D R
D R
D R
D R
Orinda BART; Long's on Mt. Diablo Blvd in Lafayette;2901 Ygnacio Valley Rd, Walnut Creek; etc.
D R
How many
total in group?
$$$?F. Social/Entertainment/ G. Bicycle
Civic/Religious activities
If you paid anything, such as parking, transit fare,
tolls (but not gas) for this trip, indicate how much,
and per what unit of usage.
Circle 'D' or 'R' if
appropriate
Count yourself and others riding
with you
I LEFT AT:
TO GO TO: I GOT THERE
AT:
Driver or
rider?Name and full address of destination. For address, be as specific
as possible. If you do not know the exact address, list cross streets, zip code, or describe location as best as possible.
Time you began
your trip
Time you finished your trip
Examples: Work; Home; Oak Grove @ Whitman in Concord;
E. Meal/Snack outside other train(medical, banking, etc.) ________________________________
DESTINATION / ACTIVITY: MODE?
page 1
every mode switch constitutes a new trip.
TRAVEL DIARY - DAY 3I started the day at: □ home
● Do not forget about walking trips. □ other, please indicate address:
● Every stop, no matter how short, and Date: _______________, 2005
Name: ___________________________
● Use a new line for every 'leg' of a trip. Circle day of week: Saturday / Tuesday

Please Remember:
A. Going to primary A. Private Car/work place Truck
B. Work-related travel B. Carpool/(off-site meeting, etc.) Vanpool
C. Shopping/Errands/ C. Taxi/ShuttleStopping for gas D. Motorcycle/
D. Personal business MopedE. BART/
the home F. Public Bus
Recreation H. WalkG. Z. other, H. Picking up/Dropping describe on
off someone else appropriate I. Home line belowZ. other, describe on
appropriate line below
11
12
13
14
15
16
17
18
19
20D R
D R
D R
D R
D R
D R
D R
D R
D R
Orinda BART; Long's on Mt. Diablo Blvd in Lafayette;2901 Ygnacio Valley Rd, Walnut Creek; etc.
D R
How many
total in group?
$$$?F. Social/Entertainment/ G. Bicycle
Civic/Religious activities
If you paid anything, such as parking, transit fare,
tolls (but not gas) for this trip, indicate how much,
and per what unit of usage.
Circle 'D' or 'R' if
appropriate
Count yourself and others riding
with you
I LEFT AT:
TO GO TO: I GOT THERE
AT:
Driver or
rider?Name and full address of destination. For address, be as specific
as possible. If you do not know the exact address, list cross streets, zip code, or describe location as best as possible.
Time you began
your trip
Time you finished your trip
Examples: Work; Home; Oak Grove @ Whitman in Concord;
E. Meal/Snack outside other train(medical, banking, etc.)
DESTINATION / ACTIVITY: MODE?
page 2
every mode switch constitutes a new trip.
TRAVEL DIARY - DAY 3 ● Do not forget about walking trips.
● Every stop, no matter how short, and Date: _______________, 2005
Name: ___________________________
● Use a new line for every 'leg' of a trip. Circle day of week: Saturday / Tuesday


APPENDIX C: BYSTANDER SURVEY1
1 Note that the instrument implemented in the downtown Pleasant Hill area substituted this location for the Iron Horse trail to the survey appended here.


Easy Connect Survey Iron Horse Trail
SURVEY NUMBER:
Date: _______________ Time: _________ Approximate Location:_______________ Each question will indicate whether or not they require single or multiple responses. A. Questions about your travel on the trail
1. How often do you travel on the trail? (select one) Less than once a month 1 to 3 days a month 1 to 3 days a week 4 or more days a week
2. Why do you most frequently travel on the trail? (select all that apply)
To commute to work To commute to school For exercise To go shopping For recreation Other (please specify):____________________________________
3. How do you most frequently travel on the trail? (select one)
Walk Jog/run Ride a bike Ride a non-motorized scooter Other (please specify): _____________________________
4. Do you ever travel on the trail with children? (select one)
Yes, if yes then how frequently? (select one) Less than once a month
1 to 3 days a month 1 to 3 days a week 4 or more days a week
No
5. What time of day do you most frequently travel on the trail? (select one) Morning (5am – 11 am) Lunchtime (11am – 2pm) Afternoon (2pm – 4pm) Evening (4pm – 10pm)
C-1

B. Questions on your thoughts about new transportation methods on the trail
6. Have you seen a Segway before? Yes (continue to question 7) No (skip to question 8)
Unsure (skip to question 8) I don’t know what a Segway is. (Please ask the researcher to explain,
then skip to question 8) 7. If you have seen a Segway before, where? (select all that apply)
On the Iron Horse trail. If yes, how often? (select one) Once
2-5 times Monthly Weekly Multiple times a week
In downtown Pleasant Hill. If yes, how often? (select one)
Once 2-5 times Monthly Weekly Multiple times a week
In the media. If yes, how often? (select one)
Once 2-5 times Monthly Weekly Multiple times a week
Other locations (please specify): ________________________________________
8. Have you seen an electric bike before? Yes (continue to question 10) No (skip to question 11)
Unsure (skip to question 11) I don’t know what an electric bike is. (Please ask the researcher to explain, then skip to question 10)
C-2

9. If you have seen electric bikes before, where? (select all that apply) On the Iron Horse trail. If yes, how often?(select one)
Once 2-5 times Monthly Weekly Multiple times a week
In downtown Pleasant Hill. If yes, how often? (select one) Once
2-5 times Monthly Weekly Multiple times a week
In the media. If yes, how often? (select one) Once
2-5 times Monthly Weekly Multiple times a week
Other locations (please specify): ________________________________________
10. In general, what do you like about Segways and electric bikes traveling on the trail? (select all that apply)
Segways Electric bikes
Nothing Nothing They help decrease traffic on trails They help decrease traffic on trails They help decrease air pollution They help decrease air pollution Having them available will
encourage transit use Having them available will
encourage transit use They help decrease reliance on
petroleum-based fuels They help decrease reliance on
petroleum-based fuels They utilize new technology They utilize new technology No opinion No opinion Other (please specify):
________________________________
Other (please specify): ________________________________
C-3

11. In general, what do you dislike about Segways/electric bikes traveling on the trail? (select all that apply)
Segways Electric bikes
Nothing Nothing They go too quickly on the trail They go too quickly on the trail I’m concerned about getting into an
accident I’m concerned about getting into an
accident I’m concerned about my children
getting into an accident I’m concerned about my children
getting into an accident I’m concerned I won’t be able to
hear them when they are near I’m concerned I won’t be able to
hear them when they are near They take up too much lane space They take up too much lane space Trails are meant for non-motorized
modes of transportation Trails are meant for non-motorized
modes of transportation Riders do not know how to use them
properly Riders do not know how to use them
properly No opinion No opinion Other (please specify):
________________________________
Other (please specify): ________________________________
12. If you have seen a Segway or electric bike before, have you seen or experienced any conflicts with Segway and/or electric bike riders? (select one)
Segways Electric bikes Yes Yes No No
If yes, please describe:______________ If yes, please describe:___________ ________________________________ ______________________________
13. Segway/electric bike users on the trail should be required to: (select all that
apply) Segways Electric bikes
Take a training course Take a training course Get licensed Get licensed Slow down when approaching a
pedestrian Slow down when approaching a
pedestrian Use noise devices or call out when
approaching pedestrians Use noise devices or call out when
approaching pedestrians Use headlights Use headlights Follow the same rules as bikes Follow the same rules as bikes Nothing should be required Nothing should be required No opinion No opinion Other (please specify):
________________________________
Other (please specify): ________________________________
C-4

14. In general, where do you think Segways/electric bikes should be allowed? (select all that apply)
Segways Electric Bikes
No opinion No opinion Sidewalks Sidewalks Special lanes, like bike lanes Special lanes, like bike lanes Trails, such as the Iron Horse trail Trails, such as the Iron Horse trail Streets Streets Nowhere Nowhere Other (please specify)_____________ Other (please specify)__________
_________________________________ ______________________________
15. When should Segways/electric bikes not be allowed on the trail? (select all that apply)
Segways Electric bikes
Should always be allowed Should never be allowed Morning (5am – 11 am) Lunchtime (11am – 2pm) Afternoon (2pm – 4pm) Evening (4pm – 10pm)
Should always be allowed Should never be allowed Morning (5am – 11 am) Lunchtime (11am – 2pm) Afternoon (2pm – 4pm) Evening (4pm – 10pm)
16. If Segways/electric bikes became common on the trail, how would it affect your
use of the trail? (select one)
Segways Electric bikes
No effect Use the trail less Stop traveling on trail Other (please specify):
_______________________________
No effect Use the trail less Stop traveling on trail Other (please specify):
_______________________________
C. Demographic questions to help us categorize the survey responses 17. What is your gender?
Male Female Decline to respond
18. What is your (a) home zip code? ___________ (b) work zip code?____________
C-5

C-6
19. What is your age?
up to 18 years old 50 – 59 19 – 23 60 – 69 24 – 29 70 – 79 30 – 39 80 years or older 40 – 49 Decline to respond
20. What is the highest level of school that you have completed?
Grade school Bachelor’s degree High school Graduate/Professional degree Trade school/Associate degree Other (please specify):_______________ Decline to respond
21. Are you employed? If so, what category best describes your occupation?
Manager/administrator Professional/technical Service/repair Production/construction/crafts Clerical/administrative support Sales Not employed Other (please specify) Decline to respond
Thank you very much for taking this survey!