easyCBM Reading Fluency - University of Oregon€¦ · · 2016-04-04easyCBM® Slope Reliability:...
27
Technical Report # 1111 easyCBM ® Slope Reliability: Letter Names, Word Reading Fluency, and Passage Reading Fluency Revised December 2011 Chalie Patarapichayatham Daniel Anderson P. Shawn Irvin Akhito Kamata Julie Alonzo Gerald Tindal University of Oregon
Transcript of easyCBM Reading Fluency - University of Oregon€¦ · · 2016-04-04easyCBM® Slope Reliability:...

Technical Report # 1111
easyCBM® Slope Reliability: Letter Names, Word Reading Fluency, and Passage
Reading Fluency
Revised December 2011
Chalie Patarapichayatham
Daniel Anderson
P. Shawn Irvin
Akhito Kamata
Julie Alonzo
Gerald Tindal
University of Oregon

BehavioralResearchandTeachingUniversityofOregon•175Education5262UniversityofOregon•Eugene,OR97403‐5262Phone:541‐346‐3535•Fax:541‐346‐5689http://brt.uoregon.edu
Note:FundsforthisdatasetusedtogeneratethisreportcomefromafederalgrantawardedtotheUOfromtheInstituteofEducationSciences,U.S.DepartmentofEducation:AssessmentsAlignedwithGradeLevelContentStandardsandScaledtoReflectGrowthforStudentswithDisabilities(Award#R324A70188fundedfrom2007‐2011).
Copyright©2011.BehavioralResearchandTeaching.Allrightsreserved.Thispublication,orpartsthereof,maynotbeusedorreproducedinanymannerwithoutwrittenpermission.
TheUniversityofOregoniscommittedtothepolicythatallpersonsshallhaveequalaccesstoitsprograms,facilities,andemploymentwithoutregardtorace,color,creed,religion,nationalorigin,sex,age,maritalstatus,disability,publicassistancestatus,veteranstatus,orsexualorientation.Thisdocumentisavailableinalternativeformatsuponrequest.

easyCBM Slope Reliability
Abstract
Within a response to intervention (RTI) framework, students are administered multiple tests of
equivalent difficulty. Changes in students’ scores over time are then attributed to changes in
learning. In the current study, we evaluated the reliability of score changes (i.e., slope) for the
easyCBM® letter names, word reading fluency, and passage reading fluency measures. Data
came from a sample of convenience and included students taking at least three tests of one
measure type during one academic year (up to 38 weeks). Data were organized into bi-weekly
segments and a growth model for two parallel processes was conducted, with “A” weeks (2A,
3A, 4A, 5A, 6A, 7A, 8A, and 9A) in one process and “B” weeks (2B, 3B, 4B, 5B, 6B, 7B, 8B,
and 9B) in the other. A linear growth model was conducted in each process and the individual
slopes were estimated within the growth modeling framework. Then, the reliability of the slope
was estimated as the correlation between individual slopes from the two parallel processes with a
correction by the Spearman-Brown formula.

easyCBM Slope Reliability p. 1
easyCBM® Slope Reliability: Letter Names, Word Reading Fluency, and Passage Reading
Fluency
Revised December 2011
Perhaps the key component of response to intervention (RTI) is the ability to monitor and
evaluate changes in student learning progressions. In the general RTI model, teachers administer
screening measures to identify students in need of additional instructional attention. Once
students are identified, an intervention is provided with the intent of increasing the rate at which
the student learns the material. If the student responds to the intervention and the slope becomes
markedly steeper, then the teacher has gained evidence that a particular intervention works well
for that particular student. However, if the student does not respond to the intervention and
progress is not made, then the teacher has gained evidence that the intervention is not effective
for the student and a different intervention strategy should be explored. Thus learning gains
within RTI are used to evaluate both the rate the individual student is learning and the
effectiveness of a particular intervention strategy. Given the importance of these decisions, it is
paramount that the set of measures used provide reliable estimates of the growth slope over time.
In this technical report, we provide evidence for the reliability of the slope for three
easyCBM® reading measures: Letter Names, Word Reading Fluency, and Passage Reading
Fluency. A parallel processing linear growth model via structural equation modeling was applied
to extant data collected across the 2010-2011 school year.
Methods
In this section we describe the easyCBM® measures under investigation, the sample of
students included in each analysis, and the model applied.

easyCBM Slope Reliability p. 2
Measures
The easyCBM® reading measures were developed in 2006 specifically for use within an
RTI framework. There are 20 alternate forms of each measure type, each designed to be of
equivalent difficulty. Of the 20 measures available, three are designated for tri-annual benchmark
screening (fall, winter, and spring), with the remaining 17 designated for monitoring the progress
of students receiving an intervention. All assessments under investigation are fluency based.
Students are given 60 seconds to complete as much of the form as possible (i.e., naming letters,
reading words, or reading from a passage). Students’ self-corrections are treated as correct
responses while omissions are scored “missing”. All forms were created to be as comparable as
possible in terms of difficulty.
Letter names. For a full description of the development of the letter names measures,
see Alonzo and Tindal (2007b). The letter names measures were administered in kindergarten
and first grade to assess students’ fluency in naming letters of the English alphabet, both in lower
and upper case formats. During alternate form creation, each letter was treated as an item and a
unidimensional Rasch model was applied to estimate item difficulties. Letters in their lower and
upper case form were treated as separate items.
Word Reading Fluency. For a full description of the development of the word reading
fluency measures, see (Alonzo & Tindal, 2007a). The word reading fluency measures were
administered in kindergarten through third grade to assess students’ fluency with common “sight
words” and words following regular patterns of letter/sound correspondence in the English
language. During alternate form creation, an item bank of words was created. Each word was
treated as an item and a unidimensional Rasch model was applied to estimate item difficulties.
Dolch lists were the used to choose grade-level appropriate words.

easyCBM Slope Reliability p. 3
Passage Reading Fluency. For a full description of the development of the passage
reading fluency measures, see (Alonzo & Tindal, 2007a). The passage reading fluency measures
were administered in grades 1-8. Unlike the Letter Name and Word Reading Fluency measures, a
Rasch model could not be used to scale the forms because there are no distinct “items”. Rather,
the passage reading fluency measure consists of a passage of approximately 250 words of grade-
level appropriate text from which the student reads. Correlations and mean differences were used
to obtain information on the relative difficulty of each passage.
Data Sources and Preparation
All data used in this study were collected from an extant database. The easyCBM®
progress monitoring assessment system has several thousand users and the research reported here
capitalized on the existing data from users of the system. The raw data file contained student
scores for all progress monitoring assessments administered throughout the 2010-2011 school
year. In other words, any student who had taken at least one easyCBM® assessment during the
year and had data recorded into the online system were represented – totaling approximately
170,000 students per grade. The following steps were taken in cleaning the data file for the
purpose of this study:
a) Delete students with fewer than than 3 observed scores.
b) Delete students with off-grade level testing (i.e., if the measure grade does not equal the
students’ grade).
c) Delete students who performed at the 50th percentile or better on their first progress
monitoring measure.
d) Recode scores of 0 to missing data
e) Average students’ scores that occurred within 1 week.

easyCBM Slope Reliability p. 4
f) Collapse (average) weekly observations into bi-weekly segments.
Although there are certainly other steps that could have been taken in cleaning the data,
we felt each of these steps were necessary. Students with less than three time points were deleted
because their contribution in estimation of the overall rate of growth would be limited. This step
in the process generally resulted in the greatest drop in the overall sample size, as many students
were included with only one or two time points in the original data files. Data from students
taking measures outside of their grade-level were also eliminated because we wanted to ensure
the results would reflect students’ from the grade in which the measures were designed.
Additionally, because the purpose of easyCBM® progress monitoring measures is to track
students who are falling behind, we eliminated data from all students scoring at or above the 50th
percentile in their first progress monitoring measure. As Anderson, Lai, Alonzo, and Tindal
(2011) showed, easyCBM® measures are designed to optimally measure students performing
below expectations. The measures themselves are likely not as sensitive to the growth that
students performing above the 50th percentile make. Students’ with scores of 0 were recoded to
missing because the score was unlikely representative of the students’ true reading ability. For
example, the test form may have been inappropriately administered, as the student was unable to
access the scale. In this case, a score of 0 would not represent the ‘absence’ of reading ability but
instead an inability to access the language in the test form administered.
Students with multiple measures administered within the same week had the scores
averaged, resulting in a data file with one variable representing each week of the school year.
Scores within a week were averaged primarily as control for measurement error. For example, if
a student were administered two measures in one week and the student scored a 2 and 12, then a
score of 7 would likely be more representative of the students’ true ability than either the score

easyCBM Slope Reliability p. 5
of 2 or 12. Finally, the weekly variables were collapsed into bi-weekly segments to reduce the
sparseness of the data, which also increased the sample size within each time segment.
Collapsing to bi-weekly segments also allowed more time to pass between time points so the
changes in score would be more likely to be representative of students’ learning.
Data Analysis
This study aimed to estimate the reliability of the slope for three easyCBM®measures.
Under a structural equation modeling (SEM) framework, a growth model with two parallel
growth processes was used. Essentially, two linear growth models were simultaneously modeled.
The two parallel growth processes were established by splitting the available time segments into
two groups. One group of time segments was used to form one linear growth process, and
another group of time segments was used to form another linear growth process. For each linear
growth process, the individual slopes of growth were estimated as factor scores of the latent
slope factor. Then, the correlation between individual slopes from the two parallel growth
processes was computed as an estimate of the reliability of the growth slope. The Spearman-
Brown formula was then used to correct the correlation coefficient because each process had
only half the available time represented.
The procedure was analogous to VanDerHeyden and Burns (2008). In order to estimate
the reliability of a slope, they (1) split a series of longitudinal observations into two parallel
series, (2) computed an OLS regression slope for each individual for each series, (3) computed
the correlation of the individual slopes between the two parallel series, and (4) corrected the
correlation by the Spearman-Brown formula. Our procedure was exactly the same as
VanDerHyden and Burns’ four-step procedure, with one exception. For step 2 VanDerHyden and
Burns’s derived a direct estimate of individual slopes based only on the observed measures of

easyCBM Slope Reliability p. 6
each student. By contrast, our method used empirical Bayes estimates of individual slopes (e.g.,
Raudenbush & Bryk, 2002) that incorporated information about the estimated mean slope and
the estimated variance of individual slopes from the entire sample data.
The bi-weekly segments were evenly split into two parallel processes in the following
manner. The first bi-weekly segment (average of weeks 1 and 2) was labeled 1A and assigned to
a group of time segments for one linear growth process (Process A). The second bi-weekly
segment (average of weeks 3 and 4) was labeled 1B and assigned to a group of time segments for
another linear growth process (Process B). Similarly, the third bi-weekly segment (average of
weeks 5 and 6) was labeled 2A and assigned to Process A, while the fourth bi-weekly segment
(average of weeks 7 and 8) was labeled 2B and assigned to Process B. This pattern continued for
the entire available bi-weekly segments, totaling 20 time segments, 1A – 10B, across 38 weeks
of the school year. However, in many grades there were zero or near-zero students represented in
the first two time segments (1A and 1B) and the last two time segments (10A and 10B). Also,
there were other time segments with very few observations for some of the data sets. As a part of
data cleaning process, descriptive statistics for each time segment for each data set were
examined, and time segments with zero or near-zero students represented were deleted from the
data.
In each data set, the linear growth model for two parallel processes was fit. The first
linear growth model (Process A) was fit with the “A” time segments (2A, 3A, 4A, 5A, 6A, 7A,
8A, and 9A), whereas the second linear growth model (Process B) was fit with the “B” time
segments (2B, 3B, 4B, 5B, 6B, 7B, 8B, and 9B). For both growth processes, the time scores of
the growth slope factor were fixed to 0, 1, 2, 3, 4, 5, 6, 7, and 8 to define a linear growth model
with equal time intervals between time segments. The zero time score for the growth slope factor

easyCBM Slope Reliability p. 7
at time segment one defines the intercept, initial status factors. On the other hand, the
coefficients of the growth intercept factors were fixed at one as part of the regular growth model
parameterization. The residual variances of the outcome variables (observed test scores) were
estimated but fixed to be the same across time segments. Also, it was assumed that the residuals
were not correlated. On the other hand, the growth slope factors were assumed to be correlated.
The correlation between the two growth slope factors from the two growth processes, was
interpreted as the reliability of the slope of the growth. All parameters were estimated with the
Mplus software, using the Maximum Likelihood estimator with robust standard error. Note that
due to some problems emerging during model parameter estimation, further data cleaning was
pursued for some of the data sets, resulting in deletion of more time segments. All deleted time
segments are displayed in bold-faced font in Tables 3 - 15.
Results
The slope reliability estimates are displayed in Table 1. The total sample sizes for each
analysis are displayed in Table 2 and ranged from 122 to 1,146 depending on the data set. The
sample size, means, and standard deviations are reported for each time point for the letter names
measures in Tables 3 – 4, word reading fluency in Tables 5 – 7, and passage reading fluency in
Tables 8 – 13. Overall, the slope reliabilities were high, all above .8 across measures and grades.
The standard errors of the estimated reliabilities ranged from .017 to .194 across measures and
grades.
Discussion
This study capitalized on an extant database to explore the reliability of the slope for the
easyCBM® letter names, word reading fluency, and passage reading fluency. Overall, the results
indicated that the observed slope – the rate at which easyCBM® scores change – was quite

easyCBM Slope Reliability p. 8
reliable. Coefficients were generally above .9 and were universally above .8. This study provides
increased evidence that changes in the easyCBM® observed scores are stable for letter names,
word reading fluency, and passage reading fluency.

easyCBM Slope Reliability p. 8
References
Alonzo, J., & Tindal, G. (2007a). The development of word and passage reading fluency
measures in a progress monitoring assessment system (Technical Report No. 40). Eugene,
OR: Behavioral Research and Teaching, University of Oregon.
Alonzo, J., & Tindal, G. (2007b). Examining the technical adequacy of early literacy measures
in a progress monitoring assessment system: Letter names, letter sounds, and phoneme
segmenting (Technical Report No. 39). Eugene, OR: Behavioral Research and Teaching,
University of Oregon.
Anderson, D., Lai, C., Alonzo, J., & Tindal, G. (2011). Examining a grade-level math CBM
designed for persistently low-performing students. Educational Assessment, 16, 15-34. doi:
10.1080/10627197.2011.551084
Muthén, L. K., & Muthén, B. O. (1998-2007). Mplus User's Guide (Fifth ed.). Los Angeles:
Authors.
Muthén, L. K., & Muthén, B. O. (2009). Mplus version 5.21 [computer software]. Los Angeles:
Authors.
Raudenbush, S. W., & Bryk, A. (2002). Hierarchical linear models: Applications and data
analysis methods. Newbury Park, CA: Sage.
VanDerHeyden, A. M., Burns, M. K. (2008). Examination of the utility of verious measures of
mathematics proficiency. Assessment for Effective Intervention. 33, 215-224.

easyCBM Slope Reliability p. 9
Table 1 Reliability coefficients
Grade Letter Names Word Reading Passage Reading
K .859 - -
1 .753 .812 .711
2 - .881 .869
3 - .853 .805
4 - - .820
5 - - .841
6 - - .775
7 - - .805
8 - - .495
Note. Values represent Spearman-Brown corrected correlation coefficient between each half of the parallel process model.

easyCBM Slope Reliability p. 10
Table 2 Sample size for each model
Grade Letter Names Word Reading Passage Reading
K 504 - -
1 210 937 810
2 - 665 385
3 - 122 966
4 - - 1,020
5 - - 1,146
6 - - 411
7 - - 393
8 - - 287
Note. Values represent Spearman-Brown corrected correlation coefficient between each half of the parallel process model.

easyCBM Slope Reliability p. 11
Table 3 Letter Names Descriptive Statistics: Grade K
Time Point N Minimum Maximum Mean Std. Deviation 1A 20 1 11 4.60 3.119 1B 29 1 12 7.10 3.244 2A 116 1 15 6.54 3.681 2B 169 1 35 8.79 5.649 3A 145 1 37 10.24 7.079 3B 170 1 50 13.51 8.600 4A 254 1 51 15.59 10.135 4B 86 2 38 14.01 7.995 5A 140 1 48 20.84 11.191 5B 131 2 59 23.39 12.661 6A 155 2 47 19.79 10.576 6B 303 1 75 23.63 12.848 7A 244 2 60 25.81 11.684 7B 261 2 82 28.28 14.321 8A 129 1 61 27.41 11.521 8B 212 2 96 31.09 14.787 9A 167 2 66 28.10 11.237 9B 99 5 69 29.27 12.401 10A 68 5 56 31.14 11.726 10B 0 Valid N (listwise) 0

easyCBM Slope Reliability p. 12
Table 4 Letter Names Descriptive Statistics: Grade 1
Time Point N Minimum Maximum Mean Std. Deviation 1A 3 3 37 23.00 17.776 1B 31 6 40 27.74 8.869 2A 56 1 44 28.07 9.691 2B 105 8 62 32.58 8.846 3A 95 3 60 33.62 10.396 3B 64 6 56 35.66 10.285 4A 88 7 93 37.64 11.059 4B 17 9 56 34.29 12.444 5A 33 8 93 41.73 14.481 5B 64 3 75 43.81 11.863 6A 32 26 70 44.53 10.770 6B 65 9 81 45.14 11.849 7A 56 8 75 47.06 13.447 7B 65 14 87 48.73 14.789 8A 46 18 68 49.48 10.994 8B 38 10 87 48.78 17.435 9A 45 28 98 53.01 16.205 9B 18 2 75 50.33 17.852 10A 26 26 78 57.35 12.270 10B 0 Valid N (listwise) 0

easyCBM Slope Reliability p. 13
Table 5 Word Reading Fluency Descriptive Statistics: Grade 1
Time Point N Minimum Maximum Mean Std. Deviation 1A 19 1 8 2.79 2.123 1B 68 1 8 3.87 1.939 2A 193 1 11 4.82 2.336 2B 263 1 19 6.26 2.991 3A 302 1 25 6.88 3.953 3B 226 1 19 8.04 3.588 4A 382 1 21 9.97 4.491 4B 87 1 26 12.57 5.098 5A 119 1 24 10.50 4.627 5B 252 1 46 13.59 6.799 6A 327 2 42 13.26 5.761 6B 485 1 36 13.82 5.961 7A 501 1 58 16.43 8.098 7B 445 3 61 18.23 8.359 8A 337 1 53 18.46 9.120 8B 438 1 63 20.11 9.019 9A 486 3 59 21.29 9.990 9B 395 2 68 23.52 11.607 10A 152 5 64 26.05 11.651 10B 0 Valid N (listwise) 0

easyCBM Slope Reliability p. 14
Table 6 Word Reading Fluency Descriptive Statistics: Grade 2
Time Point N Minimum Maximum Mean Std. Deviation 1A 3 7 25 18.67 10.116 1B 119 4 37 17.97 7.829 2A 221 1 39 16.29 8.028 2B 346 1 56 19.24 9.024 3A 300 1 53 21.36 9.431 3B 315 3 116 22.50 11.155 4A 299 2 48 22.90 10.172 4B 130 3 55 23.72 11.172 5A 161 4 61 25.93 11.175 5B 191 4 56 28.65 11.471 6A 205 4 60 29.39 11.781 6B 354 3 64 29.74 12.478 7A 317 3 69 33.25 13.697 7B 275 3 66 31.84 13.523 8A 180 5 68 32.98 13.586 8B 259 4 67 35.13 13.398 9A 291 6 71 35.71 14.153 9B 193 8 78 38.59 14.657 10A 79 4 71 38.31 18.618 10B 0 Valid N (listwise) 0

easyCBM Slope Reliability p. 15
Table 7 Word Reading Fluency Descriptive Statistics: Grade 3
Time Point N Minimum Maximum Mean Std. Deviation 1A 1 9 9 9.00 . 1B 10 7 17 13.40 4.300 2A 46 4 25 15.52 6.221 2B 67 2 38 16.97 7.448 3A 52 5 38 16.40 8.059 3B 21 10 40 21.17 7.506 4A 60 6 36 19.95 7.597 4B 21 5 32 17.38 9.030 5A 10 9 35 21.10 8.399 5B 21 6 33 18.81 6.772 6A 22 9 41 24.41 10.617 6B 50 8 39 23.98 8.241 7A 33 4 40 22.92 9.715 7B 45 5 50 25.37 10.412 8A 27 5 76 32.41 14.058 8B 28 11 46 26.87 10.584 9A 58 7 53 28.48 11.622 9B 22 14 46 32.55 9.679 10A 17 14 50 31.75 10.793 10B 0 Valid N (listwise) 0

easyCBM Slope Reliability p. 16
Table 8 Passage Reading Fluency Descriptive Statistics: Grade 1
Time Point N Minimum Maximum Mean Std. Deviation 1A 0 1B 1 2 2 2.00 . 2A 16 1 7 4.31 2.213 2B 49 1 22 5.12 4.246 3A 41 1 26 4.98 4.156 3B 38 1 17 6.00 3.817 4A 124 1 40 8.37 5.510 4B 60 1 31 12.76 6.452 5A 86 1 35 10.80 6.581 5B 184 1 47 12.14 6.947 6A 277 1 58 13.97 7.349 6B 438 2 45 15.53 7.924 7A 505 1 68 19.11 10.247 7B 495 1 67 19.53 10.532 8A 315 1 69 21.82 12.991 8B 495 2 64 24.45 12.437 9A 547 1 79 26.17 15.366 9B 380 1 74 28.80 14.675 10A 191 2 92 33.95 19.907 10B 0 Valid N (listwise) 0

easyCBM Slope Reliability p. 17
Table 9 Passage Reading Fluency Descriptive Statistics: Grade 2
Time Point N Minimum Maximum Mean Std. Deviation 1A 20 5 25 15.13 7.095 1B 76 2 33 16.24 5.866 2A 188 2 68 17.92 9.289 2B 231 2 107 22.09 11.055 3A 192 3 56 24.34 11.508 3B 156 2 52 26.88 11.840 4A 223 2 64 27.52 12.182 4B 77 3 60 27.91 14.305 5A 78 4 109 34.53 16.921 5B 114 1 106 32.75 16.851 6A 154 5 85 36.37 14.848 6B 244 2 95 38.15 18.366 7A 218 4 116 42.19 17.070 7B 199 3 102 43.16 19.132 8A 172 5 114 43.65 19.426 8B 198 1 100 46.25 19.675 9A 211 1 101 44.94 19.092 9B 128 2 121 51.75 22.460 10A 69 9 108 56.57 25.595 10B 0 Valid N (listwise) 0

easyCBM Slope Reliability p. 18
Table 10 Passage Reading Fluency Descriptive Statistics: Grade 3
Time Point N Minimum Maximum Mean Std. Deviation 1A 67 11 83 56.47 18.686 1B 178 1 91 55.60 18.804 2A 345 7 111 59.73 18.196 2B 599 2 133 62.37 20.324 3A 421 8 123 66.87 20.550 3B 430 11 119 70.43 19.932 4A 513 13 127 70.41 22.567 4B 216 7 114 73.54 22.218 5A 192 4 121 72.73 21.610 5B 270 10 132 75.44 21.963 6A 356 4 142 79.81 21.891 6B 620 11 216 81.83 22.258 7A 480 9 146 80.60 22.209 7B 559 14 137 82.89 22.475 8A 377 13 148 84.76 22.452 8B 469 8 162 83.86 23.098 9A 541 15 165 85.83 23.066 9B 343 9 164 88.37 21.825 10A 159 8 130 86.70 23.729 10B 0 Valid N (listwise) 0

easyCBM Slope Reliability p. 19
Table 11 Passage Reading Fluency Descriptive Statistics: Grade 4
Time Point N Minimum Maximum Mean Std. Deviation 1A 69 19 105 84.43 18.920 1B 144 18 116 79.26 17.920 2A 376 6 137 84.40 20.936 2B 469 9 131 84.66 19.716 3A 503 15 146 89.60 20.592 3B 393 24 154 90.90 19.570 4A 526 3 141 88.52 24.672 4B 192 25 139 95.81 20.114 5A 206 28 146 97.46 21.059 5B 303 3 144 95.75 22.513 6A 408 22 150 98.43 19.995 6B 566 11 167 95.61 22.568 7A 572 1 177 103.87 21.589 7B 542 7 153 101.14 23.824 8A 288 42 172 102.30 22.041 8B 470 12 179 105.82 22.808 9A 482 2 188 105.76 23.781 9B 364 36 152 109.97 20.607 10A 185 50 180 106.93 23.704 10B 0 Valid N (listwise) 0

easyCBM Slope Reliability p. 20
Table 12 Passage Reading Fluency Descriptive Statistics: Grade 5
Time Point N Minimum Maximum Mean Std. Deviation 1A 36 39 147 105.79 23.321 1B 174 9 160 105.86 24.709 2A 427 5 193 107.04 25.446 2B 533 14 198 108.46 28.131 3A 602 13 211 113.55 27.905 3B 447 15 215 117.47 27.610 4A 543 16 205 119.96 28.706 4B 255 12 175 116.08 28.179 5A 244 29 186 119.58 26.595 5B 380 51 190 120.86 26.571 6A 367 41 203 122.00 25.512 6B 494 20 203 120.45 28.536 7A 604 11 220 124.66 28.630 7B 482 41 194 122.30 26.689 8A 297 44 184 121.77 25.861 8B 461 22 214 126.40 29.502 9A 521 2 201 126.97 27.834 9B 296 1 217 126.52 28.365 10A 174 27 223 130.00 29.236 10B 0 Valid N (listwise) 0
easyCBM Slope Reliability p. 21
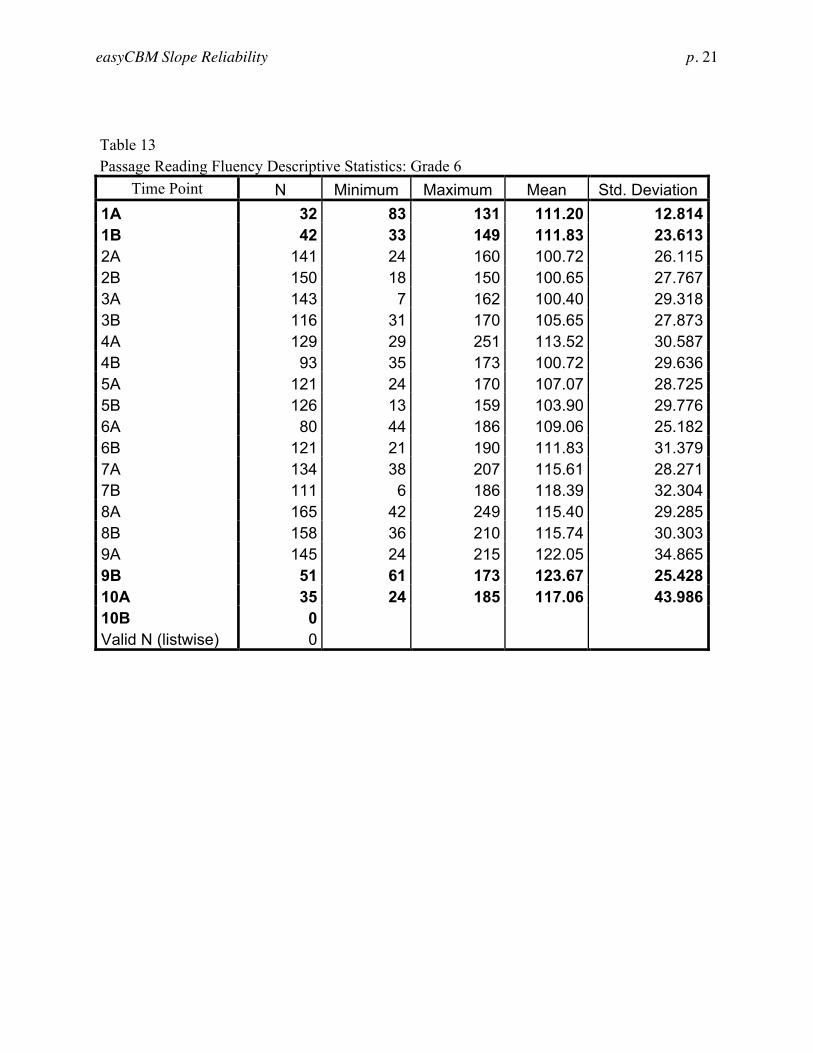
Table 13 Passage Reading Fluency Descriptive Statistics: Grade 6
Time Point N Minimum Maximum Mean Std. Deviation 1A 32 83 131 111.20 12.814 1B 42 33 149 111.83 23.613 2A 141 24 160 100.72 26.115 2B 150 18 150 100.65 27.767 3A 143 7 162 100.40 29.318 3B 116 31 170 105.65 27.873 4A 129 29 251 113.52 30.587 4B 93 35 173 100.72 29.636 5A 121 24 170 107.07 28.725 5B 126 13 159 103.90 29.776 6A 80 44 186 109.06 25.182 6B 121 21 190 111.83 31.379 7A 134 38 207 115.61 28.271 7B 111 6 186 118.39 32.304 8A 165 42 249 115.40 29.285 8B 158 36 210 115.74 30.303 9A 145 24 215 122.05 34.865 9B 51 61 173 123.67 25.428 10A 35 24 185 117.06 43.986 10B 0 Valid N (listwise) 0

easyCBM Slope Reliability p. 22
Table 14 Passage Reading Fluency Descriptive Statistics: Grade 7
Time Point N Minimum Maximum Mean Std. Deviation 1A 51 44 150 112.82 24.775 1B 43 85 175 132.47 20.536 2A 109 36 170 112.83 26.431 2B 175 30 175 116.14 27.849 3A 118 23 187 120.32 26.762 3B 81 28 203 121.96 27.377 4A 192 4 185 108.18 34.597 4B 73 40 178 107.96 30.366 5A 86 44 177 108.37 29.759 5B 106 16 170 115.05 31.199 6A 141 22 192 128.26 30.802 6B 140 19 183 114.52 28.089 7A 128 45 175 119.52 27.167 7B 91 34 189 116.29 31.463 8A 90 40 186 128.24 26.770 8B 107 63 185 125.76 27.152 9A 149 23 196 123.50 33.089 9B 67 24 180 110.44 31.384 10A 14 60 154 110.29 30.603 10B 0 Valid N (listwise) 0

easyCBM Slope Reliability p. 23
Table 15 Passage Reading Fluency Descriptive Statistics: Grade 8
Time Point N Minimum Maximum Mean Std. Deviation 1A 63 27 164 110.27 29.750 1B 59 32 164 112.75 29.061 2A 101 2 166 110.13 33.963 2B 129 38 185 113.76 32.149 3A 77 30 199 116.07 33.171 3B 83 44 170 121.17 27.604 4A 106 23 176 122.83 28.678 4B 24 49 164 120.00 26.459 5A 29 63 178 124.10 29.873 5B 47 62 195 134.73 27.731 6A 96 50 209 134.13 30.603 6B 108 78 177 130.73 20.602 7A 83 43 196 134.21 25.094 7B 79 31 180 121.50 29.533 8A 46 57 178 127.38 25.972 8B 57 57 190 122.55 27.817 9A 117 40 208 135.35 28.333 9B 44 24 205 126.70 36.000 10A 6 103 145 128.50 16.909 10B 0 Valid N (listwise) 0