Easy Fraud Detection Presentation to NSAA IT Conference – Raleigh, NC October 2, 2013 By Dan...
41
Easy Fraud Detection Presentation to NSAA IT Conference – Raleigh, NC October 2, 2013 By Dan Boulden
-
Upload
elisabeth-arnold -
Category
Documents
-
view
217 -
download
0
Transcript of Easy Fraud Detection Presentation to NSAA IT Conference – Raleigh, NC October 2, 2013 By Dan...

Easy Fraud DetectionPresentation to
NSAA IT Conference – Raleigh, NC
October 2, 2013
By
Dan Boulden
Easy Fraud Detection
• Objectives:
– An example of fraud in fast food sales
– How this effects the bottom line
– Some ways to detect fraud using ACL

The Setup

The Happy Cashier
IIII

The Happy Cashier
IIIII
No-Sale

The Call
The Call

The Return Call

The True Cost
Cost Per Hour of Fraud is ~$7.00Or 20% of the Total Employee Cost
ManagerFRAUDEmp 1Emp 2Emp 3

Fraud
• New ways to commit fraud all the time• Learn to look for the signs of fraud
– Use common sense– Stop and think… Does this look right?
» If not, investigate
• Automate what you can and review the results– Makes it easy
» So you do it
– Makes it automatic» So you don’t forget
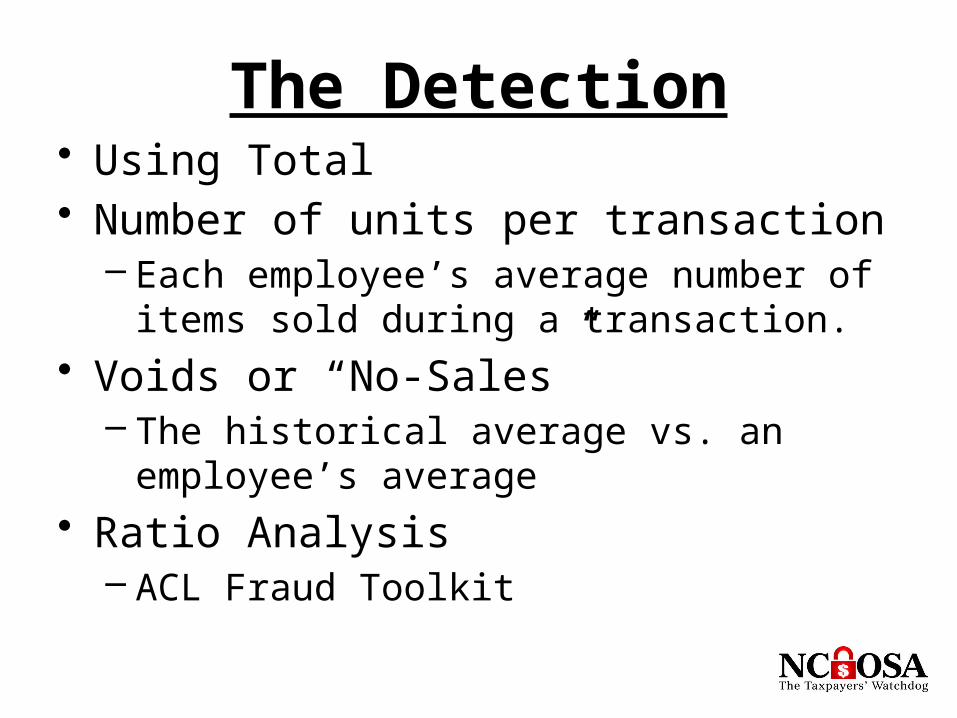
The Detection• Using Total• Number of units per transaction
– Each employee’s average number of items sold during a transaction.
• Voids or “No-Sales”– The historical average vs. an employee’s
average• Ratio Analysis
– ACL Fraud Toolkit

Using Total
• Total– Look at the total sales during a like period– In this case, during the same month time
• 2012 = 2,168 pizzas sold• 2013 = 2,059 pizzas sold
» 5% drop

Using Total
• Total– Look at the total sales during a like period– In this case, during the same month time
• 2012 = 2,168 pizzas sold• 2013 = 2,059 pizzas sold
» 5% drop
– Is this a red flag?

Using Total
• Total– Look at the total sales during a like period– In this case, during the same month time
• 2012 = 2,168 pizzas sold• 2013 = 2,059 pizzas sold
» 5% drop
– Is this a red flag?
– What are some reasons this might not indicate fraud?

Total for both 2012 & 2013
109 less than 2012
$647.32 less than 2012

Units per transaction
• Number of units per transaction– Each employee’s average number of items
sold during a transaction.

Units per transaction
• Number of units per transaction– Each employee’s average number of items
sold during a transaction.– Summarize on Employee Number subtotaling
the Number of Pizzas sold to a new table.

Units per transaction
• Number of units per transaction– Create a new COMPUTED field
» With a value of “Number_of_Pizzas / COUNT”

Units per transaction
•Why does it not look right–(everything is “2”)

Units per transaction
• Number of units per transaction– To view the decimal points in the computed
field, at least one of the fields it is computed from must have the precision that you want.
– In other words if you want two decimal places [“1.00” instead of “1”] then you need to have two decimal places turned on in one of the fields that the computed field is using.

Units per transaction
•Now it looks right

Number of No-Sales
• Look at the number of No-Sales compared to historical averages.
• The historical average = 2 per 8 hour shift– There is always one for the mid-shift cash pull– There is an additional 0 to 2 normally.– The person committing the fraud averaged 12
per 8 hour shift.

Number of No-Sales
• The red flag really sticks out when you look at the number of no-sales over a longer period of time.
• There can be reasons for a large number of no-sales in a single day, but over time it should still average ~2
• What are some reasons for a large amount of no-sales in a single shift?

Number of No-Sales
• In ACL we can perform the same Summarize that we did before and simply add an IF statement.
• Number_of_Pizzas = 0• This will summarize the number of times
each employee opened the register without selling anything.

Number of No-Sales
One Week Period

Number of No-Sales
• How to find potential problems in a large number of employees

Number of No-Sales
• How to find potential problems in a large number of employees
• Quick Sort Descending

Number of No-Sales
• How to find potential problems in a large number of employees
• Quick Sort Descending• Extract Data
IF COUNT > X
Also add a Quick Sort Descending to have the largest amounts at the top as you may want to investigate them first.

David Coderre
Fraud
Analysis
Techniques
Using ACL
• Published by John Wiley & Sons, Inc. 2009• ISBN: 978-0-470-39244-7• UPC: 9780470392447 List Price $210.50

Organize the toolkit
Put the 30+ scripts in a subfolder
I like to keep the start script in theMain area so it is easy to find and Run

Fraud Menu

Ratio Analysis
• For this exercise we pick the following…

Ratio Analysis

Ratio Analysis

Ratio Analysis

Ratio Analysis

Ratio Analysis

Ratio Analysis
Change COUNT to have 3 decimalsAdd computed fieldsField = PPTExpression Number_of_Pizzas / CountField = Plus_MinusExpression PPT - 2.168

Ratio Analysis
PPT = Pizzas per transaction (# of Pizzas ¸ Count)
Emp 1 = 568 pizzas (2.272 PPT) = +0.104Emp 2 = 549 pizzas (2.196 PPT) = +0.028Emp 3 = 508 pizzas (2.032 PPT) = -0.136Emp 4 = 434 pizzas (1.736 PPT) = -0.432
AVG for 2012 = 2.168(+/- above is against 2012 AVG)

Easy Fraud Detection
Summary:Fraud is all around us
Taking time to look for it can save $’s
Much fraud is easy to detect » if you know how and have the right tools.
Stop and think… Does this look right?» If not, investigate

Questions?