Eastern Mediterranean...
88
Eastern Mediterranean University Faculty of Engineering Department of Mechanical Engineering MENG411 Capstone Team Project Course Coordinator Assist. Prof. Dr. Mostafa Ranjbar Project Supervisor Lec. Cafer Kızılörs Name of the Project Wave Power Generator (W.P.G) Prepared by: Group 08 A.I.A Team Members: Mhd Imad Eddin Khchifati 138484 Abdullah Terkaoui 138565 Awad Alterkaoui 138566 July 2015
Transcript of Eastern Mediterranean...

Eastern Mediterranean University
Faculty of Engineering
Department of Mechanical Engineering
MENG411 Capstone Team Project
Course Coordinator
Assist. Prof. Dr. Mostafa Ranjbar
Project Supervisor
Lec. Cafer Kızılörs
Name of the Project
Wave Power Generator (W.P.G)
Prepared by:
Group 08 A.I.A
Team Members:
Mhd Imad Eddin Khchifati 138484
Abdullah Terkaoui 138565
Awad Alterkaoui 138566
July 2015

I
Jury Members:
Lec. Cafer Kızılörs
Prof. Dr. Fuat Egelioğlu
Dr. Davut Solyali

I I
ABSTRACT
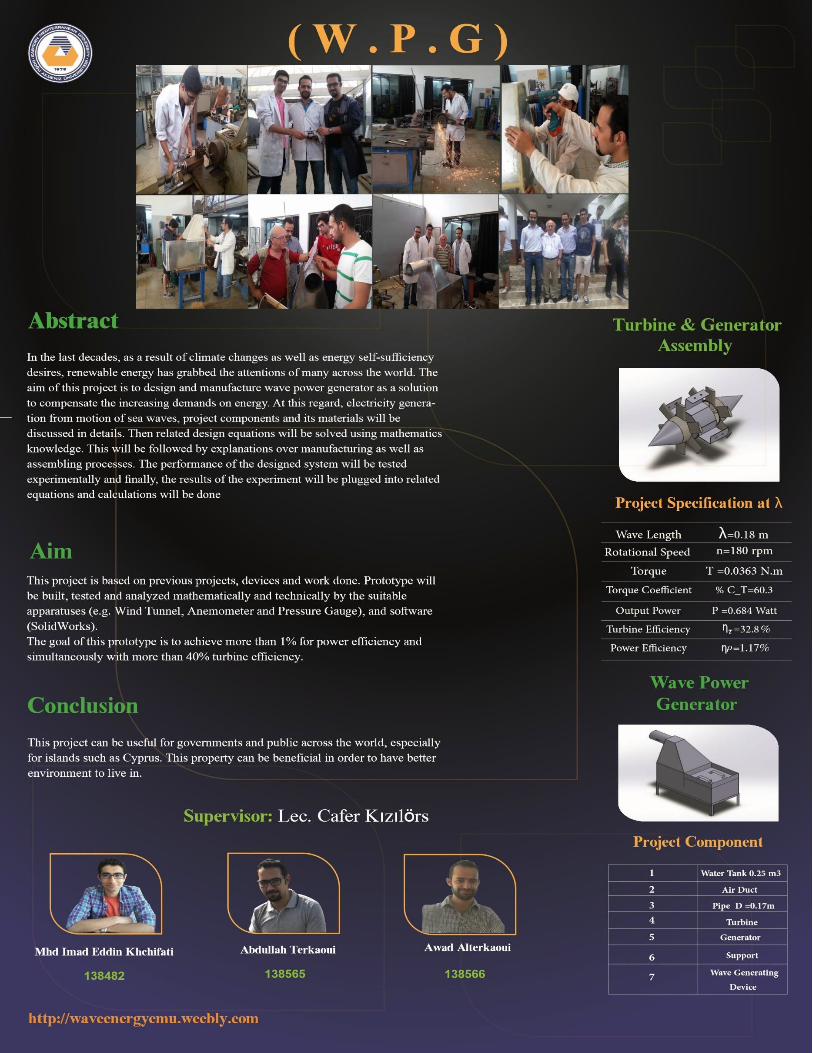
This report is about wave power generator. In the last decades, as a result of climate
changes as well as energy self-sufficiency desires, renewable energy has grabbed the attentions
of many across the world. The aim of this project is to design and manufacture wave power
generator as a solution to compensate the increasing demands on energy. At this regard,
electricity generation from motion of sea waves, project components and its materials will be
discussed in details. Then related design equations will be solved using mathematics knowledge.
This will be followed by explanations over manufacturing as well as assembling processes. The
performance of the designed system will be tested experimentally and finally, the obtained
values of efficiencies are ƞ𝑡 = 32.8 % for the turbine efficiency and ƞ𝑃 = 1.17% for power
efficiency. As a conclusion, this project can be useful for governments and public across the
world, especially for islands such as Cyprus.
Key words: Renewable energy, wave energy, water column, turbine blades, turbine, generator.

I I I
LIST OF SYMBOLS
A Cross-section-area (m²).
b Blade length(m).
c Chord length (m).
𝐶𝑑 Drag coefficient (non-dimensional number).
𝐶𝑙 Lift coefficient (non-dimensional number).
𝐶𝑇 Torque coefficient (%).
D Diameter of the pipe (m).
𝐹𝑎 Axial force acting on the airfoil blade (Newton).
Ft Tangential force acting on airfoil blade (Newton).
g Acceleration of gravity (m/s²).
L/D Pipe length to diameter ratio.
N Number of blades.
n Number of revolution.
P Power (watt).
Δp Pressure loss (Pa).
𝛥𝑃𝑇 Total pressure drop.
𝑅𝑎𝑣 Average radius of the blades (m).
𝑅𝐻 Hub radius (m).
I V
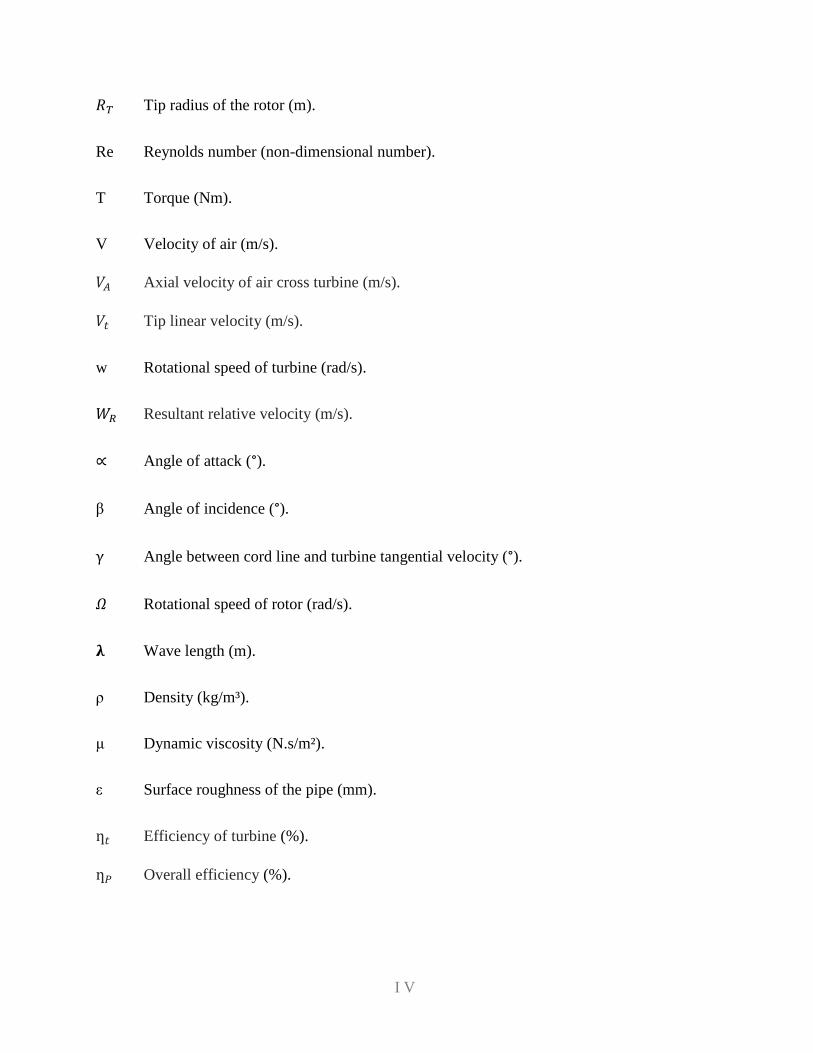
𝑅𝑇 Tip radius of the rotor (m).
Re Reynolds number (non-dimensional number).
T Torque (Nm).
V Velocity of air (m/s).
𝑉𝐴 Axial velocity of air cross turbine (m/s).
𝑉𝑡 Tip linear velocity (m/s).
w Rotational speed of turbine (rad/s).
𝑊𝑅 Resultant relative velocity (m/s).
∝ Angle of attack (°).
β Angle of incidence (°).
γ Angle between cord line and turbine tangential velocity (°).
𝛺 Rotational speed of rotor (rad/s).
𝛌 Wave length (m).
ρ Density (kg/m³).
μ Dynamic viscosity (N.s/m²).
ε Surface roughness of the pipe (mm).
ƞ𝑡 Efficiency of turbine (%).
ƞ𝑃 Overall efficiency (%).

V
TABLE OF CONTENTS
CHAPTER I: INTRODUCTION .................................................................................................... 1
1.1 Why Renewable Energy? ...................................................................................................... 1
1.2 Renewable Energy Resources ............................................................................................... 1
1.2.1 Solar Energy: ................................................................................................................. 1
1.2.2 Wind Energy: ................................................................................................................. 2
1.2.3 Wave Energy:................................................................................................................. 2
1.2.4 Hydroelectricity: ............................................................................................................ 2
1.3 Wave Energy in Details ........................................................................................................ 2
1.4 Project Objectives ................................................................................................................. 3
1.5 Organization of the Report .................................................................................................... 3
CHAPTER II: LITERATURE REVIEW ....................................................................................... 4
2.1 Recent History of Wave Energy ........................................................................................... 4
2.2 Wave Energy Potential in Cyprus ......................................................................................... 5
2.3 Wave Energy Devices ........................................................................................................... 7
2.3.1 Oscillating Water Column (OWC) (the Limpet) ........................................................... 7
2.3.2 Pelamis Sea Snake ......................................................................................................... 8
2.3.3 PowerBuoy ..................................................................................................................... 8
2.4 Advantages and Disadvantages............................................................................................. 9
2.4.1. Limpet ......................................................................................................................... 10
2.4.2. Pelamis Sea Snake ...................................................................................................... 10
2.4.3 PowerBouy ................................................................................................................... 10
CHAPTER III: DESIGN & ANALYSIS ...................................................................................... 11
3.1 Prototype Components ........................................................................................................ 11
3.1.1 Container, Air Duct, Pipe, Wave Generating Device & Support ................................ 11

V I
3.1.3 Turbine ......................................................................................................................... 12
3.1.4 Generator...................................................................................................................... 13
3.2 Material Selection and manufacturing methods ................................................................. 14
3.2.1 Galvanized Steel .......................................................................................................... 14
3.2.2 Angle Iron .................................................................................................................... 14
3.2.3 ABS-FDM Plastic ........................................................................................................ 15
3.2.4 Polystyrene ................................................................................................................... 15
3.2.5 Manufacturing Methods ............................................................................................... 15
3.3 Calculations......................................................................................................................... 15
3.3.1 Wave Velocity and Airflow ......................................................................................... 15
3.2.2 Turbine Calculations .................................................................................................... 17
3.4 Theoretical Results.............................................................................................................. 20
3.5 Cost Analysis and Suppliers List ........................................................................................ 24
3.5.1 Required Parts List ....................................................................................................... 24
3.5.2 Costs of Ordered Materials .......................................................................................... 25
3.5.3 Suppliers List ............................................................................................................... 25
CHAPTER IV: MANUFACTURIN, ASSEMBLY & TESTING ................................................ 26
4.1 Manufacturing ..................................................................................................................... 26
4.1.1 Container & Air Duct................................................................................................... 26
4.1.2 Pipe & Wave Generating Device ................................................................................. 28
4.1.3 Prototype Support ........................................................................................................ 29
4.1.4 Turbine Blades ............................................................................................................. 30
4.1.5 Generator...................................................................................................................... 30
4.2 Assembly............................................................................................................................. 32
Testing of Final Product............................................................................................................ 34
V I I
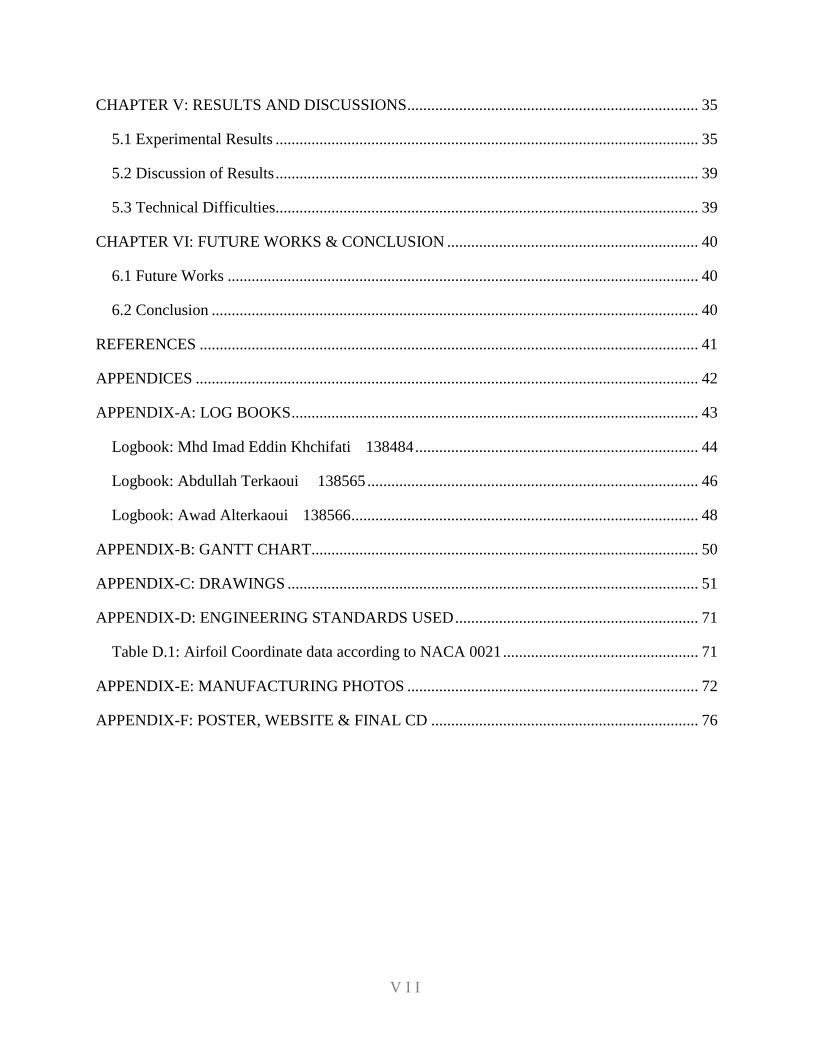
CHAPTER V: RESULTS AND DISCUSSIONS......................................................................... 35
5.1 Experimental Results .......................................................................................................... 35
5.2 Discussion of Results .......................................................................................................... 39
5.3 Technical Difficulties.......................................................................................................... 39
CHAPTER VI: FUTURE WORKS & CONCLUSION ............................................................... 40
6.1 Future Works ...................................................................................................................... 40
6.2 Conclusion .......................................................................................................................... 40
REFERENCES ............................................................................................................................. 41
APPENDICES .............................................................................................................................. 42
APPENDIX-A: LOG BOOKS ...................................................................................................... 43
Logbook: Mhd Imad Eddin Khchifati 138484 ....................................................................... 44
Logbook: Abdullah Terkaoui 138565 ................................................................................... 46
Logbook: Awad Alterkaoui 138566 ....................................................................................... 48
APPENDIX-B: GANTT CHART................................................................................................. 50
APPENDIX-C: DRAWINGS ....................................................................................................... 51
APPENDIX-D: ENGINEERING STANDARDS USED ............................................................. 71
Table D.1: Airfoil Coordinate data according to NACA 0021 ................................................. 71
APPENDIX-E: MANUFACTURING PHOTOS ......................................................................... 72
APPENDIX-F: POSTER, WEBSITE & FINAL CD ................................................................... 76
V I I I
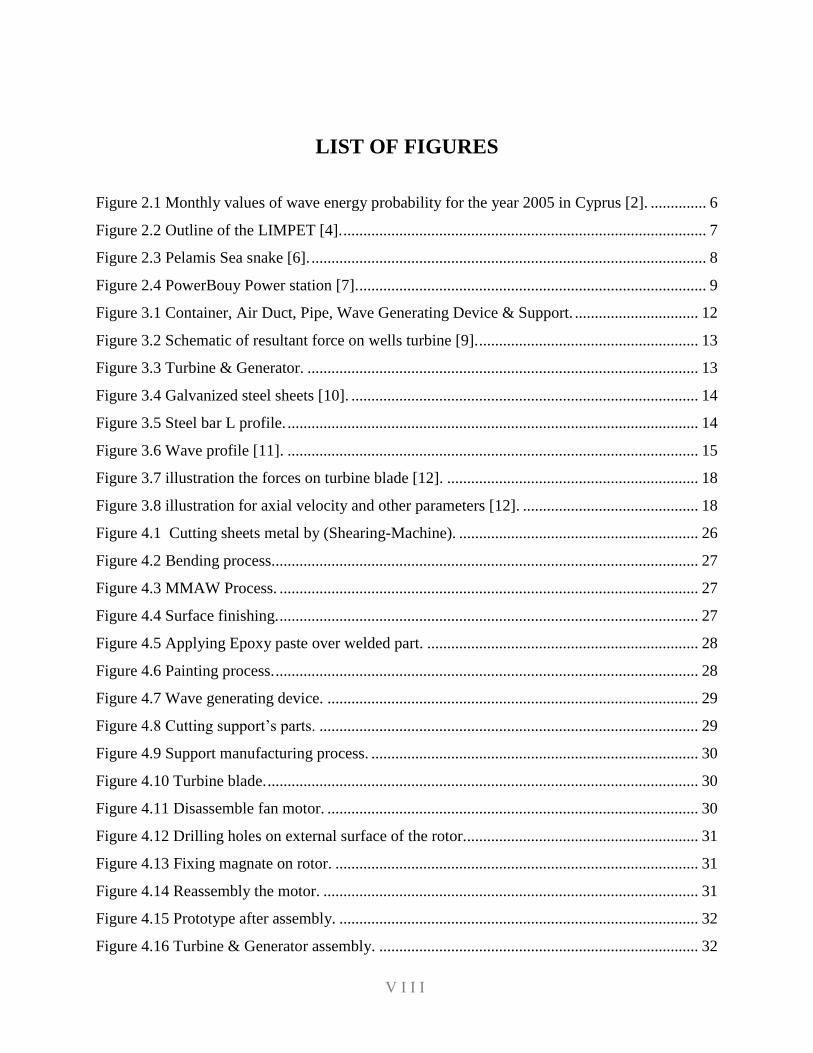
LIST OF FIGURES
Figure 2.1 Monthly values of wave energy probability for the year 2005 in Cyprus [2]. .............. 6
Figure 2.2 Outline of the LIMPET [4]. ........................................................................................... 7
Figure 2.3 Pelamis Sea snake [6]. ................................................................................................... 8
Figure 2.4 PowerBouy Power station [7]. ....................................................................................... 9
Figure 3.1 Container, Air Duct, Pipe, Wave Generating Device & Support. ............................... 12
Figure 3.2 Schematic of resultant force on wells turbine [9]. ....................................................... 13
Figure 3.3 Turbine & Generator. .................................................................................................. 13
Figure 3.4 Galvanized steel sheets [10]. ....................................................................................... 14
Figure 3.5 Steel bar L profile. ....................................................................................................... 14
Figure 3.6 Wave profile [11]. ....................................................................................................... 15
Figure 3.7 illustration the forces on turbine blade [12]. ............................................................... 18
Figure 3.8 illustration for axial velocity and other parameters [12]. ............................................ 18
Figure 4.1 Cutting sheets metal by (Shearing-Machine). ............................................................ 26
Figure 4.2 Bending process........................................................................................................... 27
Figure 4.3 MMAW Process. ......................................................................................................... 27
Figure 4.4 Surface finishing. ......................................................................................................... 27
Figure 4.5 Applying Epoxy paste over welded part. .................................................................... 28
Figure 4.6 Painting process. .......................................................................................................... 28
Figure 4.7 Wave generating device. ............................................................................................. 29
Figure 4.8 Cutting support’s parts. ............................................................................................... 29
Figure 4.9 Support manufacturing process. .................................................................................. 30
Figure 4.10 Turbine blade. ............................................................................................................ 30
Figure 4.11 Disassemble fan motor. ............................................................................................. 30
Figure 4.12 Drilling holes on external surface of the rotor........................................................... 31
Figure 4.13 Fixing magnate on rotor. ........................................................................................... 31
Figure 4.14 Reassembly the motor. .............................................................................................. 31
Figure 4.15 Prototype after assembly. .......................................................................................... 32
Figure 4.16 Turbine & Generator assembly. ................................................................................ 32
I X
Figure 4.17 Pipe & Air duct assembly. ......................................................................................... 33
Figure 4.18 Final assembly. .......................................................................................................... 33
Figure 4.19 Testing the project. .................................................................................................... 34
Figure E- 1 Manufacturing container wall pt1. ............................................................................. 72
Figure E- 2 Manufacturing container wall pt3.. ............................................................................ 72
Figure E- 3 Manufacturing air duct wall pt1. ............................................................................... 72
Figure E- 4 Manufacturing container base.................................................................................... 72
Figure E- 5 Tank and air duct assembly. ...................................................................................... 73
Figure E- 6 MMAW process......................................................................................................... 73
Figure E- 7 Manufacturing hole for the pipe. ............................................................................... 73
Figure E- 8 Applying epoxy paste. ............................................................................................... 73
Figure E- 9 Preparing for painting process. .................................................................................. 73
Figure E- 10 Painting process. ...................................................................................................... 73
Figure E- 11 Modifying generator shaft 1. ................................................................................... 74
Figure E- 12 Modifying generator shaft 2. ................................................................................... 74
Figure E- 13 Turbine and generator assembly. ............................................................................. 74
Figure E- 14 Manufacturing prototype support. ........................................................................... 74
Figure E- 15 Final assembly. ........................................................................................................ 74
Figure E- 16 Testing the prototype. .............................................................................................. 74
Figure E- 17 Checking the results. ................................................................................................ 75
Figure E- 18 Group 08 A.I.A mates & Supervisor. ...................................................................... 75

X
LIST OF TABLES
Table 1 Calculated and Experimental Aerodynamic Coefficients [13]. ....................................... 18
Table 2 Theoritical Results ........................................................................................................... 23
Table 3 Required Materials Availability....................................................................................... 24
Table 4 Ordered Materials. ........................................................................................................... 25
Table 5 Supplier List. .................................................................................................................... 25
Table 6 Experimental & Theoretical Results. ............................................................................... 38
Table 7 Testing results .................................................................................................................. 39

1
CHAPTER I: INTRODUCTION
In this chapter an introduction to renewable energy will be presented and the importance
of these technologies will be shown by answering why renewable energy is used, illustrating
diverse sources of this energy, wave energy with its harvesting devices will be discussed briefly,
and finally the project objectives and report organization will be mentioned.
1.1 Why Renewable Energy?
Population of the world is increasing dramatically, and it is expected to double with
approximately 10 to 12 billion by the end of 21st century [1], accordingly the population
demands on energy will grow as well. In order to meet these demands new sources of energy are
required to be found as well as being replaced with conventional resources such as fossil fuel,
which are on its way to deplete, and nuclear power.
The reduction of conventional resources is not the only problem. Besides, these sources impose
hazardous and dangerous impacts on the environment for instance air pollution, ice melting,
global warming and greenhouse effect.
Enacting new obligations as well as worldwide consensus over consolidation of renewable
energy will have a major contribution in the solution of these complicated problems.
1.2 Renewable Energy Resources
Renewable energy has been diversified into a large number of resources in the last few
years. It started with some basic technologies such as wind and flow energy, while in these days
many sources and energy harvesting techniques are available.
1.2.1 Solar Energy:
By using various technologies, several forms of energy can be generated by absorbing
and converting the solar radiation into another form of energy. For instance, electricity can be

2
generated from solar radiation directly by using Photovoltaic devices (Solar Cells), as well as
heat from solar water heating systems and solar collectors.
1.2.2 Wind Energy:
Wind energy is plentiful, therefore number of wind turbines has been enlarged
dramatically in the last few years. According to the statistics, in the last 3 years, the number of
wind turbines that are used to generate electricity have exceeded 20,000 turbine, where the
number of those which used to pump water is over a million [1].
1.2.3 Wave Energy:
Plenty of ideas and designs were proposed for extracting and harvesting energy from sea
and ocean waves. Several of these experimental designs were tested, yet the technology has not
reached the commercial stage.
1.2.4 Hydroelectricity:
With a contribution of over 20% of the world electricity production, and capacity that can
exceeds the capacity of conventional power station, hydroelectricity is one of the most important
and considerable sources of renewable energy.
It is highly efficient, reliable, have relatively a long life time cycle and it can be controlled easily.
Furthermore it is possible to add extra elements of storage into the electricity supply system to
allow compensation for the varying capacity of other renewable sources and the variation of
electricity demands.
There are several devices and applications for extracting energy from small and medium sized
river and streams which have various flow rates with or without the use of dams.
1.3 Wave Energy in Details
Sea waves (distinct from internal waves which are caused by difference between hot and
cold currents) are the transferred energy from wind to the sea/ocean. As the wind moves over the
sea, an interaction occurs between the wind and the surface of water which leads to formation of
waves. The generated energy differs into two kinds, first one is Kinetic Energy which is
expressed by the motion and velocity of water particles, and second kind is the Potential Energy
which is stored in the mass of the displaced particles away from its original mean level. The size
(amplitude) and length of waves are related directly to the velocity and blow period of the wind.
3
The energy of waves is related to several parameter such as wind velocity, depth of sea/ocean,
location (cape, bay …etc.) and storm areas, the nature of the shore (sandy or rocky shore), and it
differs between open oceans and closed seas.
1.4 Project Objectives
In the project, detailed study about wave energy will be introduced. Calculations,
comparison and advantages and limitations will be illustrated, and several methods of optimizing
the old applications of OWC (oscillating Water Column) will be discussed.
This project is based on previous projects, devices and work done. Prototype will be built, tested
and analyzed mathematically and technically by the suitable apparatuses (e.g. Wind Tunnel,
Anemometer and Pressure Gauge), and software (SolidWorks).
The goal of this prototype is to achieve more than 1% for power efficiency and simultaneously
with more than 40% turbine efficiency.
1.5 Organization of the Report
In chapter I renewable energy concepts are briefly introduced, various sources of this
energy (Solar, Wind, Wave and Hydroelectricity) are mentioned and detailed explanation of
wave energy is given. Later on, project objectives are also mentioned.
In chapter II a literature review will be introduced showing the history, distribution of waves in
Cyprus, finally previous works done, advantages and disadvantages of each one.
In chapter III design and analysis of the prototype will be discussed in details with the
components, material selection and manufacturing plan. In this chapter knowledge of
mathematical for design calculation will be applied.
In chapter IV manufacturing, assembling and testing processes will be illustrated.
In chapter V experimental results will be obtained and final results will be discussed.
Last chapter is about future works and conclusion.
This report will include appendices (Logbooks, Gant chart, Technical drawings, Engineering
standards and Manufacturing photos).
4
CHAPTER II: LITERATURE REVIEW
In this chapter old publication and researches will be surveyed, wave energy potential in
Cyprus will be discussed and finally three devices will be illustrated.
2.1 Recent History of Wave Energy
Due to energy crisis in 1970, the interest in renewable energy increased all around the
world, primarily Wave Energy, as a hidden source of electricity power in the sea/ocean. The
ability to generate power from sea/ocean waves has grabbed the attention of people for centuries.
Despite, there were notions over hundred years old, it was only in 1970s that applicable plans
started to unfold. Generally, these innovative wave energy diversion projects had trivial
imperfections. There was a great probability that some of them might play an important role in
energy contribution in the long run. In regions of the world where the wave climate is active and
where classic energy sources are expensive, such as outlying islands, some of them might be
already competitively.
Due to the large amount of wave energy resources available in the world, a large number of
apparatus concepts invented, mathematically sculptured and experimentally examined with
support from sponsors. Regrettably, deficient of money and time were determined to bring the
various apparatus and the related technologies to ripeness.
However, a lower labor has been maintained by research teams, and a prototype of oscillating
water column (OWC) has been prepared in Islay in Scotland. That small-scale apparatuses
should have been considered as a source of energy for islands instead of diesel which supply the
main energy source. Japan, Norway, UK and USA increased their research and development
programs. Norway has an instant local need for wave energy since it gratifies an electricity
nearly derived hydro-resources. It would like to distribute wave energy technology all around the
world. Japan, moreover, in dire need more clean power provenance, but is surrounded by a
humble wave climate [1].

5
A number of prototype projects had been examined at different sites around the world, but yet
there had been modicum utilization of wave energy enormous potential. Through this century
there was an expectation to see more prototype testing and development of some projects.
This section will explore the wave energy potential in Cyprus and talk in details about three
mechanisms of generating energy from waves.
2.2 Wave Energy Potential in Cyprus
The acclimation and use of fabricated methodologies for the utilization of renewable energy
naval resources is of the major cases today for the environmental science community. In this
framework, the utilization of wave energy potential for coastal and island states looks to be one
of the remarkable solutions from research and technological standpoint.
In the year 2005, wave energy resource for the Levantine Basin in Eastern Mediterranean was
observed. Accurate data created by the wave model WAM was formed with accuracy of 1 arc
minute (1.5-1.8 km), to emulate the wave states of the whole of Eastern Mediterranean sea [2].
The following Figure 2.1 shows the mean monthly values of wave energy potential for the year
2005 in Cyprus. Throughout the winter period (December to March) the values of wave power
increased up to (5-6 KW/m). April and November can be described as fleeting months.
Generally, the wave energy potential is essentially influenced by the variation of the big wave
height, a fact which is in accordance with the second order relation with it, and subaltern by the
energy period which has a steady behavior because of domestic wave climatology.

6
Figure 2.1 Monthly values of wave energy probability for the year 2005 in Cyprus [2].

7
2.3 Wave Energy Devices
There were many different types of wave energy converters around the world, in this
section these devices will be classified according to Wave Energy Collector types (WEC). There
are three main types of WEC which they are:
• Oscillating Water Column (OWC).
• Hinged Contour Device.
• Buoyant Moored Device.
2.3.1 Oscillating Water Column (OWC) (the Limpet)
The Limpet (Land Installed Marine Power Energy Transmitter) is an oscillating water
column based on the beach wave (OWC), which was developed by Queen's University in Belfast
and Wavegen of Inverness. It is based on the experience gained from the wave energy devices in
the United Kingdom, and OWC on Eli [3].
Oscillating water column consists of partially submerged structure, which is opened to the sea
water below it. This structure is attached to the column of air on top of the previous column of
water. As waves affecting the device, they cause the water column rise and fall, which
compresses and depressurizes air column above it. As a result, this compressed air will flow in
and out of the atmosphere by a turbine. This energy can be extracted from the system and being
used in order to generate electricity. Power is usually extracted from the reversed air flow by
wells’ turbine, which has the property of rotating in same directions regardless of the direction of
air flow. As shown in Figure 2.2 below.
Figure 2.2 Outline of the LIMPET [4].

8
2.3.2 Pelamis Sea Snake
Pelamis development program has covered all parts of the design from the primary
concept refinement through to accelerated cycle testing of individual components of reliability.
Pelamis Wave Power tested their first project at the European wave Energy, Scotland between
2004 and 2007. This was the first wave power machine in the world Which was designed at 750
kW.
The Pelamis as shown in Figure 2.3 absorbs the energy of waves and converts it into electricity.
It operates in water depths more than 50m and is usually installed 2-10 km away from the beach.
The machine is rated at 750 kW with a capacity factor of 25-40%, depending on the conditions at
the work site. Usually one of these machines can provide sufficient power to meet the electricity
demand of 500 homes [5].
Figure 2.3 Pelamis Sea snake [6].
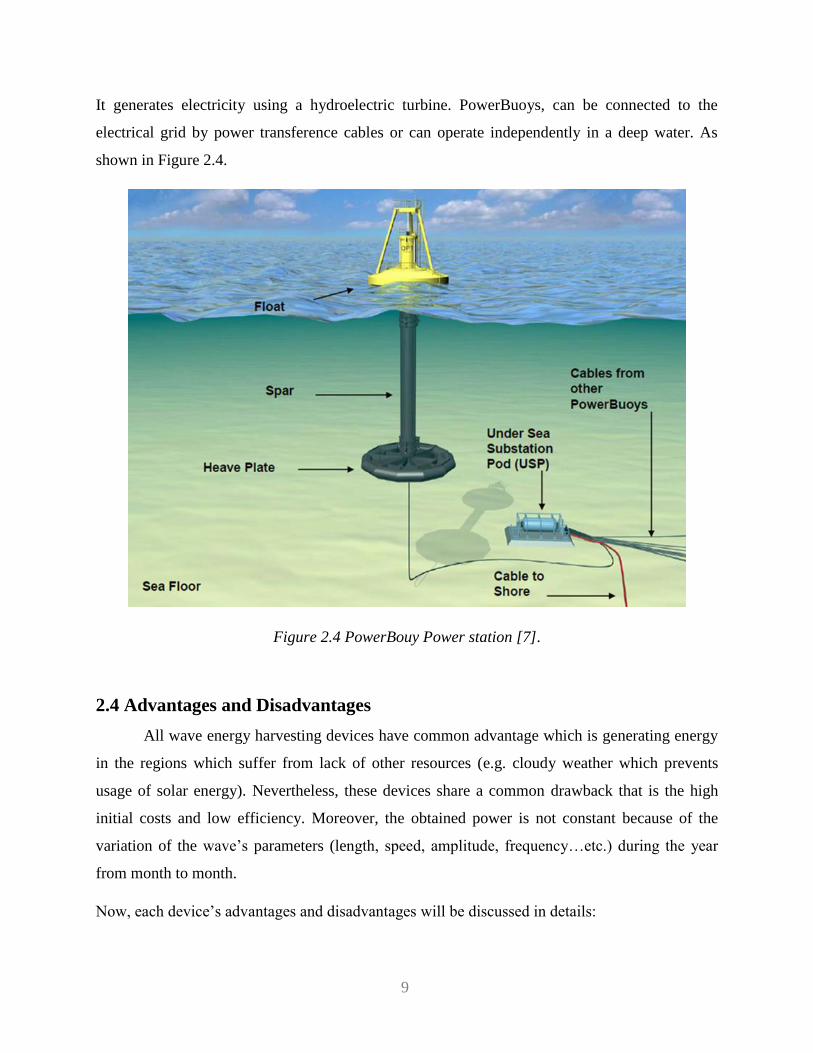
2.3.3 PowerBuoy
The PowerBuoy design process focuses on explanation of operational requirements at the
beginning of the effort. A refined closed loop process optimizes different parts of the system. It’s
a small power station for generating electricity from wave power. It is a point absorber or float,
currently in use at 10 sites around the world, especially in Australia and the United States.
9
It generates electricity using a hydroelectric turbine. PowerBuoys, can be connected to the
electrical grid by power transference cables or can operate independently in a deep water. As
shown in Figure 2.4.
Figure 2.4 PowerBouy Power station [7].
2.4 Advantages and Disadvantages
All wave energy harvesting devices have common advantage which is generating energy
in the regions which suffer from lack of other resources (e.g. cloudy weather which prevents
usage of solar energy). Nevertheless, these devices share a common drawback that is the high
initial costs and low efficiency. Moreover, the obtained power is not constant because of the
variation of the wave’s parameters (length, speed, amplitude, frequency…etc.) during the year
from month to month.
Now, each device’s advantages and disadvantages will be discussed in details:
1 0
2.4.1. Limpet
The first superiority of this device over others is the components are simple to be
manufactured, assembled, maintained and replaced. It is located on the shore line which makes it
easier to construct it and reach to it when being maintained. There is no direct contact with the
sea water, which leads to longer life span of the device and its components.
Disadvantages are: the complex shape of the turbine blades (Wells Turbine). Another drawback
is the symmetric shape of its blades which reduces the obtainable efficiency of the turbine.
2.4.2. Pelamis Sea Snake
The privilege of this device is that the machine is rated at 750 kW with a capacity factor
of 25-40%, depending on the conditions at the work site.
On the other hand, the defect of this device is the need of a deep-water (more than 50 meters) so
it is placed far from shore line (usually 2-10 Km from the beach); this leads to hard maintenance
as well as difficulties in reaching to this device in emergencies. It also requires to be fixed at the
bottom of the ocean by cables. This leads to higher costs and harmful impacts on the sea
creatures.
2.4.3 PowerBouy
PowerBouy and Pelamis Sea Snake has almost same pros and cons. Nevertheless,
PowerBouy has relatively small volume comparing to Pelamis which means higher efficiency in
terms of area usage. For example a 300 sq. miles of area estimated to be capable of producing
electricity to all California houses [8].

1 1
CHAPTER III: DESIGN & ANALYSIS
In this chapter the component of the project will be listed, suitable material will be
selected according to the parameters of each part of the project, the related equation and
calculation will be carried, and finally cost analysis of the project will be presented.
3.1 Prototype Components
Every system consists of several components, choosing the suitable components is crucial
in any system and it should be chosen carefully in order to assure the proper operation of the
system. The prototype of a sea wave device consists of several components. The design itself is
simple and easy to be manufactured and analyzed. This project is made of five main components;
water container, air duct, turbine, generator and sub-station or after generation components. In
this section, the system's components will be discussed in details.
3.1.1 Container, Air Duct, Pipe, Wave Generating Device & Support
In the prototype, an open water tank is being used. Galvanized steel sheet is used in order
to resist the high corrosion effect of the salty sea water. The container is being used in the
prototype to contain the water that mimics the sea water and its waves.
Air duct is series of channels that are used to supply air to the propeller by sucking and blowing.
The oscillating water in the bottom of the air duct will mimic the OWC, and as discussed before,
the elevation of water column caused by waves will produce a differential pressure between the
air in the duct and the outside air leading to the motion of the air inside the duct forward and
backward which will rotates the propeller. The air duct has a decreasing cross-sectional area
which concentrates the air current leading to higher air speed and pressure differential. The
materials of air ducts varies depending on its usage and application but the most known materials
are: Galvanized steel, aluminum, polyurethane, fiberglass and other materials.
The pipe is used to fix the generator inside it, also as an exit and inlet for air flux.
Wave generation mechanism is used to simulate sea waves in the prototype.
And finally the support is used to carry the whole prototype on itself and stabilize the prototype
as shown in the following Figure 3.1.

1 2
Figure 3.1 Container, Air Duct, Pipe, Wave Generating Device & Support.
3.1.3 Turbine
A turbine is a mechanical device that harvests and extracts energy from the flow of fluid
or gases and converts this energy into rotation (useful mechanical work). The turbine is consists
of a rotor part which is a drum and blades. The variable pitch, configuration and angle of the
blades allows to convert flow energy into rotation. The blades angle and pitch are defined
according to several parameters such: flow velocity, density of the fluid/gas, turbine desired
RPM and several other factors.
In the application of sea waves and OWC, special type of turbines with special configurations are
used, this type is known as "Wells Turbine". Wells turbine is a symmetric turbine as shown in
Figure 3.2, i.e. its foils have a symmetric profile. This property assures that despite the flow
direction weather it is forward or backward, the turbine will rotates in the same direction.

1 3
Figure 3.2 Schematic of resultant force on wells turbine [9].
3.1.4 Generator
Generator or dynamo is an electrical device that converts the mechanical work (rotation
of the rotating parts) into electrical current through the use of electromagnetic induction.
Generator is a general term for the devices that generate AC and DC current, where dynamo is
more specified for the generators of DC current. The following Figure 3.3 shows the design of
prototype’s turbine and generator.
Figure 3.3 Turbine & Generator.

1 4
3.2 Material Selection and manufacturing methods
Different types of materials are used in manufacturing the prototype, each part is made
from different material than others. The material should be selected to fit the specifications and
the properties of each part of the prototype.
3.2.1 Galvanized Steel
Galvanized steel sheets as shown in the Figure 3.4 are available everywhere with
different thicknesses and they are easy to deal with it in all manufacturing processes. The
container, wave generator mechanism, air duct and the pipe (where the turbine is mounted) are
all made from galvanized steel in order to resist corrosion. The standard dimensions of the used
sheets were: 2000x1000x1 mm x 2 sheets.
Figure 3.4 Galvanized steel sheets [10].
3.2.2 Angle Iron
The prototype support is made from angle iron 40x40x4 mm as shown in Figure 3.5.
Figure 3.5 Steel bar L profile.

1 5
3.2.3 ABS-FDM Plastic
ABS (Acrylonitrile Butadiene Styrene) the turbine blades are made from ABS-FDM
material, which is a very light material (density equal to 104 kg per cubic meter).
3.2.4 Polystyrene
Polystyrene is a light weight material that is easy to be formed and shaped to any desired
shape. This material is used in front of each pulley of the turbine to direct the air toward the
blades and reduce pressure drop and improve the aerodynamics properties.
3.2.5 Manufacturing Methods
In order to manufacture our design, components are manufactured in the workshop using
conventional (Cutting, drilling, welding, grinding, joining) and modern manufacturing
techniques (3D Printer).
3.3 Calculations
This section is about prototype studying and calculations by using the relative equations,
starting from studying wave profile, then air flow, pressure drop, and finally turbine design.
3.3.1 Wave Velocity and Airflow
When the elevations of waves are parallel to the spreading direction, the wave could be
longitudinal, it could be transverse when the elevations perpendicular to the spreading direction.
These elevations have periodically time-varying displacement in which the direction is
perpendicular or parallel, therefore the acceleration and velocity are also periodically time-
varying in same directions as shown in Figure 3.6.
Figure 3.6 Wave profile [11].
1 6
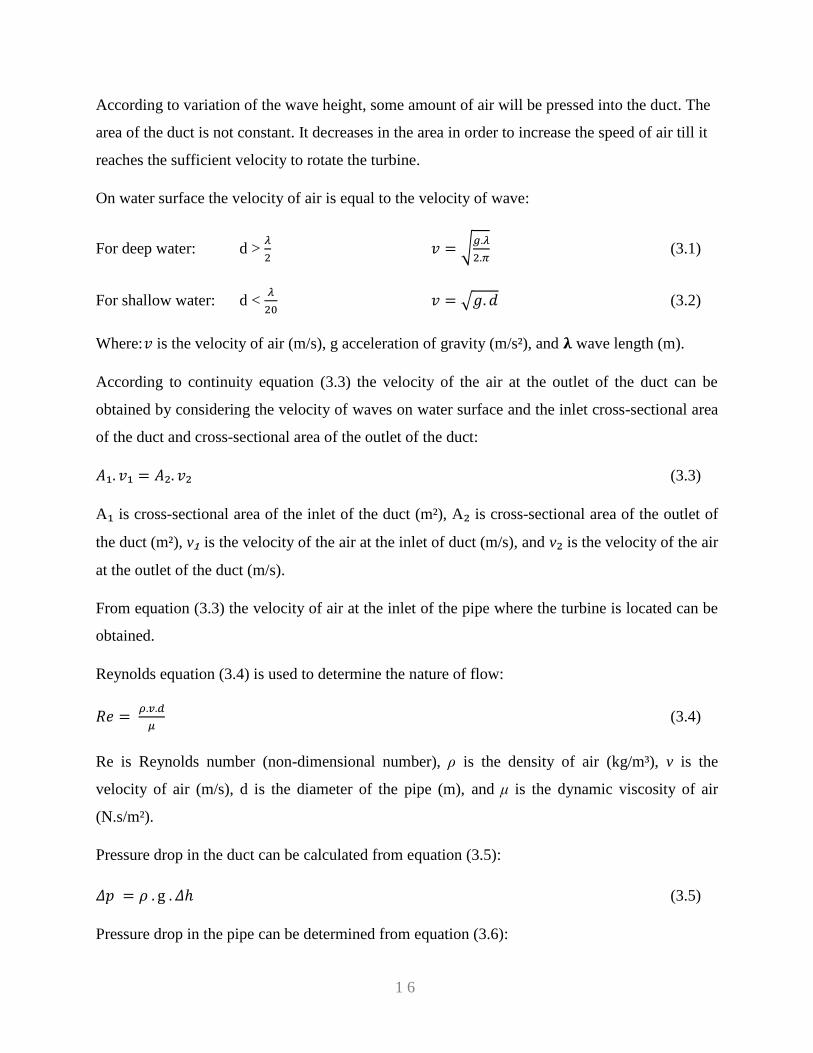
According to variation of the wave height, some amount of air will be pressed into the duct. The
area of the duct is not constant. It decreases in the area in order to increase the speed of air till it
reaches the sufficient velocity to rotate the turbine.
On water surface the velocity of air is equal to the velocity of wave:
For deep water: d > 𝜆
2 𝑣 = √
𝑔.𝜆
2.𝜋 (3.1)
For shallow water: d < 𝜆
20 𝑣 = √𝑔. 𝑑 (3.2)
Where: 𝑣 is the velocity of air (m/s), g acceleration of gravity (m/s²), and 𝛌 wave length (m).
According to continuity equation (3.3) the velocity of the air at the outlet of the duct can be
obtained by considering the velocity of waves on water surface and the inlet cross-sectional area
of the duct and cross-sectional area of the outlet of the duct:
𝐴₁. 𝑣₁ = 𝐴₂. 𝑣₂ (3.3)
A₁ is cross-sectional area of the inlet of the duct (m²), A₂ is cross-sectional area of the outlet of
the duct (m²), v₁ is the velocity of the air at the inlet of duct (m/s), and v₂ is the velocity of the air
at the outlet of the duct (m/s).
From equation (3.3) the velocity of air at the inlet of the pipe where the turbine is located can be
obtained.
Reynolds equation (3.4) is used to determine the nature of flow:
𝑅𝑒 = 𝜌.𝑣.𝑑
𝜇 (3.4)
Re is Reynolds number (non-dimensional number), ρ is the density of air (kg/m³), v is the
velocity of air (m/s), d is the diameter of the pipe (m), and μ is the dynamic viscosity of air
(N.s/m²).
Pressure drop in the duct can be calculated from equation (3.5):
𝛥𝑝 = 𝜌 . g . 𝛥ℎ (3.5)
Pressure drop in the pipe can be determined from equation (3.6):

1 7
𝛥𝑝 = 𝑓𝐷𝐿
𝐷 𝜌𝑣²
2 (3.6)
Δp is the pressure loss due to friction (Pa), L/D is the ratio of the length to diameter of the pipe, ρ
is the density of the fluid (kg/m3), v is the mean flow velocity (m/s), Δh is the height difference
(m), and 𝑓𝐷 is Darcy Friction Factor; a (dimensionless) coefficient of laminar, or turbulent flow.
For laminar flow (Re < 2100): 𝑓𝐷 = 64/Re (3.7)
For the completely turbulent region: 1
√𝑓𝐷= −2log[
ε
3.7𝐷 +
2.51
𝑅𝑒√𝑓𝐷] (3.8)
ε is the surface roughness of the pipe (mm).
The pressure drop at the turbine can be calculated from Bernoulli equation that can be seen
below:
𝛥𝑝 =1
2𝜌 . (𝑣2² − 𝑣1²) (3.9)
3.2.2 Turbine Calculations
The torque on the blade can be written as:
𝑇 =1
2𝜌. 𝛺2. 𝑁. 𝑐. (𝐶𝑙. 𝑠𝑖𝑛𝛽 − 𝐶𝑑. 𝑐𝑜𝑠𝛽). (𝑅𝑇 − 𝑅𝐻). 𝑅𝑎𝑣 (3.10)
T is the torque (Nm), 𝛺 is the rotational speed of turbine (rad/s), ρ is the density of the fluid
(kg/m3), β is the angle of incidence:
β = 𝑡𝑎𝑛−1(𝑣𝑡
𝑣𝐴) (3.11)
∝= β − γ (3.12)
∝ Is the angle of attack (see Figure 3.7), 𝛾 angel between cord line and turbine tangential
velocity:
Tip linear velocity: 𝑉𝑡 = 𝛺. 𝑅𝑇 (3.13)
The axial velocity of air cross turbine (see Figure 3.8): 𝑉𝐴 = 𝑉. Rτ2
(Rτ2−Rн2) (3.14)
Resultant relative velocity: 𝑊𝑅2 = 𝑉𝑡
2 + 𝑉𝐴2 (3.15)
N is the number of blades, c is chord length (m),𝐶𝑙 is lift coefficient, 𝐶𝑑 is drag coefficient
𝐶𝑙 & 𝐶𝑑 values are taken from Table 1, RT is the tip radius of the rotor, 𝑅𝐻 is the hub radius, and
Rav is the average radius of the blades:
Rav = RH +RT−RH
2 (3.16)

1 8
Figure 3.7 illustration the forces on turbine blade [12].
Figure 3.8 illustration for axial velocity and other parameters [12].
Table 1 Calculated and Experimental Aerodynamic Coefficients [13].
1 9
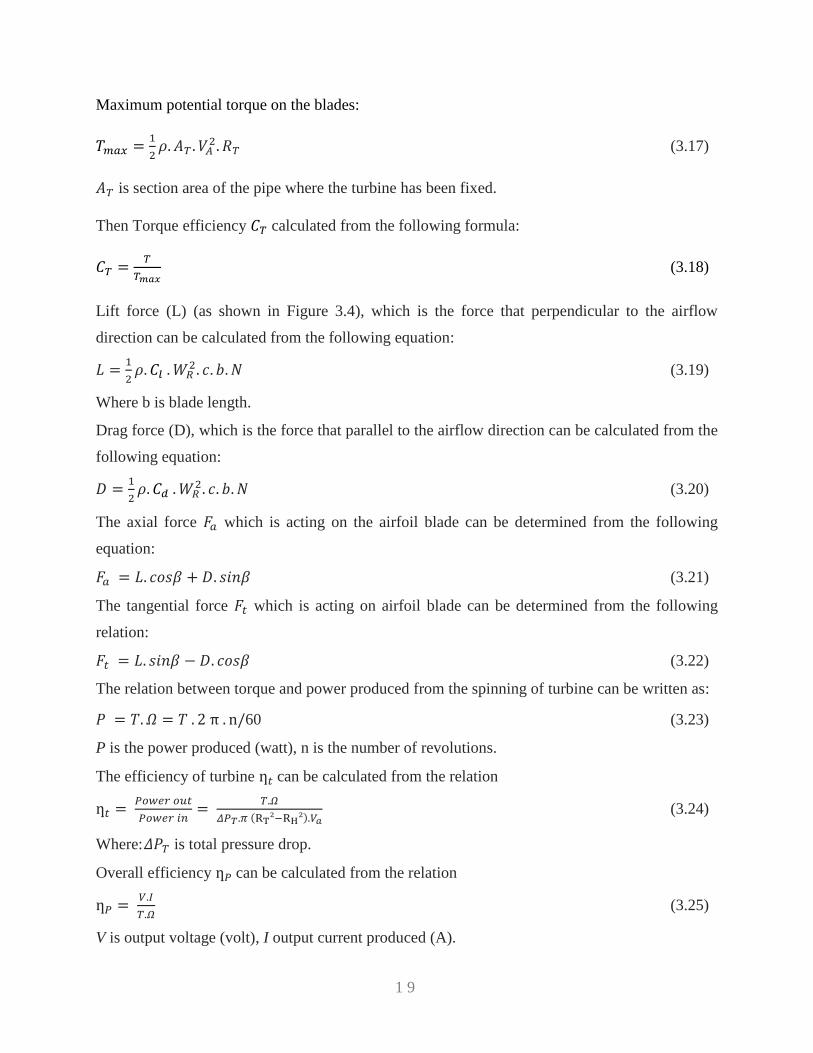
Maximum potential torque on the blades:
𝑇𝑚𝑎𝑥 =1
2𝜌. 𝐴𝑇 . 𝑉𝐴
2. 𝑅𝑇 (3.17)
𝐴𝑇 is section area of the pipe where the turbine has been fixed.
Then Torque efficiency 𝐶𝑇 calculated from the following formula:
𝐶𝑇 =𝑇
𝑇𝑚𝑎𝑥 (3.18)
Lift force (L) (as shown in Figure 3.4), which is the force that perpendicular to the airflow
direction can be calculated from the following equation:
𝐿 =1
2𝜌. 𝐶𝑙 . 𝑊𝑅
2. 𝑐. 𝑏. 𝑁 (3.19)
Where b is blade length.
Drag force (D), which is the force that parallel to the airflow direction can be calculated from the
following equation:
𝐷 =1
2𝜌. 𝐶𝑑 . 𝑊𝑅
2. 𝑐. 𝑏. 𝑁 (3.20)
The axial force 𝐹𝑎 which is acting on the airfoil blade can be determined from the following
equation:
𝐹𝑎 = 𝐿. 𝑐𝑜𝑠𝛽 + 𝐷. 𝑠𝑖𝑛𝛽 (3.21)
The tangential force 𝐹𝑡 which is acting on airfoil blade can be determined from the following
relation:
𝐹𝑡 = 𝐿. 𝑠𝑖𝑛𝛽 − 𝐷. 𝑐𝑜𝑠𝛽 (3.22)
The relation between torque and power produced from the spinning of turbine can be written as:
𝑃 = 𝑇. 𝛺 = 𝑇 . 2 π . n/60 (3.23)
P is the power produced (watt), n is the number of revolutions.
The efficiency of turbine ƞ𝑡 can be calculated from the relation
ƞ𝑡 = 𝑃𝑜𝑤𝑒𝑟 𝑜𝑢𝑡
𝑃𝑜𝑤𝑒𝑟 𝑖𝑛=
𝑇.𝛺
𝛥𝑃𝑇.𝜋 (RT²−RH²).𝑉𝑎 (3.24)
Where: 𝛥𝑃𝑇 is total pressure drop.
Overall efficiency ƞ𝑃 can be calculated from the relation
ƞ𝑃 = 𝑉.𝐼
𝑇.𝛺 (3.25)
V is output voltage (volt), I output current produced (A).
2 0
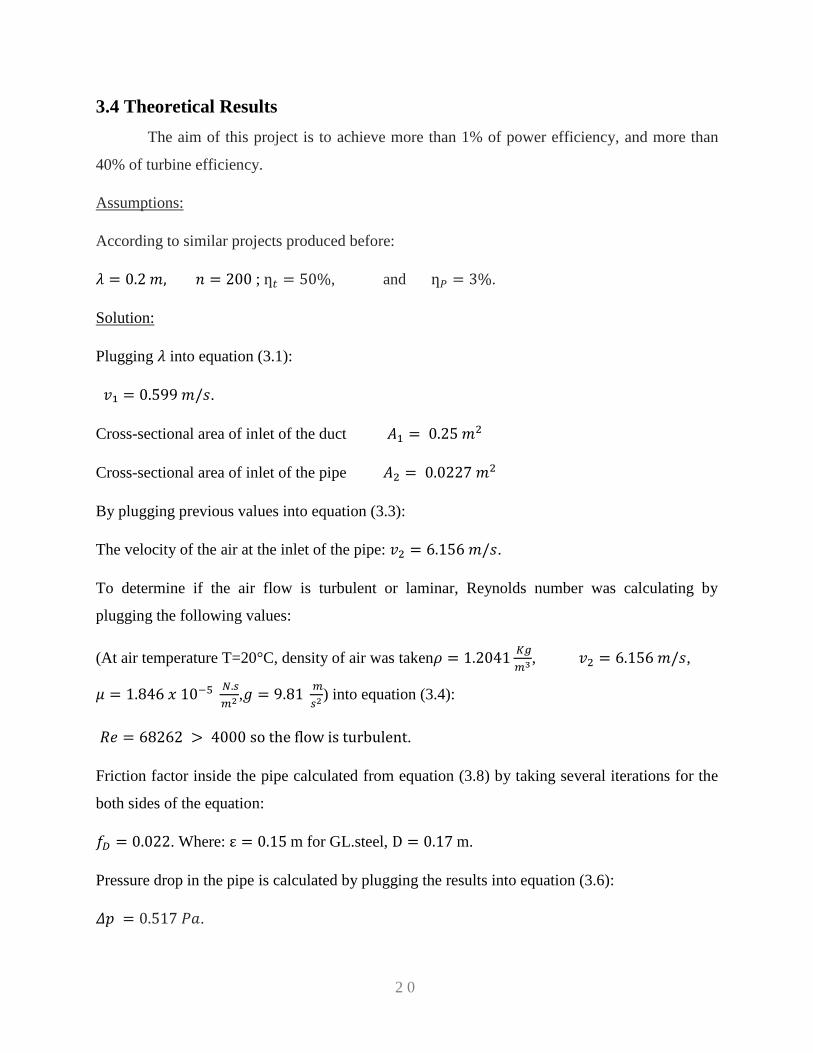
3.4 Theoretical Results
The aim of this project is to achieve more than 1% of power efficiency, and more than
40% of turbine efficiency.
Assumptions:
According to similar projects produced before:
𝜆 = 0.2 𝑚, 𝑛 = 200 ; ƞ𝑡 = 50%, and ƞ𝑃 = 3%.
Solution:
Plugging 𝜆 into equation (3.1):
𝑣₁ = 0.599 𝑚/𝑠.
Cross-sectional area of inlet of the duct 𝐴1 = 0.25 𝑚2
Cross-sectional area of inlet of the pipe 𝐴2 = 0.0227 𝑚2
By plugging previous values into equation (3.3):
The velocity of the air at the inlet of the pipe: 𝑣2 = 6.156 𝑚/𝑠.
To determine if the air flow is turbulent or laminar, Reynolds number was calculating by
plugging the following values:
(At air temperature T=20°C, density of air was taken𝜌 = 1.2041 𝐾𝑔
𝑚3 , 𝑣2 = 6.156 𝑚/𝑠,
𝜇 = 1.846 𝑥 10−5 𝑁.𝑠
𝑚2 ,𝑔 = 9.81 𝑚
𝑠2) into equation (3.4):
𝑅𝑒 = 68262 > 4000 so the flow is turbulent.
Friction factor inside the pipe calculated from equation (3.8) by taking several iterations for the
both sides of the equation:
𝑓𝐷 = 0.022. Where: ε = 0.15 m for GL.steel, D = 0.17 m.
Pressure drop in the pipe is calculated by plugging the results into equation (3.6):
𝛥𝑝 = 0.517 𝑃𝑎.
2 1
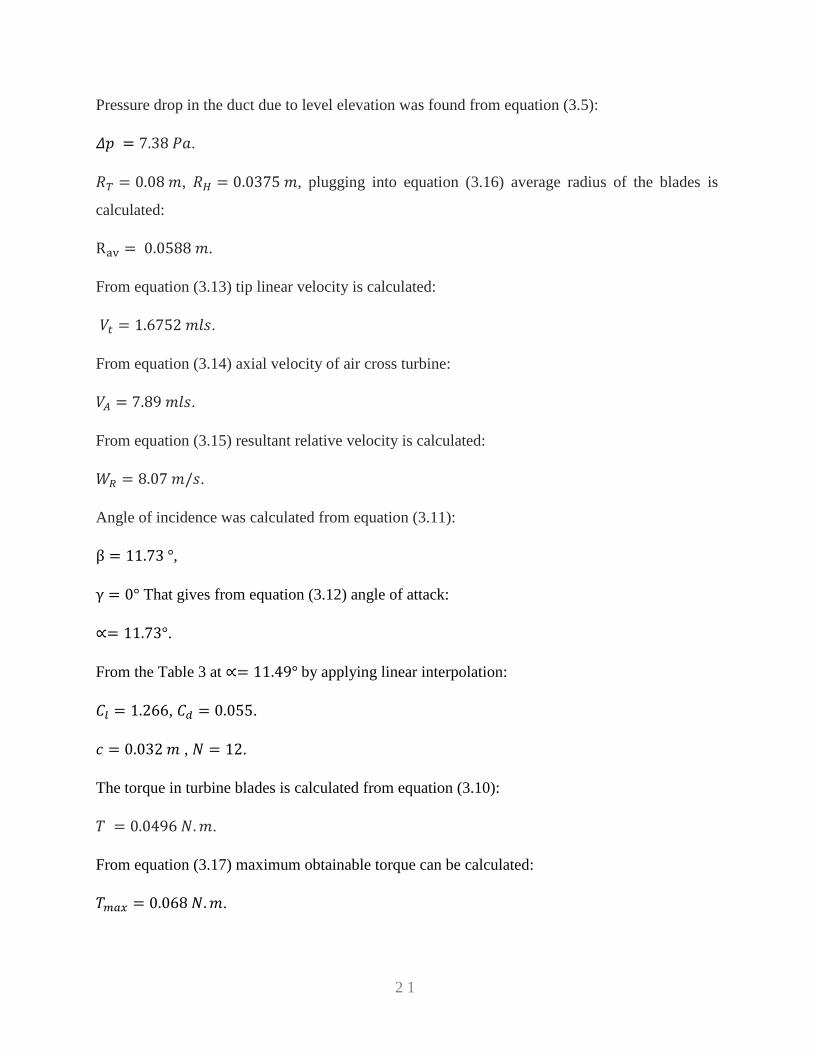
Pressure drop in the duct due to level elevation was found from equation (3.5):
𝛥𝑝 = 7.38 𝑃𝑎.
𝑅𝑇 = 0.08 𝑚, 𝑅𝐻 = 0.0375 𝑚, plugging into equation (3.16) average radius of the blades is
calculated:
Rav = 0.0588 𝑚.
From equation (3.13) tip linear velocity is calculated:
𝑉𝑡 = 1.6752 𝑚𝑙𝑠.
From equation (3.14) axial velocity of air cross turbine:
𝑉𝐴 = 7.89 𝑚𝑙𝑠.
From equation (3.15) resultant relative velocity is calculated:
𝑊𝑅 = 8.07 𝑚/𝑠.
Angle of incidence was calculated from equation (3.11):
β = 11.73 °,
γ = 0° That gives from equation (3.12) angle of attack:
∝= 11.73°.
From the Table 3 at ∝= 11.49° by applying linear interpolation:
𝐶𝑙 = 1.266, 𝐶𝑑 = 0.055.
𝑐 = 0.032 𝑚 , 𝑁 = 12.
The torque in turbine blades is calculated from equation (3.10):
𝑇 = 0.0496 𝑁. 𝑚.
From equation (3.17) maximum obtainable torque can be calculated:
𝑇𝑚𝑎𝑥 = 0.068 𝑁. 𝑚.

2 2
The coefficient of torque is obtained from equation (3.18):
𝐶𝑇 = 72.9 %.
To find lift and drag forces; Lift force from equation (3.19) is:
𝐿 == 0.692 𝑁.
And drag force from equation (3.20) is:
𝐷 = 0.0311 𝑁.
From previous values, tangential and axial forces is calculated as follows; axial force from
equation (3.21):
𝐹𝑎 = 0.0684 𝑁.
And tangential force from equation (3.22):
𝐹𝑡 = 0.1104 𝑁.
In order to calculate output power from equation (3.23):
𝑃 = 0.9423 𝑊𝑎𝑡𝑡.
From equation (3.24):
ƞ𝑡 = 50 %; 𝛥𝑃𝑇 = 15.23 𝑃𝑎
Pressure drop at the turbine blades is found from equation (3.9):
𝛥𝑝 = 7.33 𝑃𝑎; 𝑣𝐸𝑥𝑖𝑡 = 5.07 𝑚𝑙𝑠.
Overall efficiency ƞ𝑃 = 3% when closed circuit constructed using 120 Ohm resistor, plugging
into equation (3.25):
ƞ𝑃 = 𝑉.𝐼
𝑇.𝛺= 3 %; 𝑉. 𝐼 = ƞ𝑃. 𝑇. 𝛺 = 0.03𝑥0.9423 = 0.0283 𝑊𝑎𝑡𝑡.
The following Table 2 show the theoretical results.
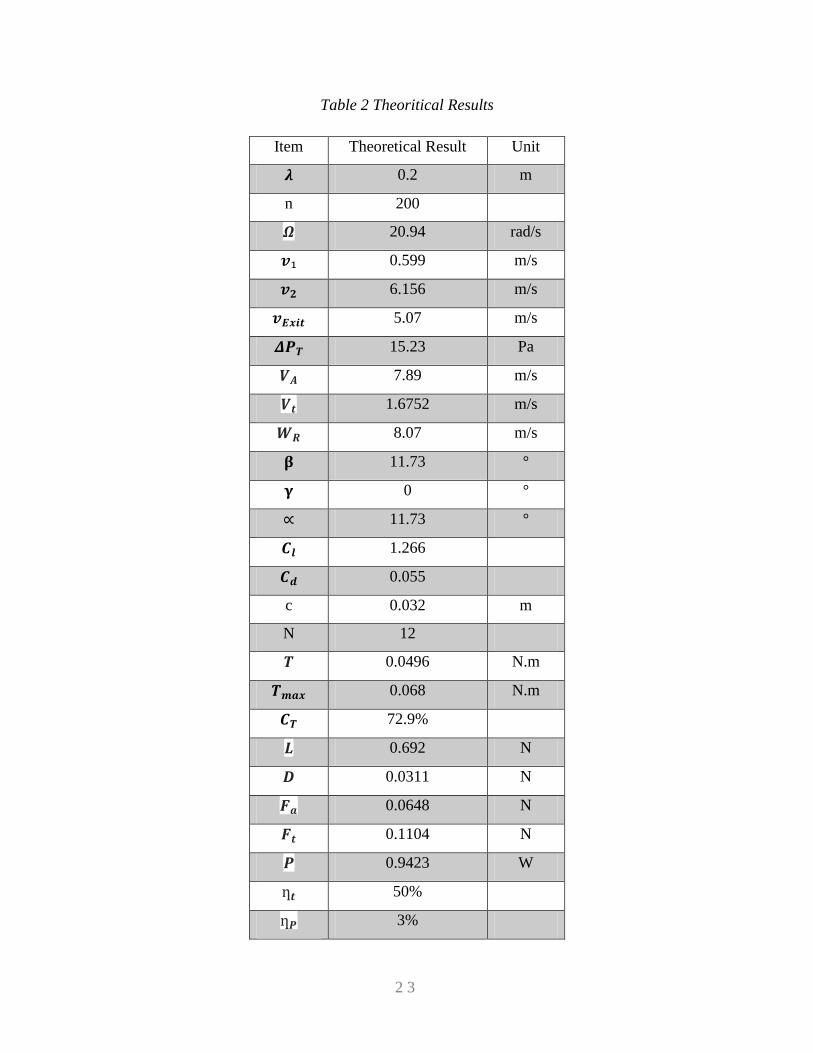
2 3
Table 2 Theoritical Results
Item Theoretical Result Unit
𝝀 0.2 m
n 200
𝜴 20.94 rad/s
𝒗₁ 0.599 m/s
𝒗𝟐 6.156 m/s
𝒗𝑬𝒙𝒊𝒕 5.07 m/s
𝜟𝑷𝑻 15.23 Pa
𝑽𝑨 7.89 m/s
𝑽𝒕 1.6752 m/s
𝑾𝑹 8.07 m/s
𝛃 11.73 °
𝛄 0 °
∝ 11.73 °
𝑪𝒍 1.266
𝑪𝒅 0.055
c 0.032 m
N 12
𝑻 0.0496 N.m
𝑻𝒎𝒂𝒙 0.068 N.m
𝑪𝑻 72.9%
𝑳 0.692 N
𝑫 0.0311 N
𝑭𝒂 0.0648 N
𝑭𝒕 0.1104 N
𝑷 0.9423 W
ƞ𝒕 50%
ƞ𝑷 3%
2 4
3.5 Cost Analysis and Suppliers List
In this section required materials availability, cost of ordered materials and suppliers list
will be introduced.
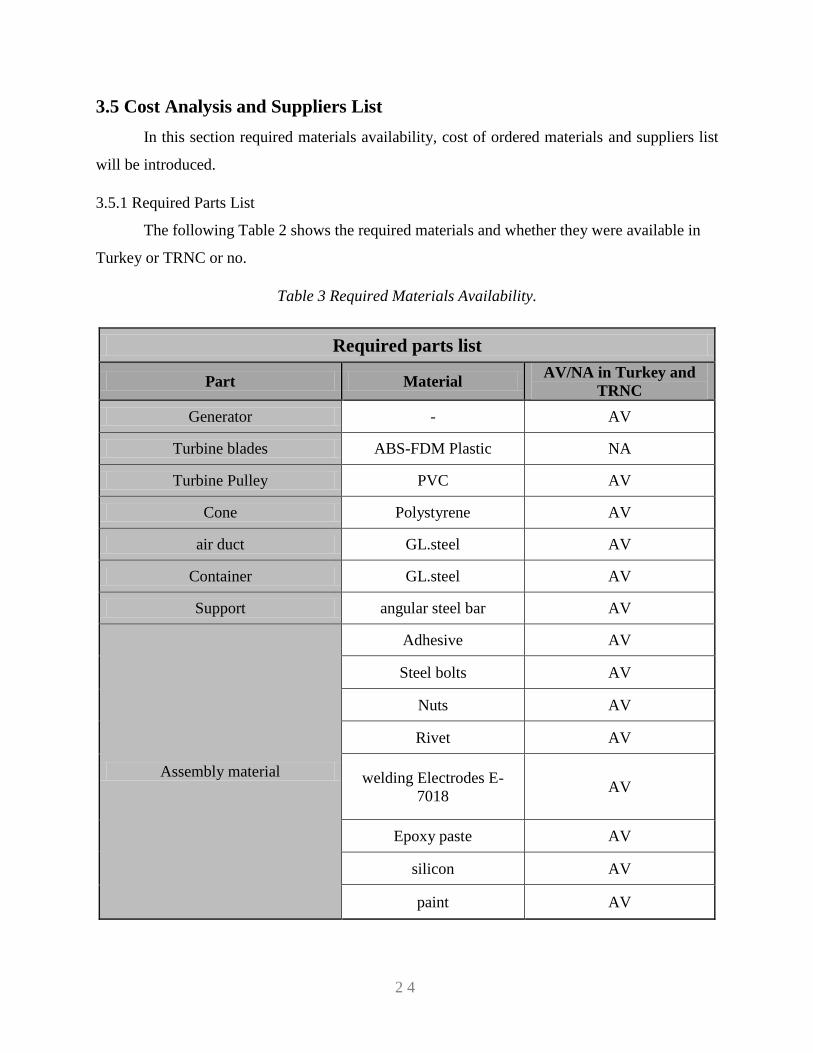
3.5.1 Required Parts List
The following Table 2 shows the required materials and whether they were available in
Turkey or TRNC or no.
Table 3 Required Materials Availability.
Required parts list
Part Material AV/NA in Turkey and
TRNC
Generator - AV
Turbine blades ABS-FDM Plastic NA
Turbine Pulley PVC AV
Cone Polystyrene AV
air duct GL.steel AV
Container GL.steel AV
Support angular steel bar AV
Assembly material
Adhesive AV
Steel bolts AV
Nuts AV
Rivet AV
welding Electrodes E-
7018 AV
Epoxy paste AV
silicon AV
paint AV
2 5
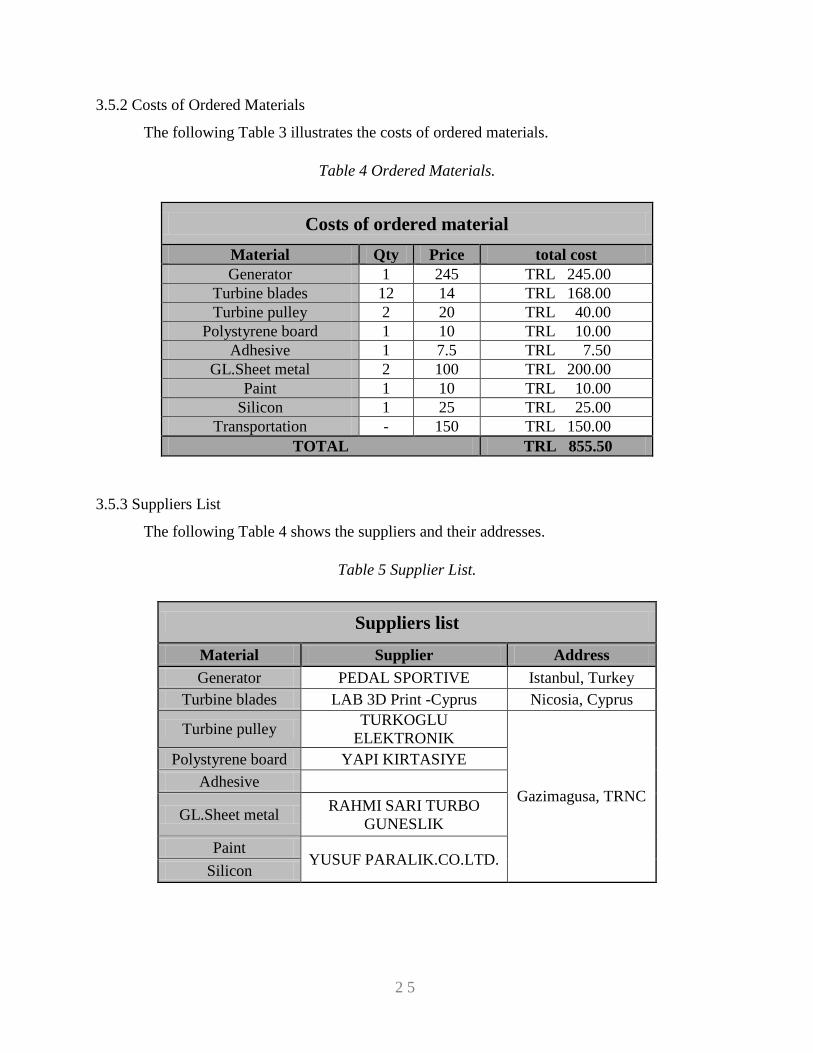
3.5.2 Costs of Ordered Materials
The following Table 3 illustrates the costs of ordered materials.
Table 4 Ordered Materials.
Costs of ordered material
Material Qty Price total cost
Generator 1 245 TRL 245.00
Turbine blades 12 14 TRL 168.00
Turbine pulley 2 20 TRL 40.00
Polystyrene board 1 10 TRL 10.00
Adhesive 1 7.5 TRL 7.50
GL.Sheet metal 2 100 TRL 200.00
Paint 1 10 TRL 10.00
Silicon 1 25 TRL 25.00
Transportation - 150 TRL 150.00
TOTAL TRL 855.50
3.5.3 Suppliers List
The following Table 4 shows the suppliers and their addresses.
Table 5 Supplier List.
Suppliers list
Material Supplier Address
Generator PEDAL SPORTIVE Istanbul, Turkey
Turbine blades LAB 3D Print -Cyprus Nicosia, Cyprus
Turbine pulley TURKOGLU
ELEKTRONIK
Gazimagusa, TRNC
Polystyrene board YAPI KIRTASIYE
Adhesive
GL.Sheet metal RAHMI SARI TURBO
GUNESLIK
Paint YUSUF PARALIK.CO.LTD.
Silicon

2 6
CHAPTER IV: MANUFACTURIN, ASSEMBLY & TESTING
This chapter will explain how the manufacturing process was conducted; also details of
assembly step by step and testing of final product will be reported.
4.1 Manufacturing
To manufacture the prototype, components were manufactured in the workshop using
conventional (Cutting, drilling, welding, grinding, joining) and modern manufacturing
techniques (3D Printer).
4.1.1 Container & Air Duct
The following steps were taken in order to manufacture the container and air duct:
1- Cutting the galvanized sheet (check Figures E1-3 in Appendix-E) to the following segments:
a- (1500x1000x1 mm) 1 piece. (See APPENDIX-C-DWG.NO.00-02-01)
b- (500x500x1 mm) 2 pieces. (See APPENDIX-C-DWG.NO.00-02-02)
c- (951x500x1 mm) 1 piece. (See APPENDIX-C-DWG.NO.00-02-03)
d- (1072x500x1 mm) 1 piece. (See APPENDIX-C-DWG.NO.00-02-04)
e- (858x500x1 mm) 1 piece. (See APPENDIX-C-DWG.NO.00-02-05)
The following Figure 4.1 shows cutting processes by using sheet metal guillotine (Shearing-
machine).
Figure 4.1 Cutting sheets metal by (Shearing-Machine).

2 7
2- Bending process was applied on segments (a, d and e) according to the design drawing as
it is shown in 2 Figure E-3 and in the following Figure 4.
Figure 4.2 Bending process.
3- Manual Metal Arc Welding process was applied in order to join all the parts to each other
to form the desire design (see APPENDIX-C-DWG.NO.00-02) as shown in Figures E5-7 in
Appendix-E and in the following Figure 4.3.
Figure 4.3 MMAW Process.
4- Surface finishing by using grinding machine shown in Figure 4.4.
Figure 4.4 Surface finishing.

2 8
5- Epoxy paste was applied over all welded surfaces shown in Figure 4.5 to protect it from
corrosion effects.
Figure 4.5 Applying Epoxy paste over welded part.
6- Painting the welded parts by Epoxy coating paint as shown in Figures E8-10 and the
following Figure 4.6.
Figure 4.6 Painting process.
4.1.2 Pipe & Wave Generating Device
Pipe, where the turbine fixed inside it, was manufactured from galvanized steel sheet
which had been cut (554x300x1 mm). Then, rolled by using manual rolling machine to the
diameter 170 mm and 300 mm length (see APPENDIX-C-DWG.NO.00-02.06), then the edges of
the sheets were welded to each other by spot welding process.

2 9
Wave generating device was manufactured from galvanized sheet metal that has been cut into
desired dimension (500x500x1 mm). Then, two handles were made from galvanized sheet meats
also welded to the previous sheet by spot welding process as shown in Figure 4.7.
Figure 4.7 Wave generating device.
4.1.3 Prototype Support
Support has been manufactured from standard angle iron 40*40*4 mm to the following
segments:
A-) 1010 mm 2 pieces, B-) 510 mm 2 Pieces, C-) 240 mm 4 Pieces.
Figure 4.8 shows cutting process by using portable grinding machine.
Figure 4.8 Cutting support’s parts.
Then, the cut parts have been welded to each other according to the related drawing (as shown in
APPENDIX-C- DWG.N0.00-01) by MMAW Process as shown in Figure 4.9.

3 0
Figure 4.9 Support manufacturing process.
4.1.4 Turbine Blades
The designed turbine has 12 blades. These blades (as shown in figure 4.10) were
designed by SolidWorks based on NACA 0021 shape (see Appendix-D-Table D.1) and then
manufactured by 3Dprinter.
Figure 4.10 Turbine blade.
4.1.5 Generator
Generator was made by modifying AC fan motor into AC generator (see Figures E11-13 in
Appendix-E) as the following steps:
1- Disassembly of the motor as shown in Figure 4.11.
Figure 4.11 Disassemble fan motor.
3 1
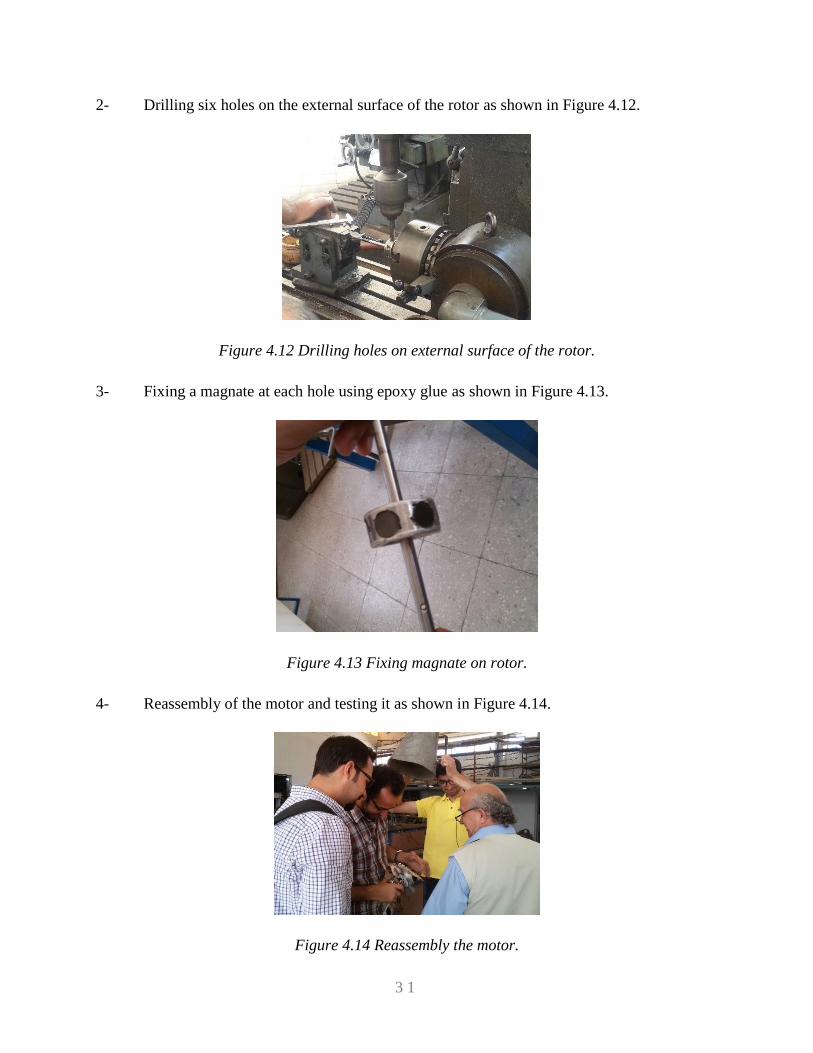
2- Drilling six holes on the external surface of the rotor as shown in Figure 4.12.
Figure 4.12 Drilling holes on external surface of the rotor.
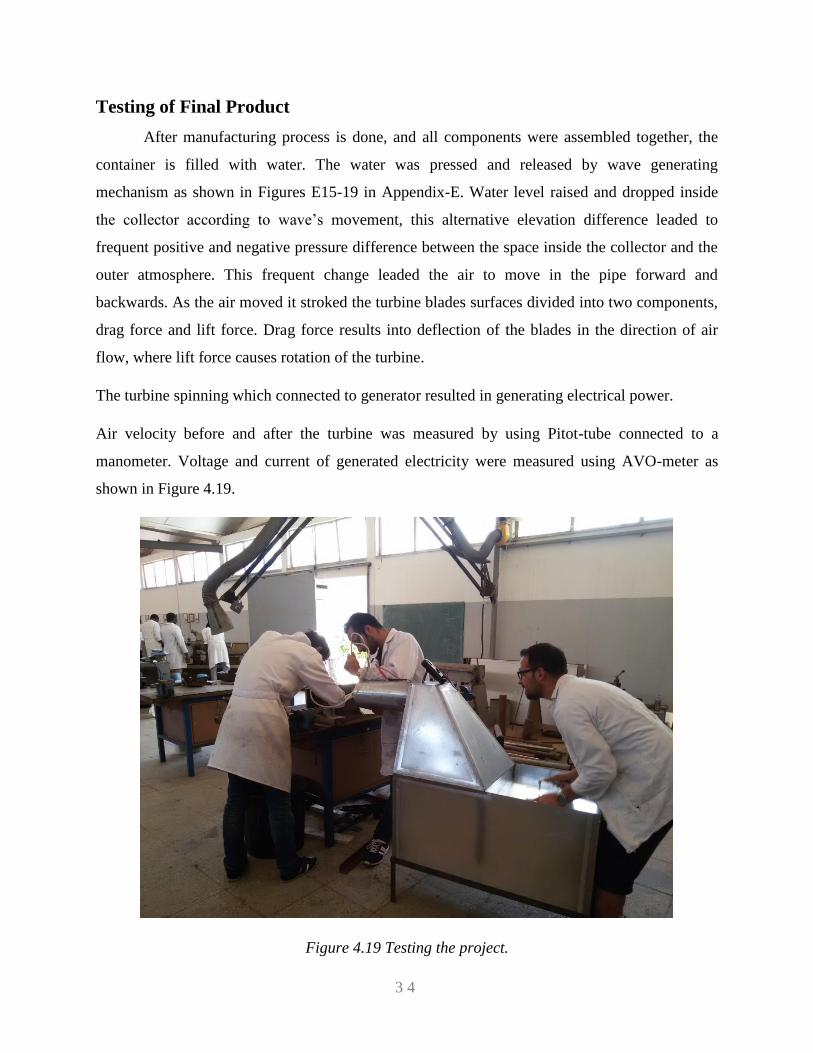
3- Fixing a magnate at each hole using epoxy glue as shown in Figure 4.13.
Figure 4.13 Fixing magnate on rotor.
4- Reassembly of the motor and testing it as shown in Figure 4.14.
Figure 4.14 Reassembly the motor.

3 2
By this process the motor was converted to generator by creating magnetic field between the
coils of the stator. As the rotor is being rotated, the magnetic field will be changed and alternated
on coils, causing electrons movement and electrical current generation.
Blades were glued on 2 plastic pulleys (6 blades on each pulley by Cyanoacrylate adhesive).
Generator support that holds the generator inside the pipe was made from galvanized steel sheet
segments by cutting and rolling to the outer diameter of the generator. Two U shaped segments
were spot welded on the support in order to hold it in place and modifying.
Cones were made from cubic polystyrene parts and shaped to conical shapes.
4.2 Assembly
The assembly process was accomplished by joining all the parts of the system together as
shown in Figure 4.15.
Figure 4.15 Prototype after assembly.
First of all, the pulleys with turbine blades were assembled to the generator shaft by nuts as
shown in Figure 4.16.
Figure 4.16 Turbine & Generator assembly.

3 3
Secondly, the assembled turbine-generator set had been joined with its supports and cones inside
the pipe by screws and nuts. Then, the air pipe has been assembled on the topside of the air duct
as shown in Figure 4.17 by using rivets.
Figure 4.17 Pipe & Air duct assembly.
Elsewhere, the tank and air collector were mounted on the supports as shown in the figure.
Finally, the AVO meter was connected to the generator output plug as shown in Figure 4.18.
Figure 4.18 Final assembly.
3 4
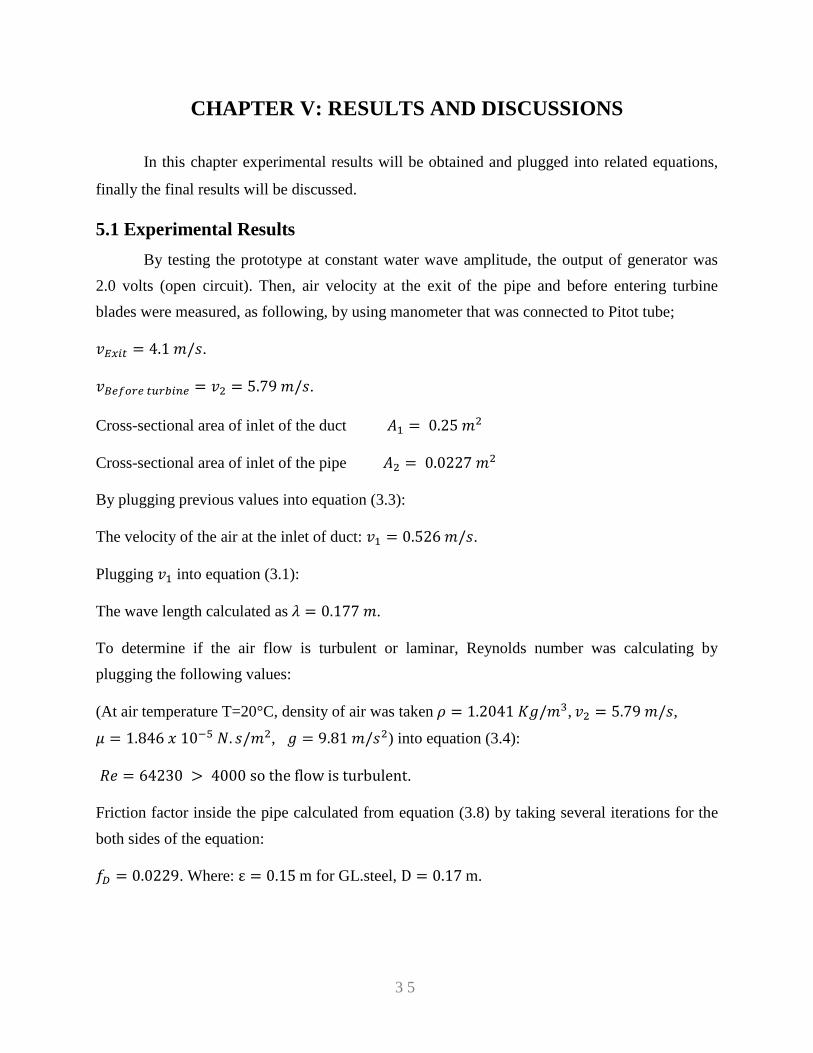
Testing of Final Product
After manufacturing process is done, and all components were assembled together, the
container is filled with water. The water was pressed and released by wave generating
mechanism as shown in Figures E15-19 in Appendix-E. Water level raised and dropped inside
the collector according to wave’s movement, this alternative elevation difference leaded to
frequent positive and negative pressure difference between the space inside the collector and the
outer atmosphere. This frequent change leaded the air to move in the pipe forward and
backwards. As the air moved it stroked the turbine blades surfaces divided into two components,
drag force and lift force. Drag force results into deflection of the blades in the direction of air
flow, where lift force causes rotation of the turbine.
The turbine spinning which connected to generator resulted in generating electrical power.
Air velocity before and after the turbine was measured by using Pitot-tube connected to a
manometer. Voltage and current of generated electricity were measured using AVO-meter as
shown in Figure 4.19.
Figure 4.19 Testing the project.
3 5
CHAPTER V: RESULTS AND DISCUSSIONS
In this chapter experimental results will be obtained and plugged into related equations,
finally the final results will be discussed.
5.1 Experimental Results
By testing the prototype at constant water wave amplitude, the output of generator was
2.0 volts (open circuit). Then, air velocity at the exit of the pipe and before entering turbine
blades were measured, as following, by using manometer that was connected to Pitot tube;
𝑣𝐸𝑥𝑖𝑡 = 4.1 𝑚/𝑠.
𝑣𝐵𝑒𝑓𝑜𝑟𝑒 𝑡𝑢𝑟𝑏𝑖𝑛𝑒 = 𝑣2 = 5.79 𝑚/𝑠.
Cross-sectional area of inlet of the duct 𝐴1 = 0.25 𝑚2
Cross-sectional area of inlet of the pipe 𝐴2 = 0.0227 𝑚2
By plugging previous values into equation (3.3):
The velocity of the air at the inlet of duct: 𝑣1 = 0.526 𝑚/𝑠.
Plugging 𝑣1 into equation (3.1):
The wave length calculated as 𝜆 = 0.177 𝑚.
To determine if the air flow is turbulent or laminar, Reynolds number was calculating by
plugging the following values:
(At air temperature T=20°C, density of air was taken 𝜌 = 1.2041 𝐾𝑔/𝑚3, 𝑣2 = 5.79 𝑚/𝑠,
𝜇 = 1.846 𝑥 10−5 𝑁. 𝑠/𝑚2, 𝑔 = 9.81 𝑚/𝑠2) into equation (3.4):
𝑅𝑒 = 64230 > 4000 so the flow is turbulent.
Friction factor inside the pipe calculated from equation (3.8) by taking several iterations for the
both sides of the equation:
𝑓𝐷 = 0.0229. Where: ε = 0.15 m for GL.steel, D = 0.17 m.
3 6
Pressure drop in the pipe is calculated by plugging the results into equation (3.6):
𝛥𝑝 = 0.48 𝑃𝑎.
Pressure drop in the duct due to level elevation was found from equation (3.5):
𝛥𝑝 = 7.38 𝑃𝑎.
Pressure drop at the turbine blades is found from equation (3.9):
𝛥𝑝 = 10.06 𝑃𝑎.
The overall pressure drop is calculated by summing all pressure drop values:
𝛥𝑃𝑇 = 17.92 𝑃𝑎.
Rotational speed 𝛺 was measured by calculating number of rotation n and stopwatch
𝑛 = 180 𝑟𝑝𝑚 and 𝛺 = 18.85 𝑟𝑎𝑑/𝑠.
𝑅𝑇 = 0.08 𝑚, 𝑅𝐻 = 0.0375 𝑚, plugging into equation (3.16) average radius of the blades is
calculated:
Rav = 0.0588 𝑚.
From equation (3.13) tip linear velocity is calculated:
𝑉𝑡 = 1.508 𝑚𝑙𝑠.
From equation (3.14) axial velocity of air cross turbine:
𝑉𝐴 = 7.42 𝑚𝑙𝑠.
From equation (3.15) resultant relative velocity is calculated:
𝑊𝑅 = 7.57 𝑚/𝑠.
Angle of incidence was calculated from equation (3.11):
β == 11.49 °,
γ = 0° That gives from equation (3.12) angle of attack:
∝= 11.49°.
From the Table 3 at ∝= 11.49° by applying linear interpolation:

3 7
𝐶𝑙 = 1.164, 𝐶𝑑 = 0.056.
𝑐 = 0.032 𝑚 , 𝑁 = 12.
The torque in turbine blades is calculated from equation (3.10):
𝑇 == 0.0363 𝑁. 𝑚.
From equation (3.17) maximum obtainable torque can be calculated:
𝑇𝑚𝑎𝑥 = 0.0602 𝑁. 𝑚.
The coefficient of torque is obtained from equation (3.18):
𝐶𝑇 = 0.603 = 60.3 %.
To find lift and drag forces; Lift force from equation (3.19) is:
𝐿 = 0.655 𝑁.
And drag force from equation (3.20) is:
𝐷 = 0.0315 𝑁.
From previous values, tangential and axial forces is calculated as follows; axial force from
equation (3.21):
𝐹𝑎 = 0.0648 𝑁.
And tangential force from equation (3.22):
𝐹𝑡 = 0.0996 𝑁.
In order to calculate output power from equation (3.23):
𝑃 = 0.684 𝑊𝑎𝑡𝑡.
From equation (3.24):
ƞ𝑡 = 32.8 %.
To measure overall efficiency, a closed circuit is constructed using 120 Ohm resistor, the output
voltage of the turbine 𝑉 = 0.1 volt and the current 𝐼 = 0.08 A, plugging into equation (3.25):
ƞ𝑃 = 1.17 %.
3 8
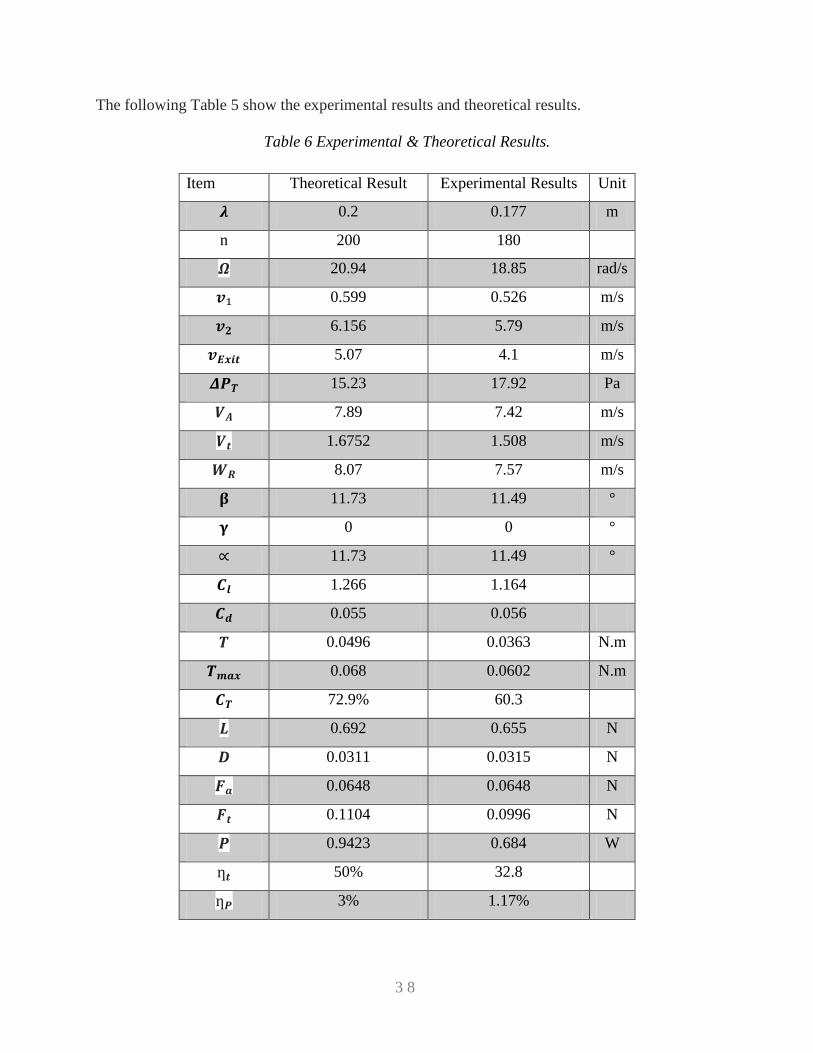
The following Table 5 show the experimental results and theoretical results.
Table 6 Experimental & Theoretical Results.
Item Theoretical Result Experimental Results Unit
𝝀 0.2 0.177 m
n 200 180
𝜴 20.94 18.85 rad/s
𝒗₁ 0.599 0.526 m/s
𝒗𝟐 6.156 5.79 m/s
𝒗𝑬𝒙𝒊𝒕 5.07 4.1 m/s
𝜟𝑷𝑻 15.23 17.92 Pa
𝑽𝑨 7.89 7.42 m/s
𝑽𝒕 1.6752 1.508 m/s
𝑾𝑹 8.07 7.57 m/s
𝛃 11.73 11.49 °
𝛄 0 0 °
∝ 11.73 11.49 °
𝑪𝒍 1.266 1.164
𝑪𝒅 0.055 0.056
𝑻 0.0496 0.0363 N.m
𝑻𝒎𝒂𝒙 0.068 0.0602 N.m
𝑪𝑻 72.9% 60.3
𝑳 0.692 0.655 N
𝑫 0.0311 0.0315 N
𝑭𝒂 0.0648 0.0648 N
𝑭𝒕 0.1104 0.0996 N
𝑷 0.9423 0.684 W
ƞ𝒕 50% 32.8
ƞ𝑷 3% 1.17%
3 9
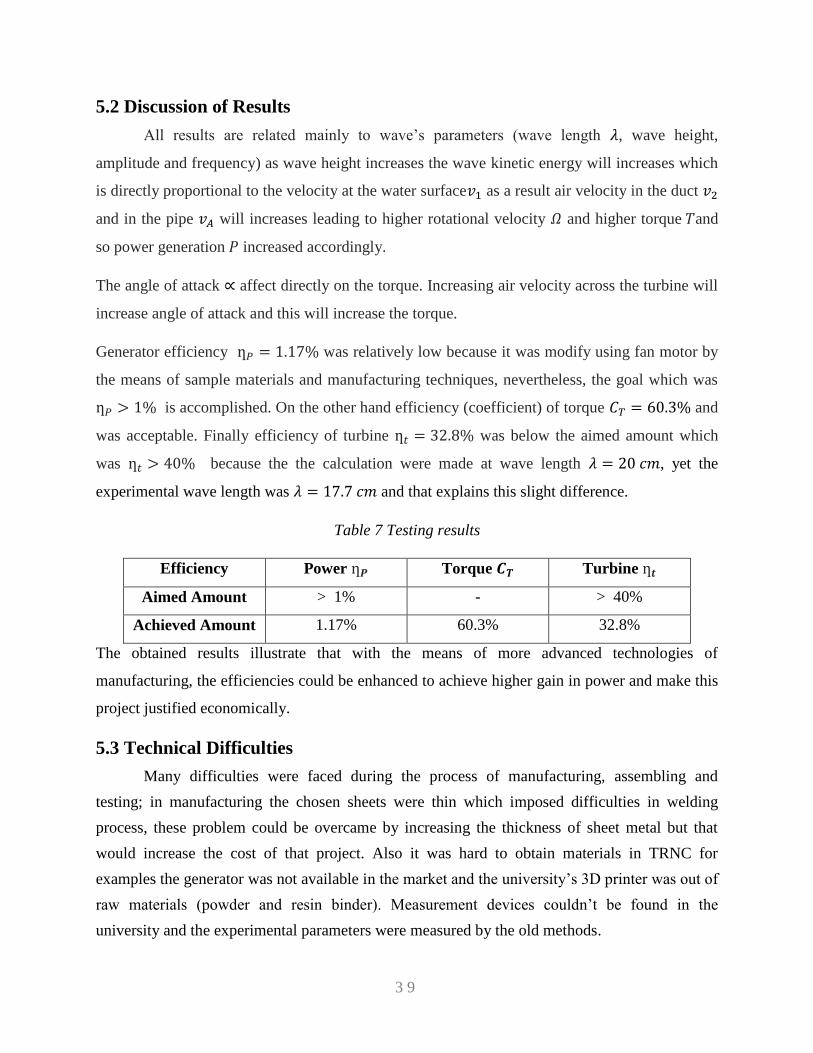
5.2 Discussion of Results
All results are related mainly to wave’s parameters (wave length 𝜆, wave height,
amplitude and frequency) as wave height increases the wave kinetic energy will increases which
is directly proportional to the velocity at the water surface𝑣1 as a result air velocity in the duct 𝑣2
and in the pipe 𝑣𝐴 will increases leading to higher rotational velocity 𝛺 and higher torque 𝑇and
so power generation 𝑃 increased accordingly.
The angle of attack ∝ affect directly on the torque. Increasing air velocity across the turbine will
increase angle of attack and this will increase the torque.
Generator efficiency ƞ𝑃 = 1.17% was relatively low because it was modify using fan motor by
the means of sample materials and manufacturing techniques, nevertheless, the goal which was
ƞ𝑃 > 1% is accomplished. On the other hand efficiency (coefficient) of torque 𝐶𝑇 = 60.3% and
was acceptable. Finally efficiency of turbine ƞ𝑡 = 32.8% was below the aimed amount which
was ƞ𝑡 > 40% because the the calculation were made at wave length 𝜆 = 20 𝑐𝑚, yet the
experimental wave length was 𝜆 = 17.7 𝑐𝑚 and that explains this slight difference.
Table 7 Testing results
Efficiency Power ƞ𝑷 Torque 𝑪𝑻 Turbine ƞ𝒕
Aimed Amount > 1% - > 40%
Achieved Amount 1.17% 60.3% 32.8%
The obtained results illustrate that with the means of more advanced technologies of
manufacturing, the efficiencies could be enhanced to achieve higher gain in power and make this
project justified economically.
5.3 Technical Difficulties
Many difficulties were faced during the process of manufacturing, assembling and
testing; in manufacturing the chosen sheets were thin which imposed difficulties in welding
process, these problem could be overcame by increasing the thickness of sheet metal but that
would increase the cost of that project. Also it was hard to obtain materials in TRNC for
examples the generator was not available in the market and the university’s 3D printer was out of
raw materials (powder and resin binder). Measurement devices couldn’t be found in the
university and the experimental parameters were measured by the old methods.

4 0
CHAPTER VI: FUTURE WORKS & CONCLUSION
The future works and developments of the project will be discussed in this chapter as
well a final conclusion.
6.1 Future Works
First of all the turbine blades can have variable pitches depending on flow direction in
order to obtain the maximum possible efficiency. Second, air speed can be controlled using extra
controlled check valve which opens when the air pass over the designed speed to decrease the
speed of air. Third, the generator can be optimized in order to increase the efficiency. Finally, a
guide pates can be placed in front of turbine blades to guide the air toward the blades and obtain
the maximum efficiency by minimizing the drag force and increasing the lift force generated by
the turbine blades.
6.2 Conclusion
This report has summarized engineering problem of energy and introduced brief
information about this problem. Then, wave energy was introduced as a solution for this
problem, many previous projects were illustrated and comparison has been made between
advantages and disadvantages of each one. Later, project components were proposed, materials
were selected, design related equations were solved using mathematic knowledge and cost
analysis with detailed list of suppliers were introduced. Moreover, manufacturing steps were
explained in detail, assembling process has been illustrated, testing was conducted and
experimental results were reported. Finally, these experimental results were plugged into related
equations and calculations were made. As a conclusion, wave power energy can be used as a
subsidiary power source generation. Although the efficiency is low and accordingly not feasible
but with more advanced and precise manufacturing technologies it can become feasible and
economically justified.

4 1
REFERENCES
[1]. (1996). Renewable Energy: Power for sustainable future. (G. Boyle, Ed.) New York: Oxford
University.
[2]. Zodiatis, G. (2014). Renewable Energy: Wave energy potential in the Eastern
Mediterranean Levantine Basin. Nicosia 1678, Cyprus: Oceanography Centre,University
of Cyprus.
[3]. Musial, W., Pontes, T., & Torres-Martinez, J. (2011). Renewable Energy. Cambridge
University Press, Cambridge, United Kingdom and New York, NY, USA.
[4]. (2006). LIMPET. Retrieved October 10, 2014 from Wave Power Generation:
http://people.bath.ac.uk/mh391/WavePower/limpet.html
[5]. Joubert, J. R. (2088). AN INVESTIGATION OF THE WAVE ENERGY RESOURCE ON THE
SOUTH AFRICAN COAST, FOCUSING ON THE SPATIAL DISTRIBUTION OF THE
SOUTH WEST COAST. University of Stellenbosch.
[6]. (2008). Energy from the sea [the Pelamis project]. Retrieved November 6, 2014 from
DinoWeblog Wordpress:
https://dinosweblog.wordpress.com/2008/03/26/energy-from-the-sea-the-pelamis-project/
[7]. (2011). PowerBuoy. Retrieved November 7, 2014 from Jagadees Wordpress:
https://jagadees.wordpress.com/2010/04/24/powerbuoy/
[8]. Scarr, D., Kollek, R., & Collier, D. (2011). WAVE ENERGY Arup Energy
Ove Arup & Partners International
[9]. (2010, Jan 19). Wave Power Generation. Retrieved November 7, 2014 from People Bath:
http://people.bath.ac.uk/hw324/wave/howitworks/index.html
[10]. (2014). GL Sheet. Retrieved November 9, 2014 from Modern Ajman Steel Factory:
http://ajmansteel.com/product-detail/gi-sheets/
[11]. (2014). Wave Measurement. Retrieved March 5, 2015 from The costal data information:
http://cdip.ucsd.edu/?nav=documents&sub=index&stn=166&xitem=waves
[12]. Gareev, A. (2011). Analysis of variable pitch air turbine for oscillating water column
(OWC) wave energy converters. Gareev, A. (2011). Analysis of variable pitch air turbine
for oscillating water column (OWC) wave energy converters.
[13]. Wolfe, W. P. (1997). Predicting Aerodynamic Characteristics of Typical Wind Turbine
Airfoils Using CFD. Ames, IA: Iowa State University.
4 2
APPENDICES
APPENDIX-A: Logbooks.
APPENDIX-B: Gantt Chart.
APPENDIX-C: Drawings.
APPENDIX-D: Engineering Standards Used.
APPENDIX-E: Manufacturing Photos.
APPENDIX-F: Poster, Website & Final CD.

4 3
APPENDIX-A: LOG BOOKS

4 4
Logbook: Mhd Imad Eddin Khchifati 138484
Dates Details
21/10/2014 Firstly, I received our capstone project from our advisor Lec. Cafer Kızılörs with my
team members. Our advisor explained briefly about the project
23/10/2014 Group meeting was held. I started working on Gantt chart.
25/10/2014 I started researching about sea waves various systems.
28/10/2014 My team members and I suggested several designs and ideas with our advisor
31/10/2014 Group meeting was held and duties were distributed where I took the responsibility to
write the introduction chapter
03/11/2014 My team members and I visited our advisor for extra information and explanation.
Preliminary design was suggested.
07/11/2014 My team members and I started drawings and calculations.
14/11/2014 We met our advisor and asked for his help in designing turbine.
15/11/2014 I started writing the introduction chapter
24/11/2014 I sent the introduction chapter to our advisor for checking and we visited him for his
notes and comments.
05/12/2014 I started writing the components part of the design chapter
09/12/2014 My team members and I started writing calculations part.
13/12/2014 I drew air collector system using SolidWorks software
17/12/2014 I sent my final works to my other team members and we worked on organization of
the report
29/12/2014 I visited our advisor with my team members for report's finished parts checking
01/01/2015 Group meeting was held. We worked on repairing our report.
05/01/2015 I visited our advisor with my team members for report's checking
09/01/2015 We have submitted the final report to the supervisor Assit.Prof. Neriman Ozada

4 5
16/01/2015 I had a meeting with my group mates to search for materials and components
23/01/2015 Another meeting was organized to distribute duties for searching duties
02/02/2015 My group mates and I had meeting to share our search results.
10/02/2015 We decided which suppliers to visit and started in Famagusta industrial areas.
13/02/2015 Another visit to suppliers in Famagusta was organized.
18/02/2015 We visited several suppliers in Nicosia
16/03/2015 We had a meeting with our adviser to share information
24/03/2015 I have visited GENC store to check for materials.
04/04/2015 I had meeting with my group mates
14/04/2015 I helped Awad in Turbine testing
24/04/2015 We had a meeting with our adviser to check our search results share opinions
25/04/2015 With my group mates, we have modified the design
01/05/2015 We have ordered the sheet metal and I started working on the support
20/05/2015 We have assembled the parts which we were working on
22/05/2015 I have sealed the corners of assembly with silicone sealant
27/05/2015 My group mates and I started experimenting and taking data
28/05/2015 We had a meeting to start calculations of our project
03/06/2015 We started working on the report
12/06/2015 We had a meeting with our adviser to show him our work and take feedbacks
15/06/2015 My group mates and I had meeting to finalize the report
17/06/2015 We showed our final work to our adviser

4 6
Logbook: Abdullah Terkaoui 138565
Dates Details
21/10/2014 Firstly, I received our capstone project from our advisor Lec. Cafer Kızılörs with my
team members. Our advisor explained briefly about the project
23/10/2014 Group meeting was held
26/10/2014 I started researching about sea waves various systems.
28/10/2014 Me and my team members suggested several designs and ideas with our advisor
31/10/2014
Group meeting was held and duties were distributed where I took the responsibility to
write the historical view about wave generation and wave energy probability in
Cyprus in chapter II
03/11/2014 I and my team members visited our advisor for extra information and explanation.
Preliminary design was suggested.
07/11/2014 Me and my team members started drawings and calculations.
14/11/2014 We met our advisor and asked for his help in designing turbine.
24/11/2014 Me and my team members visited our advisor and asked him for his notes and
comments on Chapter I
1/12/2014 I started writing my duties in chapter II
07/12/2014 I started writing the material selected part of the chapter III
09/12/2014 Me and my team members started writing calculations part
11/12/2014 I drew steel barrel and its support with wave generation mechanism by using
SolidWorks software
15/12/2014 I sent my final works to my partners and we worked on organization of the report
29/12/2014 I visited our advisor with my team members for report's finished parts checking
01/01/2015 Group meeting was held. We worked on repairing our report.
05/01/2015 I visited our advisor with my team partners for report's checking
06/01/2014 I prepared my logbook

4 7
09/01/2015 We have submitted the final report to the supervisor Assit.Prof. Neriman Ozada
16/01/2015 I had a meeting with my group mates to search for materials and components
23/01/2015 Another meeting was organized to distribute duties for searching duties
02/02/2015 My group mates and I had meeting to share our search results.
10/02/2015 We decided which suppliers to visit and started in Famagusta industrial areas.
13/02/2015 Another visit to suppliers in Famagusta was organized.
18/02/2015 We visited several suppliers in Nicosia
16/03/2015 We had a meeting with our adviser to share information
24/03/2015 I have visited several electronics stores to check for a generator.
04/04/2015 I had meeting with my group mates
07/04/2015 I worked on generator modifications
24/04/2015 We had a meeting with our adviser to check our search results share opinions
25/04/2015 With my group mates, we have modified the design
04/05/2015 I started working on the air collector and turbine support
20/05/2015 We have assembled the parts which we were working on
22/05/2015 I have applied epoxy paste to welded areas of assembly
27/05/2015 My group mates and I started experimenting and taking data
28/05/2015 We had a meeting to start calculations of our project
03/06/2015 We started working on the report
12/06/2015 We had a meeting with our adviser to show him our work and take feedbacks
15/06/2015 My group mates and I had meeting to finalize the report
17/06/2015 We showed our final work to our adviser

4 8
Logbook: Awad Alterkaoui 138566
Dates Details
21/10/2014 Firstly, I received our capstone project from our advisor Lec. Cafer Kızılörs with my
team members. Our advisor explained briefly about the project
23/10/2014 Group meeting was held
25/10/2014 I started researching about sea waves various systems.
28/10/2014 Abdullah, Imad and me suggested several designs and ideas with our advisor
31/10/2014 Group meeting was held and duties were distributed where I took the responsibility
to write the wave energy devices and their development in chapter II
03/11/2014 My team partners and me visited our advisor for extra information and explanation.
Preliminary design was suggested.
07/11/2014 Me and my team members started drawings and calculations.
14/11/2014 We met our advisor and asked for his help in designing turbine.
24/11/2014 Me and my team members visited our advisor and asked him for his notes and
comments for chapter I.
02/12/2014 I started writing my duties in chapter II
05/12/2014 I started writing the manufacturing and assembling part of the design chapter
09/12/2014 Me and my team members started writing calculations part.
12/12/2014 I drew the turbine blades, blades fixer, a the dome by using SolidWorks software
17/12/2014 I sent my final works to my partners and we worked on organization of the report
29/12/2014 I visited our advisor with my team members for report's finished parts checking
01/01/2015 Group meeting was held. We worked on repairing our report.
05/01/2015 Me and my partners visited our advisor for report's checking
07/12/2014 I prepared my logbook
09/01/2015 We have submitted the final report to the supervisor Assit.Prof. Neriman Ozada
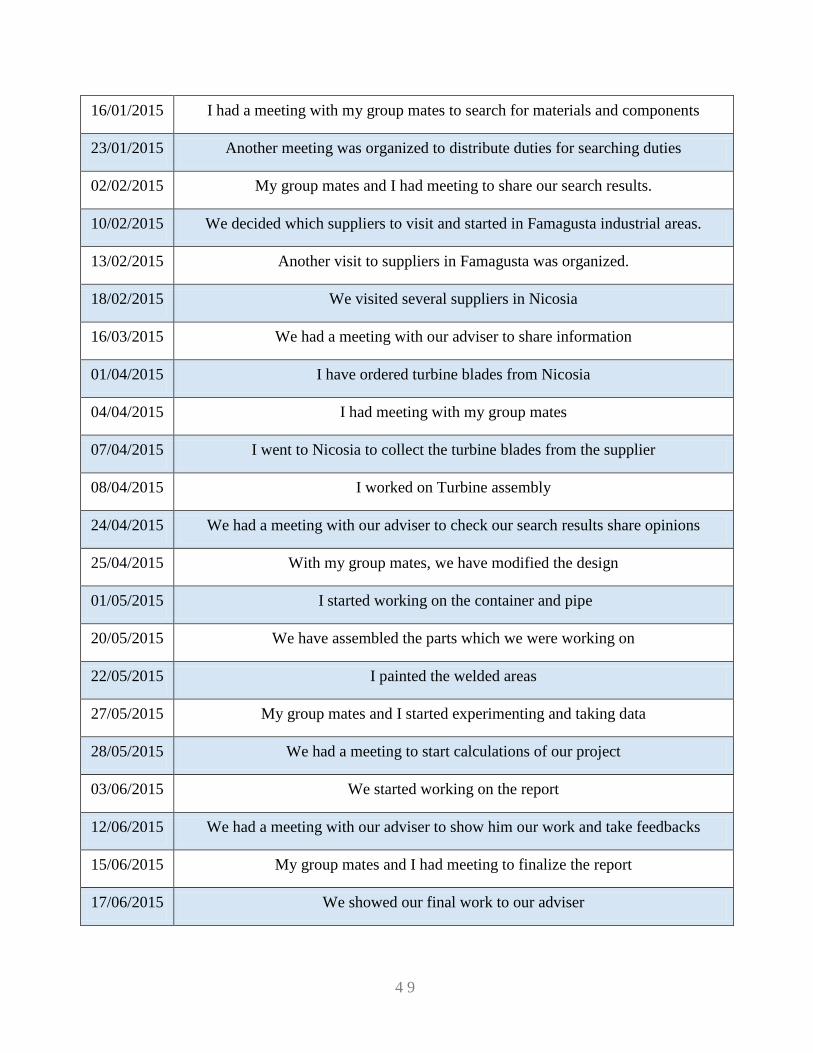
4 9
16/01/2015 I had a meeting with my group mates to search for materials and components
23/01/2015 Another meeting was organized to distribute duties for searching duties
02/02/2015 My group mates and I had meeting to share our search results.
10/02/2015 We decided which suppliers to visit and started in Famagusta industrial areas.
13/02/2015 Another visit to suppliers in Famagusta was organized.
18/02/2015 We visited several suppliers in Nicosia
16/03/2015 We had a meeting with our adviser to share information
01/04/2015 I have ordered turbine blades from Nicosia
04/04/2015 I had meeting with my group mates
07/04/2015 I went to Nicosia to collect the turbine blades from the supplier
08/04/2015 I worked on Turbine assembly
24/04/2015 We had a meeting with our adviser to check our search results share opinions
25/04/2015 With my group mates, we have modified the design
01/05/2015 I started working on the container and pipe
20/05/2015 We have assembled the parts which we were working on
22/05/2015 I painted the welded areas
27/05/2015 My group mates and I started experimenting and taking data
28/05/2015 We had a meeting to start calculations of our project
03/06/2015 We started working on the report
12/06/2015 We had a meeting with our adviser to show him our work and take feedbacks
15/06/2015 My group mates and I had meeting to finalize the report
17/06/2015 We showed our final work to our adviser
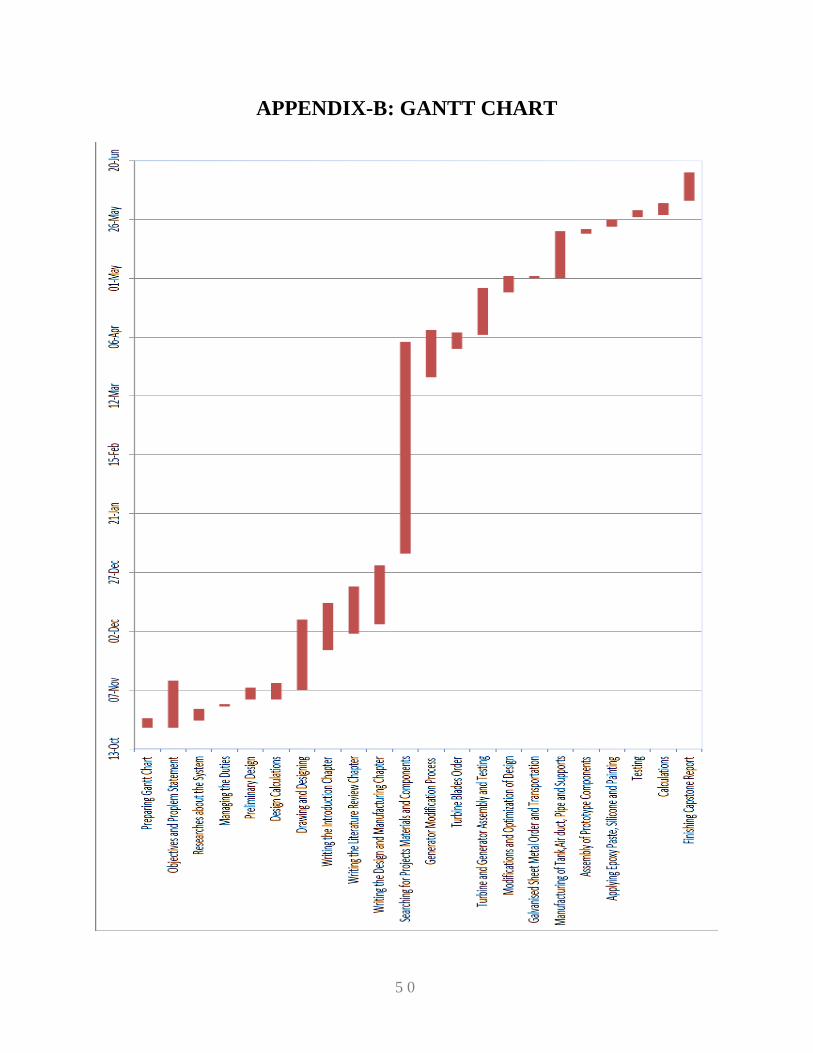
5 0
APPENDIX-B: GANTT CHART

5 1
APPENDIX-C: DRAWINGS
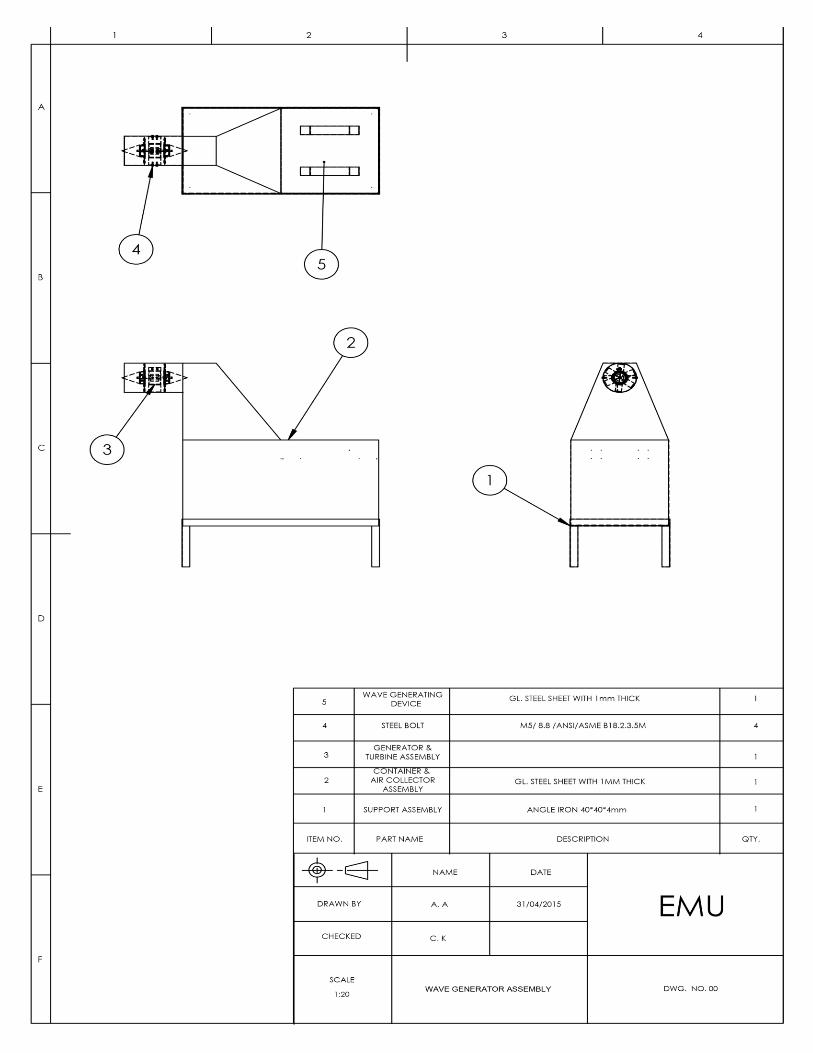
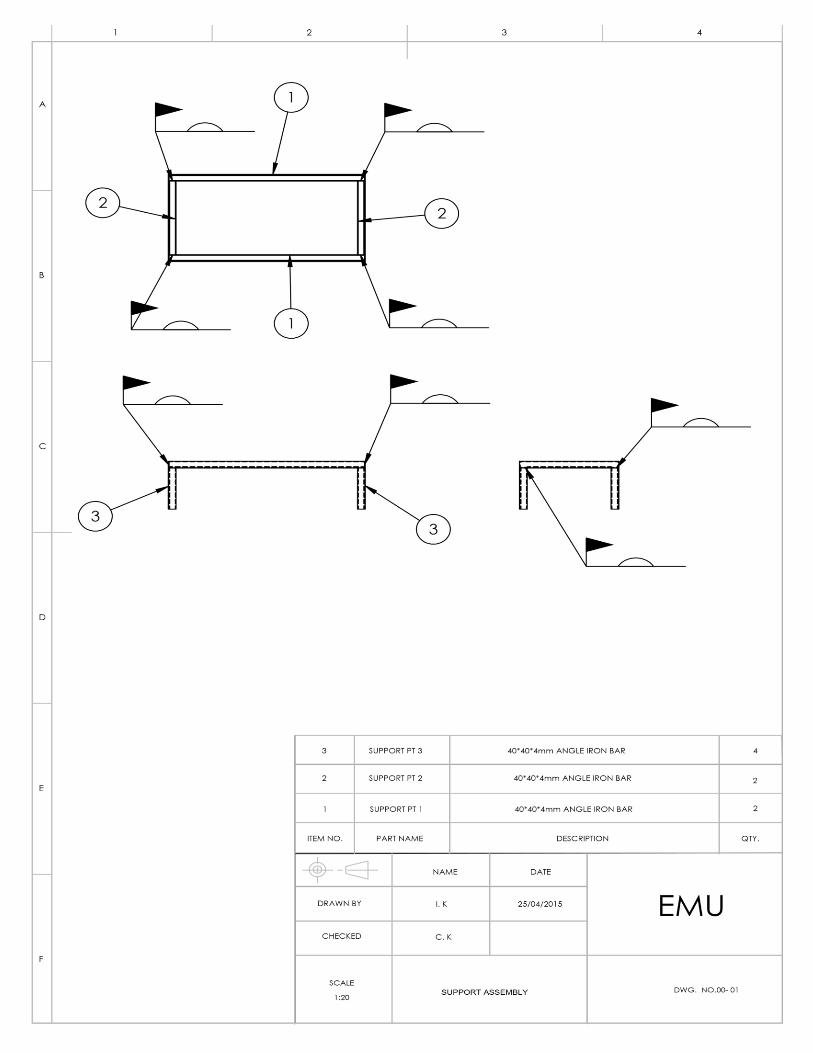
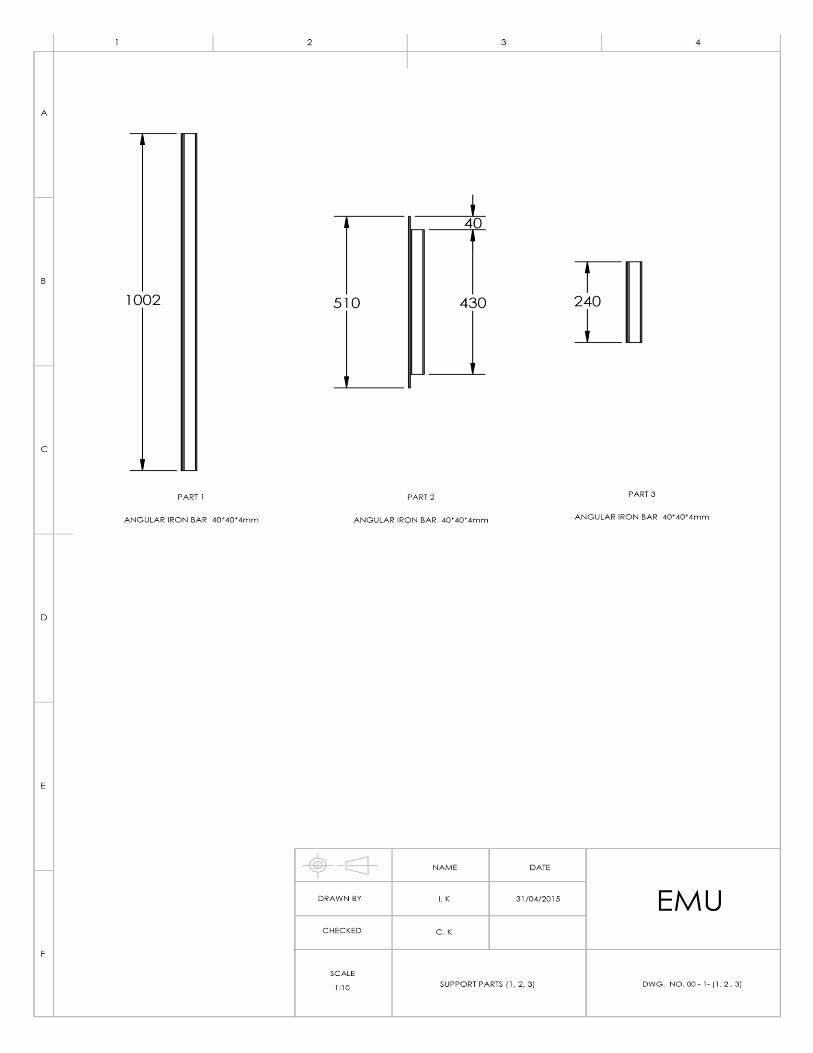
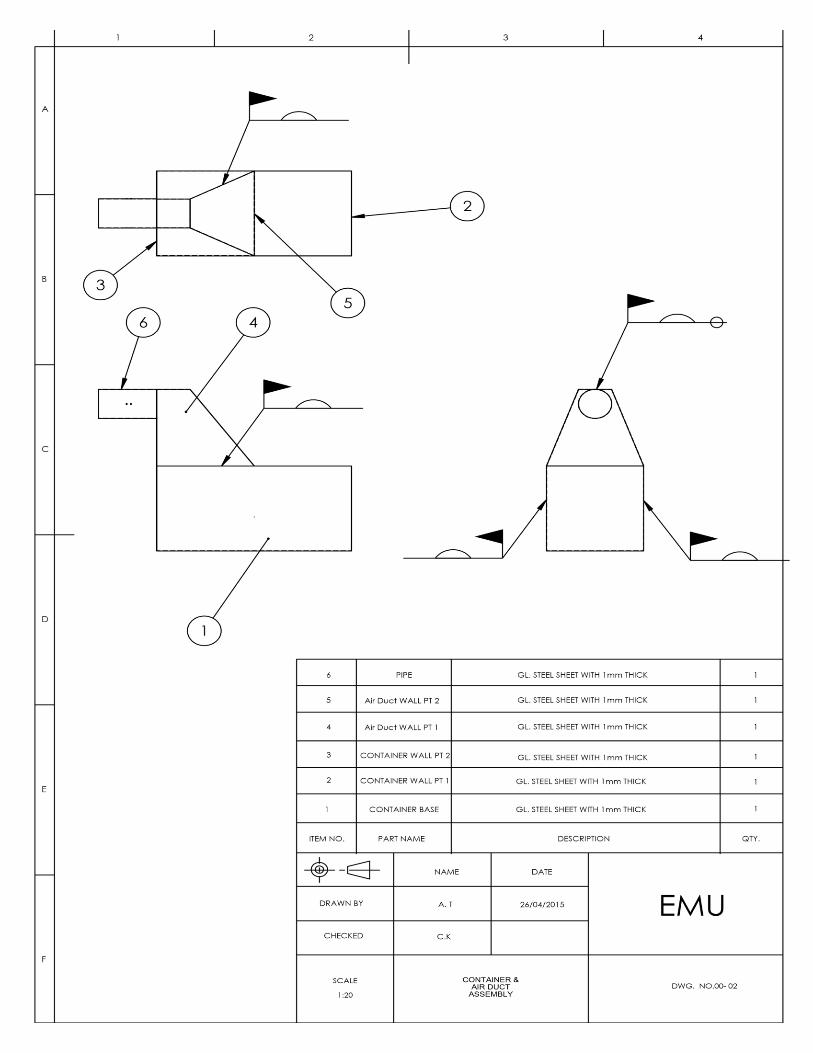
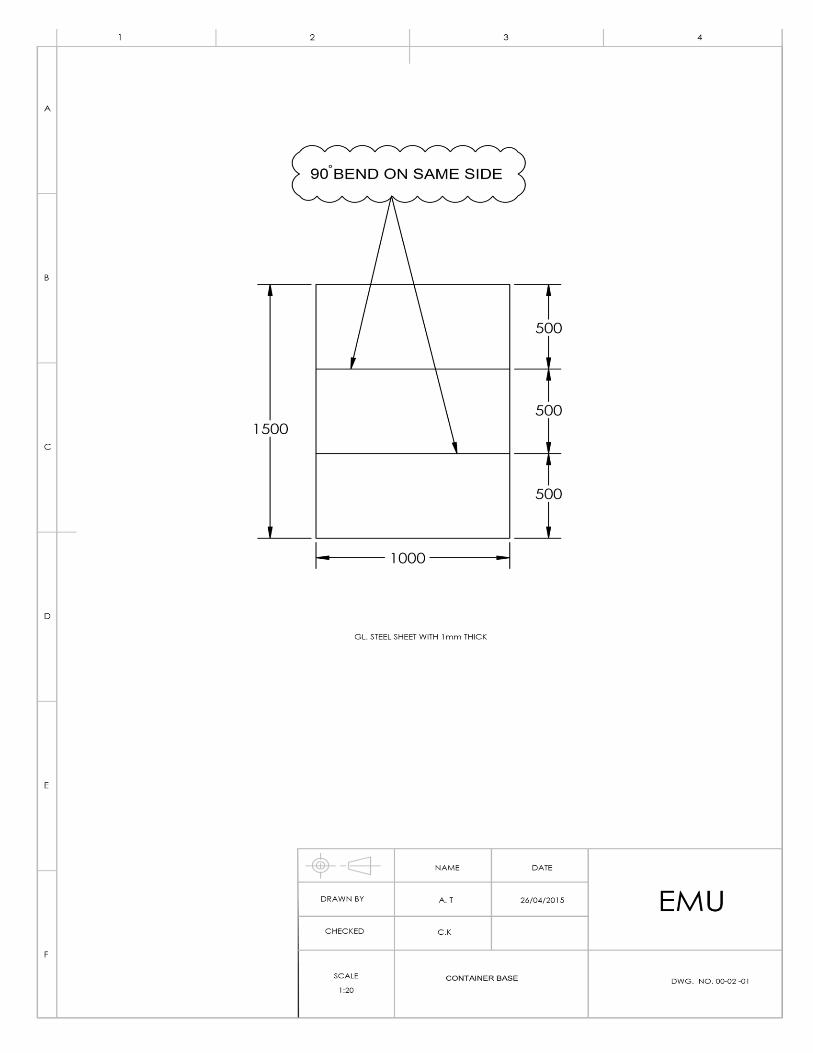

500
500
GL. STEEL SHEET WITH 1mm THICK
C
2 3 1 4
B
A
D
E
F
CONTAINER WALL PT 1
DRAWN BY
CHECKED
SCALE 1:4
DATE NAME
DWG. NO. 00-02 -02
EMU C.K
A. T 26/04/2015
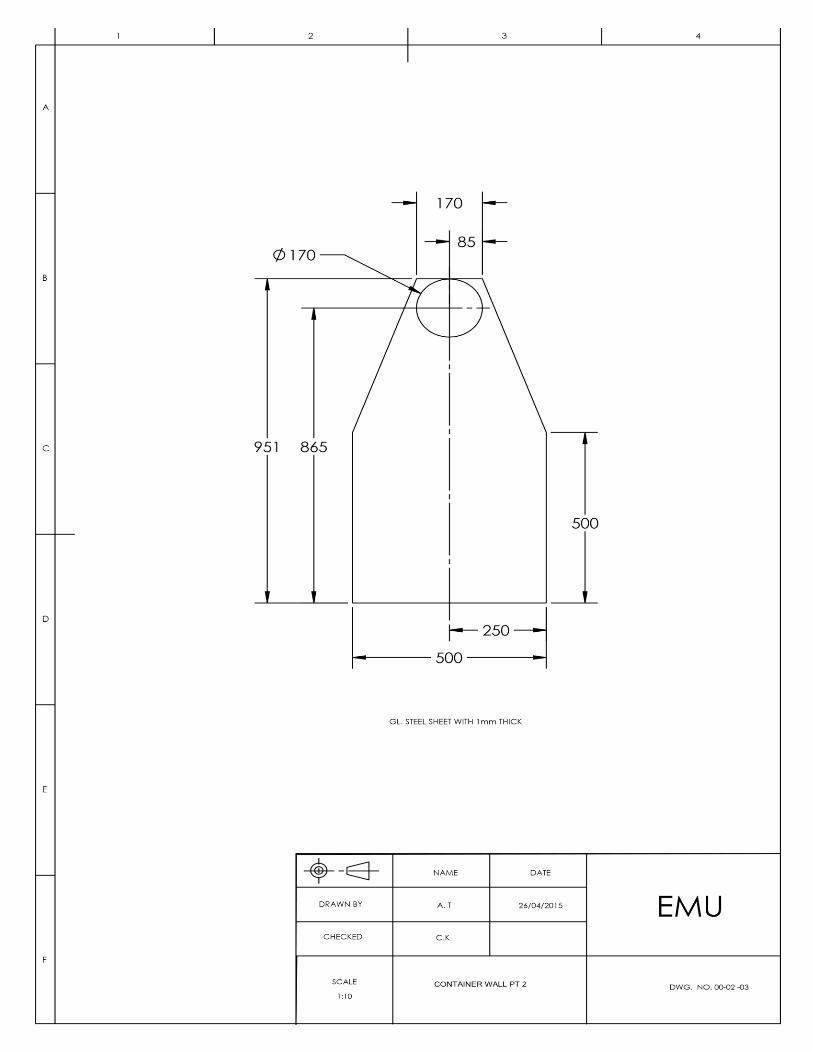

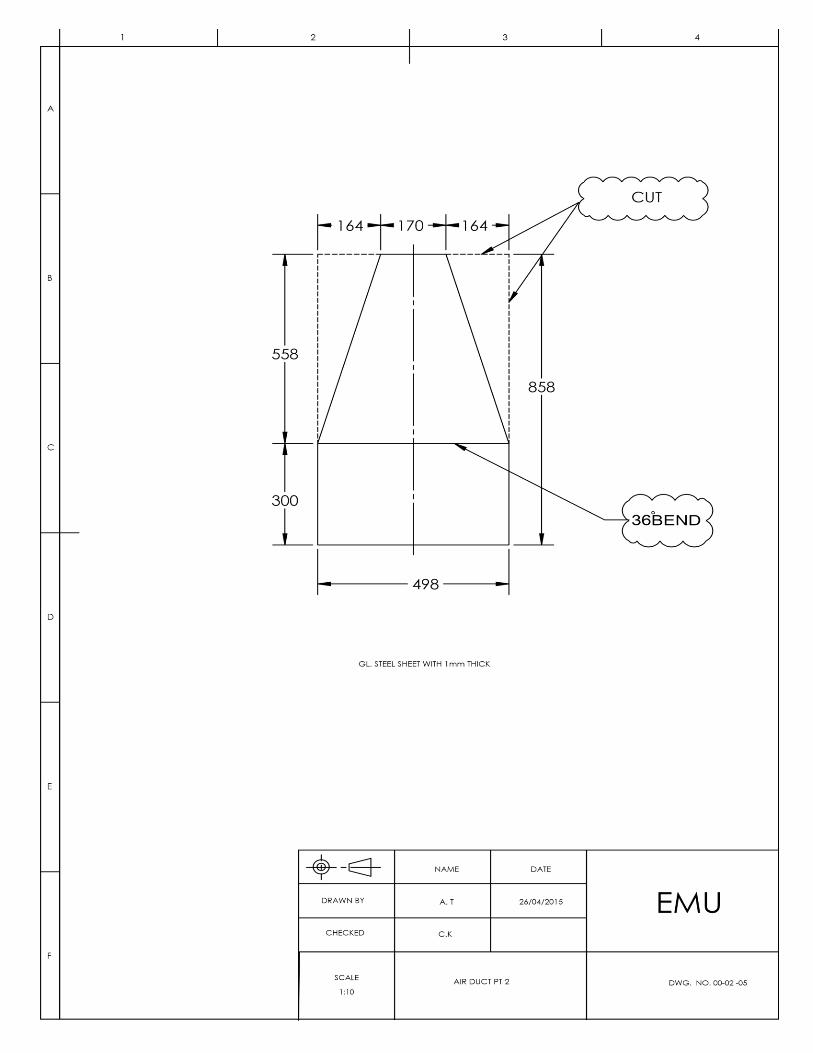
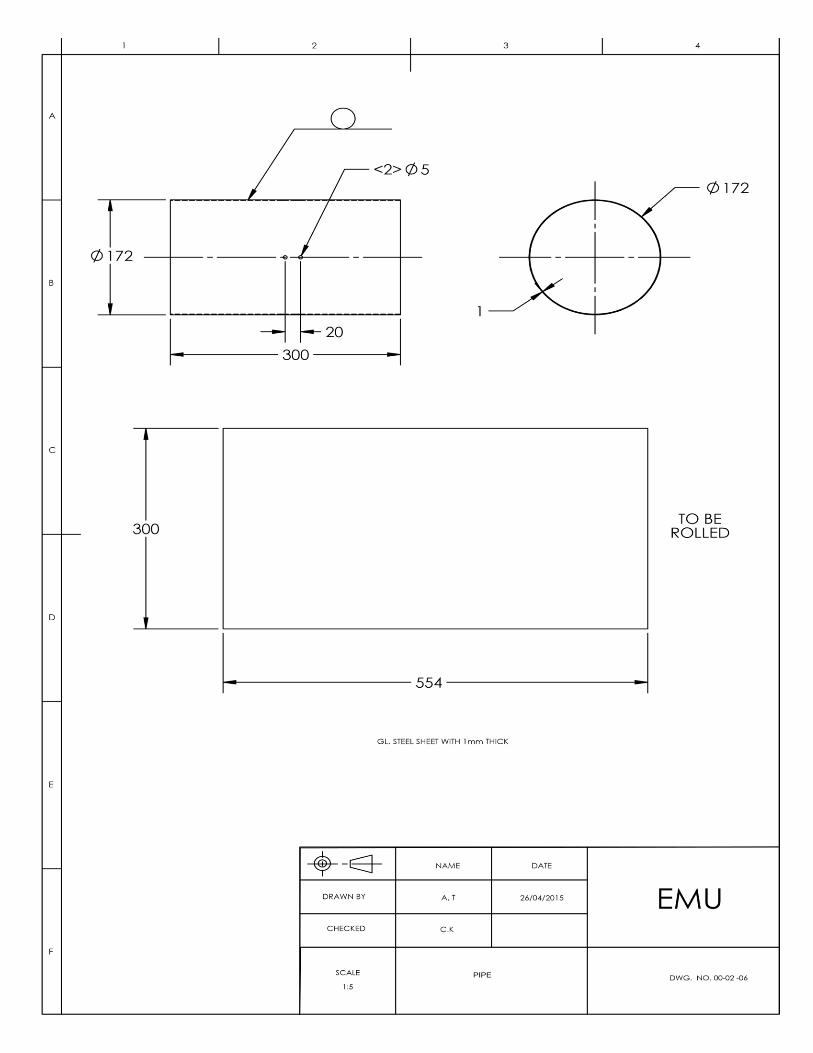


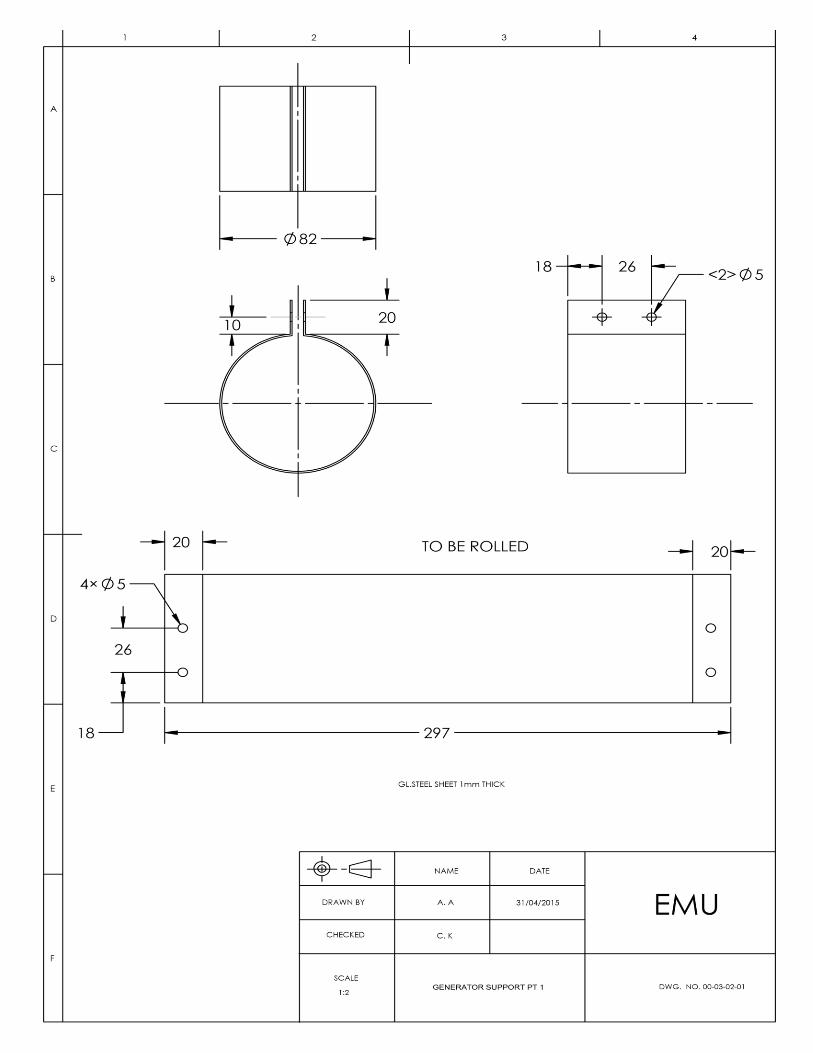
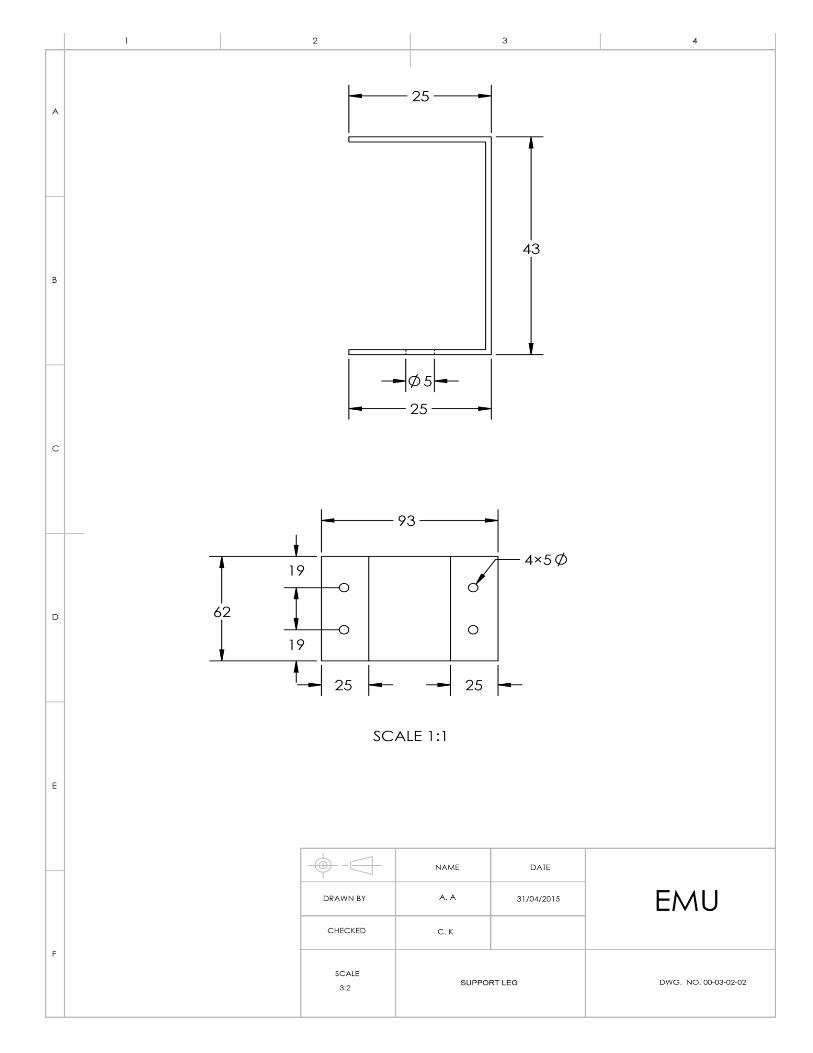


69
70
42°
20 8
C
2 3 1 4
B
A
D
E
F
A. A
C. K EMU
DWG. NO. 00-03-05
NAME DATE
SCALE 1: 2
CHECKED
DRAWN BY
CONE
31/04/2015
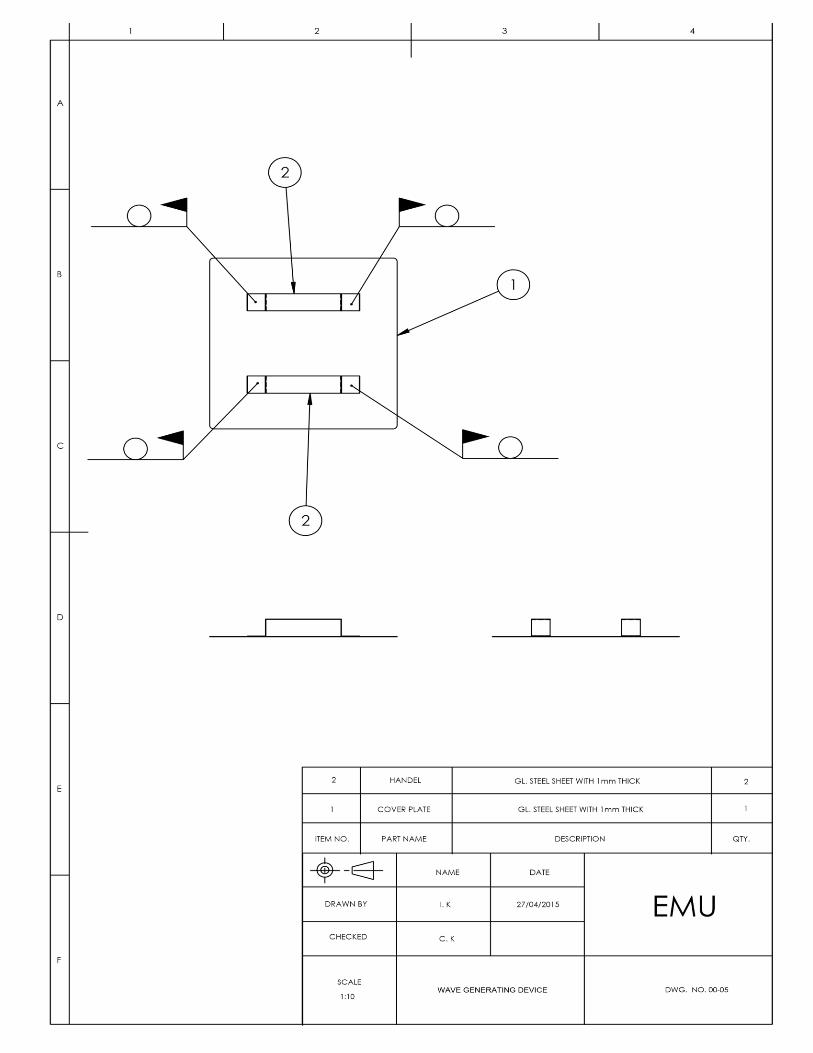

500
500
GL. STEEL SHEET WITH 1mm THICK C
2 3 1 4
B
A
D
E
F
I .K
C. K EMU
DWG. NO. 00-05-01
NAME DATE
SCALE 1:10
CHECKED
DRAWN BY
COVER PLATE
27/04/2015

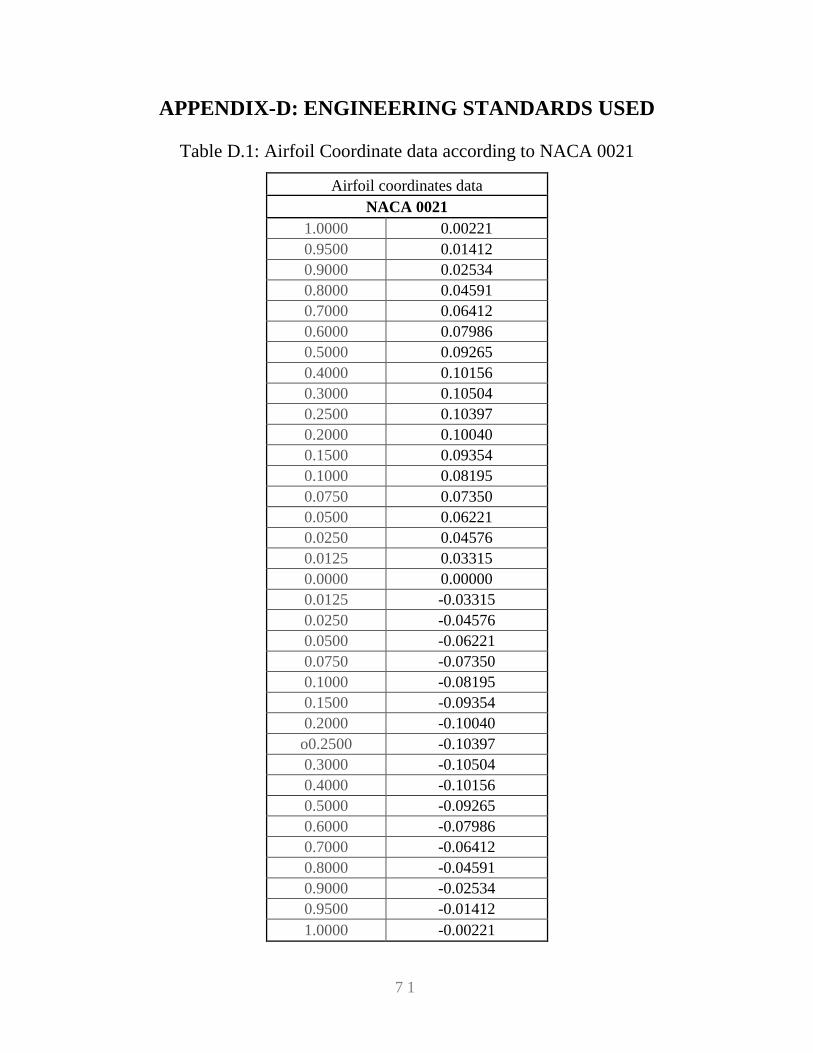
7 1
APPENDIX-D: ENGINEERING STANDARDS USED
Table D.1: Airfoil Coordinate data according to NACA 0021
Airfoil coordinates data
NACA 0021
1.0000 0.00221
0.9500 0.01412
0.9000 0.02534
0.8000 0.04591
0.7000 0.06412
0.6000 0.07986
0.5000 0.09265
0.4000 0.10156
0.3000 0.10504
0.2500 0.10397
0.2000 0.10040
0.1500 0.09354
0.1000 0.08195
0.0750 0.07350
0.0500 0.06221
0.0250 0.04576
0.0125 0.03315
0.0000 0.00000
0.0125 -0.03315
0.0250 -0.04576
0.0500 -0.06221
0.0750 -0.07350
0.1000 -0.08195
0.1500 -0.09354
0.2000 -0.10040
o0.2500 -0.10397
0.3000 -0.10504
0.4000 -0.10156
0.5000 -0.09265
0.6000 -0.07986
0.7000 -0.06412
0.8000 -0.04591
0.9000 -0.02534
0.9500 -0.01412
1.0000 -0.00221
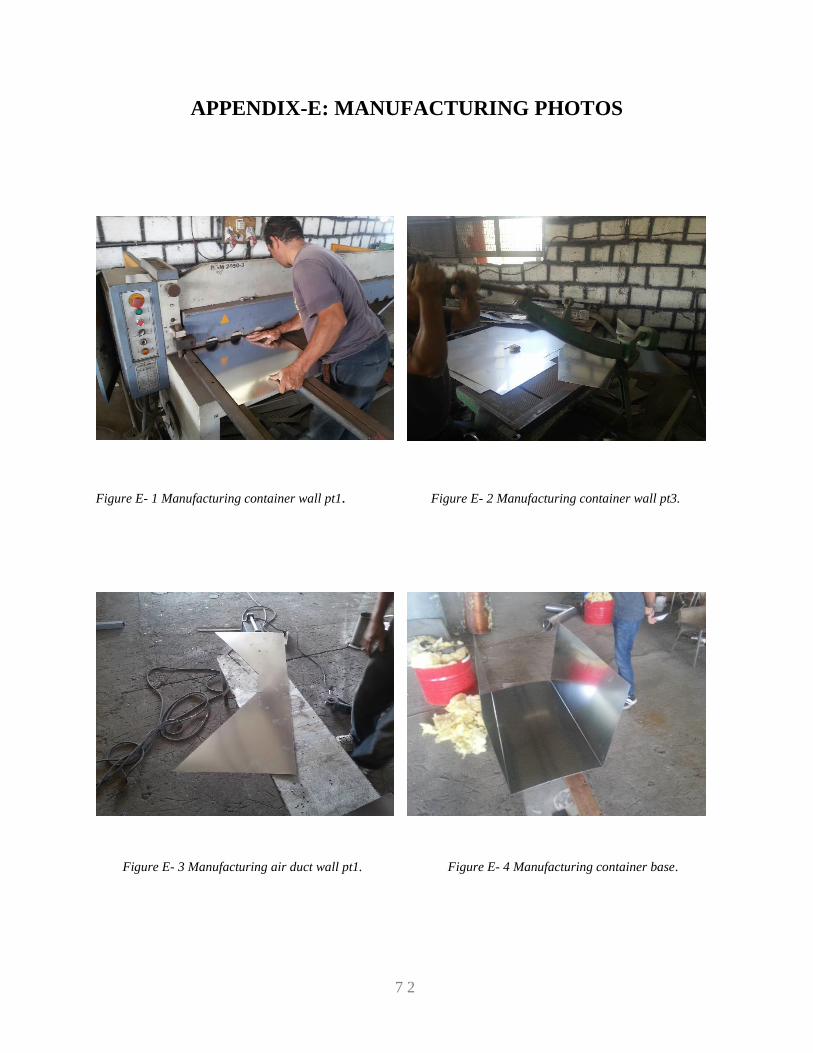
7 2
APPENDIX-E: MANUFACTURING PHOTOS
Figure E- 1 Manufacturing container wall pt1. Figure E- 2 Manufacturing container wall pt3.
Figure E- 3 Manufacturing air duct wall pt1. Figure E- 4 Manufacturing container base.
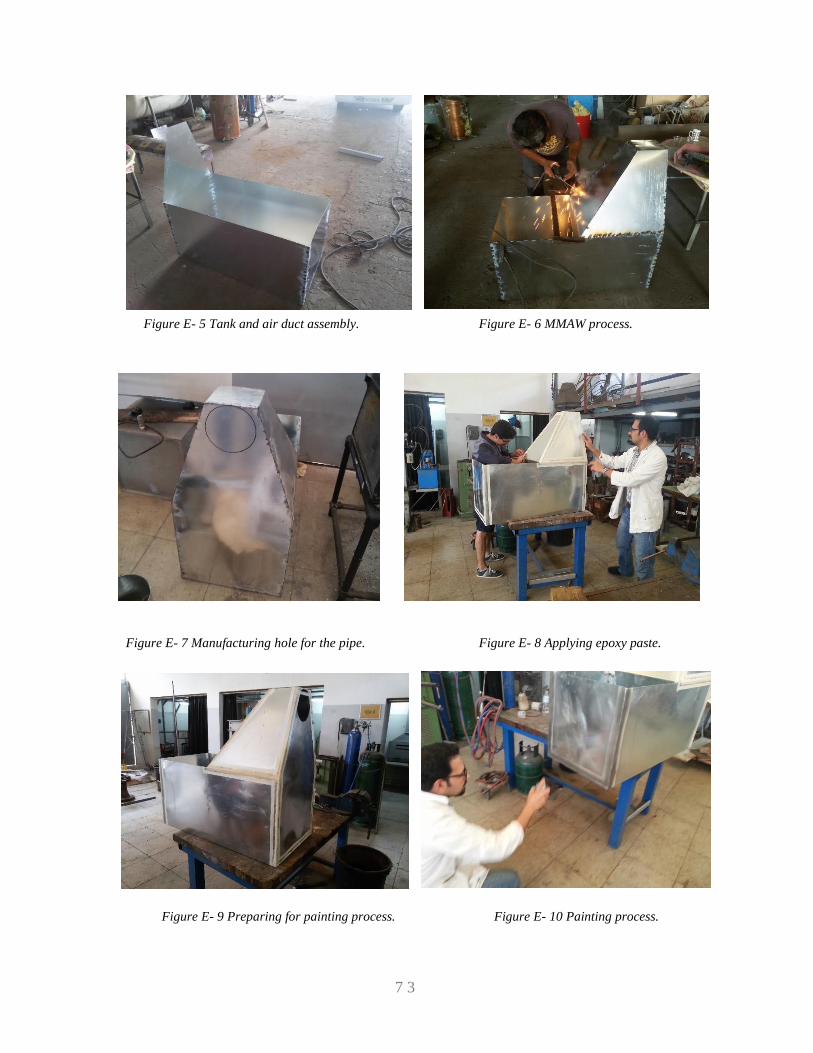
7 3
Figure E- 5 Tank and air duct assembly. Figure E- 6 MMAW process.
Figure E- 7 Manufacturing hole for the pipe. Figure E- 8 Applying epoxy paste.
Figure E- 9 Preparing for painting process. Figure E- 10 Painting process.
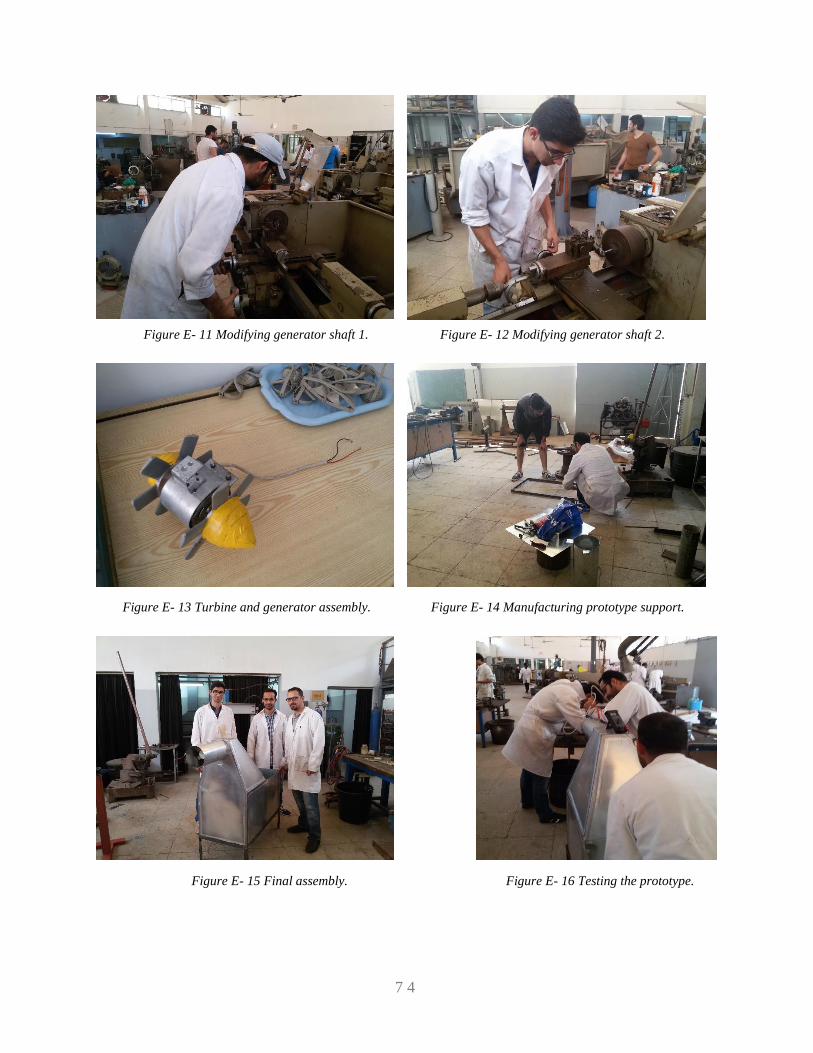
7 4
Figure E- 11 Modifying generator shaft 1. Figure E- 12 Modifying generator shaft 2.
Figure E- 13 Turbine and generator assembly. Figure E- 14 Manufacturing prototype support.
Figure E- 15 Final assembly. Figure E- 16 Testing the prototype.
7 5
Figure E- 17 Checking the results.
Figure E- 18 Group 08 A.I.A mates & Supervisor.

7 6
APPENDIX-F: POSTER, WEBSITE & FINAL CD