Eastern Market Curbside Management - Compendium Market Stakeholder... · Previous Meetings with...
37
Eastern Market Curbside Management: Stakeholders Meeting May 9, 2016 1
Transcript of Eastern Market Curbside Management - Compendium Market Stakeholder... · Previous Meetings with...

Eastern Market Curbside Management: Stakeholders Meeting
May 9, 2016 1

Previous Meetings with Eastern Market
Reviewed stakeholder concerns Reviewed existing data Discussed initial findings
2
2/11/2015 9/9/2015 1/7/2015

Walkshed/Acceptable Walking Distance
Definition: How far people are willing to walk to their ultimate destinations
3
Presenter
Presentation Notes
A distance of 0.25 miles is often used as an acceptable walking distance in U.S. research studies.. ¼ mile 5 min 10 minutes to walk 1600 steps slow pace

Summary of Community Challenges
Residential Parking Market/Visitor Parking Neighborhood Commercial Parking
Turnover in RPP areas
Parking spill-over
Balancing community curbside use needs
Way finding/signage
Underutilized/off-street parking
Pick-up zones for vendors and customers
Enforcement
Meter operations (time limits, rates, performance parking)
4

DDOT Response - Data Collection
5
Data Collection sources: DMV, MPD, DPW, DDOT, MWCOG Data Field data collection Vehicle camera data collection Time-lapse cameras
Information derived: Parking occupancy , vehicle registrations (DC, VA,MD) RPP and annual visitor pass requests Parking turnover data Parking meter transactions Parking and moving violations, and crash data Travel patterns Land use analysis

Time-lapse Photography
Presenter
Presentation Notes
Introducing the concept of time lapse cameras
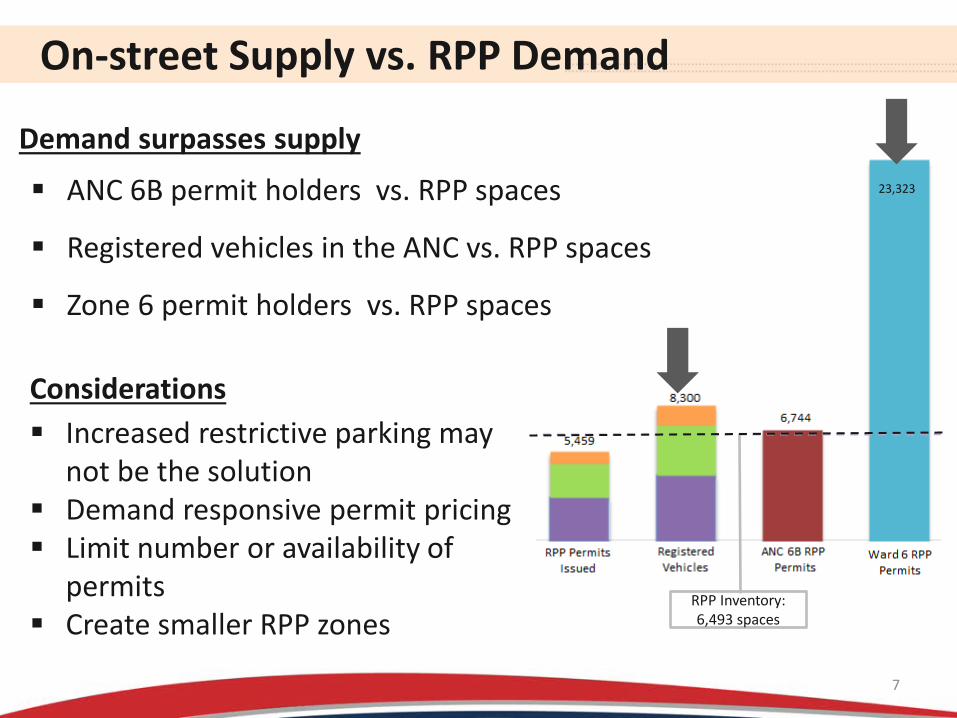
RPP Inventory: 6,493 spaces
On-street Supply vs. RPP Demand
7
Demand surpasses supply
ANC 6B permit holders vs. RPP spaces
Registered vehicles in the ANC vs. RPP spaces
Zone 6 permit holders vs. RPP spaces
Considerations Increased restrictive parking may
not be the solution Demand responsive permit pricing Limit number or availability of
permits Create smaller RPP zones
23,323

Demand Trends (2013-2016)
8
Residential Demand: Vehicle registration numbers stayed steady Only 70% of registered vehicles have RPP permits All DC registered vehicles can park in RPP blocks after RPP
restriction ends
Visitor demand stayed steady
Considerations Increased restrictive parking may
not be the solution in blocks with overnight high occupancy.
RPP Inventory: 6,493 spaces
# of RPP Permits (15 min walkshed)
# of Registered Veh. (15 min walkshed)
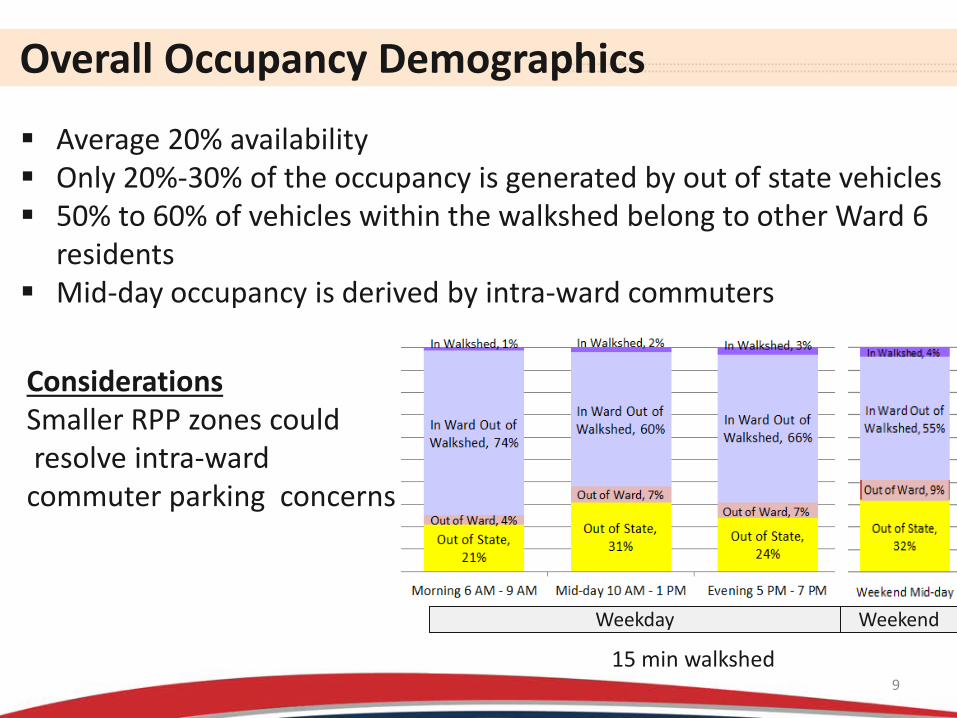
Overall Occupancy Demographics
9
Average 20% availability Only 20%-30% of the occupancy is generated by out of state vehicles 50% to 60% of vehicles within the walkshed belong to other Ward 6
residents Mid-day occupancy is derived by intra-ward commuters
Considerations Smaller RPP zones could resolve intra-ward commuter parking concerns
15 min walkshed
Weekday Weekend

Occupancy vs. Distance to the Market
10 Weekend Mid-Day Field Occupancy
Overall occupancy peaks during : mid-day weekday ( intra-ward
commuters) Weekends ( market visitor)
Higher parking occupancy in residential areas on weekends Weekday Mid-Day Field Occupancy
Considerations Increased enforcement Meters in residential areas may resolve: Intra-ward commuter parking
concerns Low occupancy in parking garages Market spillover concerns

Peak Parking Occupancy
Sun Mon Tue Wed Thu Fri Sat
Dece
mbe
r 201
5
Weekday
Block Level Occupancy (example) 400 8th St. SE
Parking occupancy by day by hour
Parking turnover by day by hour
Presenter
Presentation Notes
Example of the data we analyzed Discuss concept of 80%practical capacity Line graph is occupancy rate. Highest rate mid-day ( near full capacity) Overnight and early morning doesn’t warrant RPP special protections We analyzed the block’s land use type We looked at parking turn over in surveyed blocks

Summary of Time-Lapse Photos
12
Acceptable walking distance is not the only factor that impacts parking occupancy
Residential focused areas: High over-night occupancy of between 80% to 100% Higher RPP occupancy during weekend daytime than weekday
daytime due to market visitor parking Low turnover (resident vehicles) High turnover (employees jockey their vehicles)
Mixed use blocks: Higher parking occupancy during mid-day hours
Consideration: Manage parking demand for both residential and mixed use areas and optimize curbside availability for all users.

Overview of Meter Operations
Paid occupancy based on meter transactions: 30% of meter operating hours – People not paying meters – Parking in unmetered areas
Meter transaction split: 2/3 originated from Pay By Cell
Top parking violations – Expired meters (declining trend) – Overstay RPP (declining trend)
13
Considerations The area should not be included in performance parking zone
(time limits, rates, performance parking) Market users may park in residential, not metered areas

14
Pay by Cell Overstay Patterns
Hot spot meter over stay rate in the District
Consistent over stay patterns along Barracks Row and near the Metro
Considerations Adjusting meter time limits Coordinated enforcement

Parking Enforcement Slight increases in enforcement near major neighborhood activity centers Market Library of Congress Capital South Metro
15
RPP Enforcement Meter Enforcement

Next Steps
16
Meeting # 2
2nd wk. in June July/AugCommunity Meeting Sep Meeting #3
Present supply, demand & usage data /Preliminary Analysis
Data analysis summary/ toolbox & recommendation refinement
Neighborhood Pilot Report
Community feedback on toolbox & recommendations
Regroup with stakeholders to develop an implementation plan
X
2016
Meeting # 1 2nd wk. in May
Tentative Dates
Data
Col
lect
ion
Proc
ess
Nove
mbe
r 201
5 - M
arch
201
6
We are HERE
Curbside Management Study - http://comp.ddot.dc.gov/Documents/District%20Department%20of%20Transportation%20Curbside%20Management%20Study.pdf

GROUP DISCUSSION
17

18

On-street Spaces
RPP Permits Issued
Registered Vehicles
Metered Spaces
6,493 5,459
6,744
Number of RPP + Resident
Only Spaces
1,450
8,953 8,300
ANC 6B RPP Permits
Ward 6 RPP Permits
0
5,000
10,000
15,000
20,000
25,000
15 min walkshed 10 min Walkshed 5 min Walkshed
15 Min
10 Min
5 Min
Curbside Use Profiles within 5 Min, 10 min & 15 min Walk of Eastern Market
23,346
Source: March 2016 DMV Data • RPP • Vehicle Registration
Curbside Inventory • Google Earth 2013- August 2014 • Globespotter: Nov. 2013-May 2014
Supply Demand
Presenter
Presentation Notes
This is point in time data from street level imagery).

Walkshed 2013 RPP
2015 RPP
2016 RPP
2013 Vehicle Registration
2015 Vehicle Registration
2016 Vehicle Registration
2015 VPP
2016 VPP
2016 Reciprocity Permits
RPP Inventory
5 min 770 845 691 1,423 1,132 1,204 263 264 49 856 10 min 3,282 3,498 2,803 4,575 4,123 4,314 936 1,012 183 3,407 15 min 6,482 6,784 5,459 8,617 7,965 8,300 1,774 1,898 359 6,493
Demand Trend 5 Min, 10 Min & 15 min Walkshed
2013 RPP
2013 RPP
2013 RPP
2015 RPP
2015 RPP
2015 RPP
2016 RPP
2016 RPP
2016 RPP
Veh. Registration 2013
Veh. Registration 2013
Veh. Registration 2013
Veh. Registration 2015
Veh. Registration 2015
Veh. Registration 2015
Veh. Registration 2016
Veh. Registration 2016
Veh. Registration 2016
0
1000
2000
3000
4000
5000
6000
7000
8000
9000
10000
5 min 10 min 15 min
2013 RPP
2015 RPP
2016 RPP
RPP Inventory
Veh. Registration 2013
Veh. Registration 2015
Veh. Registration 2016

Overall Occupancy Demographics
21
Out of State, 19% Out of State, 29% Out of State, 22%
Out of State, 37% Out of State, 33% Out of Ward, 3%
Out of Ward, 7% Out of Ward, 6%
Out of Ward, 10% Out of Ward, 8%
In Ward Out of Walkshed, 77%
In Ward Out of Walkshed, 61%
In Ward Out of Walkshed, 70%
In Ward Out of Walkshed, 53% In Ward Out of
Walkshed, 55%
In Walkshed, 1% In Walkshed, 3% In Walkshed, 2% In Walkshed, 0% In Walkshed, 4%
0%10%20%30%40%50%60%70%80%90%
100%
Morning6 AM - 9 AM
Mid-day10 AM - 1 PM
Evening5 PM - 7 PM
Overnight10 PM -1 AM
Weekend Mid-day10 AM - 1 PM
Out of State, 17% Out of State, 27% Out of State, 22% Out of State, 37% Out of State, 34% Out of Ward, 4%
Out of Ward, 10% Out of Ward, 10%
Out of Ward, 10% Out of Ward, 10%
In Ward Out of Walkshed, 78%
In Ward Out of Walkshed, 59%
In Ward Out of Walkshed, 64%
In Ward Out of Walkshed, 53%
In Ward Out of Walkshed, 50%
In Walkshed, 1% In Walkshed, 4% In Walkshed, 4% In Walkshed, 0% In Walkshed, 6%
0%10%20%30%40%50%60%70%80%90%
100%
Morning6 AM - 9 AM
Mid-day10 AM - 1 PM
Evening5 PM - 7 PM
Overnight10 PM -1 AM
Weekend Mid-day10 AM - 1 PM
Out of State, 21% Out of State, 31% Out of State, 24% Out of State, 35% Out of State, 32%
Out of Ward, 4% Out of Ward, 7%
Out of Ward, 7%
Out of Ward, 9% Out of Ward, 9%
In Ward Out of Walkshed, 74%
In Ward Out of Walkshed, 60%
In Ward Out of Walkshed, 66%
In Ward Out of Walkshed, 56%
In Ward Out of Walkshed, 55%
In Walkshed, 1% In Walkshed, 2% In Walkshed, 3% In Walkshed, 0% In Walkshed, 4%
0%
20%
40%
60%
80%
100%
Morning6 AM - 9 AM
Mid-day10 AM - 1 PM
Evening5 PM - 7 PM
Overnight10 PM -1 AM
Weekend Mid-day10 AM - 1 PM
5 Min Walkshed
10 Min Walkshed
15 Min Walkshed
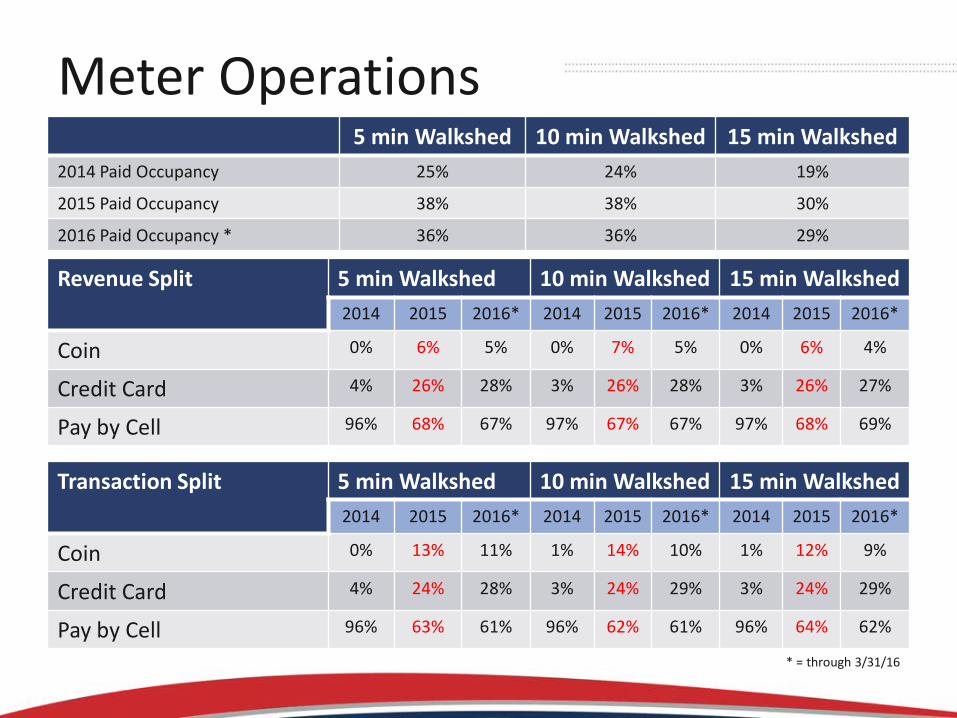
Meter Operations 5 min Walkshed 10 min Walkshed 15 min Walkshed
2014 Paid Occupancy 25% 24% 19%
2015 Paid Occupancy 38% 38% 30%
2016 Paid Occupancy * 36% 36% 29%
Revenue Split 5 min Walkshed 10 min Walkshed 15 min Walkshed 2014 2015 2016* 2014 2015 2016* 2014 2015 2016*
Coin 0% 6% 5% 0% 7% 5% 0% 6% 4%
Credit Card 4% 26% 28% 3% 26% 28% 3% 26% 27%
Pay by Cell 96% 68% 67% 97% 67% 67% 97% 68% 69%
Transaction Split 5 min Walkshed 10 min Walkshed 15 min Walkshed 2014 2015 2016* 2014 2015 2016* 2014 2015 2016*
Coin 0% 13% 11% 1% 14% 10% 1% 12% 9%
Credit Card 4% 24% 28% 3% 24% 29% 3% 24% 29%
Pay by Cell 96% 63% 61% 96% 62% 61% 96% 64% 62%
* = through 3/31/16

Demographic Measure 5 min walkshed
10 min walkshed
15 min walkshed
District
% Disabled Population 6.1% 5.7% 8.6% 15% % Zero Vehicle Households 21.7% 26.5% 21.8% 34% % Limited English Population 1.6% 1.4% 1.2% 3% % Public Assistance Households 0.9% 1.6% 1.9% 4% % Under 18 Population 15.4% 11.4% 11.4% 17% % Over 65 Population 11.5% 10.8% 11.6% 12% % Minority Population 13.2% 13.5% 18.2% 62% Mean Income $152,997 $124,125 $122,168 $76,414 % Smartphone Penetrated Population 70% 70% 70% 57% Number of Businesses 427 1,036 1,829 63,179 Number of Employees ~2,700 ~5,600 ~12,000 ~770,000 2014 Areawide Business Sales Volume $503 million $958 million $1.7 Billion ~$110 Billion
Demographics Of Residents and Business, by Block Groups using 2013 ACS 5 year estimates and 2015 Business data
23

Top Parking Violations (2014 vs. 2015) 5 Min Walkshed
2014 Count 2014 % 2014 Rank 2015 Count 2015 % 2015 Rank Expired Meter 6,933 41% 1 5,102 30% 1 Unauthorized Vehicle in Load Zone 1,942 12% 2 4,116 24% 2 Overstay RPP 1,591 10% 3 957 6% 4 Resident Only Violation 1,241 7% 4 1,287 8% 3 No Parking Anytime 523 3% 5 489 3% 6
10 Min Walkshed 2014 Count 2014 % 2014 Rank 2015 Count 2015 % 2015 Rank
Expired Meter 13,040 29% 1 8,897 22% 1 Overstay RPP 6,224 14% 2 4,682 11% 4 Resident Only Violation 6,086 14% 3 5,758 14% 3 Unauthorized Vehicle in Load Zone 4,256 10% 4 7,752 19% 2 No Parking Anytime 1,533 3% 5 1,387 3% 5
15 Min Walkshed 2014 Count 2014 % 2014 Rank 2015 Count 2015 % 2015 Rank
Expired Meter 17,344 27% 1 13,200 22% 1 Overstay RPP 10,062 16% 2 9,691 16% 2 Resident Only Violation 8,360 13% 3 7,638 13% 4 Unauthorized Vehicle in Load Zone 4,378 7% 4 8,061 13% 3 No Parking Street Cleaning 2,411 4% 5 2,787 5% 5
Presenter
Presentation Notes
Count of Ticket Number 2013 Percent of Total 2014 Percent of Total PARK AT EXPIRED METER 27% 25% NO PARKING STREET CLEANING 7% 8% DISOBEYING OFFICIAL SIGN 6% 6% NO STOPPING OR STANDING IN PM RUSH HOUR ZONE 7% 6% NO STOPPING OR STANDING IN AM RUSH HOUR ZONE 6% 5%

Summary of Time-lapse Data
25
Collected December 2015
Street Walk-shed
Land Use
Turn over
6-9 AM Mid-Day 5-7 PM Overnight AM Mid-Day PM Overnight
Weekday Weekend
800 A St NE 10 Mixed-Use High 80% 80% 80% 80% 75% 75% 80% 80%
100 4th St SE 15 Mixed-Use High 50% 60% 60% 60% 60% 50% 70% 60%
300 S. Carolina Ave SE
15 Res. High 60% 75% 60% 60% 40% 75% 50% 50%
400 8th St SE 5 Mixed-Use Low 50% 90% 80% 60% 40% 90% 60% 40%
700 7th St SE 15 Res Low 70% 60% 80% 95% 95% 80% 80% 95% 900 C St NE 10 Res. Low 75% 60% 70% 75% 75% 60% 75% 75% 100 5th St NE 15 Res. Low 80% 70% 75% 80% 80% 65% 70% 80% 1200 E St SE 10 Res. Med. 90% 60% 70% 85% 80% 80% 80% 85%

PARC Confidential | 26
Sun Mon Tue Wed Thu Fri Sat
11/29/15
12/06/15
12/13/15
12/20/15
12/27/15
Week of
Weekday
Weekend
400 8th St. SE

PARC Confidential | 27
Sun Mon Tue Wed Thu Fri Sat
11/29/15
12/06/15
12/13/15
12/20/15
12/27/15
Week of
Weekday
Weekend
300 South Carolina Ave SE

PARC Confidential | 28
Sun Mon Tue Wed Thu Fri Sat
11/29/15
12/06/15
12/13/15
12/20/15
12/27/15
Week of
Weekday
Weekend
900 C Street NE

PARC Confidential | 29
Sun Mon Tue Wed Thu Fri Sat
11/29/15
12/06/15
12/13/15
12/20/15
12/27/15
Week of
Weekday
Weekend
100 4th St. SE
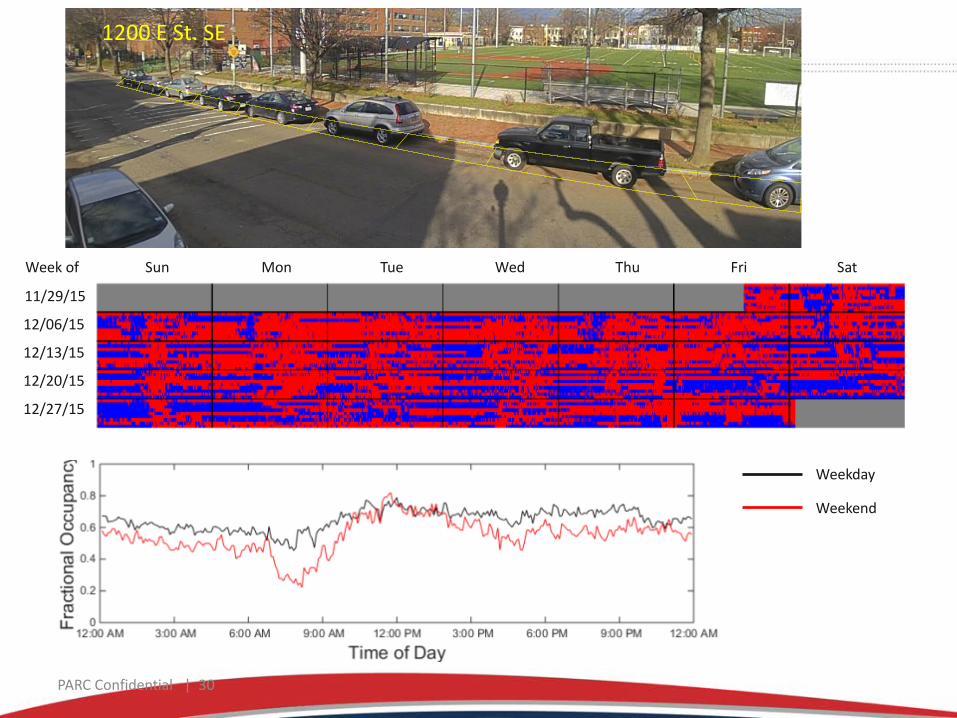
PARC Confidential | 30
Sun Mon Tue Wed Thu Fri Sat
11/29/15
12/06/15
12/13/15
12/20/15
12/27/15
Week of
Weekday
Weekend
1200 E St. SE
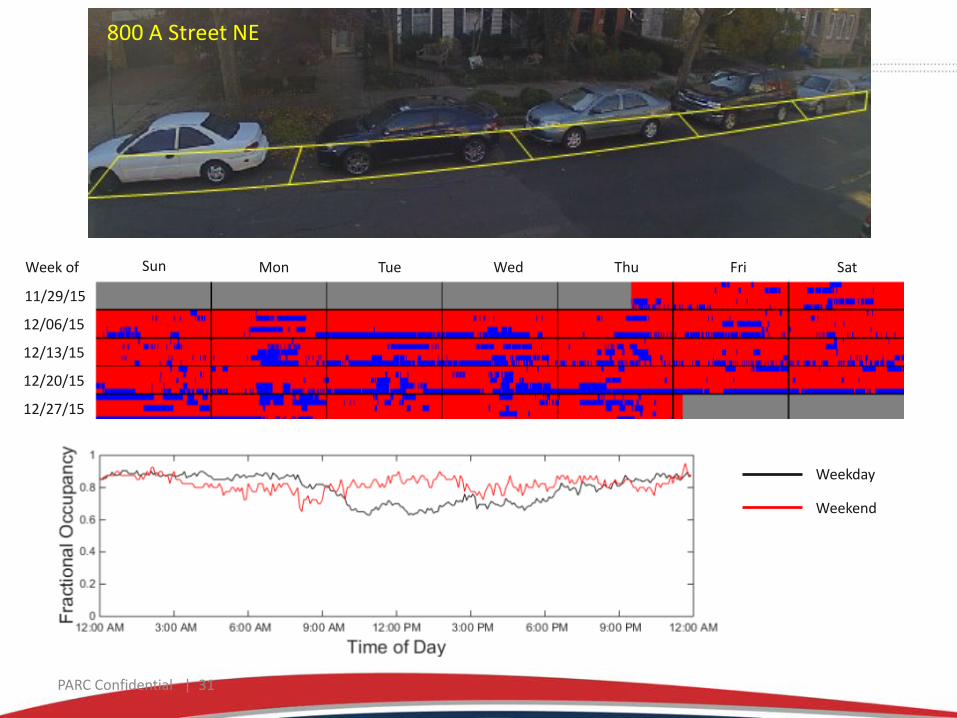
PARC Confidential | 31
Sun Mon Tue Wed Thu Fri Sat
11/29/15
12/06/15
12/13/15
12/20/15
12/27/15
Week of
Weekday
Weekend
800 A Street NE
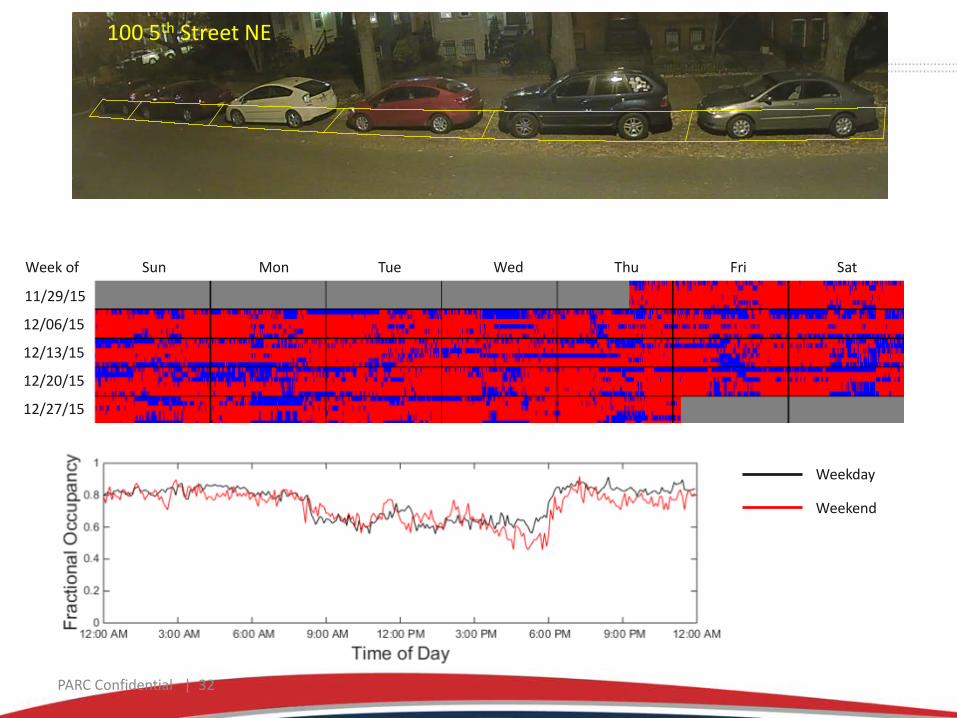
PARC Confidential | 32
Sun Mon Tue Wed Thu Fri Sat
11/29/15
12/06/15
12/13/15
12/20/15
12/27/15
Week of
Weekday
Weekend
100 5th Street NE

PARC Confidential | 33
Sun Mon Tue Wed Thu Fri Sat
11/29/15
12/06/15
12/13/15
12/20/15
12/27/15
Week of
Weekday
Weekend
700 7th Street SE

Field Data Collection • Purpose to determine ‘who’ is and how many are parking on curbside parking spaces • Data collection by vehicle and on handhelds conducted on following dates/times
• Information derived from data includes: – Vehicle Count – RPP Permits
• Parked within ANC? • Parked within Walkshed?
– Visitor Parking Permit usage – Reciprocity Permit – ADA placard use – State of vehicle registration (DC, MD, VA, other)
34
Weekday AM 6 - 9 AM
Weekday Mid-Day 10 AM – 1 PM
Weekday PM 4 - 7 PM
Friday PM* 10 PM – 12 AM
Saturday Mid-Day 10 AM – 1 PM
Sunday Mid-Day 10 AM – 1 PM
9 February 2016 12 February 2016 6 February 2016 21 February 2016
11 February 2016 27 February 2016
24 February 2016
* - Vehicle Data Collection Only

Vehicle Data Collection
35
AM Field Occupancy Mid-day Field Occupancy PM Field Occupancy
Sunday Mid-Day Field Occupancy
Saturday Mid-Day Field Occupancy
Friday Late Field Occupancy
= 70-80% Occupancy = 80-90% Occupancy
= +90% Occupancy No color = Below 70% Occupancy
Loading Zone Activity
• Since January 2015, loading zones are used by either: – Annual Permit – Day Permit – Pay by Cell
• From Pay by Cell data, there were 6,346 transactions in load zones in CY 2015. – Of those transactions, 455 were transacted by a commercial vehicle. – 7.2% of PBC transaction in load zones were by trucks. – Other 92.8% of transactions were by unauthorized vehicles.
36

Loading Activity (Citations) • Most common violation for trucks
37
15 Min Walkshed 2014 Count 2014 % 2014 Rank 2015 Count 2015 % 2015 Rank
No Parking / Standing / Stopping 336 21% 1 235 23% 1 Double Parking 285 18% 2 80 8% 4 Overstay RPP 231 14% 3 130 12% 2 Disobey Official Signs 124 8% 4 97 9% 3 Bus Zone 66 4% 5 73 7% 5