Maize Consortium Improving the adaptability and yield stability of maize hybrids.
Upload
obaid-ur-rehmanCategory
view
221download
0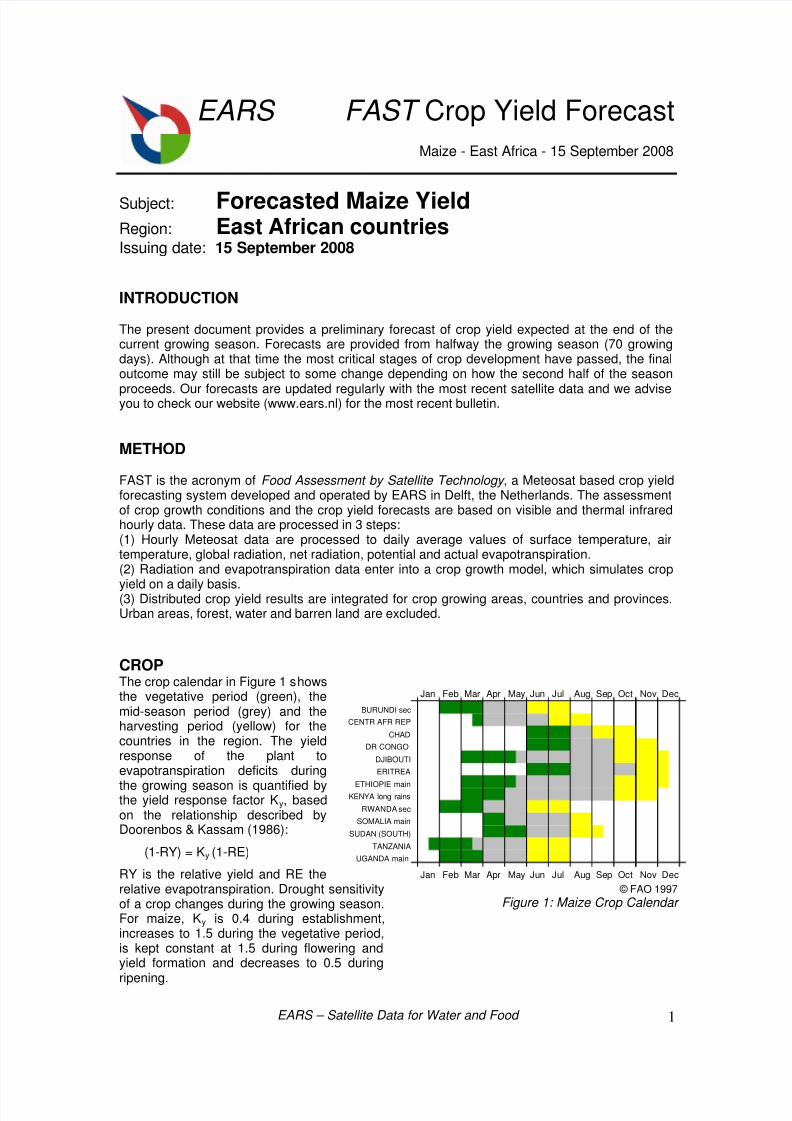
8/3/2019 EastAfr Maize
http://slidepdf.com/reader/full/eastafr-maize 1/17
EARS FAST Crop Yield Forecast
Maize - East Africa - 15 September 2008
EARS – Satellite Data for Water and Food 1
Subject: Forecasted Maize YieldRegion: East African countries
Issuing date: 15 September 2008
INTRODUCTION
The present document provides a preliminary forecast of crop yield expected at the end of thecurrent growing season. Forecasts are provided from halfway the growing season (70 growingdays). Although at that time the most critical stages of crop development have passed, the finaloutcome may still be subject to some change depending on how the second half of the season
proceeds. Our forecasts are updated regularly with the most recent satellite data and we adviseyou to check our website (www.ears.nl) for the most recent bulletin.
METHOD
FAST is the acronym of Food Assessment by Satellite Technology , a Meteosat based crop yieldforecasting system developed and operated by EARS in Delft, the Netherlands. The assessmentof crop growth conditions and the crop yield forecasts are based on visible and thermal infraredhourly data. These data are processed in 3 steps:(1) Hourly Meteosat data are processed to daily average values of surface temperature, airtemperature, global radiation, net radiation, potential and actual evapotranspiration.(2) Radiation and evapotranspiration data enter into a crop growth model, which simulates crop
yield on a daily basis.(3) Distributed crop yield results are integrated for crop growing areas, countries and provinces.Urban areas, forest, water and barren land are excluded.
CROPThe crop calendar in Figure 1 showsthe vegetative period (green), themid-season period (grey) and theharvesting period (yellow) for thecountries in the region. The yieldresponse of the plant toevapotranspiration deficits during
the growing season is quantified bythe yield response factor Ky, basedon the relationship described byDoorenbos & Kassam (1986):
(1-RY) = Ky (1-RE)
RY is the relative yield and RE therelative evapotranspiration. Drought sensitivityof a crop changes during the growing season.For maize, Ky is 0.4 during establishment,increases to 1.5 during the vegetative period,is kept constant at 1.5 during flowering andyield formation and decreases to 0.5 during
ripening.
© FAO 1997
Figure 1: Maize Crop Calendar
Jan Feb Mar Apr May Jun Jul Aug Sep Oct Nov Dec
BURUNDI sec
CENTR AFR REP
CHAD
DR CONGO
DJIBOUTI
ERITREA
ETHIOPIE mainKENYA long rains
RWANDA sec
SOMALIA main
SUDAN (SOUTH)
TANZANIA
UGANDA main
Jan Feb Mar Apr May Jun Jul Aug Sep Oct Nov Dec
8/3/2019 EastAfr Maize
http://slidepdf.com/reader/full/eastafr-maize 2/17
EARS FAST Crop Yield Forecast
Maize - East Africa - 15 September 2008
EARS – Satellite Data for Water and Food 2
SUMMARY
Kenya and Eritrea face reduced yields of respectively -7% and -4% relative to the 5 yr average.In Sudan water availability has increased past half month and better growing conditions are seenin Darfur and Kordofan. In the regions south of Lake Victoria, yield decreases (-15%) areexpected in the east of Burundi and the north of Tanzania. Slightly above average yields arepredicted for Rwanda and south Uganda. Low yields in the north of Tanzania are compensatedby high yields in the centre of the country, and therefore at national level maize outputs areexpected to be closely above average (+2%). In Rwanda crop water availability has improved thepast half month and a moderate increase of 4% is foreseen. In the maize growing area's ofSomalia crop water availability during the growing season has decreased the last half month anddeviation from the previous 5 years is around -1%, while the difference with 2007 remainspositive (+4%). Yields expectations are at average in Ethiopia (+0.1%) but lower than the
previous year (-7%) and there are considerable differences between the west and the east of thecountry.
DETAILS
In Kenya drastically reduced maize outputs (-15%) and a decrease of yield in large parts of theagricultural areas in the country is anticipated due to drought. Especially in the Rift Valleyprovince low yields are seen in Laikipia, Kajiado and Narok In Uganda, water availability is goodand relatively normal in most parts of the country. In Tanzania, water availability and cropprospects are better than normal in the central part of the country while in the northern part yielddecreases are expected. In Tanga, Rukwa, north Mbeya, south Tabora and south Singida aboveaverage yields (+5%) are seen. In the north, large parts of provinces like Shinyanga, Arusha,Mara, Mwanza, Kigoma suffer from drought and below average productions are foreseen.
In western regions of Ethiopia, the water availability for the crops was very good and averagehigh yields of 5% to 11% are expected in regions like Benishangul Gumuz, Gambela, westernpart of Oromia and Amhara and the northern part of SNNP. By contrast, other regions in the eastof Ethiopia like Afar, Somali and east Oromia suffer from water shortages and show considerablelocal differences, with regional yield decreases of -18% in Afar and -3% in Somali.
In Central Sudan water availability has improved and yields are now expected to be higher thanthe 5 years average in West Darfur, North Darfur and Kordofan. In North Bahr el Ghazar andWarab, harvests could be damaged by the floodings, so reported difference yields could be lowerthan is reported here (+5% and +0.3%).
In Somalia, the growing areas in general show relatively normal growing conditions with positive
deviations from the 5-years average of about 2% in Shabelle and slightly below normal conditionsin Hiran (-2%) and Bay (-0.2%). In general, the yield prospects in Somalia are better than theprevious year except in Woqooyi. In non-cropland areas of northern parts of Somalia andprovinces like Nugaal and Saraag water availability for the vegetation has improved a lot the pastdekads and is now above the 5 yrs average.
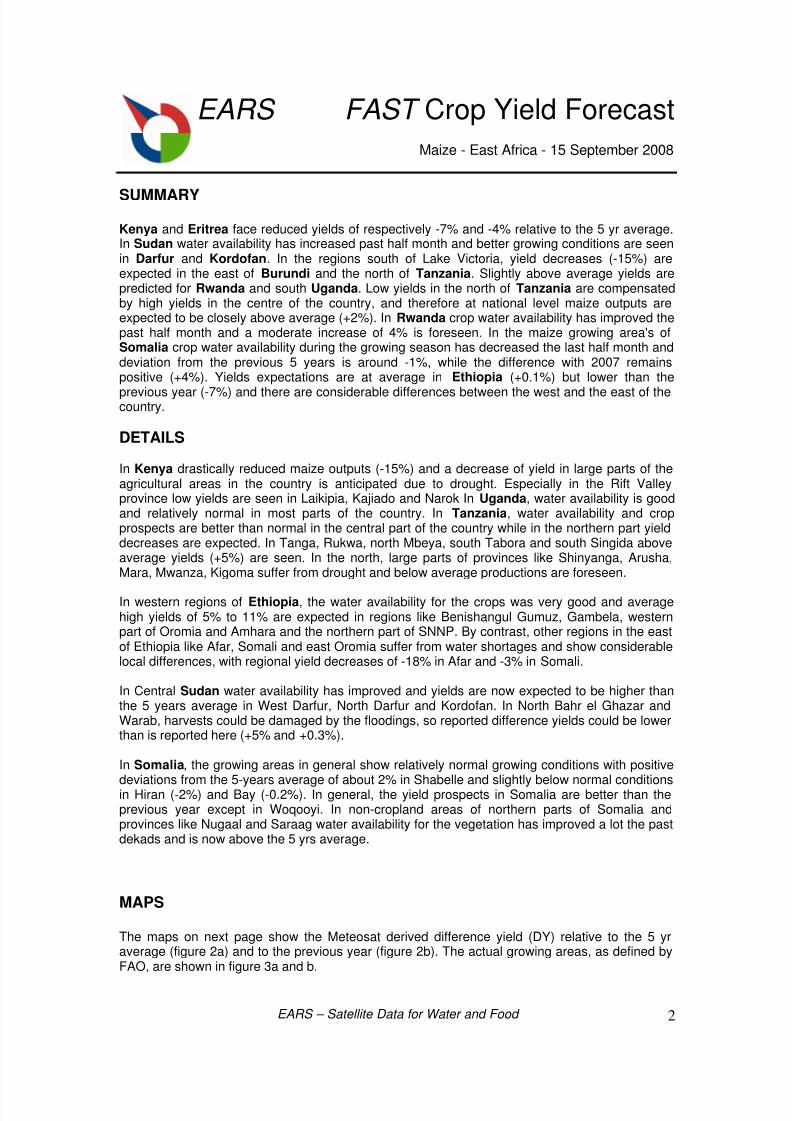
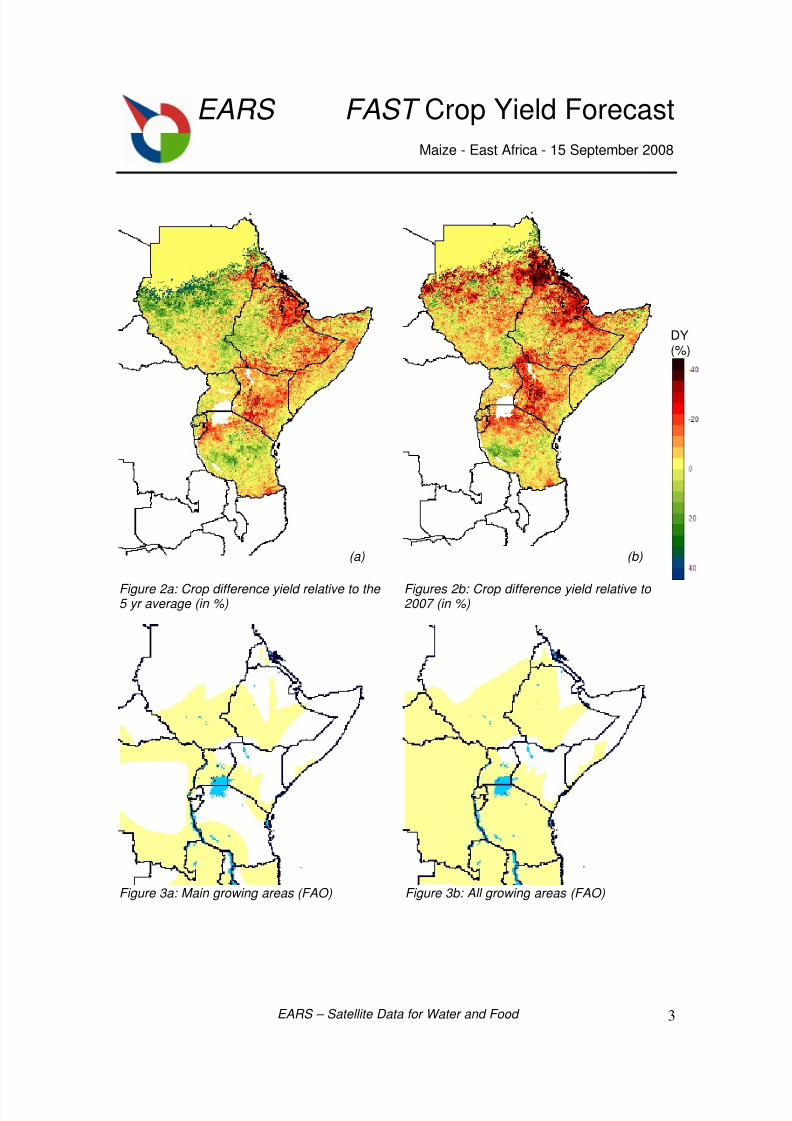
MAPS
The maps on next page show the Meteosat derived difference yield (DY) relative to the 5 yraverage (figure 2a) and to the previous year (figure 2b). The actual growing areas, as defined byFAO, are shown in figure 3a and b.
8/3/2019 EastAfr Maize
http://slidepdf.com/reader/full/eastafr-maize 3/17
EARS FAST Crop Yield Forecast
Maize - East Africa - 15 September 2008
EARS – Satellite Data for Water and Food 3
DY(%)
Figure 2a: Crop difference yield relative to the 5 yr average (in %)
Figures 2b: Crop difference yield relative to 2007 (in %)
Figure 3a: Main growing areas (FAO) Figure 3b: All growing areas (FAO)
(b)(a)
8/3/2019 EastAfr Maize
http://slidepdf.com/reader/full/eastafr-maize 4/17
EARS FAST Crop Yield Forecast
Maize - East Africa - 15 September 2008
EARS – Satellite Data for Water and Food 4
TABLES
The following tabulated data are provided on next pages:
• Table 1 : Difference Yield forecasts at country level
• Table 2 : Difference Yield forecasts at provincial level
The difference yields for each province/country have been determined by spatial integration ofpixel values within the growing areas of the crop. Data are provided for two growing areas:
• All growing areas (figure 3b)
• Main growing areas (figure 3a)
The Difference Yield (DY) presents the forecasted 2008 yield in terms of % deviation from areference yield. In the tables difference yields relative to two references are presented:
• DY08/07 : Forecasted difference yield relative to the yield in 2007
• DY08/avg : Forecasted difference yield relative to the average yield of the years 2003-2007
REFERENCE
Doorenbos, J., Kassam, A. H. (1986). Yield response to water. FAO irrigation and drainage paper33. Food and Agricultural Organization of the United Nations, Rome.
ADMINISTRATIVE BOUNDARIES
National, regional or provincial averages are calculated based on the administrative boundarylayers from the Global Administrative Unit Layers (GAUL) system.
CONTACT
For further information please contact:
EARS Earth Environment Monitoring BVKanaalweg 1, 2628 EB DELFT, the NetherlandsTelephone: +31-15-2562404, Fax: +31-15-2623857Email: [email protected]
Website: www.ears.nl
8/3/2019 EastAfr Maize
http://slidepdf.com/reader/full/eastafr-maize 5/17
EARS FAST Crop Yield Forecast
Maize - East Africa - 15 September 2008
EARS – Satellite Data for Water and Food 5
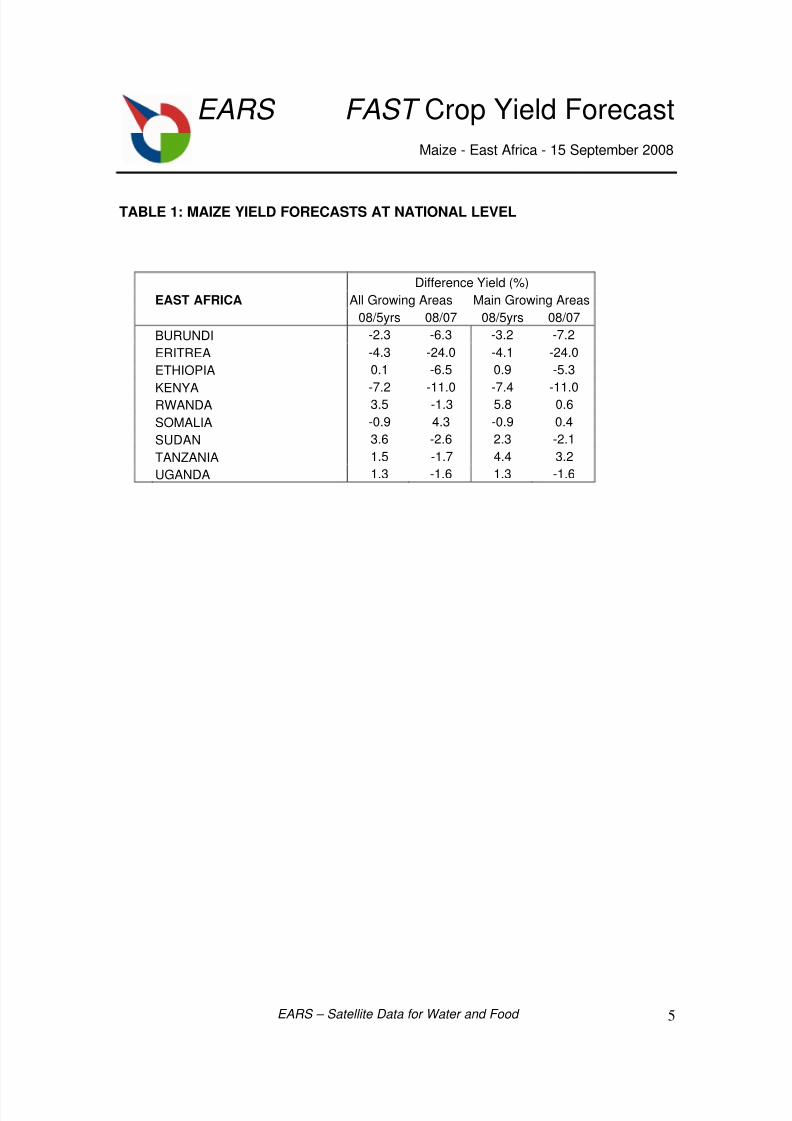
TABLE 1: MAIZE YIELD FORECASTS AT NATIONAL LEVEL
Difference Yield (%)
EAST AFRICA All Growing Areas Main Growing Areas
08/5yrs 08/07 08/5yrs 08/07
BURUNDI -2.3 -6.3 -3.2 -7.2
ERITREA -4.3 -24.0 -4.1 -24.0
ETHIOPIA 0.1 -6.5 0.9 -5.3
KENYA -7.2 -11.0 -7.4 -11.0RWANDA 3.5 -1.3 5.8 0.6
SOMALIA -0.9 4.3 -0.9 0.4
SUDAN 3.6 -2.6 2.3 -2.1
TANZANIA 1.5 -1.7 4.4 3.2
UGANDA 1.3 -1.6 1.3 -1.6
8/3/2019 EastAfr Maize
http://slidepdf.com/reader/full/eastafr-maize 6/17
EARS FAST Crop Yield Forecast
Maize - East Africa - 15 September 2008
EARS – Satellite Data for Water and Food 6
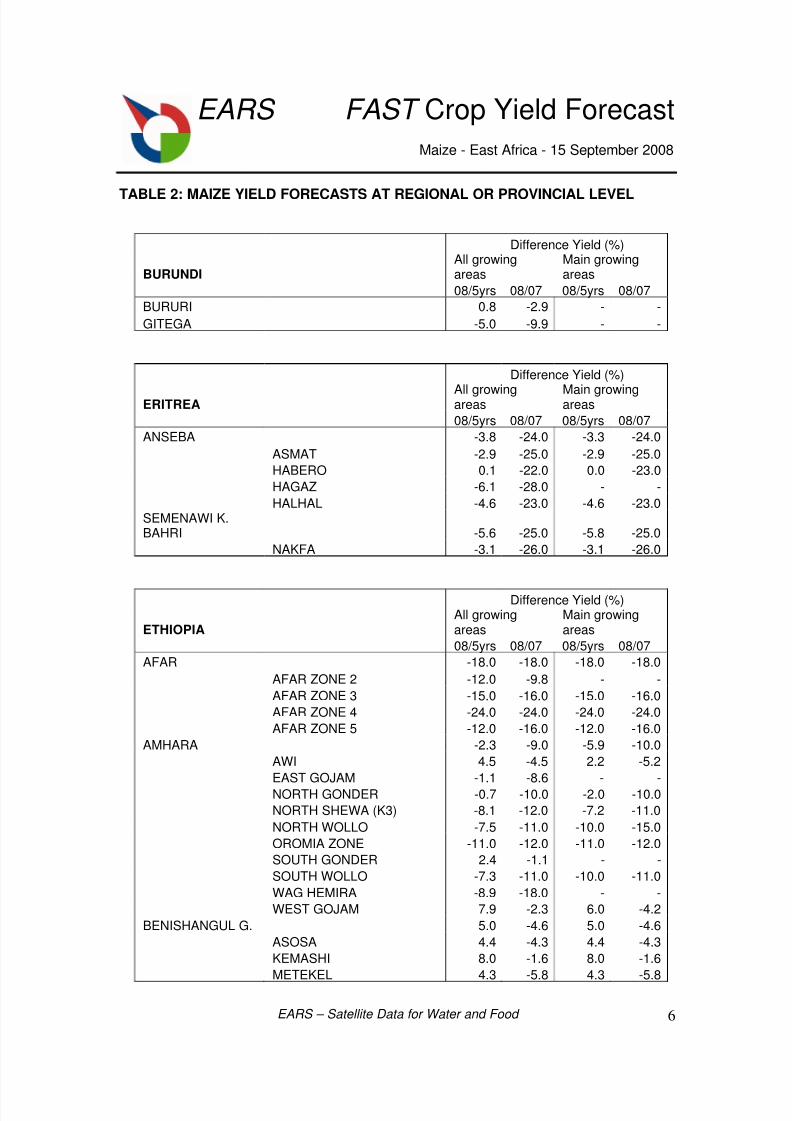
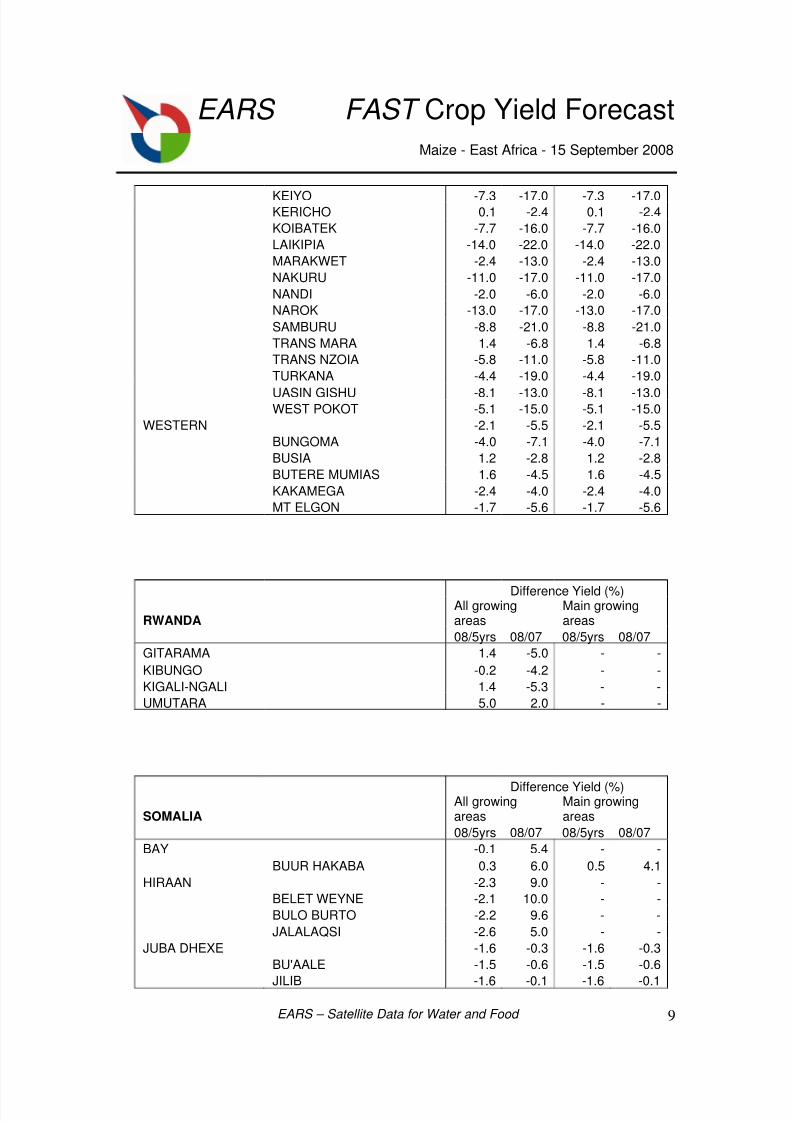
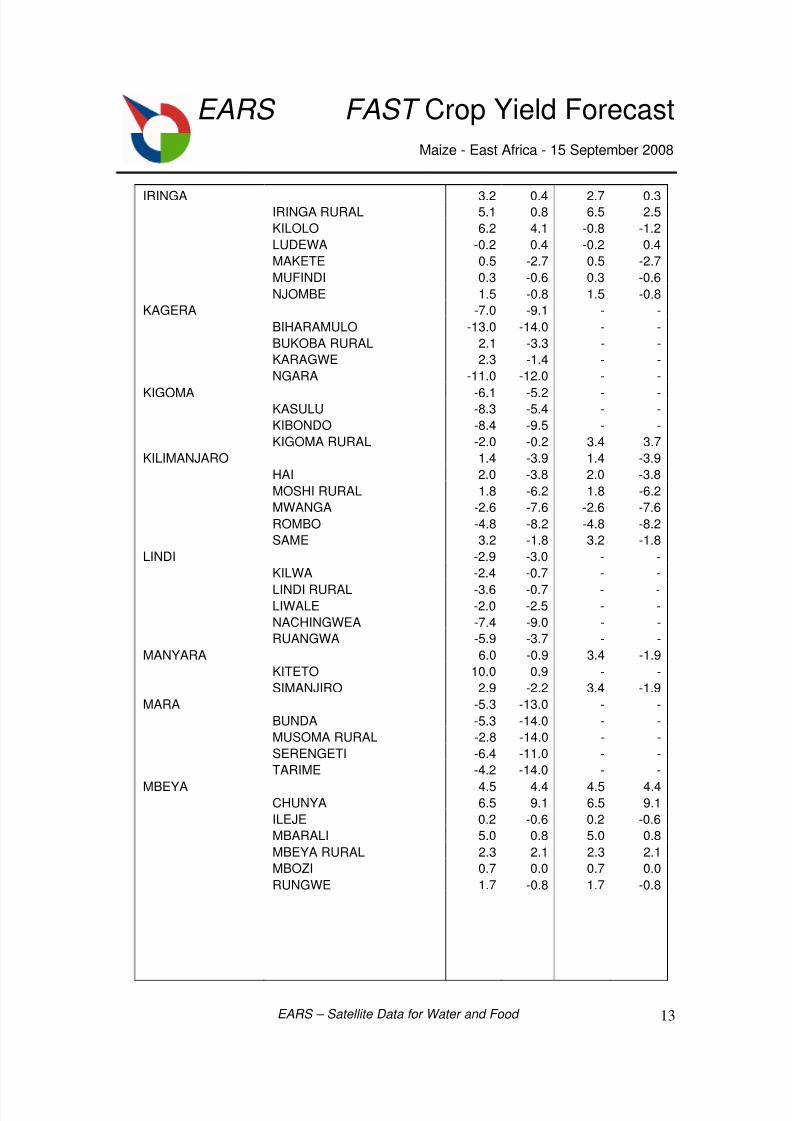
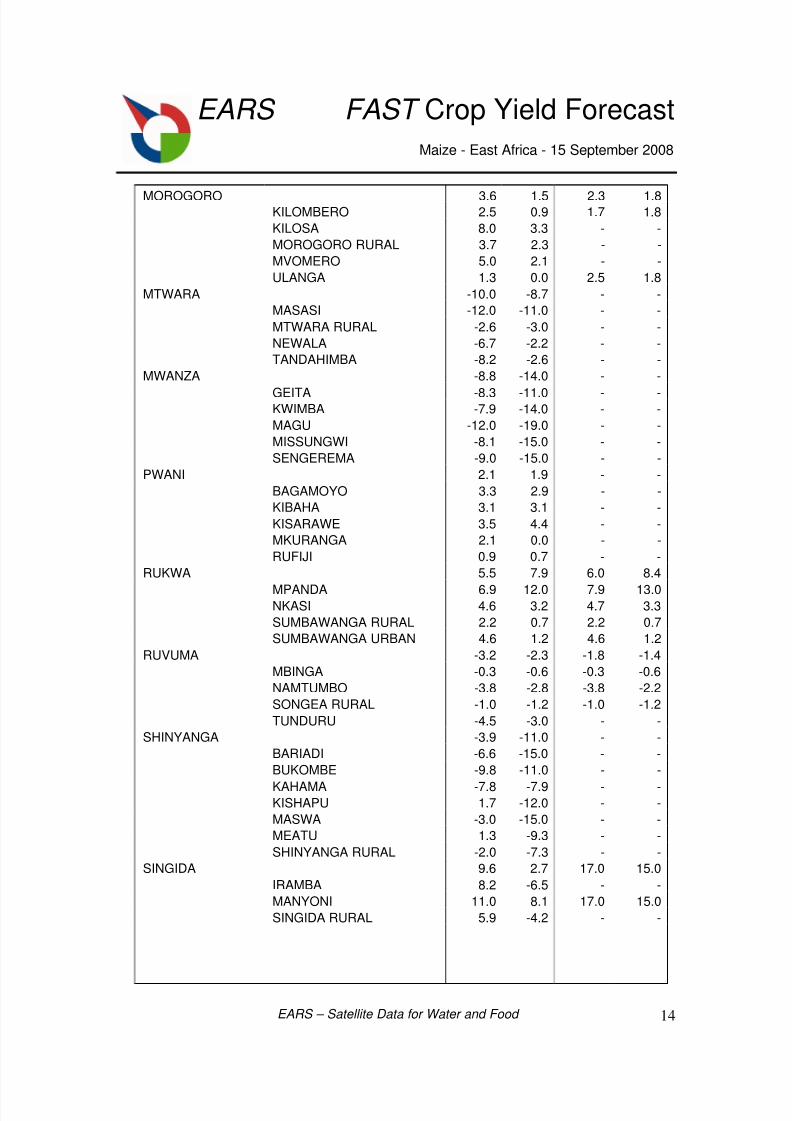
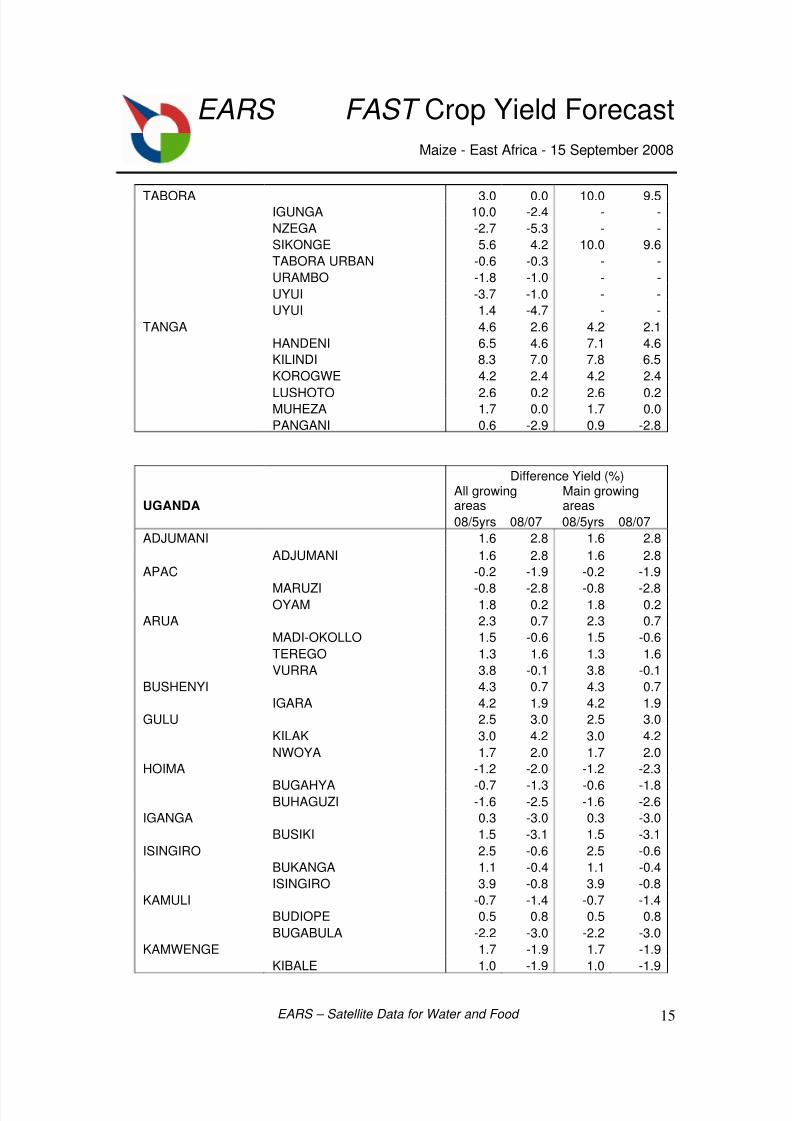
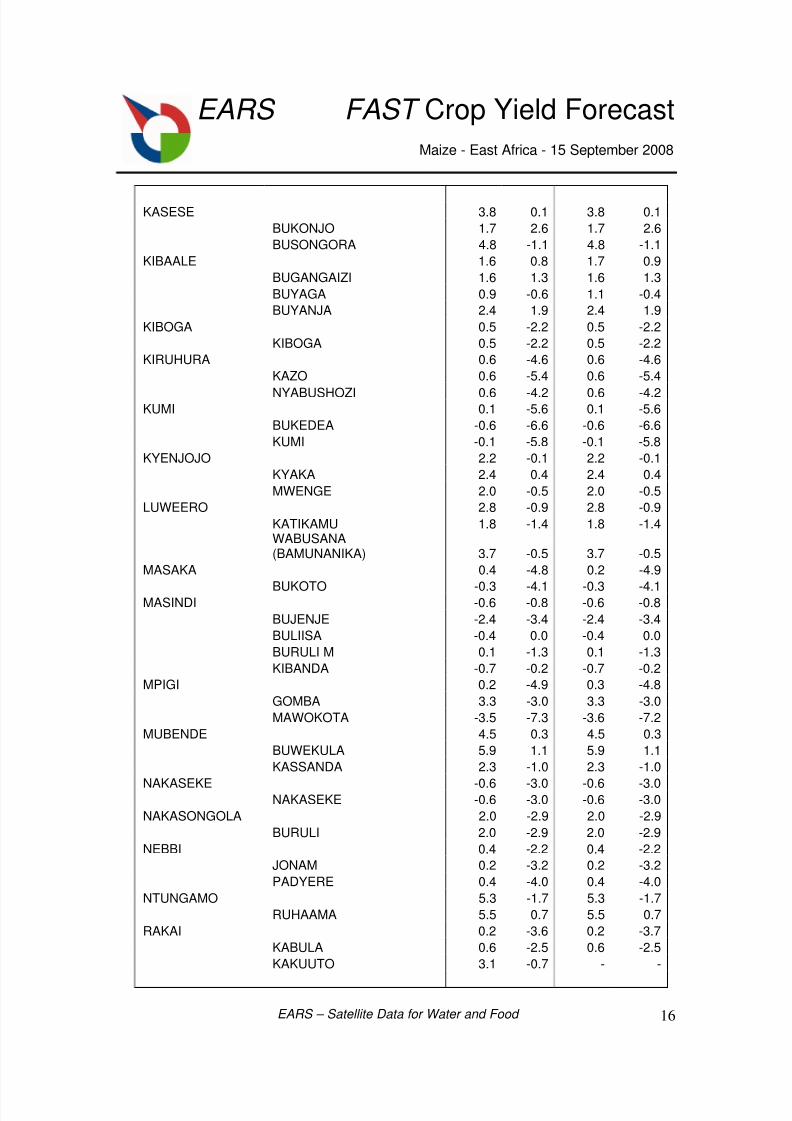
TABLE 2: MAIZE YIELD FORECASTS AT REGIONAL OR PROVINCIAL LEVEL
Difference Yield (%)
BURUNDIAll growingareas
Main growingareas
08/5yrs 08/07 08/5yrs 08/07
BURURI 0.8 -2.9 - -
GITEGA -5.0 -9.9 - -
Difference Yield (%)
ERITREAAll growingareas
Main growingareas
08/5yrs 08/07 08/5yrs 08/07
ANSEBA -3.8 -24.0 -3.3 -24.0
ASMAT -2.9 -25.0 -2.9 -25.0
HABERO 0.1 -22.0 0.0 -23.0
HAGAZ -6.1 -28.0 - -
HALHAL -4.6 -23.0 -4.6 -23.0SEMENAWI K.BAHRI -5.6 -25.0 -5.8 -25.0
NAKFA -3.1 -26.0 -3.1 -26.0
Difference Yield (%)
ETHIOPIAAll growingareas
Main growingareas
08/5yrs 08/07 08/5yrs 08/07
AFAR -18.0 -18.0 -18.0 -18.0
AFAR ZONE 2 -12.0 -9.8 - -
AFAR ZONE 3 -15.0 -16.0 -15.0 -16.0
AFAR ZONE 4 -24.0 -24.0 -24.0 -24.0
AFAR ZONE 5 -12.0 -16.0 -12.0 -16.0
AMHARA -2.3 -9.0 -5.9 -10.0
AWI 4.5 -4.5 2.2 -5.2
EAST GOJAM -1.1 -8.6 - -
NORTH GONDER -0.7 -10.0 -2.0 -10.0
NORTH SHEWA (K3) -8.1 -12.0 -7.2 -11.0
NORTH WOLLO -7.5 -11.0 -10.0 -15.0
OROMIA ZONE -11.0 -12.0 -11.0 -12.0
SOUTH GONDER 2.4 -1.1 - -
SOUTH WOLLO -7.3 -11.0 -10.0 -11.0
WAG HEMIRA -8.9 -18.0 - -
WEST GOJAM 7.9 -2.3 6.0 -4.2
BENISHANGUL G. 5.0 -4.6 5.0 -4.6
ASOSA 4.4 -4.3 4.4 -4.3
KEMASHI 8.0 -1.6 8.0 -1.6
METEKEL 4.3 -5.8 4.3 -5.8
8/3/2019 EastAfr Maize
http://slidepdf.com/reader/full/eastafr-maize 7/17
EARS FAST Crop Yield Forecast
Maize - East Africa - 15 September 2008
EARS – Satellite Data for Water and Food 7
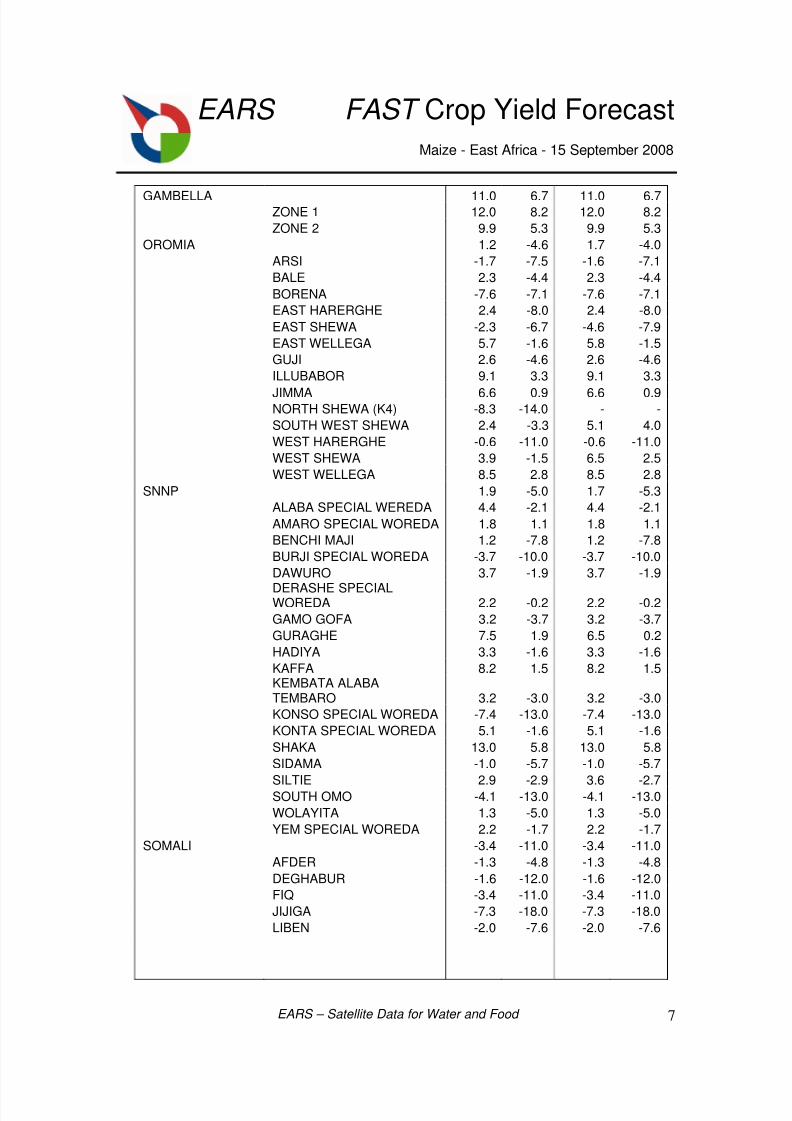
GAMBELLA 11.0 6.7 11.0 6.7ZONE 1 12.0 8.2 12.0 8.2
ZONE 2 9.9 5.3 9.9 5.3
OROMIA 1.2 -4.6 1.7 -4.0
ARSI -1.7 -7.5 -1.6 -7.1
BALE 2.3 -4.4 2.3 -4.4
BORENA -7.6 -7.1 -7.6 -7.1
EAST HARERGHE 2.4 -8.0 2.4 -8.0
EAST SHEWA -2.3 -6.7 -4.6 -7.9
EAST WELLEGA 5.7 -1.6 5.8 -1.5
GUJI 2.6 -4.6 2.6 -4.6
ILLUBABOR 9.1 3.3 9.1 3.3
JIMMA 6.6 0.9 6.6 0.9NORTH SHEWA (K4) -8.3 -14.0 - -
SOUTH WEST SHEWA 2.4 -3.3 5.1 4.0
WEST HARERGHE -0.6 -11.0 -0.6 -11.0
WEST SHEWA 3.9 -1.5 6.5 2.5
WEST WELLEGA 8.5 2.8 8.5 2.8
SNNP 1.9 -5.0 1.7 -5.3
ALABA SPECIAL WEREDA 4.4 -2.1 4.4 -2.1
AMARO SPECIAL WOREDA 1.8 1.1 1.8 1.1
BENCHI MAJI 1.2 -7.8 1.2 -7.8
BURJI SPECIAL WOREDA -3.7 -10.0 -3.7 -10.0
DAWURO 3.7 -1.9 3.7 -1.9
DERASHE SPECIALWOREDA 2.2 -0.2 2.2 -0.2
GAMO GOFA 3.2 -3.7 3.2 -3.7
GURAGHE 7.5 1.9 6.5 0.2
HADIYA 3.3 -1.6 3.3 -1.6
KAFFA 8.2 1.5 8.2 1.5KEMBATA ALABATEMBARO 3.2 -3.0 3.2 -3.0
KONSO SPECIAL WOREDA -7.4 -13.0 -7.4 -13.0
KONTA SPECIAL WOREDA 5.1 -1.6 5.1 -1.6
SHAKA 13.0 5.8 13.0 5.8
SIDAMA -1.0 -5.7 -1.0 -5.7
SILTIE 2.9 -2.9 3.6 -2.7SOUTH OMO -4.1 -13.0 -4.1 -13.0
WOLAYITA 1.3 -5.0 1.3 -5.0
YEM SPECIAL WOREDA 2.2 -1.7 2.2 -1.7
SOMALI -3.4 -11.0 -3.4 -11.0
AFDER -1.3 -4.8 -1.3 -4.8
DEGHABUR -1.6 -12.0 -1.6 -12.0
FIQ -3.4 -11.0 -3.4 -11.0
JIJIGA -7.3 -18.0 -7.3 -18.0
LIBEN -2.0 -7.6 -2.0 -7.6
8/3/2019 EastAfr Maize
http://slidepdf.com/reader/full/eastafr-maize 8/17
EARS FAST Crop Yield Forecast
Maize - East Africa - 15 September 2008
EARS – Satellite Data for Water and Food 8
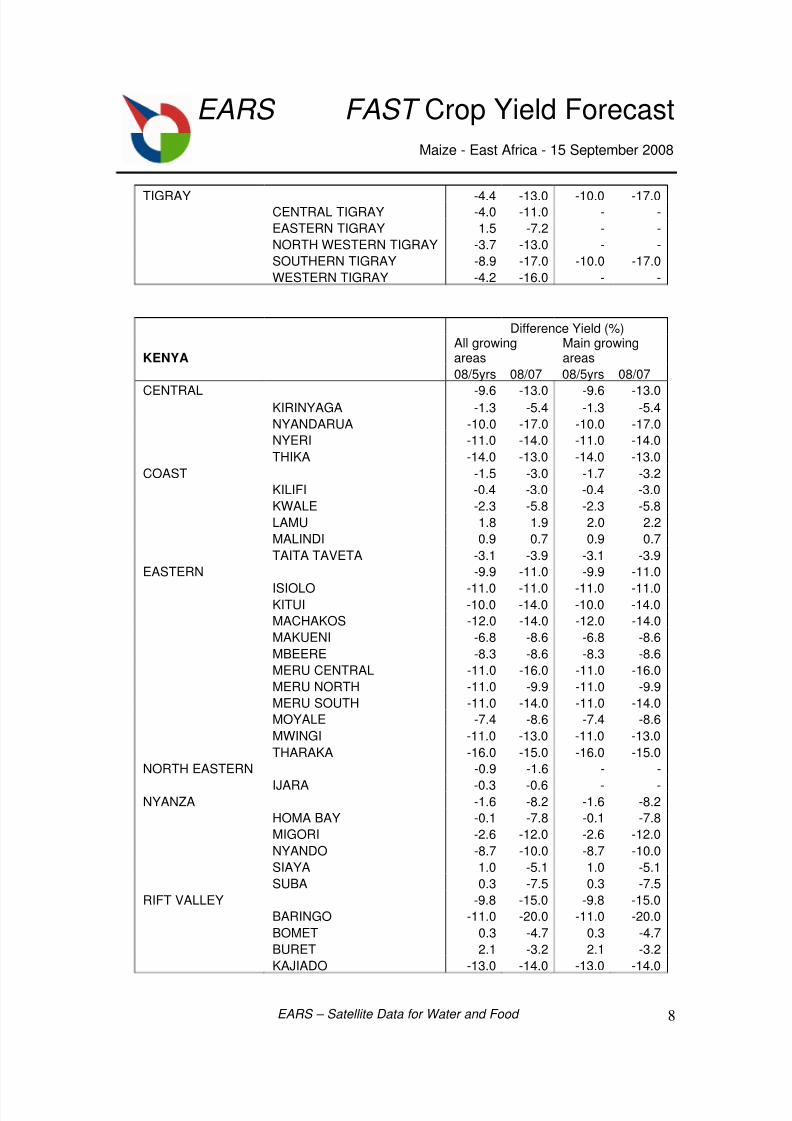
TIGRAY -4.4 -13.0 -10.0 -17.0CENTRAL TIGRAY -4.0 -11.0 - -
EASTERN TIGRAY 1.5 -7.2 - -
NORTH WESTERN TIGRAY -3.7 -13.0 - -
SOUTHERN TIGRAY -8.9 -17.0 -10.0 -17.0
WESTERN TIGRAY -4.2 -16.0 - -
Difference Yield (%)
KENYAAll growingareas
Main growingareas
08/5yrs 08/07 08/5yrs 08/07
CENTRAL -9.6 -13.0 -9.6 -13.0KIRINYAGA -1.3 -5.4 -1.3 -5.4
NYANDARUA -10.0 -17.0 -10.0 -17.0
NYERI -11.0 -14.0 -11.0 -14.0
THIKA -14.0 -13.0 -14.0 -13.0
COAST -1.5 -3.0 -1.7 -3.2
KILIFI -0.4 -3.0 -0.4 -3.0
KWALE -2.3 -5.8 -2.3 -5.8
LAMU 1.8 1.9 2.0 2.2
MALINDI 0.9 0.7 0.9 0.7
TAITA TAVETA -3.1 -3.9 -3.1 -3.9
EASTERN -9.9 -11.0 -9.9 -11.0
ISIOLO -11.0 -11.0 -11.0 -11.0KITUI -10.0 -14.0 -10.0 -14.0
MACHAKOS -12.0 -14.0 -12.0 -14.0
MAKUENI -6.8 -8.6 -6.8 -8.6
MBEERE -8.3 -8.6 -8.3 -8.6
MERU CENTRAL -11.0 -16.0 -11.0 -16.0
MERU NORTH -11.0 -9.9 -11.0 -9.9
MERU SOUTH -11.0 -14.0 -11.0 -14.0
MOYALE -7.4 -8.6 -7.4 -8.6
MWINGI -11.0 -13.0 -11.0 -13.0
THARAKA -16.0 -15.0 -16.0 -15.0
NORTH EASTERN -0.9 -1.6 - -
IJARA -0.3 -0.6 - -NYANZA -1.6 -8.2 -1.6 -8.2
HOMA BAY -0.1 -7.8 -0.1 -7.8
MIGORI -2.6 -12.0 -2.6 -12.0
NYANDO -8.7 -10.0 -8.7 -10.0
SIAYA 1.0 -5.1 1.0 -5.1
SUBA 0.3 -7.5 0.3 -7.5
RIFT VALLEY -9.8 -15.0 -9.8 -15.0
BARINGO -11.0 -20.0 -11.0 -20.0
BOMET 0.3 -4.7 0.3 -4.7
BURET 2.1 -3.2 2.1 -3.2
KAJIADO -13.0 -14.0 -13.0 -14.0
8/3/2019 EastAfr Maize
http://slidepdf.com/reader/full/eastafr-maize 9/17
EARS FAST Crop Yield Forecast
Maize - East Africa - 15 September 2008
EARS – Satellite Data for Water and Food 9
KEIYO -7.3 -17.0 -7.3 -17.0KERICHO 0.1 -2.4 0.1 -2.4
KOIBATEK -7.7 -16.0 -7.7 -16.0
LAIKIPIA -14.0 -22.0 -14.0 -22.0
MARAKWET -2.4 -13.0 -2.4 -13.0
NAKURU -11.0 -17.0 -11.0 -17.0
NANDI -2.0 -6.0 -2.0 -6.0
NAROK -13.0 -17.0 -13.0 -17.0
SAMBURU -8.8 -21.0 -8.8 -21.0
TRANS MARA 1.4 -6.8 1.4 -6.8
TRANS NZOIA -5.8 -11.0 -5.8 -11.0
TURKANA -4.4 -19.0 -4.4 -19.0
UASIN GISHU -8.1 -13.0 -8.1 -13.0WEST POKOT -5.1 -15.0 -5.1 -15.0
WESTERN -2.1 -5.5 -2.1 -5.5
BUNGOMA -4.0 -7.1 -4.0 -7.1
BUSIA 1.2 -2.8 1.2 -2.8
BUTERE MUMIAS 1.6 -4.5 1.6 -4.5
KAKAMEGA -2.4 -4.0 -2.4 -4.0
MT ELGON -1.7 -5.6 -1.7 -5.6
Difference Yield (%)
RWANDAAll growingareas
Main growingareas
08/5yrs 08/07 08/5yrs 08/07
GITARAMA 1.4 -5.0 - -
KIBUNGO -0.2 -4.2 - -
KIGALI-NGALI 1.4 -5.3 - -
UMUTARA 5.0 2.0 - -
Difference Yield (%)
SOMALIAAll growingareas
Main growingareas
08/5yrs 08/07 08/5yrs 08/07
BAY -0.1 5.4 - -
BUUR HAKABA 0.3 6.0 0.5 4.1
HIRAAN -2.3 9.0 - -
BELET WEYNE -2.1 10.0 - -
BULO BURTO -2.2 9.6 - -
JALALAQSI -2.6 5.0 - -
JUBA DHEXE -1.6 -0.3 -1.6 -0.3
BU'AALE -1.5 -0.6 -1.5 -0.6
JILIB -1.6 -0.1 -1.6 -0.1
8/3/2019 EastAfr Maize
http://slidepdf.com/reader/full/eastafr-maize 10/17
EARS FAST Crop Yield Forecast
Maize - East Africa - 15 September 2008
EARS – Satellite Data for Water and Food 10
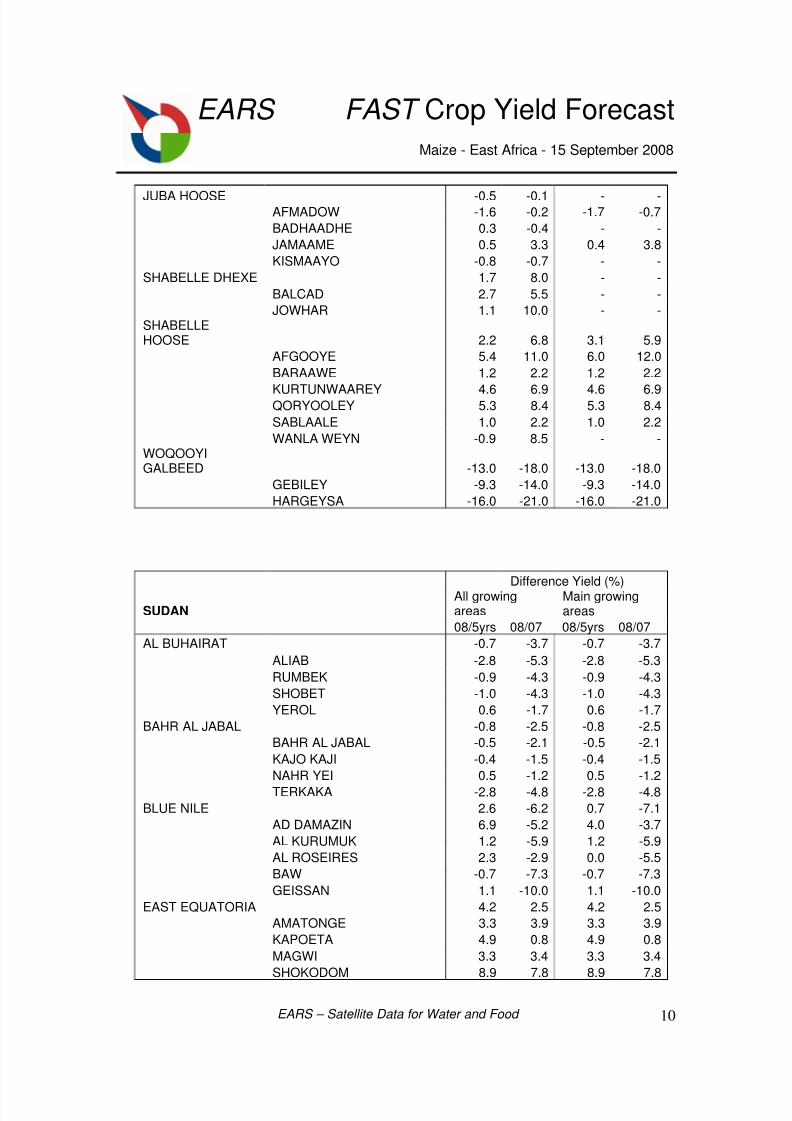
JUBA HOOSE -0.5 -0.1 - -AFMADOW -1.6 -0.2 -1.7 -0.7
BADHAADHE 0.3 -0.4 - -
JAMAAME 0.5 3.3 0.4 3.8
KISMAAYO -0.8 -0.7 - -
SHABELLE DHEXE 1.7 8.0 - -
BALCAD 2.7 5.5 - -
JOWHAR 1.1 10.0 - -SHABELLEHOOSE 2.2 6.8 3.1 5.9
AFGOOYE 5.4 11.0 6.0 12.0
BARAAWE 1.2 2.2 1.2 2.2
KURTUNWAAREY 4.6 6.9 4.6 6.9QORYOOLEY 5.3 8.4 5.3 8.4
SABLAALE 1.0 2.2 1.0 2.2
WANLA WEYN -0.9 8.5 - -WOQOOYIGALBEED -13.0 -18.0 -13.0 -18.0
GEBILEY -9.3 -14.0 -9.3 -14.0
HARGEYSA -16.0 -21.0 -16.0 -21.0
Difference Yield (%)
SUDANAll growingareas
Main growingareas
08/5yrs 08/07 08/5yrs 08/07
AL BUHAIRAT -0.7 -3.7 -0.7 -3.7
ALIAB -2.8 -5.3 -2.8 -5.3
RUMBEK -0.9 -4.3 -0.9 -4.3
SHOBET -1.0 -4.3 -1.0 -4.3
YEROL 0.6 -1.7 0.6 -1.7
BAHR AL JABAL -0.8 -2.5 -0.8 -2.5
BAHR AL JABAL -0.5 -2.1 -0.5 -2.1
KAJO KAJI -0.4 -1.5 -0.4 -1.5
NAHR YEI 0.5 -1.2 0.5 -1.2
TERKAKA -2.8 -4.8 -2.8 -4.8
BLUE NILE 2.6 -6.2 0.7 -7.1
AD DAMAZIN 6.9 -5.2 4.0 -3.7
AL KURUMUK 1.2 -5.9 1.2 -5.9
AL ROSEIRES 2.3 -2.9 0.0 -5.5
BAW -0.7 -7.3 -0.7 -7.3
GEISSAN 1.1 -10.0 1.1 -10.0
EAST EQUATORIA 4.2 2.5 4.2 2.5
AMATONGE 3.3 3.9 3.3 3.9
KAPOETA 4.9 0.8 4.9 0.8
MAGWI 3.3 3.4 3.3 3.4
SHOKODOM 8.9 7.8 8.9 7.8
8/3/2019 EastAfr Maize
http://slidepdf.com/reader/full/eastafr-maize 11/17
EARS FAST Crop Yield Forecast
Maize - East Africa - 15 September 2008
EARS – Satellite Data for Water and Food 11
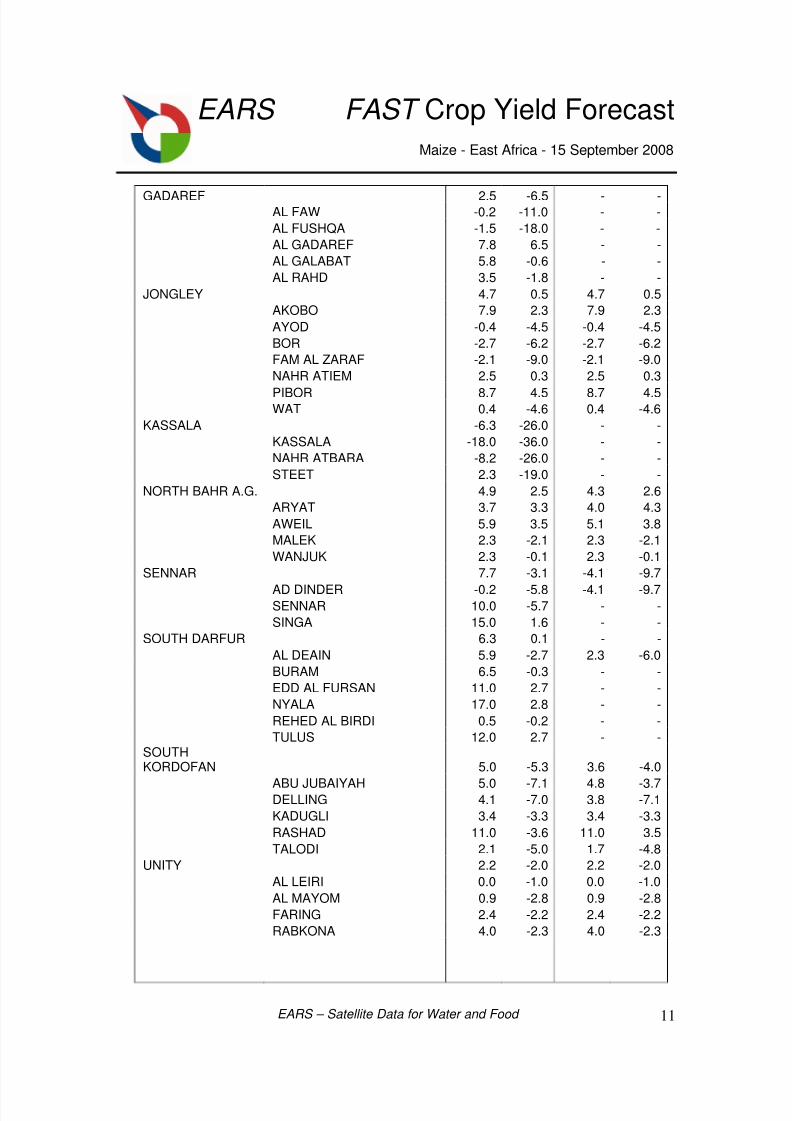
GADAREF 2.5 -6.5 - -AL FAW -0.2 -11.0 - -
AL FUSHQA -1.5 -18.0 - -
AL GADAREF 7.8 6.5 - -
AL GALABAT 5.8 -0.6 - -
AL RAHD 3.5 -1.8 - -
JONGLEY 4.7 0.5 4.7 0.5
AKOBO 7.9 2.3 7.9 2.3
AYOD -0.4 -4.5 -0.4 -4.5
BOR -2.7 -6.2 -2.7 -6.2
FAM AL ZARAF -2.1 -9.0 -2.1 -9.0
NAHR ATIEM 2.5 0.3 2.5 0.3
PIBOR 8.7 4.5 8.7 4.5WAT 0.4 -4.6 0.4 -4.6
KASSALA -6.3 -26.0 - -
KASSALA -18.0 -36.0 - -
NAHR ATBARA -8.2 -26.0 - -
STEET 2.3 -19.0 - -
NORTH BAHR A.G. 4.9 2.5 4.3 2.6
ARYAT 3.7 3.3 4.0 4.3
AWEIL 5.9 3.5 5.1 3.8
MALEK 2.3 -2.1 2.3 -2.1
WANJUK 2.3 -0.1 2.3 -0.1
SENNAR 7.7 -3.1 -4.1 -9.7
AD DINDER -0.2 -5.8 -4.1 -9.7SENNAR 10.0 -5.7 - -
SINGA 15.0 1.6 - -
SOUTH DARFUR 6.3 0.1 - -
AL DEAIN 5.9 -2.7 2.3 -6.0
BURAM 6.5 -0.3 - -
EDD AL FURSAN 11.0 2.7 - -
NYALA 17.0 2.8 - -
REHED AL BIRDI 0.5 -0.2 - -
TULUS 12.0 2.7 - -SOUTHKORDOFAN 5.0 -5.3 3.6 -4.0
ABU JUBAIYAH 5.0 -7.1 4.8 -3.7DELLING 4.1 -7.0 3.8 -7.1
KADUGLI 3.4 -3.3 3.4 -3.3
RASHAD 11.0 -3.6 11.0 3.5
TALODI 2.1 -5.0 1.7 -4.8
UNITY 2.2 -2.0 2.2 -2.0
AL LEIRI 0.0 -1.0 0.0 -1.0
AL MAYOM 0.9 -2.8 0.9 -2.8
FARING 2.4 -2.2 2.4 -2.2
RABKONA 4.0 -2.3 4.0 -2.3
8/3/2019 EastAfr Maize
http://slidepdf.com/reader/full/eastafr-maize 12/17
EARS FAST Crop Yield Forecast
Maize - East Africa - 15 September 2008
EARS – Satellite Data for Water and Food 12
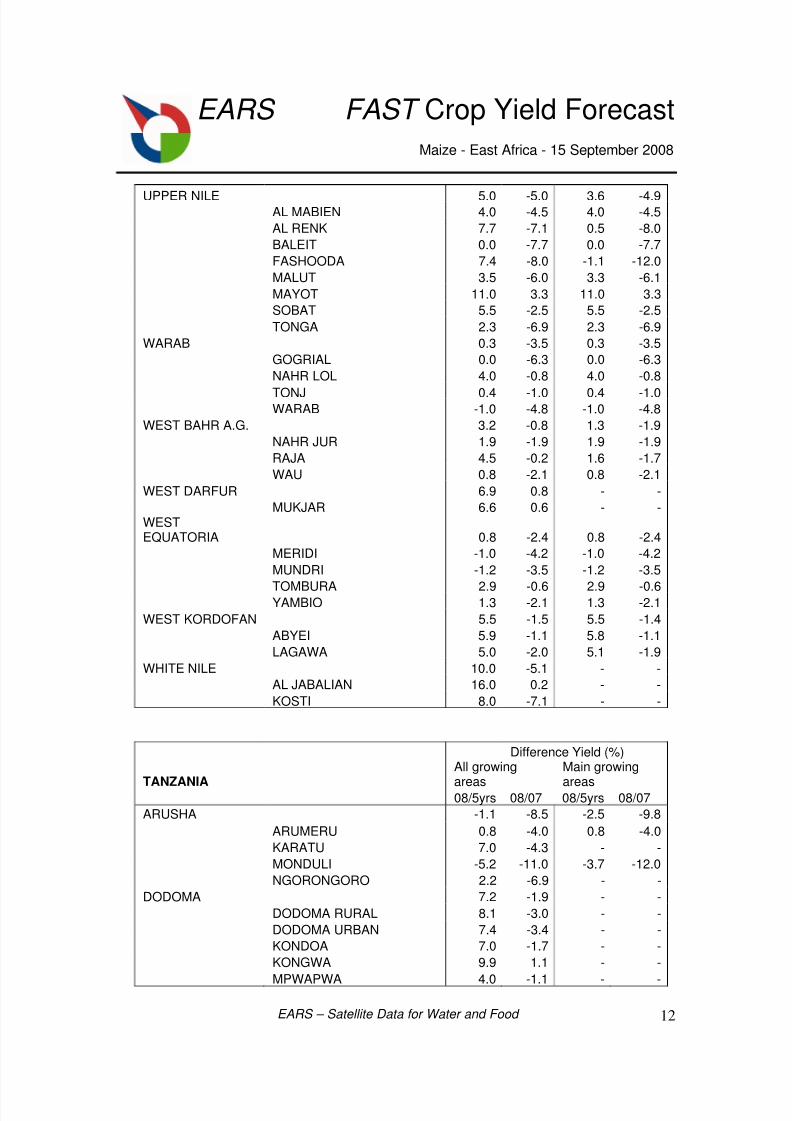
UPPER NILE 5.0 -5.0 3.6 -4.9AL MABIEN 4.0 -4.5 4.0 -4.5
AL RENK 7.7 -7.1 0.5 -8.0
BALEIT 0.0 -7.7 0.0 -7.7
FASHOODA 7.4 -8.0 -1.1 -12.0
MALUT 3.5 -6.0 3.3 -6.1
MAYOT 11.0 3.3 11.0 3.3
SOBAT 5.5 -2.5 5.5 -2.5
TONGA 2.3 -6.9 2.3 -6.9
WARAB 0.3 -3.5 0.3 -3.5
GOGRIAL 0.0 -6.3 0.0 -6.3
NAHR LOL 4.0 -0.8 4.0 -0.8
TONJ 0.4 -1.0 0.4 -1.0WARAB -1.0 -4.8 -1.0 -4.8
WEST BAHR A.G. 3.2 -0.8 1.3 -1.9
NAHR JUR 1.9 -1.9 1.9 -1.9
RAJA 4.5 -0.2 1.6 -1.7
WAU 0.8 -2.1 0.8 -2.1
WEST DARFUR 6.9 0.8 - -
MUKJAR 6.6 0.6 - -WESTEQUATORIA 0.8 -2.4 0.8 -2.4
MERIDI -1.0 -4.2 -1.0 -4.2
MUNDRI -1.2 -3.5 -1.2 -3.5
TOMBURA 2.9 -0.6 2.9 -0.6YAMBIO 1.3 -2.1 1.3 -2.1
WEST KORDOFAN 5.5 -1.5 5.5 -1.4
ABYEI 5.9 -1.1 5.8 -1.1
LAGAWA 5.0 -2.0 5.1 -1.9
WHITE NILE 10.0 -5.1 - -
AL JABALIAN 16.0 0.2 - -
KOSTI 8.0 -7.1 - -
Difference Yield (%)
TANZANIA
All growing
areas
Main growing
areas08/5yrs 08/07 08/5yrs 08/07
ARUSHA -1.1 -8.5 -2.5 -9.8
ARUMERU 0.8 -4.0 0.8 -4.0
KARATU 7.0 -4.3 - -
MONDULI -5.2 -11.0 -3.7 -12.0
NGORONGORO 2.2 -6.9 - -
DODOMA 7.2 -1.9 - -
DODOMA RURAL 8.1 -3.0 - -
DODOMA URBAN 7.4 -3.4 - -
KONDOA 7.0 -1.7 - -
KONGWA 9.9 1.1 - -
MPWAPWA 4.0 -1.1 - -
8/3/2019 EastAfr Maize
http://slidepdf.com/reader/full/eastafr-maize 13/17
EARS FAST Crop Yield Forecast
Maize - East Africa - 15 September 2008
EARS – Satellite Data for Water and Food 13
IRINGA 3.2 0.4 2.7 0.3IRINGA RURAL 5.1 0.8 6.5 2.5
KILOLO 6.2 4.1 -0.8 -1.2
LUDEWA -0.2 0.4 -0.2 0.4
MAKETE 0.5 -2.7 0.5 -2.7
MUFINDI 0.3 -0.6 0.3 -0.6
NJOMBE 1.5 -0.8 1.5 -0.8
KAGERA -7.0 -9.1 - -
BIHARAMULO -13.0 -14.0 - -
BUKOBA RURAL 2.1 -3.3 - -
KARAGWE 2.3 -1.4 - -
NGARA -11.0 -12.0 - -
KIGOMA -6.1 -5.2 - -KASULU -8.3 -5.4 - -
KIBONDO -8.4 -9.5 - -
KIGOMA RURAL -2.0 -0.2 3.4 3.7
KILIMANJARO 1.4 -3.9 1.4 -3.9
HAI 2.0 -3.8 2.0 -3.8
MOSHI RURAL 1.8 -6.2 1.8 -6.2
MWANGA -2.6 -7.6 -2.6 -7.6
ROMBO -4.8 -8.2 -4.8 -8.2
SAME 3.2 -1.8 3.2 -1.8
LINDI -2.9 -3.0 - -
KILWA -2.4 -0.7 - -
LINDI RURAL -3.6 -0.7 - -LIWALE -2.0 -2.5 - -
NACHINGWEA -7.4 -9.0 - -
RUANGWA -5.9 -3.7 - -
MANYARA 6.0 -0.9 3.4 -1.9
KITETO 10.0 0.9 - -
SIMANJIRO 2.9 -2.2 3.4 -1.9
MARA -5.3 -13.0 - -
BUNDA -5.3 -14.0 - -
MUSOMA RURAL -2.8 -14.0 - -
SERENGETI -6.4 -11.0 - -
TARIME -4.2 -14.0 - -
MBEYA 4.5 4.4 4.5 4.4CHUNYA 6.5 9.1 6.5 9.1
ILEJE 0.2 -0.6 0.2 -0.6
MBARALI 5.0 0.8 5.0 0.8
MBEYA RURAL 2.3 2.1 2.3 2.1
MBOZI 0.7 0.0 0.7 0.0
RUNGWE 1.7 -0.8 1.7 -0.8
8/3/2019 EastAfr Maize
http://slidepdf.com/reader/full/eastafr-maize 14/17
EARS FAST Crop Yield Forecast
Maize - East Africa - 15 September 2008
EARS – Satellite Data for Water and Food 14
MOROGORO 3.6 1.5 2.3 1.8KILOMBERO 2.5 0.9 1.7 1.8
KILOSA 8.0 3.3 - -
MOROGORO RURAL 3.7 2.3 - -
MVOMERO 5.0 2.1 - -
ULANGA 1.3 0.0 2.5 1.8
MTWARA -10.0 -8.7 - -
MASASI -12.0 -11.0 - -
MTWARA RURAL -2.6 -3.0 - -
NEWALA -6.7 -2.2 - -
TANDAHIMBA -8.2 -2.6 - -
MWANZA -8.8 -14.0 - -
GEITA -8.3 -11.0 - -KWIMBA -7.9 -14.0 - -
MAGU -12.0 -19.0 - -
MISSUNGWI -8.1 -15.0 - -
SENGEREMA -9.0 -15.0 - -
PWANI 2.1 1.9 - -
BAGAMOYO 3.3 2.9 - -
KIBAHA 3.1 3.1 - -
KISARAWE 3.5 4.4 - -
MKURANGA 2.1 0.0 - -
RUFIJI 0.9 0.7 - -
RUKWA 5.5 7.9 6.0 8.4
MPANDA 6.9 12.0 7.9 13.0NKASI 4.6 3.2 4.7 3.3
SUMBAWANGA RURAL 2.2 0.7 2.2 0.7
SUMBAWANGA URBAN 4.6 1.2 4.6 1.2
RUVUMA -3.2 -2.3 -1.8 -1.4
MBINGA -0.3 -0.6 -0.3 -0.6
NAMTUMBO -3.8 -2.8 -3.8 -2.2
SONGEA RURAL -1.0 -1.2 -1.0 -1.2
TUNDURU -4.5 -3.0 - -
SHINYANGA -3.9 -11.0 - -
BARIADI -6.6 -15.0 - -
BUKOMBE -9.8 -11.0 - -
KAHAMA -7.8 -7.9 - -KISHAPU 1.7 -12.0 - -
MASWA -3.0 -15.0 - -
MEATU 1.3 -9.3 - -
SHINYANGA RURAL -2.0 -7.3 - -
SINGIDA 9.6 2.7 17.0 15.0
IRAMBA 8.2 -6.5 - -
MANYONI 11.0 8.1 17.0 15.0
SINGIDA RURAL 5.9 -4.2 - -
8/3/2019 EastAfr Maize
http://slidepdf.com/reader/full/eastafr-maize 15/17
EARS FAST Crop Yield Forecast
Maize - East Africa - 15 September 2008
EARS – Satellite Data for Water and Food 15
TABORA 3.0 0.0 10.0 9.5IGUNGA 10.0 -2.4 - -
NZEGA -2.7 -5.3 - -
SIKONGE 5.6 4.2 10.0 9.6
TABORA URBAN -0.6 -0.3 - -
URAMBO -1.8 -1.0 - -
UYUI -3.7 -1.0 - -
UYUI 1.4 -4.7 - -
TANGA 4.6 2.6 4.2 2.1
HANDENI 6.5 4.6 7.1 4.6
KILINDI 8.3 7.0 7.8 6.5
KOROGWE 4.2 2.4 4.2 2.4
LUSHOTO 2.6 0.2 2.6 0.2MUHEZA 1.7 0.0 1.7 0.0
PANGANI 0.6 -2.9 0.9 -2.8
Difference Yield (%)
UGANDAAll growingareas
Main growingareas
08/5yrs 08/07 08/5yrs 08/07
ADJUMANI 1.6 2.8 1.6 2.8
ADJUMANI 1.6 2.8 1.6 2.8
APAC -0.2 -1.9 -0.2 -1.9
MARUZI -0.8 -2.8 -0.8 -2.8OYAM 1.8 0.2 1.8 0.2
ARUA 2.3 0.7 2.3 0.7
MADI-OKOLLO 1.5 -0.6 1.5 -0.6
TEREGO 1.3 1.6 1.3 1.6
VURRA 3.8 -0.1 3.8 -0.1
BUSHENYI 4.3 0.7 4.3 0.7
IGARA 4.2 1.9 4.2 1.9
GULU 2.5 3.0 2.5 3.0
KILAK 3.0 4.2 3.0 4.2
NWOYA 1.7 2.0 1.7 2.0
HOIMA -1.2 -2.0 -1.2 -2.3
BUGAHYA -0.7 -1.3 -0.6 -1.8BUHAGUZI -1.6 -2.5 -1.6 -2.6
IGANGA 0.3 -3.0 0.3 -3.0
BUSIKI 1.5 -3.1 1.5 -3.1
ISINGIRO 2.5 -0.6 2.5 -0.6
BUKANGA 1.1 -0.4 1.1 -0.4
ISINGIRO 3.9 -0.8 3.9 -0.8
KAMULI -0.7 -1.4 -0.7 -1.4
BUDIOPE 0.5 0.8 0.5 0.8
BUGABULA -2.2 -3.0 -2.2 -3.0
KAMWENGE 1.7 -1.9 1.7 -1.9
KIBALE 1.0 -1.9 1.0 -1.9
8/3/2019 EastAfr Maize
http://slidepdf.com/reader/full/eastafr-maize 16/17
EARS FAST Crop Yield Forecast
Maize - East Africa - 15 September 2008
EARS – Satellite Data for Water and Food 16
KASESE 3.8 0.1 3.8 0.1
BUKONJO 1.7 2.6 1.7 2.6
BUSONGORA 4.8 -1.1 4.8 -1.1
KIBAALE 1.6 0.8 1.7 0.9
BUGANGAIZI 1.6 1.3 1.6 1.3
BUYAGA 0.9 -0.6 1.1 -0.4
BUYANJA 2.4 1.9 2.4 1.9
KIBOGA 0.5 -2.2 0.5 -2.2
KIBOGA 0.5 -2.2 0.5 -2.2
KIRUHURA 0.6 -4.6 0.6 -4.6
KAZO 0.6 -5.4 0.6 -5.4
NYABUSHOZI 0.6 -4.2 0.6 -4.2KUMI 0.1 -5.6 0.1 -5.6
BUKEDEA -0.6 -6.6 -0.6 -6.6
KUMI -0.1 -5.8 -0.1 -5.8
KYENJOJO 2.2 -0.1 2.2 -0.1
KYAKA 2.4 0.4 2.4 0.4
MWENGE 2.0 -0.5 2.0 -0.5
LUWEERO 2.8 -0.9 2.8 -0.9
KATIKAMU 1.8 -1.4 1.8 -1.4WABUSANA(BAMUNANIKA) 3.7 -0.5 3.7 -0.5
MASAKA 0.4 -4.8 0.2 -4.9
BUKOTO -0.3 -4.1 -0.3 -4.1MASINDI -0.6 -0.8 -0.6 -0.8
BUJENJE -2.4 -3.4 -2.4 -3.4
BULIISA -0.4 0.0 -0.4 0.0
BURULI M 0.1 -1.3 0.1 -1.3
KIBANDA -0.7 -0.2 -0.7 -0.2
MPIGI 0.2 -4.9 0.3 -4.8
GOMBA 3.3 -3.0 3.3 -3.0
MAWOKOTA -3.5 -7.3 -3.6 -7.2
MUBENDE 4.5 0.3 4.5 0.3
BUWEKULA 5.9 1.1 5.9 1.1
KASSANDA 2.3 -1.0 2.3 -1.0
NAKASEKE -0.6 -3.0 -0.6 -3.0NAKASEKE -0.6 -3.0 -0.6 -3.0
NAKASONGOLA 2.0 -2.9 2.0 -2.9
BURULI 2.0 -2.9 2.0 -2.9
NEBBI 0.4 -2.2 0.4 -2.2
JONAM 0.2 -3.2 0.2 -3.2
PADYERE 0.4 -4.0 0.4 -4.0
NTUNGAMO 5.3 -1.7 5.3 -1.7
RUHAAMA 5.5 0.7 5.5 0.7
RAKAI 0.2 -3.6 0.2 -3.7
KABULA 0.6 -2.5 0.6 -2.5
KAKUUTO 3.1 -0.7 - -
8/3/2019 EastAfr Maize
http://slidepdf.com/reader/full/eastafr-maize 17/17
EARS FAST Crop Yield Forecast
Maize - East Africa - 15 September 2008
EARS – Satellite Data for Water and Food 17
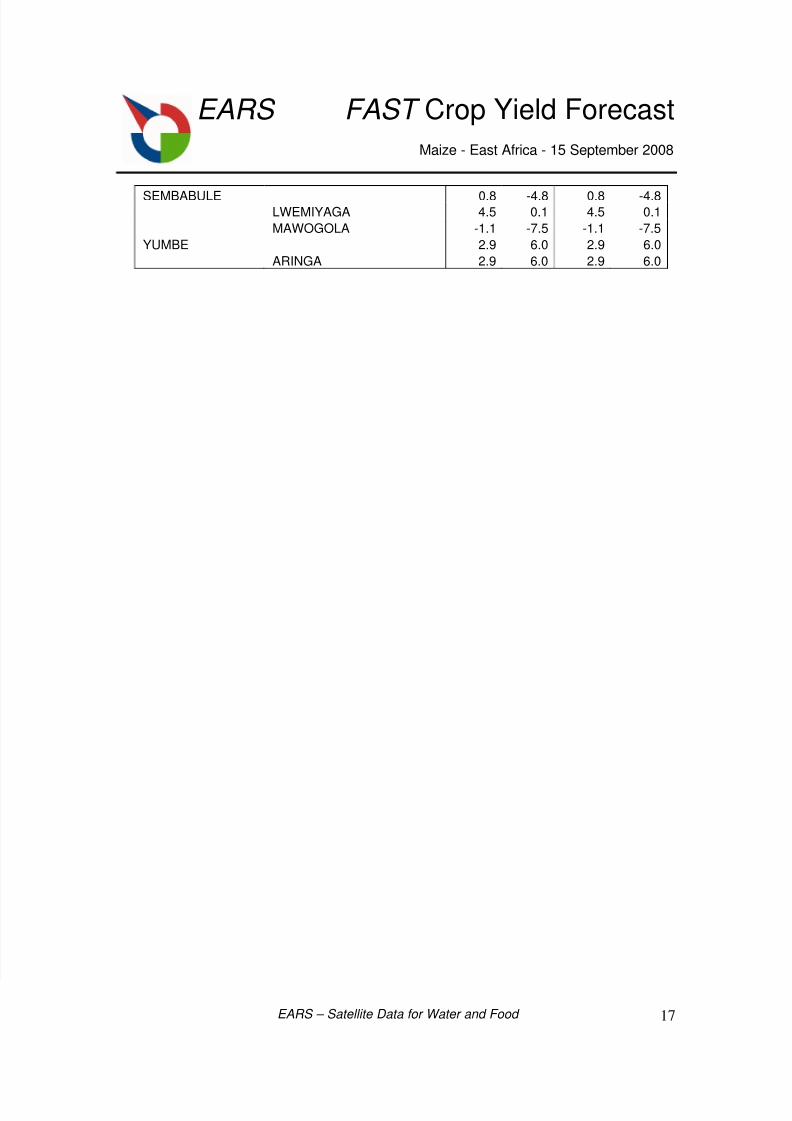
SEMBABULE 0.8 -4.8 0.8 -4.8LWEMIYAGA 4.5 0.1 4.5 0.1
MAWOGOLA -1.1 -7.5 -1.1 -7.5
YUMBE 2.9 6.0 2.9 6.0
ARINGA 2.9 6.0 2.9 6.0