EAST PERTH REDEVELOPMENT AUTHORITY - … · Executive Summary ... The East Perth Redevelopment...
74
EAST PERTH REDEVELOPMENT AUTHORITY Annual Report 2006-2007
Transcript of EAST PERTH REDEVELOPMENT AUTHORITY - … · Executive Summary ... The East Perth Redevelopment...

EAST PERTH REDEVELOPMENT AUTHORITYAnnual Report 2006-2007


ANNUAL REPORT 2006-2007
This is the 15th Annual Report of the East Perth Redevelopment Authority.
EPRA’s office is at 12 Lindsay Street, Perth WA 6000Locked Bag 8, Perth Business Centre WA 6849
Telephone: (08) 9222 8000Facsimile: (08) 9281 6020Email: [email protected]: www.epra.wa.gov.au
Statement of Compliance ....................................................... 2
Executive Summary ............................................................... 3
Enabling Legislation ................................................................ 7
Corporate Governance ........................................................... 8
Compliance ...........................................................................11
Sustainability .........................................................................14
Operations ............................................................................16
Key Performance Indicators ..................................................25
Financial Statements .............................................................31
Opinion of Auditor General ....................................................70
Table of Contents
1

ANNUAL REPORT 2006-2007
The Hon Alannah MacTiernan MLAMinister for Planning and Infrastructure13th Floor Dumas House2 Havelock StreetWEST PERTH WA 6005
Dear Minister
In accordance with the Financial Management Act 2006, we hereby submit for your information and presentation to Parliament the Annual Report of the East Perth Redevelopment Authority for the year ended 30 June 2007.
The Annual Report has been prepared in accordance with the provisions of the Financial Management Act 2006.
Yours sincerely
Mr Stuart Hicks AOChairman
Mr Simon ChesterDeputy Chairman
Mr Tony MorganChief Executive Officer
27 August 2007
Statement of Compliance
2

ANNUAL REPORT 2006-2007
We are pleased to present the 15th Annual Report for the East Perth Redevelopment Authority (EPRA).
In the 2006-2007 financial year, EPRA continued its revitalisation of inner city areas to contribute to a Vital Perth where people want to live, work and visit. EPRA is the Planning Authority for six inner city project areas – Claisebrook Cove, East Perth; East Perth Power Station; Riverside, East Perth; New Northbridge; Northbridge Link; and Creative Quarter (Perth Cultural Centre), covering about 230 hectares of inner city land, including those areas where planning control has been returned to the local council.
Highlights for the 2006-2007 financial year include:
• In March 2007, EPRA approved development for the first stage of the Queens Precinct in the Riverside project. The Precinct will focus on sustainable mixed-use development and the first stage will provide 330 new apartments and townhouses.
• EPRA finalised its Northbridge Link draft Masterplan and released it for a period of community consultation from January to April 2007. The consultation period attracted strong interest and support from stakeholders and the community, with approximately 270 submissions received and more than 330,000 page views registered on the project website.
• Development Approval was granted to the Perth Arena project, a new multi-purpose indoor entertainment and sports stadium, in April 2007. Perth Arena is being delivered by the Department of Housing and Works as the first stage of the Northbridge Link project.
• The East Perth Power Station was identified by the Major Stadia Taskforce as a preferred location for a major sporting stadium. The Taskforce report is being considered by Government and EPRA is awaiting the recommended outcome on the location of the stadium. The Power Station
building is also one of several locations being considered by the Government for the WA Museum.
• Development Approval was granted for the New Performing Arts Venue in the Creative Quarter project area, representing over $61 million of Government investment and establishing the role of the Creative Quarter as a primary node for creative industry and land uses in Perth.
• There was strong demand from the market for land in New Northbridge during the 2006-2007 financial year. A total of 17 lots were sold for $15.18 million. EPRA’s New Northbridge renewal project has already attracted more than $120 million of investment to the area.
• The East Perth Transit Oriented Development (TOD) Study was endorsed by the EPRA Board in June 2007 following a period of consultation with key stakeholders. The Study was endorsed as a guiding policy document to direct future projects in the East Perth Redevelopment Area. The TOD Study provides a holistic context for revitalisation and redevelopment in and around East Perth by utilising Transit Oriented Development principles and best practice urban design.
• The inaugural Jazz & Wooden Boat Festival was held in Claisebrook Cove on 29 October 2006. The free-to-attend event was successful in attracting almost 6,000 people to admire some of Perth’s most beautiful wooden boats and received excellent support from the community and boating industry. The event was also well received by the media and generated significant coverage and publicity.
• EPRA continued its focus on place activation in Claisebrook Cove through the delivery of key events, such as Feast Perth and the Christmas Twilight Picnic, and a promotional campaign with the Sunday Times Magazine to raise awareness of the area as a recreational destination.
Executive Summary
3

ANNUAL REPORT 2006-2007
On 30 June 2007, Place Management responsibilities for the area were transferred to the City of Perth. As a result, EPRA will no longer have a formal role in supporting and investing in place activation initiatives and special events.
• EPRA will be the Principal Partner of the New Trends of Architecture Symposium and Exhibition, which will occur in the next financial year. The event has exhibited internationally, in countries including Luxembourg and Japan, and is only the second time that Australia has been included on the touring schedule.
Financial ResultsAt the conclusion of the 2006-2007 financial year, EPRA has achieved its financial objectives by making a $7.89 million surplus and increasing the net asset value by $8.86 million.
Total combined land sales in Claisebrook Cove, New Northbridge and Riverside achieved $22.98 million. Land sales for New Northbridge alone were $15.18 million, with remaining sales for Claisebrook Cove at $3.98 million and $3.82 million for Riverside. Sales for Claisebrook Cove and Riverside were the result of settlements for properties sold in the previous financial year.
Development InvestmentThe estimated construction value of Development Applications lodged in EPRA’s project areas by the private sector during 2006-2007 was $220.8 million. Private investment in Claisebrook Cove, New Northbridge and Riverside reflect ongoing and growing buyer and public confidence in the regeneration outcomes brought about by EPRA’s projects.
The value of private investment in EPRA’s projects was complemented by over $340 million of Government investment in the project areas. This was mainly generated by Government projects such as the Perth Arena in the Northbridge Link project area and the New Performing Arts Venue on the corner of William Street and Roe Street in the Creative Quarter project area.
Development Applications received by the Authority continued to grow with 74 Applications received in the current financial year in comparison to 64 in the 2005-2006 year and 48 determined in the 2004-2005 year.
SustainabilityIn 2006-2007, EPRA built on its Sustainability Action Plan by applying the Sustainability Assessment Tool (SAT) to its masterplanning process, as a means of better integrating the Triple Bottom Line into redevelopment projects.
The SAT has been applied to the Waterbank Precinct, in Riverside, and the Northbridge Link draft Masterplan, and is being used in the development of the East Perth Power Station draft Masterplan.
Incorporation of the SAT into the masterplanning process has resulted in detailed project sustainability Performance Indicators. EPRA has also committed to review the SAT during the 2007-2008 financial year.
Executive Summary
4
ANNUAL REPORT 2006-2007
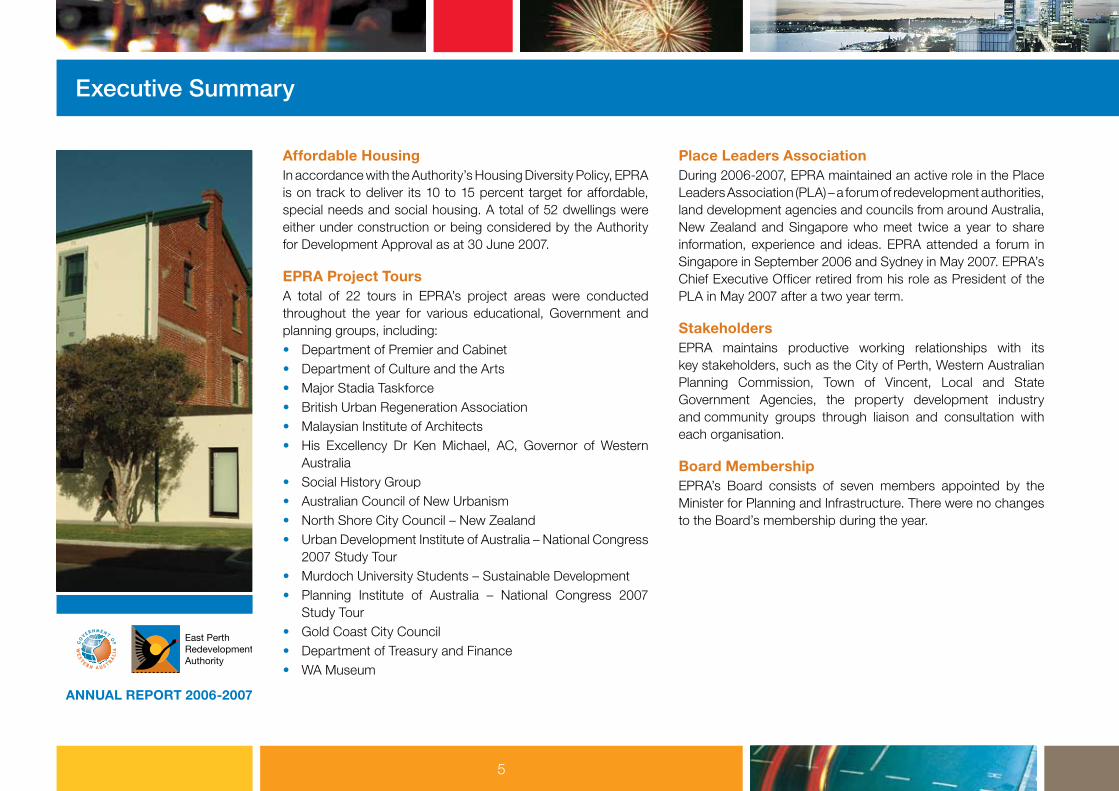
Affordable HousingIn accordance with the Authority’s Housing Diversity Policy, EPRA is on track to deliver its 10 to 15 percent target for affordable, special needs and social housing. A total of 52 dwellings were either under construction or being considered by the Authority for Development Approval as at 30 June 2007.
EPRA Project ToursA total of 22 tours in EPRA’s project areas were conducted throughout the year for various educational, Government and planning groups, including:• Department of Premier and Cabinet• Department of Culture and the Arts• Major Stadia Taskforce• British Urban Regeneration Association• Malaysian Institute of Architects• His Excellency Dr Ken Michael, AC, Governor of Western
Australia• Social History Group• Australian Council of New Urbanism• North Shore City Council – New Zealand• Urban Development Institute of Australia – National Congress
2007 Study Tour• Murdoch University Students – Sustainable Development• Planning Institute of Australia – National Congress 2007
Study Tour• Gold Coast City Council• Department of Treasury and Finance• WA Museum
Place Leaders AssociationDuring 2006-2007, EPRA maintained an active role in the Place Leaders Association (PLA) – a forum of redevelopment authorities, land development agencies and councils from around Australia, New Zealand and Singapore who meet twice a year to share information, experience and ideas. EPRA attended a forum in Singapore in September 2006 and Sydney in May 2007. EPRA’s Chief Executive Officer retired from his role as President of the PLA in May 2007 after a two year term.
StakeholdersEPRA maintains productive working relationships with its key stakeholders, such as the City of Perth, Western Australian Planning Commission, Town of Vincent, Local and State Government Agencies, the property development industry and community groups through liaison and consultation with each organisation.
Board MembershipEPRA’s Board consists of seven members appointed by the Minister for Planning and Infrastructure. There were no changes to the Board’s membership during the year.
Executive Summary
5
ANNUAL REPORT 2006-2007
EPRA StaffEPRA’s workforce is comprised of an urban development team and redevelopment professionals supported by corporate and administrative staff. A strategic human resource management plan is being developed to include strategies to address organisational resource requirements. The plan will incorporate the revision of present policies, processes and reporting to ensure a productive, equitable, safe and effective working environment. Training and development programs to provide for staff and organisational needs form part of the human resource strategy.
The current staffing level of 44 is comprised of 39 full time and five part time staff, which is equivalent to 43 FTE.
We would like to take the opportunity to thank the Minister for Planning and Infrastructure, the Hon Alannah MacTiernan MLA, and to express our appreciation to Board members, staff and consultants for their support, professionalism and commitment to EPRA and its planning and redevelopment objectives.
Mr Stuart Hicks AO Mr Tony MorganChairman Chief Executive Officer
Executive Summary
6

ANNUAL REPORT 2006-2007
The East Perth Redevelopment Authority was established by the East Perth Redevelopment Act 1991. EPRA’s functions are described in the Act as follows:a) To plan, undertake, promote and coordinate the redevelopment
of land in the Redevelopment Area; andb) For that purpose
i) under Part 4, to prepare and keep under review a Redevelopment Scheme for that area; and
ii) under Part 5, to control developments in that area.
The Act was amended by Parliament to reflect the enactment of the State Administrative Tribunal (Conferral of Jurisdiction) Amendment and Repeal Act 2004.
Ministerial DirectionThe Minister for Planning and Infrastructure, the Hon Alannah MacTiernan MLA, is responsible for the East Perth Redevelopment Act 1991. EPRA’s enabling legislation requires that if the Minister gives a direction to the Authority, it shall be in writing and tabled in Parliament. There were no Ministerial directions during the 2006-2007 financial year.
Redevelopment Area Map
Legend Existing Lot Boundary
Original Redevelopment Area Boundary
Current Redevelopment Area Boundary
Enabling Legislation
7

ANNUAL REPORT 2006-2007
Statement of PurposeTo play a lead role in making Perth a great place that people want to be part of.
VisionVital Perth.
ValuesRespect, Integrity, Fairness, Commitment, Leadership.
Strategic ObjectivesEach year, EPRA’s Board and Senior Management prepare Strategic Directions and a Business Plan. This includes a review and update of corporate objectives to reflect the organisation’s current operating environment.
Strategic Objectives for 2006-2007 were:• Inform and assist the Government’s consideration of any
changes in EPRA’s role and legislation whilst remaining focused on pursuing the current role
• Continue to be innovative and show leadership in all aspects of place making
• Remain a practical deliverer of quality outcomes• Commit to effective stakeholder and community
relationships• Recruit and retain qualified and high performing people• Ensure effective financial and risk management.
Financial Results
Actual 2006-2007
Sales revenue $22.977m
Operating surplus $7.895m
Net Asset Value $87.238m
EPRA achieved its financial objectives for the 2006-2007 financial year by making a $7.89 million surplus and increasing the net asset value by $8.86 million. The surplus was attained as a result of land sales reaching $22.98 million. Revenue from land sales also assisted in increasing EPRA’s net asset value.
Membership of the BoardThe Board consists of seven members appointed by the Minister, representing a broad spectrum of knowledge and experience in fields appropriate to the activities of the Authority. Criteria for the appointment of members in accordance with sections 7 and 8 of the East Perth Redevelopment Act 1991 are:(a) Five persons who in the opinion of the Minister have a relevant
qualification(b) Two persons who are members of the Council of the
City of Perth who are nominated by formal resolution of that Council
(c) Two members to then be appointed by the Minister as Chairperson and Deputy Chairperson of the Authority.
Corporate Governance
8

ANNUAL REPORT 2006-2007
Board RemunerationBoard members are remunerated according to guidelines set by the Public Sector Management Office. Board members who are public servants do not receive remuneration.
Member Expiry of TermMr Stuart Hicks AO (Chair) 31 December 2008Mr Simon Chester (Deputy Chair) 31 December 2006Mr Milan Chetkovich 31 December 2007Mr Mike Day 31 December 2006Ms Carol Hofmeester 31 December 2006*Cr Judy McEvoy 30 June 2007*Rt Hon, The Lord Mayor, Dr Peter Nattrass 30 June 2007
*Members nominated by the City of Perth.
Members whose terms have expired remain in office under clause 1(2) of schedule 2 to the East Perth Redevelopment Act 1991 until a successor is appointed.
Sub-Committees to the BoardTwo sub-committees to the Board, with delegated powers to make determinations on behalf of the Board or informed recommendations to the Board, met to deal with issues particular to the roles and responsibilities assigned to each committee.
Planning Committee – Mr Simon Chester (Chair), Cr Judy McEvoy, Mr Mike Day, Mr Stuart Hicks AO (ex-officio) and Mr Tony Morgan.
Internal Audit Committee – Ms Carol Hofmeester (Chair), Mr Mike Day, Mr Milan Chetkovich and Mr Stuart Hicks AO (ex-officio).
Board Members’ AttendanceThe Board met nine times in the financial year with 13 Planning Committee and two Internal Audit Committee meetings also taking place.
Board Member BOARD
9 meetingsPLANNING13 meetings
INTERNAL AUDIT2 meetings
Mr Stuart Hicks AO (Chair) 8 1 1
Mr Simon Chester (Deputy Chair) 8 13 NA
Mr Milan Chetkovich 9 NA 2
Mr Mike Day 8 11 2
Ms Carol Hofmeester 8 NA 2
*Cr Judy McEvoy 8 11 NA
*Rt Hon, The Lord Mayor, Dr Peter Nattrass 7 NA NA
*Members nominated by the City of Perth.
Corporate Governance
9

ANNUAL REPORT 2006-2007
Board Strategic Planning WorkshopIn March 2007 Board members attended a Strategic Planning Workshop. This session was specifically designed to enable members to contribute from a Board perspective to EPRA’s strategic business planning for 2007-2012.
Management *EPRA’s management structure consists of two Executive Directors, each reporting to the Chief Executive Officer, and five Senior Managers.
Mark Hedges – Executive Director, Planning and DevelopmentLisa Smith – Executive Director, Business Services and Place ManagementAnne Edmonds – Senior Manager, PlanningSteve Gilligan – Senior Manager, DevelopmentChris Porter – Senior Manager, Business ServicesZanda Cameron – Senior Manager, Place ManagementStuart McKnight – Senior Manager, Evaluations and Acquisitions
* Change to management structure occurred late in the financial year, including the appointment of Sean Henriques as Chief Financial Officer.
The Chief Executive Officer, Executive Directors and Senior Managers meet regularly to consider management issues. Quarterly Business Plan reports are presented to the Board.
The team is supplemented by various consultants including internal audit, project direction and management, legal, taxation, human resources, communications, advertising, information technology, urban planning, architecture, heritage, engineering, settlement agents and real estate agents.
Interest in or Benefits from ContractsEPRA operates a contract administration system that requires senior officers to declare confidentiality and interest in respect to any existing or proposed contract. There are no known cases of any conflict of interest in the 2006-2007 reporting period.
Organisational Overview
Chief Executive
Executive DirectorPlanning and Development
Executive DirectorPlace Management & Business Services
Senior ManagerPlanning
Senior ManagerEvaluation & Acquisitions
Senior ManagerDevelopment
Senior ManagerBusiness Services
Senior ManagerPlace Management
Corporate Governance
10

ANNUAL REPORT 2006-2007
Compliance with Other LegislationIn the performance of its functions, EPRA complies with the following written laws:
Aboriginal Heritage Act 1972Contaminated Sites Act 2003Corruption and Crime Commission Act 2003Disabilities Services Act 1993Disability Discrimination Act 1992East Perth Redevelopment Act 1991Electoral Act 1907Environmental Protection Act 1986Equal Opportunity Act 1984Financial Management Act 2006 *Freedom of Information Act 1992Fringe Benefit Tax Assessment Act 1986Heritage of Western Australia Act 1990Income Tax Assessment Act 1997Industrial Relations Act 1979Land Administration Act 1997Occupational Health and Safety Act 1984Planning and Development Act 2005Public Interest Disclosure Act 2003
Public Sector Management Act 1994Salaries and Allowances Act 1975State Administrative Tribunal Act 2004State Records Act 2000State Superannuation Act 2000State Supply Commission Act 1991Statutory Corporations (Liability of Directors) Act 1996Strata Titles Act 1985Swan and Canning Rivers Management Act 2006Taxation Administration Act 2003Trade Practices Act 1985Transfer of Land Act 1893Workers Compensation and Injury Management Act 1981
In 2006-2007, EPRA worked with internal auditors Ernst and Young and legal advisers Minter Ellison in a comprehensive review of EPRA’s compliance with its regulatory framework. Appropriate systems have been developed to ensure EPRA’s compliance with this regulatory framework in the current financial year.
* This legislation was the subject of external audit examination during the year and there was no evidence of non-compliance.
Compliance
11
ANNUAL REPORT 2006-2007
Marketing and Advertising
Electoral Act 1907In compliance with section 175ZE of the Electoral Act 1907, the following expenditure was incurred during the year:
$’000
Market Research
Synovate 78
TNS 10
Media Advertising
(including Multimedia)
303 264
Marketforce Productions 39
Last Pixel 92
Marketing and Public Relations
Purple Communications 118
Equal Employment Opportunity OutcomesIn accordance with Section 146 of the Equal Opportunity Act 1984, EPRA completed development of an Equal Employment Opportunity Management Plan and submitted this for review to the Office of Equal Employment Opportunity. In 2006-2007 the Equal Employment Commission conducted in-house training for EPRA staff.
Public Sector Standards and Code of EthicsIn accordance with section 31 of the Public Sector Management Act 1994, EPRA has complied with the Public Sector Standards and Code of Ethics, with procedures in place to ensure such compliance. There were no breaches of Public Sector Standards in 2006-2007.
Record KeepingIn accordance with the State Records Commission Standard 2, EPRA has complied with the State Records Act 2000. In 2006-2007 all record keeping training and evaluation requirements were in place to ensure such compliance and EPRA’s staff induction program addresses employee roles and responsibilities regarding record keeping and includes mandatory records training for all new employees.
Disability Service OutcomesIn accordance with Section 29 (1) of the Disabilities Services Act 1993, EPRA has completed a Disability Access and Inclusion Plan which was submitted to the Disability Services Commission prior to 31 July 2007. A comprehensive plan is in place to ensure its implementation and it is available to the general public through the website.
Compliance
12

ANNUAL REPORT 2006-2007
Corruption PreventionFurther to the annual update of its risk register, EPRA has initiated a number of risk management activities during the year to reduce the likelihood of corruption and misconduct. Policies and procedures with regard to ethics, values, computer access, procurement, gifts and benefits have been developed and communicated to staff. These now form a component of the staff induction process. In 2006-2007, polices and procedures were published on EPRA’s Intranet to ensure the availability of information to staff.
PublicationsPublications by EPRA are available at its office at 12 Lindsay Street, Perth WA 6000 and online at www.epra.wa.gov.au.
The principal publications are:• East Perth Redevelopment Scheme, Scheme Text and
Planning Policies• Annual Reports for the years ending 1993 – 2007• Riverside (Gateway) Masterplan• East Perth Power Station draft Masterplan• Northbridge Link draft Masterplan• Design Guidelines• Corporate brochure• The Union Bakery Redevelopment brochure• Urbano magazines• Sustainability Action Plan• Project and marketing information• EPRA Affordable Owner Occupier Housing brochure• Customer Service Charter.
No information of a personal nature concerning members of the public is kept by EPRA.
A copy of the East Perth Redevelopment Act 1991 is available from the State Law Publisher.
Compliance
13

ANNUAL REPORT 2006-2007
Policy ContextEPRA has played a leading role in delivering sustainable development, through its award-winning urban renewal projects, and has continued to deliver against its originally established economic, social and environmental targets.
Government policy initiatives on sustainability include the State Sustainability Strategy, the Greenhouse Strategy, the Sustainability Bill and the Sustainability Code of Conduct.
The Sustainability Code of Conduct requires all Government agencies to implement a number of commitments relating to the incorporation of sustainability principles and practice into decision making, including:• Commitment 1.1: Incorporate sustainability principles and
actions (consistent with ‘Better Planning: Better Futures – A Framework for the Strategic Management of the Western Australian Public Sector’) into strategic and business planning and budgeting
• Commitment 1.3: Utilise sustainability assessment in planning and decision making
• Commitment 1.3(a): Integrate sustainability into project delivery.
EPRA’s progress against those commitments is addressed in its Sustainability Action Plan and also includes the application of the Sustainability Assessment Tool (SAT) in 2006-2007 to assess the outcomes of its projects.
Sustainability Assessment ToolThe SAT outlines a set of sustainability priorities that reflect EPRA’s desired urban outcomes. The sustainability priorities have been grouped under five broad categories:• Community Development• Economic Benefits• Environment• Urban Design• Infrastructure.
Use of the SAT enhances regular Triple Bottom Line reporting to become a mechanism for reporting on the overall performance of preferred Masterplan options against the Authority’s sustainability priorities.
The following are key data collection points for measurement of Performance Indicators:• Masterplanning/Triple Bottom Line reporting• Development control• Post occupancy surveys.
EPRA has committed to reviewing the SAT in 2007-2008 to further improve its delivery of sustainability objectives throughout its projects.
Sustainability
14

ANNUAL REPORT 2006-2007
Project SustainabilityThe SAT has been applied to the Waterbank Precinct Plan in the Riverside project, the Northbridge Link draft Masterplan and the East Perth Power Station draft Masterplan. Performance Indicator reports have also been developed for each of these projects as part of the SAT process.
EPRA aims to pioneer national best practice in Integrated Urban Water Management for redevelopment at Riverside. In addition to environmental issues, EPRA also focuses on community development, excellent urban design outcomes and economic benefits to accomplish its Triple Bottom Line objectives.
In this regard, EPRA continued to demonstrate its commitment to social and economic outcomes through place activation strategies and special events in 2006-2007, including Feast Perth, the Christmas Twilight Picnic and the Jazz & Wooden Boat Festival in Claisebrook Cove.
Triple Bottom Line AssessmentA Triple Bottom Line (TBL) report is prepared for all project Masterplans following the application of the SAT. TBL reports assess the ongoing social, environmental and economic outcomes of projects to ensure that decisions are not made on the basis of financial considerations alone.
During the current financial year, TBL reports have been finalised for the Northbridge Link and Riverside projects. A project evaluation for the Claisebrook Cove project has commenced and will be completed during the 2007-2008 financial year.
Sustainability
15

ANNUAL REPORT 2006-2007
Project OverviewEPRA had six project areas under its leadership during 2006-2007.
Claisebrook CoveThe Claisebrook Cove project area covers 137.5 hectares of former industrial land including the former East Perth Gasworks, scrap yards, contaminated industrial sites, empty warehouses and railway yards. The inner city urban renewal project is bounded by Lord and Summers Streets, East Parade, the Graham Farmer Freeway, the Swan River, and Arden, Nile, Wittenoom and Royal Streets.
VisionClaisebrook Cove has been transformed from an industrial wasteland to a waterfront urban village, combining quality residential and commercial development with beautiful parkland, waterways and public art.
Objectives• Promote the benefits of Transit Oriented Development to
residents and workers in the area to increase the use of public transport, such as the Claisebrook train station and extension of the Central Area Transit (CAT) bus routes.
• Conserve both the natural and built environment through the creation of a sustainable inner city community. The area’s cultural heritage has also been conserved through the restoration of buildings, such as the Boans Warehouse, and through the delivery of an interpretive public art collection.
• Create vibrant and active public open spaces. The project encompasses more than 22 hectares of public open space, pathways, parklands and foreshore recreation areas.
• Attract key businesses and investment to the project area to generate employment and add to Claisebrook’s vibrancy.
Current Status• The Claisebrook Cove project is 90 percent complete. Almost
60 percent of the project has been normalised, with planning control returned to the City of Perth. The second stage of normalisation is expected to occur in December 2007 and will see a further 13 percent of the project returned to the City.
• The Royal Street West precinct is the final phase of the Claisebrook Cove project, covering 2.85 hectares bounded by the Claisebrook train station and railway line, Lord Street, Royal Street, and eCentral TAFE on Fielder Street. EPRA is preparing development options for the site during the 2007-2008 financial year. This will incorporate Transit Oriented Development and affordable housing principles.
• In this financial year, 18 Development Applications were received with a combined value of $13.3 million.
• Development within the Imago Precinct, which is comprised of four mixed-use lots, has commenced with three of the four sites under construction. Construction in this precinct will see the establishment of four to five storey buildings containing approximately 85 apartments in close proximity to the Claisebrook train station.
• EPRA adopted a Housing Diversity Policy in 2002, which states that 10 to 15 percent of new dwellings on land released by the Authority in the project area is delivered for social or affordable housing. Further affordable dwellings for Claisebrook Cove will focus on the Royal Street West precinct.
Operations
16
ANNUAL REPORT 2006-2007
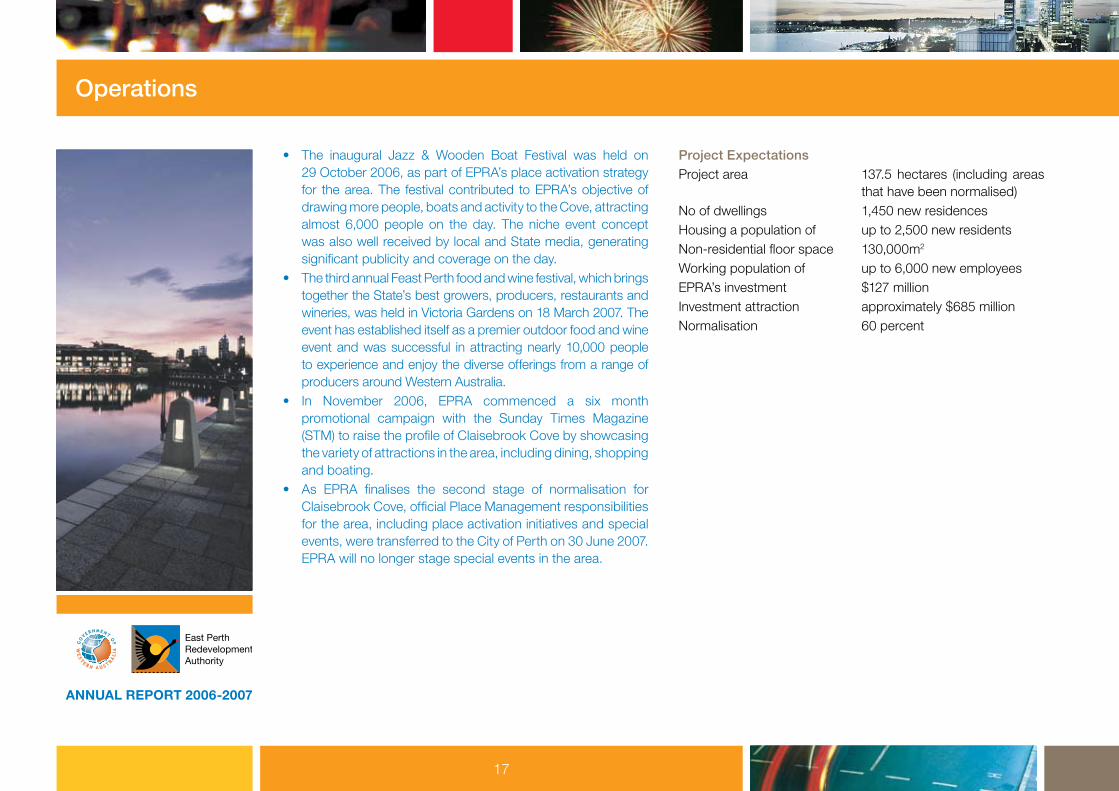
• The inaugural Jazz & Wooden Boat Festival was held on 29 October 2006, as part of EPRA’s place activation strategy for the area. The festival contributed to EPRA’s objective of drawing more people, boats and activity to the Cove, attracting almost 6,000 people on the day. The niche event concept was also well received by local and State media, generating significant publicity and coverage on the day.
• The third annual Feast Perth food and wine festival, which brings together the State’s best growers, producers, restaurants and wineries, was held in Victoria Gardens on 18 March 2007. The event has established itself as a premier outdoor food and wine event and was successful in attracting nearly 10,000 people to experience and enjoy the diverse offerings from a range of producers around Western Australia.
• In November 2006, EPRA commenced a six month promotional campaign with the Sunday Times Magazine (STM) to raise the profile of Claisebrook Cove by showcasing the variety of attractions in the area, including dining, shopping and boating.
• As EPRA finalises the second stage of normalisation for Claisebrook Cove, official Place Management responsibilities for the area, including place activation initiatives and special events, were transferred to the City of Perth on 30 June 2007. EPRA will no longer stage special events in the area.
Project ExpectationsProject area 137.5 hectares (including areas
that have been normalised)No of dwellings 1,450 new residencesHousing a population of up to 2,500 new residentsNon-residential floor space 130,000m2
Working population of up to 6,000 new employeesEPRA’s investment $127 millionInvestment attraction approximately $685 millionNormalisation 60 percent
Operations
17
ANNUAL REPORT 2006-2007
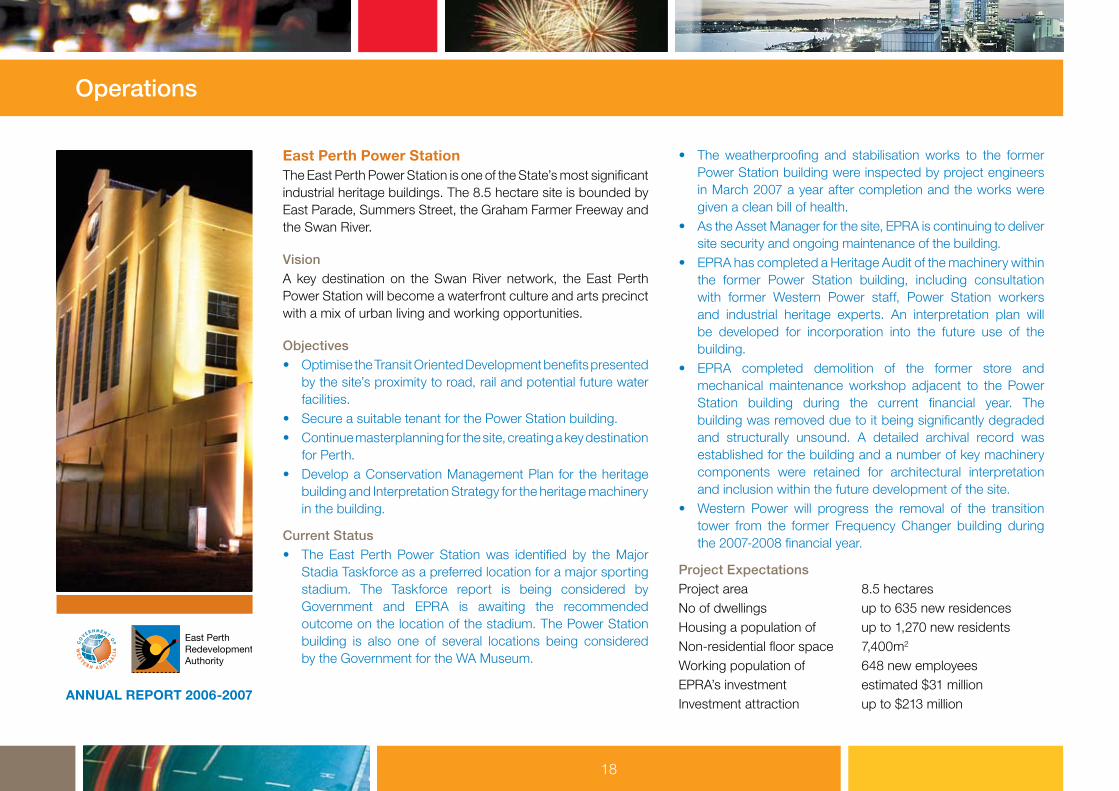
East Perth Power StationThe East Perth Power Station is one of the State’s most significant industrial heritage buildings. The 8.5 hectare site is bounded by East Parade, Summers Street, the Graham Farmer Freeway and the Swan River.
VisionA key destination on the Swan River network, the East Perth Power Station will become a waterfront culture and arts precinct with a mix of urban living and working opportunities.
Objectives• Optimise the Transit Oriented Development benefits presented
by the site’s proximity to road, rail and potential future water facilities.
• Secure a suitable tenant for the Power Station building.• Continue masterplanning for the site, creating a key destination
for Perth.• Develop a Conservation Management Plan for the heritage
building and Interpretation Strategy for the heritage machinery in the building.
Current Status• The East Perth Power Station was identified by the Major
Stadia Taskforce as a preferred location for a major sporting stadium. The Taskforce report is being considered by Government and EPRA is awaiting the recommended outcome on the location of the stadium. The Power Station building is also one of several locations being considered by the Government for the WA Museum.
• The weatherproofing and stabilisation works to the former Power Station building were inspected by project engineers in March 2007 a year after completion and the works were given a clean bill of health.
• As the Asset Manager for the site, EPRA is continuing to deliver site security and ongoing maintenance of the building.
• EPRA has completed a Heritage Audit of the machinery within the former Power Station building, including consultation with former Western Power staff, Power Station workers and industrial heritage experts. An interpretation plan will be developed for incorporation into the future use of the building.
• EPRA completed demolition of the former store and mechanical maintenance workshop adjacent to the Power Station building during the current financial year. The building was removed due to it being significantly degraded and structurally unsound. A detailed archival record was established for the building and a number of key machinery components were retained for architectural interpretation and inclusion within the future development of the site.
• Western Power will progress the removal of the transition tower from the former Frequency Changer building during the 2007-2008 financial year.
Project ExpectationsProject area 8.5 hectaresNo of dwellings up to 635 new residencesHousing a population of up to 1,270 new residentsNon-residential floor space 7,400m2
Working population of 648 new employeesEPRA’s investment estimated $31 millionInvestment attraction up to $213 million
Operations
18

ANNUAL REPORT 2006-2007
RiversideThe Riverside project will see the creation of a diverse, high-density, urban community on the doorstep of Perth’s CBD, optimising the benefits of the Swan River frontage. Riverside covers 40 hectares bounded by Plain Street, Adelaide Terrace, the Swan River foreshore and Nile Street. The project area comprises several key recreation and sporting facilities including Queen’s Gardens, Gloucester Park and the WACA ground.
VisionRiverside will transform Perth’s eastern gateway into a vibrant, urban community on the banks of the Swan River.
Objectives• A bustling and vibrant urban community that will combine
some of Perth’s premier sporting facilities with waterfront entertainment and commercial and residential developments to become a draw card for visitors and tourists.
• Create high-density, sustainable residential and commercial development that is supported by mixed-use land principles.
• Redevelop Perth’s eastern gateway through a new waterfront entertainment precinct that will include a river inlet with jetties and boardwalks, complemented by mixed-use development including cafés and restaurants.
• Attract new businesses and private sector investment to the project area.
• Incorporate buildings and places of heritage significance into the redevelopment, including the heritage listed Western Australian Police Headquarters.
Current Status• Six Development Applications were received for the Riverside
project area with a combined value of $159.1 million.• In March 2007, Development Approval was granted over four
lots owned by Frasers Property Group, including a four to eight storey residential building and three mixed-use buildings varying from four to 18 storeys in height. Approval was also granted for two lots owned by TRG Properties Pty Ltd for three to four storey residential buildings. The six lots within the Queens Precinct will provide 330 new apartments and townhouses.
• Precinct planning for Waterbank continued this financial year. EPRA has been in consultation with Nyoongar representatives to ensure the plan respects the cultural heritage of the Indigenous community. Ongoing planning for the Western Australian Police Services site is also underway.
• As part of EPRA’s Housing Diversity Policy, the first stage of the Queens Precinct will include 19 affordable dwellings. Construction of these units is due to commence in the 2007-2008 financial year.
Project ExpectationsProject area 40 hectaresNo of dwellings 2,750 dwellingsHousing population of 5,000 new residentsNon-residential floorspace 28,000m2
Working population of 1,000 new employeesEPRA’s investment $103 millionInvestment attraction approximately $750 million
Operations
19

ANNUAL REPORT 2006-2007
New NorthbridgeNew Northbridge has experienced an intensive revitalisation program that has included major streetscaping, public and infrastructure works, the conservation of heritage buildings and the creation of mixed-use development opportunities. The 27 hectare urban renewal project comprises land above and adjacent to the Graham Farmer Freeway tunnel, bounded by Fitzgerald, Newcastle, Parry, Lord and Aberdeen Streets.
VisionThe New Northbridge project is enhancing the area’s rich history through adaptive reuse of heritage buildings, quality infrastructure, a commitment to housing diversity and innovative new mixed-use development.
Objectives• Enhance and protect the area’s heritage and cultural values,
while optimising returns and providing land and property redevelopment opportunities.
• Create an area that is safe, secure, friendly and enjoyable for the Northbridge community to live, work and play in.
• Promote the Transit Oriented Development benefits of New Northbridge, with particular emphasis on Perth’s free CAT bus services, cycleways and pedestrian-friendly streetscaping.
• Ongoing commitment to affordable housing with 10 to 15 percent of new land releases to be reserved for social and affordable housing.
• Attract visitors and businesses to New Northbridge, highlighting the lifestyle benefits of the culturally rich area and the proximity to the CBD.
Current Status• The East Perth Redevelopment Scheme was extended over
land between William and Money Streets north of Newcastle Street, including the Auto Masters site, on 4 August 2006. Preliminary approval to re-subdivide this land was granted by the Minister for Planning and Infrastructure on 5 January 2007. The Lindsay Street Precinct Design Guidelines have been amended to establish development provisions for each of the allotments proposed to be created by the subdivision.
• During the financial year, EPRA completed the Museum Street Precinct development and Stage 1 of the Lindsay Street Precinct development. Works commenced for the Auto Masters Subdivision in the Lindsay Street Precinct and are due for completion in the 2007-2008 financial year.
• Review and amendment of the New Northbridge Design Guidelines was undertaken in consultation with the City of Perth, Town of Vincent and land owners, demonstrating EPRA’s commitment to development control that enables quality built form outcomes. Final adoption of the amended New Northbridge Design Guidelines is anticipated early in the 2007-2008 financial year.
• A total of 41 Development Applications were received with a combined value of $51.9 million.
• Seventeen lots were sold this financial year for a total of $15.18 million. All lots were zoned for mixed-use development.
• A record price of $2,214 per square metre for mixed-use land in New Northbridge was achieved at auction in the second stage sales release of the Lindsay Street Precinct. The refurbished heritage cottage sold for $850,000, exceeding the targeted budget by 77 percent.
Operations
20

ANNUAL REPORT 2006-2007
• EPRA commenced planning for refurbishment of two heritage cottages located in Lake Street and Newcastle Street and will commence refurbishment of a further five cottages during the 2007-2008 financial year.
• EPRA has commenced the reconstruction of a portion of Michael Close between Errichetti Place and Zempilas Road to increase the design functionality of the road and the amenity of the area.
• In May 2006, EPRA launched a general awareness advertising campaign for New Northbridge as part of a broader marketing strategy for the area. The campaign ran until September 2006 and included cinema and online advertising, signage, direct mail, redevelopment of the New Northbridge project website and a new brand identity.
• EPRA hosted a New Northbridge Resident Event on 30 August 2006 as part of its promotional campaign for the area. New Northbridge residents were invited to a screening of a film at Cinema Paradiso and had the chance to network with EPRA and City of Perth representatives.
Project ExpectationsProject area 27 hectaresNo of dwellings 460 new residencesHousing a population of up to 1,250 new residentsNon-residential floorspace 70,000m2
Working population of up to 3,500 new employeesEPRA’s investment $60 millionInvestment attraction approximately $300 million
Operations
21

ANNUAL REPORT 2006-2007
Northbridge LinkNorthbridge Link will play a key role in meeting the needs of our changing city, finally removing the great divide between the city’s commercial and business precinct and Northbridge’s lively cultural, restaurant and nightlife hub. The 13.5 hectare project area will see prime inner city land redeveloped between the Mitchell Freeway, Roe Street, Wellington Street and the Horseshoe Bridge.
VisionNorthbridge Link will remove the great divide between Northbridge and the CBD and create a vibrant mixed-use precinct in the heart of our city.
Objectives• Finalise the Northbridge Link Masterplan and coordinate
development and implementation of the project.• Deliver a redevelopment project with high quality urban design
and built form outcomes that provides a focus for public life, with the creation of a new and improved public realm.
• Improve pedestrian, cyclist and vehicular connections and provide residents, workers and visitors with good access to high quality transit infrastructure.
• Repopulate Perth by bringing residents, workers and students back to the city.
• Provide quality and innovative architecture of an international standard.
• Deliver positive economic, social and environmental outcomes.
Current Status• EPRA released its Northbridge Link draft Masterplan for a
four month period of community consultation from January to April 2007.
• EPRA undertook a comprehensive consultation program that employed a range of initiatives that promoted the consultation period and encouraged feedback on the draft Masterplan including a dedicated project website, consultation brochure, facilitated workshops, stakeholder briefings, market research, signage, mobile displays, Peer Review and a free call Community Information Line.
• The consultation process attracted strong interest and support for the project from key stakeholders and the community, resulting in more than 330,000 page views on the project website and approximately 270 submissions on the draft Masterplan.
• Development Approval was granted to the Perth Arena project, a new multi-purpose indoor entertainment and sports stadium, in April 2007. Perth Arena is being delivered by the Department of Housing and Works as the first stage of the Northbridge Link project.
• Two Development Applications were received by EPRA for works within the Northbridge Link project area. Both Applications related to the Perth Arena and total $275.7 million.
• EPRA is collating and analysing the submissions received during the community consultation period, with the results being fed into the next stage of planning for the Northbridge Link project. A report on consultation findings will be made available to the community via the project website early in the next financial year.
Operations
22

ANNUAL REPORT 2006-2007
• The Masterplan will be finalised by late 2007, after consideration of the public consultation outcomes.
• As part of EPRA’s Affordable Housing policy, Northbridge Link will meet a target of 10 to 15 percent for social and affordable housing.
Project ExpectationsProject area 13.5 hectaresNo of dwellings 1,600 *Housing a population of 2,400Non-residential floor space 170,000m2
Working population of 11,200EPRA’s investment approximately $95 millionInvestment attraction approximately $950 million* Includes a possible 900 units at the privately-owned Perth Entertainment Centre site
Operations
23

ANNUAL REPORT 2006-2007
Creative QuarterThe Creative Quarter contains some of the State’s most significant cultural facilities including the Art Gallery, State Library and Museum. The Creative Quarter will be revitalised into a major cultural destination, attracting people back into the area and nurturing the State’s creative industries. The project is bordered by Aberdeen, William, Roe and Beaufort Streets and includes the Central TAFE campus.
VisionThe Creative Quarter will become Perth’s centre of creativity and knowledge, offering a unique cultural experience in an exciting and safe urban environment.
Objectives• Focus on Place Management objectives and introduce
new activities to draw visitors to the area, creating a vibrant precinct and encouraging increased use of the facilities within the Creative Quarter.
• Enhance and conserve the architecturally and historically significant buildings in the area, including some structures that date back to the Victorian and Federation eras.
• Increase safety and security in the area through urban design, which will enable the area to act as a catalyst for social and cultural interaction.
• Offer a unique and vital experience populated by creative industries.
• Introduce new residents and businesses to the area, improve accessibility and provide an important link with key city destinations and public transport.
Current Status• Seven Development Applications were received with a
combined value of $61.8 million.• Development Approval for both forward works and the
construction of the New Performing Arts Venue was granted in the 2006-2007 financial year, totalling over $61 million of Government investment in the project area.
• A high-level Working Group has been formed with representatives from the Art Gallery, State Library, Museum, Department of Culture and the Arts and EPRA to kick-start the project and build effective relationships.
Project Expectations*Project area 9.5 hectares
This project is currently in the early stages of planning and given the use of the area there is not likely to be a significant increase in the amount of non-residential floor space. Also, a full cost analysis of the area has not yet been determined.
* Yet to be developed
Operations
24
ANNUAL REPORT 2006-2007
We hereby certify that the performance indicators are based on proper records, are relevant and appropriate for assisting users to assess the East Perth Redevelopment Authority’s performance, and fairly represent the performance of the East Perth Redevelopment Authority for the financial year ended 30 June 2007.
Mr Stuart Hicks AOChairman
Mr Simon ChesterDeputy Chairman
Mr Tony MorganChief Executive Officer
9 August 2007
Certification of Performance Indicators
25

ANNUAL REPORT 2006-2007
Key Performance Indicators
Outcome StatementEPRA aims to attract thousands of Western Australians back into the city to live, study, work and play.
Effectiveness IndicatorsThese indicators quantify how well EPRA is achieving its outcomes.
Claisebrook Cove
1992 2002 2003 2004 2005 2006 2007
Living in the area1 100 1,247 1,314 1,314 1,319 1,440 2,257
Studying in the area
Educational institutions 0 1 1 1 1 1 1
No of students2 0 1,763 2,289 2,742 2,873 2,984 2,931
Working in the area
Businesses < 50 staff3 103 265 283 401 341 342 341
Businesses > 50 staff3 3 5 4 3 5 4 5
Playing in the area
Visitors to public facilities4 NA N/A N/A 2,065,992 1,659,150 2,524,223 4,010,608
Key FindingThe number of people living in Claisebrook Cove has increased significantly in 2006-2007 as a result of new residential dwellings approved by EPRA along with recent findings from 2006 Census data. The data shows an increase in the average number of residents per dwelling, from approximately 1.4 persons to approximately 2.1 persons.
The number of visitors and the frequency of visiting the project area has also grown significantly during 2006-2007. Based on market research undertaken to generate the estimated total number of recreational visits, 501,326 people visited the area an average number of eight times.
The number of students in 2006-2007 saw a slight decline of just over one per cent while the number of people working in the area has remained relatively stable since 2004-2005 with the composition reflecting the high proportion of small businesses in this area compared to those businesses with more than 50 staff.
26

ANNUAL REPORT 2006-2007
Key Performance Indicators
New Northbridge
2002 2003 2004 2005 2006 2007
Living in the area1 1,199 1,256 1,477 1,489 1,904 2,491
Studying in the area
Educational institutions 0 0 0 0 0 0
No of students2 0 0 0 0 0 325
Working in the area
Businesses < 50 staff3 115 112 116 97 97 98
Businesses > 50 staff3 1 1 1 3 3 2
Playing in the area
Visitors to public facilities4 N/A N/A N/A N/A N/A N/A
Key FindingAs in Claisebrook Cove, 2006 Census data, combined with new residential dwellings approved by EPRA, has enabled a more current reflection of the number of people living in New Northbridge and has seen considerable growth occur. 2006 Census data reflects an increase in the average number of residents per dwelling, from approximately 1.6 persons to approximately 2 persons.
Student numbers of 325 are derived from the Central Metropolitan College of TAFE’s School of Print and Technology (SPT), a high technology facility which EPRA successfully attracted to its project area. As the main campus of the Central Metropolitan College of TAFE is located outside the project area only the student numbers attributable to the new print facility are recorded. Although the Central Metropolitan College of TAFE’s School of Art and Design is located in the New Northbridge project area, as this was a pre existing facility its student numbers have not been included.
The number of small and large businesses has continued to remain stable since 2004-2005 with the ongoing rejuvenation of the area likely to result in the creation of more new businesses and therefore new employees in the future.
Calculations for visits to public facilities are not applicable for New Northbridge due to the difficulty of respondents separating frequency of visiting the project area from frequency of visiting the greater Northbridge area.
27
ANNUAL REPORT 2006-2007
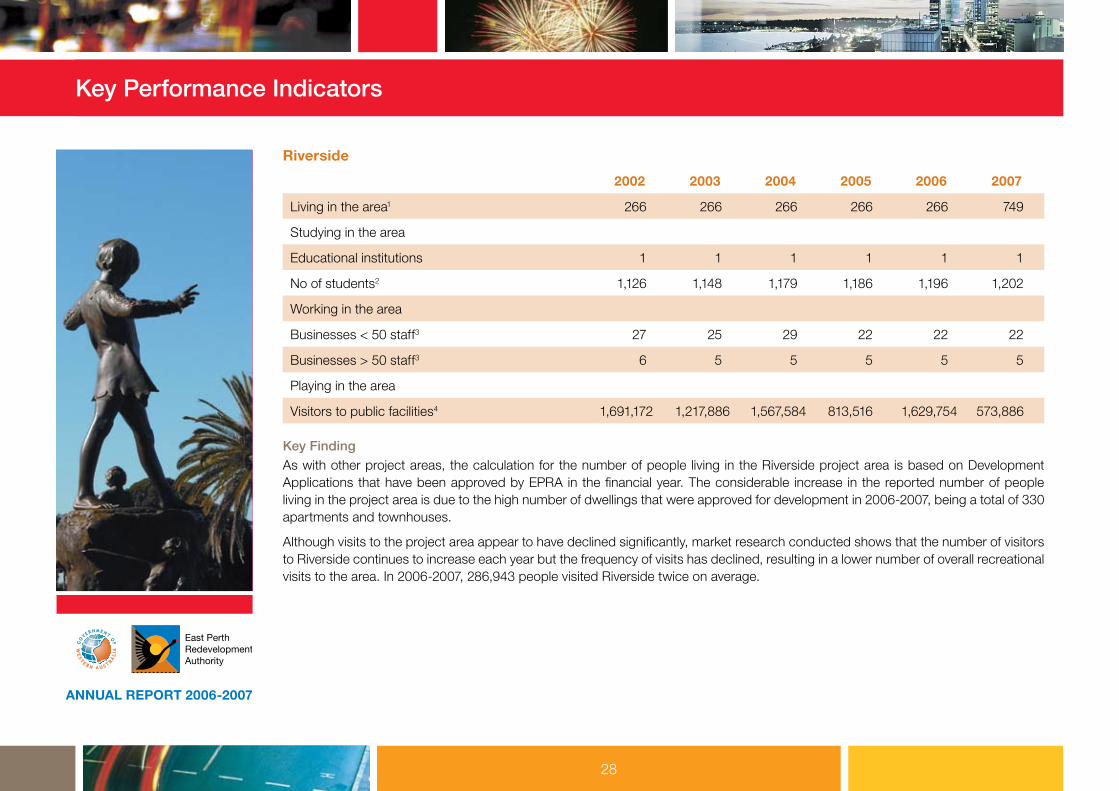
Riverside
2002 2003 2004 2005 2006 2007
Living in the area1 266 266 266 266 266 749
Studying in the area
Educational institutions 1 1 1 1 1 1
No of students2 1,126 1,148 1,179 1,186 1,196 1,202
Working in the area
Businesses < 50 staff3 27 25 29 22 22 22
Businesses > 50 staff3 6 5 5 5 5 5
Playing in the area
Visitors to public facilities4 1,691,172 1,217,886 1,567,584 813,516 1,629,754 573,886
Key FindingAs with other project areas, the calculation for the number of people living in the Riverside project area is based on Development Applications that have been approved by EPRA in the financial year. The considerable increase in the reported number of people living in the project area is due to the high number of dwellings that were approved for development in 2006-2007, being a total of 330 apartments and townhouses.
Although visits to the project area appear to have declined significantly, market research conducted shows that the number of visitors to Riverside continues to increase each year but the frequency of visits has declined, resulting in a lower number of overall recreational visits to the area. In 2006-2007, 286,943 people visited Riverside twice on average.
Key Performance Indicators
28

ANNUAL REPORT 2006-2007
NOTES ON METHOD
Living in the Area:1 The calculation for the additional increase in number of people
living in each of the project areas is based on development applications that have been approved by the Authority in the financial year. These figures therefore represent projected resident populations.
Results are derived by multiplying the total number of approved residential dwellings by the average number of residents per dwelling. The average number of residents per dwelling is:• 2.123 in Claisebrook Cove*• 1.999 in New Northbridge*• 1.462 in Riverside+
* (As indicated by 2006 ABS Census data).+ (As indicated by 2001 ABS Census data). Due to low
population numbers in the Riverside project area, the ABS was unable to provide 2006 Census data for the average number of residents per dwelling, at the time of reporting.
Prior to 2007, 2001 ABS Census data stated the average number of residents per household, was as follows:• 1.419 in Claisebrook Cove*• 1.623 in New Northbridge*
Studying in the Area:2 Institutions identified through 2005 Marketing Pro Database,
followed by a telephone census with educational institutions, conducted by Synovate. Includes full-time and part-time students.
Working in the Area:3 Number of businesses identified through 2005 Marketing
Pro Database, followed by a telephone census with large organisations, conducted by Synovate.
Playing in the Area:4 The visitation numbers represent the incidence of recreational
visits to parks, gardens, foreshore or other public open spaces but does not include paid entertainment such as restaurants, galleries or sporting venues. The Authority engaged Synovate to conduct a telephone survey of 307 adults (aged 18 years and over) in the Perth metropolitan area. ABS 2006 Census data estimates a population of 1,099,399 adults living in the Perth metropolitan area in 2006. Telephone numbers were randomly generated from Australia on Disc, which generates household numbers by street name in geographic areas. A sample of 307 provides results with a maximum sampling accuracy of ±5.59 per cent at the 95 per cent confidence level. Interviewing commenced on 20 June 2007 and was completed on 8 July 2007. Results reflect the estimated number of visitors and frequency of visits to the area.
Key Performance Indicators
29

ANNUAL REPORT 2006-2007
Key Performance Indicators
Efficiency IndicatorsThese relate inputs to outputs to quantify how well EPRA is using its resources and show dollar of operating costs per dollar of land sales made, and capital works conducted, during the year.
2001-02 2002-03 2003-04 2004-05 2005-06 2006-07 Target
$ per $ of:
Land sales 0.160 0.105 0.196 0.275 0.131 0.195 0.212
Capital works 0.166 0.191 0.252 0.271 0.233 0.678 0.437
Key Findings
Land SalesIn 2006-2007, for every dollar received from a land sale, it cost 19.5 cents in operating costs associated with the sales. As expected, overall revenues were lower in 2006-2007 due to the stage reached in several of the major projects, yet operating costs typically remain stable, therefore driving up the cost per dollar received.
The land sales indicator is favourable when compared to the target as a result of the increased sales revenue against budget. This is a reflection of the unprecedented market conditions prevailing with regards to inner city property prices, and results in a lower operating cost per land sale dollar received.
Capital WorksThere was a significant reduction in capital works during 2006-2007 which influenced the higher dollar per capital works indicator of 67.8 cents. The reduction in capital works is representative of the stages reached in several of the major projects, with projects such as Riverside and Northbridge Link only in the very early stages of planning, when the capital works costs are low. Again, when measured against a relatively stable operating cost base, this has the effect of driving up the cost per dollar incurred on capital works.
The capital works indicator was higher than the target as the amount spent on capital works during 2006-2007 was less than budget. This reflects the reforecast programme of acquisitions and capital works that materialised during the year, and resulted in a higher operating cost per dollar of capital works conducted.
30

ANNUAL REPORT 2006-2007
The accompanying financial statements of the East Perth Redevelopment Authority have been prepared in compliance with the provisions of the Financial Management Act 2006 from proper accounts and records to present fairly the financial transactions for the financial year ending 30 June 2007 and the financial position as at 30 June 2007.
At the date of signing we are not aware of any circumstances which would render any particulars included in the financial statements misleading or inaccurate.
Mr Stuart Hicks AO Mr Milan ChetkovichChairman of Accountable Authority Member of Accountable Authority
Mr Sean Henriques Mr Tony MorganChief Finance Officer Chief Executive Officer
Date: 6 August 2007
Certification of Financial Statements For the Year Ended 30 June 2007
Financial Statements
31

ANNUAL REPORT 2006-2007
2007 2006 Note $’000 $’000
INCOMESales 4 22,977 37,652Interest revenue 5 1,995 1,141Rental revenue 204 265Other revenue 650 567
Total Income 25,826 39,625
EXPENSESCost of sales 4 9,549 29,431Employee benefits expense 6 3,112 3,353Supplies and services 7 1,973 1,634Depreciation and amortisation expense 8 152 195Sales and marketing expenses 627 1,002Property and estate management 1,204 982Communications expense 382 726Economic and community development 318 267Development control expense 330 115Loss on disposal of non-current assets 9 43Other expenses 275 537
Total expenses 17,931 38,285
SURPLUS/(DEFICIT) for the period 7,895 1,340
The Income Statement should be read in conjunction with the accompanying notes.
Income Statement For the Year Ended 30 June 2007
32

ANNUAL REPORT 2006-2007
2007 2006 Note $’000 $’000
ASSETSCurrent AssetsCash and cash equivalents 9 42,632 35,445Inventories 10 2,389 4,842Receivables 11 344 285Other current assets 12 13 84
Total Current Assets 45,378 40,656
Non-Current AssetsInventories 10 39,208 36,099Property, furniture and equipment 13 4,744 3,873Intangible assets 14 33 65
Total Non-Current Assets 43,985 40,037
TOTAL ASSETS 89,363 80,693
Balance Sheet As At 30 June 2007
33

ANNUAL REPORT 2006-2007
2007 2006 Note $’000 $’000
LIABILITIESCurrent LiabilitiesPayables 16 945 1,002Income in advance 17 55 38Provisions 18 393 329Other current liabilities 19 105 430
Total Current Liabilities 1,498 1,799
Non-Current LiabilitiesProvisions 18 599 488Other non-current liabilities 19 28 28
Total Non-Current Liabilities 627 516
TOTAL LIABILITIES 2,125 2,315
NET ASSETS 87,238 78,378
EQUITY 20Contributed equity 3,020 3,020Capital reserve 10,338 10,338Asset revaluation reserve 1,694 729Retained earnings 72,186 64,291
TOTAL EQUITY 87,238 78,378
The Balance Sheet should be read in conjunction with the accompanying notes.
Balance Sheet As At 30 June 2007
34
ANNUAL REPORT 2006-2007
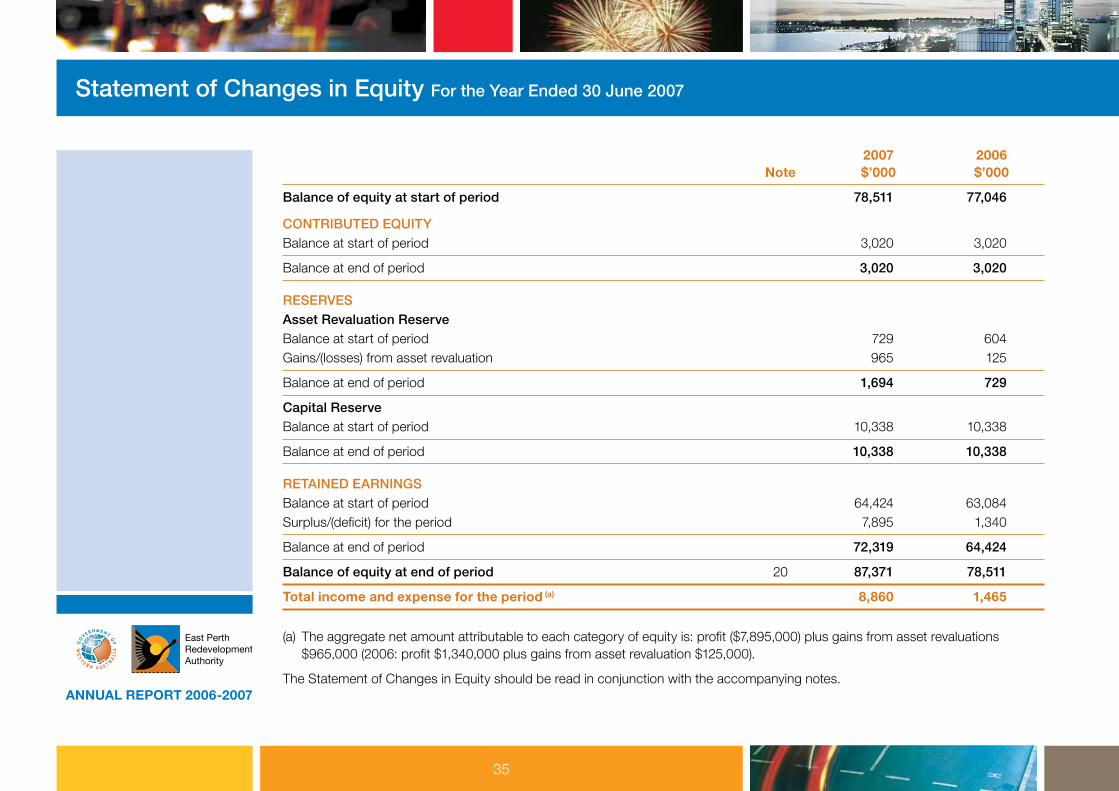
2007 2006 Note $’000 $’000
Balance of equity at start of period 78,511 77,046
CONTRIBUTED EQUITYBalance at start of period 3,020 3,020
Balance at end of period 3,020 3,020
RESERVESAsset Revaluation ReserveBalance at start of period 729 604Gains/(losses) from asset revaluation 965 125
Balance at end of period 1,694 729
Capital ReserveBalance at start of period 10,338 10,338
Balance at end of period 10,338 10,338
RETAINED EARNINGSBalance at start of period 64,424 63,084Surplus/(deficit) for the period 7,895 1,340
Balance at end of period 72,319 64,424
Balance of equity at end of period 20 87,371 78,511
Total income and expense for the period (a) 8,860 1,465
(a) The aggregate net amount attributable to each category of equity is: profit ($7,895,000) plus gains from asset revaluations $965,000 (2006: profit $1,340,000 plus gains from asset revaluation $125,000).
The Statement of Changes in Equity should be read in conjunction with the accompanying notes.
Statement of Changes in Equity For the Year Ended 30 June 2007
35

ANNUAL REPORT 2006-2007
2007 2006 Note $’000 $’000
CASH FLOWS FROM OPERATING ACTIVITIESReceiptsSale of goods and services 23,849 38,674Interest received 1,970 1,289GST receipts on sales 1,566 1,124GST receipts from taxation authority 107 1,385
PaymentsEmployee benefits (2,937) (2,985)Supplies and services (2,317) (690)GST payments on purchases (335) (2,509)GST payments to taxation authority (1,338) –Other payments (3,137) (3,629)
Net cash provided by/(used in) operating activities 17,427 32,659
CASH FLOWS FROM INVESTING ACTIVITIESPurchase of non-current physical assets (28) (3,577)Purchase of capital works in progress (5,183) (16,803)Purchase of land (5,022) (516)Purchase of intangible assets (8) (51)
Net cash provided by/(used in) investing activities (10,240) (20,947)
Net increase/(decrease) in cash and cash equivalents 7,187 11,712
Cash and cash equivalents at the beginning of period 35,445 23,733
CASH AND CASH EQUIVALENT ASSETS AT THE END OF PERIOD 9 42,632 35,445
The Cash Flow Statement should be read in conjunction with the accompanying notes.
Cash Flow Statement For the Year Ended 30 June 2007
36
ANNUAL REPORT 2006-2007
1. Australian equivalents to International Financial Reporting Standards
General
The Authority’s financial statements for the year ended 30 June 2007 have been prepared in accordance with Australian equivalents to International Financial Reporting Standards (AIFRS), which comprise a Framework for the Preparation and Presentation of Financial Statements (the Framework) and Australian Accounting Standards (including the Australian Accounting Interpretations).
In preparing these financial statements the Authority has adopted, where relevant to its operations, new and revised Standards and Interpretations from their operative dates as issued by the AASB and formerly the Urgent Issues Group (UIG).
Early adoption of standardsThe Authority cannot early adopt an Australian Accounting Standard or Interpretation unless specifically permitted by TI 1101 ‘Application of Australian Accounting Standards and Other Pronouncements’. No Standards and Interpretations that have been issued or amended but are not yet effective have been early adopted by the Authority for the annual reporting period ended 30 June 2007.
2. Summary of significant accounting policies
(a) General StatementThe financial statements constitute a general purpose financial report which has been prepared in accordance with the Australian Accounting Standards, the Framework, Statements of Accounting Concepts and other authoritative pronouncements of the Australian Accounting Standards Board as applied by the Treasurer’s instructions. Several of these are modified by the
Treasurer’s instructions to vary application, disclosure, format and wording.
The Financial Management Act and the Treasurer’s instructions are legislative provisions governing the preparation of financial statements and take precedence over the Accounting Standards, the Framework, Statements of Accounting Concepts and other authoritative pronouncements of the Australian Accounting Standards Board.
Where modification is required and has a material or significant financial effect upon the reported results, details of that modification and the resulting financial effect are disclosed in the notes to the financial statements.
(b) Basis of PreparationThe financial statements have been prepared on the accrual basis of accounting using the historical cost convention, modified by the revaluation of land, buildings and infrastructure which have been measured at fair value.
The accounting policies adopted in the preparation of the financial statements have been consistently applied throughout all periods presented unless otherwise stated.
The financial report is presented in Australian dollars and all values are rounded to the nearest thousand dollars ($’000).
(c) Reporting EntityThe reporting entity comprises the Authority. The Authority has no related bodies.
(d) IncomeRevenue RecognitionRevenue is measured at the fair value of consideration received or receivable. Revenue is recognised for the major business activities as follows:
Notes to the Financial Statements For the Year Ended 30 June 2007
37
ANNUAL REPORT 2006-2007
• Sale of LandIt is the Authority’s practice to recognise the sale of land held for sale only when settlement of the full purchase consideration has been received and the transfer of land has been completed.
• Sale of goods (other than land)Revenue from the disposal of other assets is recognised when the Authority has passed control of the asset.
• Provision of services or goodsRevenue is recognised on delivery of the services or goods to the customer.
• Contribution RevenueNon-reciprocal contributions are recognised as revenue upon receipt by the Authority. Reciprocal contributions are recognised as revenue once the conditions limiting the contributions are discharged.
• InterestRevenue is recognised as the interest accrues.
• Rental RevenueThe Authority receives rental income in relation to certain buildings leased within the redevelopment area. Rental income is due on the first day of each month and all amounts are settled within seven days. Revenues are recognised for rental income when it becomes due and payable to the Authority.
• GainsGains may be realised or unrealised and are usually recognised on a net basis. These include gains arising on the disposal of non-current assets and some revaluations of non-current assets.
(e) Property, Furniture and EquipmentCapitalisation/Expensing of assets:Items of property, property and equipment costing over $5,000 are recognised as assets and the cost of utilising assets are depreciated over their estimated useful lives. Items of property, furniture and equipment costing less than $5,000 are expensed directly to the Income Statement.
Initial recognition and measurement:All items of property, furniture and equipment are initially recognised at cost.
For items of property, furniture and equipment acquired at no cost or for nominal cost, cost is their fair value at the date of acquisition.
Subsequent measurement:After recognition as an asset, the Authority uses the revaluation model for the measurement of land and buildings and the cost model for all other property, furniture and equipment. Land and buildings are carried at fair value less accumulated depreciation on buildings and accumulated impairment losses. All other items of property, furniture and equipment are carried at cost less accumulated depreciation and accumulated impairment losses.
Where market evidence is available, the fair value of land and buildings is determined on the basis of current market buying values determined by reference to recent market transactions. When buildings are revalued by reference to recent market transactions, the accumulated depreciation is eliminated against the gross carrying amount of the asset and the net amount restated to the revalued amount.
Where market evidence is not available, the fair value of land and buildings is determined on the basis of existing use.
Notes to the Financial Statements For the Year Ended 30 June 2007
38

ANNUAL REPORT 2006-2007
This normally applies where buildings are specialised or where land use is restricted. Fair value for existing use assets is determined by reference to the cost of replacing the remaining future economic benefits embodied in the asset, i.e. the written-down current replacement cost. Where the fair value of buildings is dependent on using the depreciated replacement cost, the gross carrying amount and the accumulated depreciation are restated proportionately.
The revaluation of land and buildings is an independent valuation provided on a three year basis (or earlier when required) by the Landgate (Valuation Services).
The most significant assumptions in estimating fair value are made in assessing whether to apply the existing use basis to assets. Professional judgment by the valuer is required where the evidence does not provide a clear distinction between market type assets and existing use assets.
Refer to note 13 ‘Property, furniture and equipment’ for further information on revaluations.
Depreciation:All non-current assets having a limited useful life are systematically depreciated over their estimated useful lives in a manner that reflects the consumption of their future economic benefits.
Land is not depreciated. Depreciation on other assets is calculated using the straight line method, using rates which are reviewed annually. Estimated useful lives for each class of depreciable asset are:
Buildings 40 YearsOffice Furniture and Equipment 7-8 YearsComputer Equipment 4 Years
(f) Intangible AssetsCapitalisation/Expensing of assets:Acquisitions of intangible assets costing over $5,000 are capitalised. The cost of utilising the assets is expensed (amortised) over their useful life. Costs incurred of less than $5,000 are immediately expensed directly to the Income Statement.
All acquired and internally developed intangible assets are initially measured at cost. For assets acquired at no cost or for nominal cost, cost is their fair value at the date of acquisition.
The cost model is applied for subsequent measurement requiring the asset to be carried at cost less any accumulated amortisation and accumulated impairment losses.
The carrying value of intangible assets is reviewed for impairment annually when the asset is not yet in use, or more frequently when an indicator of impairment arises during the reporting year indicating that the carrying value may not be recoverable.
Amortisation for intangible assets with finite useful lives is calculated for the period of the expected benefit (estimated useful life) on the straight line basis using rates which are reviewed annually. All intangible assets controlled by the Authority have a finite useful life and zero residual value. The expected useful lives for each class of intangible asset are:
Software(a) 3 Years
(a) Software that is not integral to the operation of any related hardware.
Notes to the Financial Statements For the Year Ended 30 June 2007
39
ANNUAL REPORT 2006-2007
Computer SoftwareSoftware that is an integral part of the related hardware is treated as property, plant and equipment. Software that is not an integral part of the related hardware is treated as an intangible asset. Software costing less than $5,000 is expensed in the year of acquisition.
(g) Impairment of AssetsProperty, furniture, equipment and intangible assets are tested for any indication of impairment at each reporting date. Where there is an indication of impairment, the recoverable amount is estimated. Where the recoverable amount is less than the carrying amount, the asset is considered impaired and is written down to the recoverable amount and an impairment loss is recognised. As the Authority is a not-for-profit entity, unless an asset has been identified as a surplus asset, the recoverable amount is the higher of an asset’s fair value less costs to sell and depreciated replacement cost.
The risk of impairment is generally limited to circumstances where an asset’s depreciation is materially understated or where the replacement cost is falling. Each relevant class of assets is reviewed annually to verify that the accumulated depreciation/amortisation reflects the level of consumption or expiration of asset’s future economic benefits and to evaluate any impairment risk from falling replacement costs.
The recoverable amount of assets identified as surplus assets is the higher of fair value less costs to sell and the present value of future cash flows expected to be derived from the asset. Surplus assets carried at fair value have no risk of material impairment where fair value is determined by reference to market evidence. Where fair value is determined by reference to depreciated replacement cost, surplus assets are at risk of impairment and the recoverable amount is measured.
Surplus assets at cost are tested for indications of impairment at each reporting date.
See note 15 ‘Impairment of assets’ for the outcome of impairment reviews and testing.
(h) LeasesThe Authority holds operating leases for motor vehicles where the lessor effectively retains all of the risks and benefits incident to ownership of the motor vehicles held under the operating leases. Equal instalments of the lease payments are charged to the Statement of Financial Performance over the lease term as this is representative of the pattern of benefits to be derived from the leased motor vehicles.
(i) Financial InstrumentsThe Authority has two categories of financial instrument:• Loans and receivables (includes cash and cash equivalents,
receivables, term deposits);• Non-trading financial liabilities (payables)
Initial recognition and measurement is at fair value. The transaction cost or face value is equivalent to the fair value. Subsequent measurement is at amortised cost using the effective interest method.
The fair value of short-term receivables and payables is the transaction cost or the face value because there is no interest rate applicable and subsequent measurement is not required as the effect of discounting is not material.
(j) Cash and Cash EquivalentsFor the purpose of the Cash Flow Statement, cash and cash equivalents includes restricted cash and cash equivalents.
Notes to the Financial Statements For the Year Ended 30 June 2007
40

ANNUAL REPORT 2006-2007
These include cash on hand and short-term deposits with original maturities of three months or less that are readily convertible to a known amount of cash and which are subject to insignificant risk of changes in value.
(k) InventoriesInventories are valued at the lower of cost and net realisable value. Inventories consist of developed land, capital works and undeveloped land. See note 10 ‘Inventories’
(l) ReceivablesReceivables are recognised and carried at original invoice amount less an allowance for any uncollectible amounts. The collectability of receivables is reviewed on an ongoing basis and any receivables identified as uncollectible are written-off. The allowance for uncollectible amounts (doubtful debts) is raised when there is objective evidence that the Authority will not be able to collect its debts. The carrying amount is equivalent to fair value as it is due for settlement within 30 days. See note 2(i) ‘Financial Instruments’ and note 11 ‘Receivables’.
(m) PayablesPayables are recognised when the Authority becomes obliged to make future payments as a result of a purchase of assets or services at the amounts payable. The carrying amount is equivalent to fair value, as they are generally settled within 30 days. See note 2(i) ‘Financial Instruments and note 16 ‘Payables’.
(n) ProvisionsProvisions are liabilities of uncertain timing and amount. The Authority only recognises a provision where there is a present legal, equitable or constructive obligation as a result of a past event and when the outflow of economic benefits is
probable and can be measured reliably. Provisions are reviewed at each balance sheet date and adjusted to reflect the current best estimate. See note 18 ‘Provisions’.
(n)(i) Provisions – Employee Benefits
Annual Leave and Long Service Leave
The liability for annual and long service leave expected to be settled within 12 months after the end of the reporting date is recognised and measured at the undiscounted amounts expected to be paid when the liabilities are settled. Annual and long service leave expected to be settled more than 12 months after the end of the reporting date is measured at the present value of amounts expected to be paid when the liabilities are settled. Leave liabilities are in respect of services provided by employees up to the reporting date.
When assessing expected future payments, consideration is given to expected future wage and salary levels including non-salary components such as employer superannuation contributions. In addition, the long service leave liability also considers the experience of employee departures and periods of service.
The expected future payments are discounted to present value using market yields at the reporting date on national government bonds with terms to maturity that match, as closely as possible, the estimated future cash outflows.
All annual leave and unconditional long service leave provisions are classified as current liabilities as the Authority does not have an unconditional right to defer settlement of the liability for at least 12 months after the reporting date.
PriceWaterhouseCoopers performed an actuarial assessment of long service leave for the year ended 30 June 2007.
Notes to the Financial Statements For the Year Ended 30 June 2007
41

ANNUAL REPORT 2006-2007
SuperannuationThe Government Employees Superannuation Board (GESB) administers the following superannuation schemes.
Employees may contribute the Gold State Superannuation Scheme (GSS), a defined benefit lump sum scheme also closed to new members. Employees who are not members of either of this scheme become non-contributory members of the West State Superannuation Scheme (WSS), an accumulation fund. The Authority contributes to this accumulation fund in compliance with the Commonwealth Government’s Superannuation Guarantee (Administration) Act 1992.
The Pension Scheme and the pre-transfer benefit for employees who transferred to the GSS Scheme are defined benefit schemes. These benefits are wholly unfunded and the liabilities for future payments are provided for at reporting date. The liabilities under these schemes have been calculated separately for each scheme annually by Mercers Human Resource Consulting Actuaries using the projected unit credit method.
The expected future payments are discounted to present value using market yields at the reporting date on national government bonds with terms to maturity that match, as closely as possible, the estimated future cash outflows.
The GSS Scheme and the WSS Scheme, where the current service superannuation charge is paid by the Authority to the GESB, are defined contribution schemes. The liabilities for current service superannuation charges under the GSS Scheme and WSS Scheme are extinguished by the concurrent payment of employer contributions to the GESB.
The Gold State Superannuation Scheme is a defined benefit scheme for the purposes of employees and whole-of-government reporting.
However, from an agency perspective, apart from the transfer benefits, it is a defined contribution plan under AASB 119.
See also note 2(o) ‘Superannuation expense’.
(n)(ii) Provisions – Other
Employment On CostsEmployment on-costs, including workers’ compensation insurance and payroll tax, are not employee benefits and are recognised separately as liabilities and expenses when the employment to which they relate has occurred. Employment on-costs are not included as part of the Authority’s ‘Employee benefits expense’ and the related liability is included in Employment on-costs provision. See ‘Other expenses’ and note 18 ‘Provisions’.
(o) Superannuation ExpenseThe superannuation expense of the defined benefit plans is made up of the following elements:• Current service cost;• Interest cost (unwinding of the discount);• Actuarial gains and losses; and• Past service cost.
Actuarial gains and losses of the defined benefit plans are recognised immediately as income or expense in the income statement.
The superannuation expense of the defined contribution plans is recognised as and when the contributions fall due.
See also note 2(n)(i) ‘Provisions – Employee Benefits’ under Superannuation.
Notes to the Financial Statements For the Year Ended 30 June 2007
42
ANNUAL REPORT 2006-2007
(p) Accrued SalariesAccrued salaries (refer note 19 ‘Other liabilities’) represent the amount due to staff but unpaid at the end of the financial year, as the end of the last pay period for that financial year does not coincide with the end of the financial year. Accrued salaries are settled within a few days of the financial year end. The Authority considers the carrying amount of accrued salaries to be equivalent to the net fair value.
(q) Comparative FiguresComparative figures are, where appropriate, reclassified to be comparable with the figures presented in the current financial year.
3. Disclosure of changes in accounting policy
(a) Voluntary changes in Accounting PolicyIn accordance with Treasurer’s Instruction 410 “Records of Assets”, the Authority has increased its threshold for the capitalisation of property, furniture and equipment items from $1000 to $5000. This constitutes a change in accounting policy.
The effect of this change in policy has been reflected in the financial statements as follows:
Prior year expenses have been increased by $132,847 being the written down value at 30 June 2006 of assets having an original cost of between $5000 and $1,001. This increase has been reflected in the closing balance of retained profits for 2005-06.
Current year expenses have increased by $8,610 being the value of assets acquired during the 2007 financial year with an original cost of between $5000 and $1001.
(b) Future impact of Australian Accounting Standards not yet operative
The Authority cannot early adopt an Australian Accounting Standard or Australian Accounting Interpretation unless specifically permitted by TI 1101 ‘Application of Australian Accounting Standards and Other Pronouncements’. Consequently, the Authority has not applied the following Australian Accounting Standards and Australian Accounting Interpretations that have been issued but are not yet effective.
These will be applied from their application date:1. AASB 7 ‘Financial Instruments: Disclosures’ (including consequential amendments in AASB 2005-10 ‘Amendments to Australian Accounting Standards [AASB 132, AASB 101, AASB 114, AASB 117, AASB 133, AASB 139, AASB 1, AASB 4, AASB 1023 & AASB 1038]’). This Standard requires new disclosures in relation to financial instruments. The Standard is considered to result in increased disclosures, both quantitative and qualitative of the Authority’s exposure to risks, enhanced disclosure regarding components of the Authority’s financial position and performance, and possible changes to the way of presenting certain items in the financial statements. The Authority does not expect any financial impact when the Standard is first applied. The Standard is required to be applied to annual reporting periods beginning on or after 1 January 2007.
2. AASB 2005-10 ‘Amendments to Australian Accounting Standards (AASB 132, AASB 101, AASB 114, AASB 117, AASB 133, AASB 139, AASB 1, AASB 4, AASB 1023, & AASB 1038)’. The amendments are as a result of the issue of AASB 7 ‘Financial Instruments: Disclosures’, which amends the financial instrument disclosure requirements in these standards. The Authority does not expect any financial impact when the Standard is first applied. The Standard is required to be applied to annual reporting periods beginning on or after 1 January 2007.
Notes to the Financial Statements For the Year Ended 30 June 2007
43

ANNUAL REPORT 2006-2007
3. AASB 101 ‘Presentation of Financial Statements’. This Standard was revised and issued in October 2006 so that AASB 101 has the same requirements as IAS 1 ‘Presentation of Financial Statements’ (as issued by the IASB) in respect of for-profit entities. The Authority is a not-for-profit entity and consequently does not expect any financial impact when the Standard is first applied. The Standard is required to be applied to annual reporting periods beginning on or after 1 January 2007.
4. AASB 2007-4 ‘Amendments to Australian Accounting Standards arising from ED 151 and Other Amendments (AASB 1, 2, 3, 4, 5, 6, 7, 102, 107, 108, 110, 112, 114, 116, 117, 118, 119, 120, 121, 127, 128, 129, 130, 131, 132, 133, 134, 136, 137, 138, 139, 141, 1023 & 1038)’. This Standard introduces policy options and modifies disclosures. These amendments arise as a result of the AASB decision that, in principle, all options that currently exist under IFRSs should be included in the Australian equivalents to IFRSs and additional Australian disclosures should be eliminated, other than those now considered particularly relevant in the Australian reporting environment. The Department of Treasury and Finance has indicated that it will mandate to remove the policy options added by this amending Standard. This will result in no impact as a consequence of application of the Standard. The Standard is required to be applied to annual reporting periods beginning on or after 1 July 2007.
5. AASB Interpretation 4 ‘Determining whether an Arrangement Contains a Lease [revised]’. This Interpretation was revised and issued in February 2007 to specify that if a public-to-private service concession arrangement meets the scope requirements of AASB Interpretation 12 ‘Service Concession Arrangements’ as issued in February 2007, it would not be within the scope of Interpretation 4. At balance sheet date, the Authority has not
entered into any arrangements as specified in the Interpretation or within the scope of Interpretation 12, resulting in no impact when the Interpretation is first applied. The Interpretation is required to be applied to annual reporting periods beginning on or after 1 January 2008.
6. AASB Interpretation 12 ‘Service Concession Arrangements’. This Interpretation was issued in February 2007 and gives guidance on the accounting by operators (usually a private sector entity) for public-to-private service concession arrangements. It does not address the accounting by grantors (usually a public sector entity). It is currently unclear as to the application of the Interpretation to the Authority if and when public-to-private service concession arrangements are entered into in the future. At balance sheet date, the Authority has not entered into any public-to-private service concession arrangements resulting in no impact when the Interpretation is first applied. The Interpretation is required to be applied to annual reporting periods.
7. AASB Interpretation 129 ‘Service Concession Arrangements: Disclosures [revised]’. This Interpretation was revised and issued in February 2007 to be consistent with the requirements in AASB Interpretation 12 ‘Service Concession Arrangements’ as issued in February 2007. Specific disclosures about service concession arrangements entered into are required in the notes accompanying the financial statements, whether as a grantor or an operator. At balance sheet date, the Authority has not entered into any public-to-private service concession arrangements resulting in no impact when the Interpretation is first applied. The Interpretation is required to be applied to annual reporting periods beginning on or after 1 January 2008.
Notes to the Financial Statements For the Year Ended 30 June 2007
44
ANNUAL REPORT 2006-2007
The following Australian Accounting Standards and Interpretations are not applicable to the Authority as they will have no impact or do not apply to not-for-profit entities:
AASB Standards and Interpretations
AASB 8 ‘Operating Segments’AASB 1049 ’Financial Reporting of General Government Sectors by Governments’AASB 2007-1 ‘Amendments to Australian Accounting Standards arising from AASB Interpretation 11 [AASB 2]’AASB 2007-2 ’Amendments to Australian Accounting Standards arising from AASB Interpretation 12 [AASB 1, AASB 117,
AASB 118, AASB 120, AASB 121, AASB 127, AASB 131 & AASB 139]’ – paragraphs 1 to 8AASB 2007-3 Amendments to Australian Accounting Standards arising from AASB 8 [AASB 5, AASB 6, AASB 102, AASB
107, AASB 119, AASB 127, AASB 134, AASB 136, AASB 1023 & AASB 1038]’Interpretation 10 ’Financial Reporting and Impairment’Interpretation 11 ’AASB 2 – Group and Treasury Share Transactions’
Notes to the Financial Statements For the Year Ended 30 June 2007
45

ANNUAL REPORT 2006-2007
2007 2006 $’000 $’000
4. Trading profitSales 22,977 37,652Cost of Sales:Opening inventory (40,941) (52,599)Purchases (9,622) (17,773)
(50,563) (70,372)Closing inventory 41,597 40,941
Cost of Goods Sold (8,966) (29,431)
Trading Profit 14,011 8,221
See note 2(k) ‘Inventories’ and note 10 ‘Inventories’
5. Interest revenueInterest Revenue 1,995 1,141
1,995 1,141
Interest Revenue includes interest earned on cash held at the bank, at call, short term deposit accounts and at Treasury.
6. Employee benefits expenseWages and salaries 2,694 2,533Superannuation – defined contribution plans 248 351Superannuation – defined benefit plans (see note 18) 108 345Long Service Leave (81) (2)Annual Leave 5 9Other related expenses 138 117
3,112 3,353
Notes to the Financial Statements For the Year Ended 30 June 2007
46

ANNUAL REPORT 2006-2007
2007 2006 $’000 $’000
7. Supplies and ServicesConsultants and contractors 538 444Building occupancy 129 164General Office Expenses 591 619Other Supplies and Services 715 407
1,973 1,634
8. Depreciation and amortisation expense
DepreciationBuildings 65 60Office furniture and equipment 21 33Computer Equipment 34 73
Total depreciation 120 166
AmortisationIntangible assets 32 29
Total amortisation 32 29
Total depreciation and amortisation 152 195
Notes to the Financial Statements For the Year Ended 30 June 2007
47

ANNUAL REPORT 2006-2007
2007 2006 $’000 $’000
9. Cash and cash equivalentsBank account 11,830 3,954Short term deposits/at call funds 30,801 31,490Cash on hand 1 1
42,632 35,445
The term deposits mature on a monthly or a three monthly basis and are bearing fixed interest rates between 5.79% and 6.16% (2006: 5.25% and 5.49%) and the at call funds are bearing floating interest rates between 5.12% and 6.42% (2006: 5.30% and 5.64%)
10. InventoriesThe aggregate carrying amount of inventories recognised and included in the financial statements is as follows:Current 2,389 4,842Non-current 39,208 36,099
41,597 40,941
CurrentDeveloped Land (at cost) 2,389 4,842
2,389 4,842
The following represents the transfers to and from developed land inventories:Balance at 1 July (at cost) 4,842 16,354Transferred from undeveloped land (excluding lots repurchased) 2,885 3,628Transferred from capital works in progress 4,020 13,795Transferred to cost of sales (9,549) (29,431)Lots repurchased 191 496
Balance at 30 June (at cost) 2,389 4,842
Notes to the Financial Statements For the Year Ended 30 June 2007
48

ANNUAL REPORT 2006-2007
2007 2006 $’000 $’000
10. Inventories (continued)Non-CurrentCapital Works (at cost) 28,840 27,677Undeveloped Land (at cost) 10,368 8,422
39,208 36,099
The following represents capital works undertaken, offset by components transferred to developed land inventories.
Balance at 1 July 27,677 24,669Additional works 5,183 16,803Less transfers to developed land (4,020) (13,795)
Balance at 30 June (at cost) 28,840 27,677
The following represents acquisitions of undeveloped land, offset by transfers to developed land inventories:
Balance at 1 July 8,422 11,576Cost of land acquired commercially 5,021 20Less transfers to developed land (3,076) (3,628)Add transfers from Property, Furniture and Equipment – 453
Balance at 30 June (at cost) 10,368 8,422
Included in inventories, Undeveloped Land, is land leased to external parties, pending redevelopment. The gross amount of leased land at 30 June 2007 is $1,403,699 (2006: $2,128,000).
Inventories are recorded at the lower of cost and net realisable value. An internal valuation of Developed Land at market value and Capital Works in Progress and Undeveloped Land at current use value as at 30 June 2007 amounted to $47,707,860 (net realisable value) (2006: $43,048,272). The cost of the inventories amounted to $41,596,962 (2006: $40,940,559). The internal valuations have been determined taking into account advice from external valuers, and both internal and external property advisors.
Notes to the Financial Statements For the Year Ended 30 June 2007
49

ANNUAL REPORT 2006-2007
2007 2006 $’000 $’000
11. ReceivablesAccounts receivable 89 56Accrued Revenue 255 229
344 285
12. Other Current AssetsPrepayments 13 4Refundable Deposits – 80
13 84
13. Property, furniture and equipment
Land12 Lindsay Street at fair value (a) 1,500 1,060
1,500 1,060
Buildings12 Lindsay Street at fair value (a) 3,050 2,590Accumulated depreciation – –
3,050 2,590
4,550 3,650
Office furniture and equipmentAt cost 430 567Accumulated depreciation (315) (431)
115 136
Notes to the Financial Statements For the Year Ended 30 June 2007
50
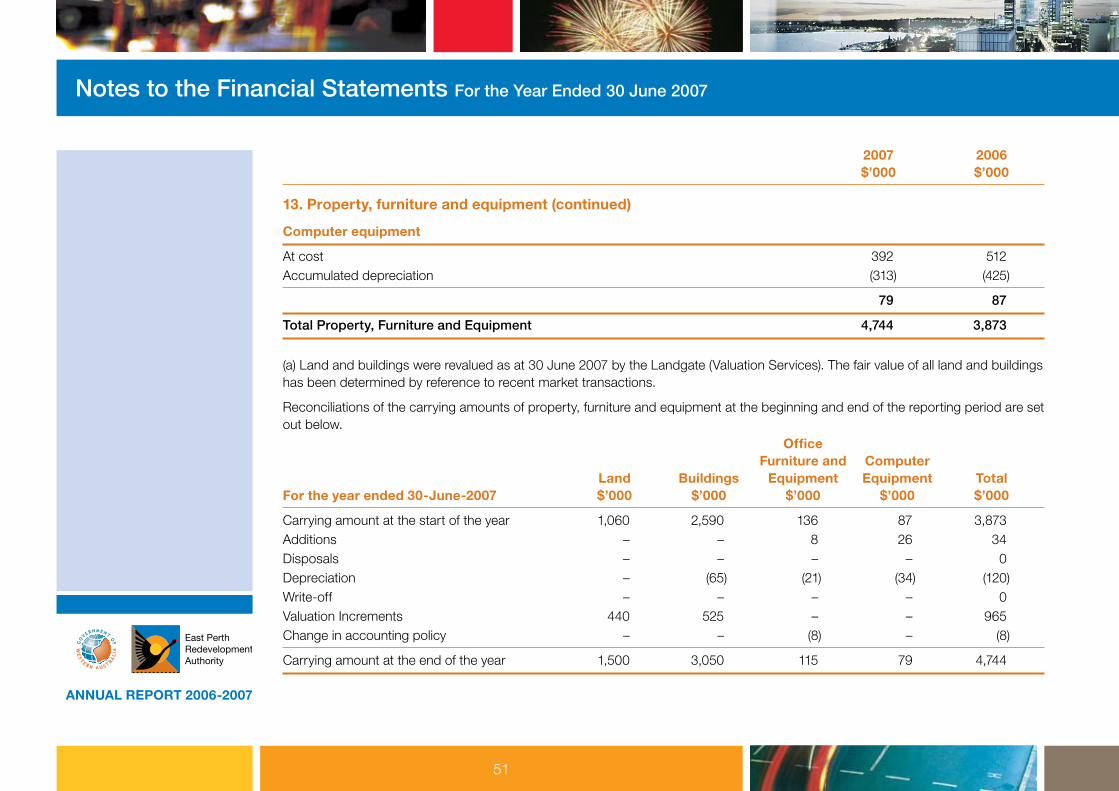
ANNUAL REPORT 2006-2007
2007 2006 $’000 $’000
13. Property, furniture and equipment (continued)
Computer equipment
At cost 392 512Accumulated depreciation (313) (425)
79 87
Total Property, Furniture and Equipment 4,744 3,873
(a) Land and buildings were revalued as at 30 June 2007 by the Landgate (Valuation Services). The fair value of all land and buildings has been determined by reference to recent market transactions.
Reconciliations of the carrying amounts of property, furniture and equipment at the beginning and end of the reporting period are set out below. Office Furniture and Computer Land Buildings Equipment Equipment Total For the year ended 30-June-2007 $’000 $’000 $’000 $’000 $’000
Carrying amount at the start of the year 1,060 2,590 136 87 3,873Additions – – 8 26 34Disposals – – – – 0Depreciation – (65) (21) (34) (120)Write-off – – – – 0Valuation Increments 440 525 – – 965Change in accounting policy – – (8) – (8)
Carrying amount at the end of the year 1,500 3,050 115 79 4,744
Notes to the Financial Statements For the Year Ended 30 June 2007
51

ANNUAL REPORT 2006-2007
13. Property, furniture and equipment (continued) Office Furniture and Computer Land Buildings Equipment Equipment Total For the year ended 30-June-2006 $’000 $’000 $’000 $’000 $’000
Carrying amount at the start of the year 640 100 75 146 961Additions – – 187 100 287Disposals – – – – 0Transfers to/(from) Inventories (453) 3,298 – – 2,845Depreciation – (60) (33) (73) (166)Write-off – – (45) (2) (47)Transfers to Intangible Assets – – – (5) (5)Valuation Increments 873 – – – 873Valuation Decrements – (748) – – (748)Change in accounting policy – – (48) (79) (127)
Carrying amount at the end of the year 1,060 2,590 136 87 3,873
Notes to the Financial Statements For the Year Ended 30 June 2007
52
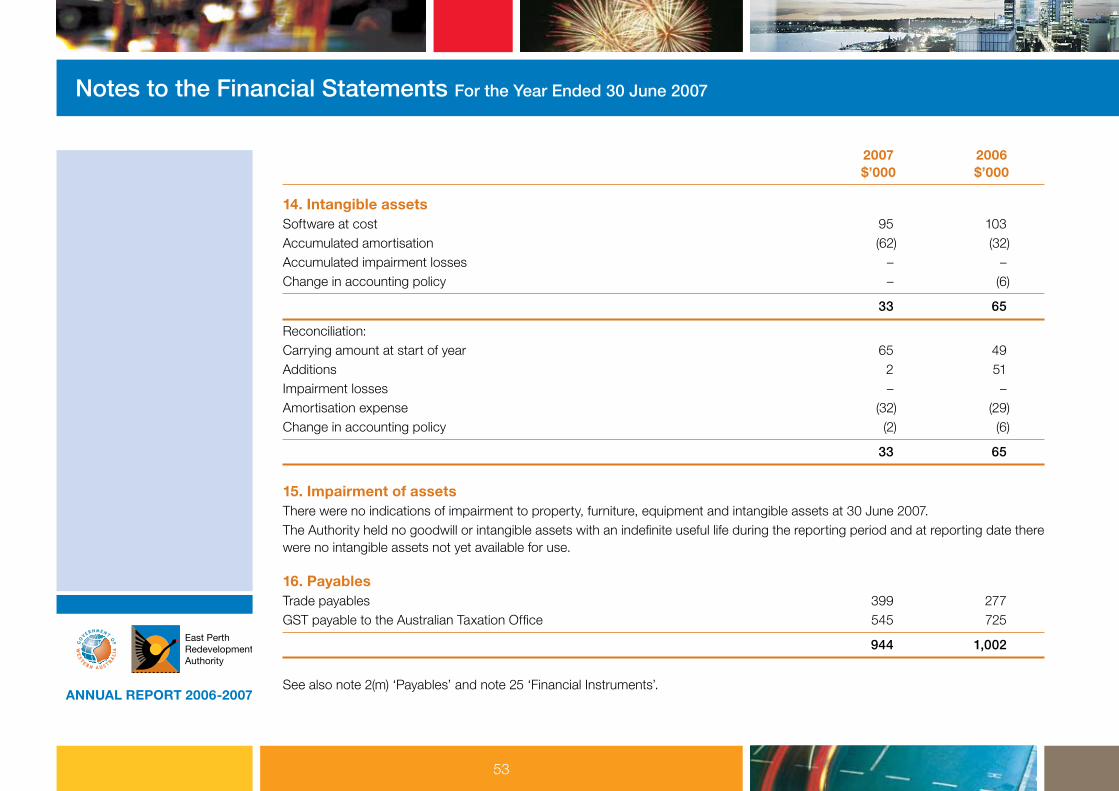
ANNUAL REPORT 2006-2007
2007 2006 $’000 $’000
14. Intangible assetsSoftware at cost 95 103Accumulated amortisation (62) (32)Accumulated impairment losses – –Change in accounting policy – (6)
33 65
Reconciliation:Carrying amount at start of year 65 49Additions 2 51Impairment losses – –Amortisation expense (32) (29)Change in accounting policy (2) (6)
33 65
15. Impairment of assetsThere were no indications of impairment to property, furniture, equipment and intangible assets at 30 June 2007.The Authority held no goodwill or intangible assets with an indefinite useful life during the reporting period and at reporting date there were no intangible assets not yet available for use.
16. PayablesTrade payables 399 277GST payable to the Australian Taxation Office 545 725
944 1,002
See also note 2(m) ‘Payables’ and note 25 ‘Financial Instruments’.
Notes to the Financial Statements For the Year Ended 30 June 2007
53

ANNUAL REPORT 2006-2007
2007 2006 $’000 $’000
17. Income in advanceSubiaco Redevelopment Authority – Corporate Service Fee 39 37Rental Revenue 16 1
55 38
18. Provisions
CurrentEmployee benefits provision:Annual leave (a) 201 162Long service leave (b) 149 123Superannuation 26 24
376 309Other provisionsEmployment on-costs (c) 17 20
17 20
393 329
Non-CurrentEmployee benefits provision:Long service leave 130 127Superannuation 10 9Defined benefit superannuation plans (d) 451 343
591 479Other provisionsEmployment on-costs (c) 8 9
8 9
599 488
Notes to the Financial Statements For the Year Ended 30 June 2007
54

ANNUAL REPORT 2006-2007
2007 2006 $’000 $’000
18. Provisions (continued)(a) Annual leave liabilities have been classified as current as there is no unconditional right to defer settlement for at least 12 months after reporting date. Assessments indicate that actual settlement of the liabilities will occur as follows:
Within 12 months of reporting date 159 120More than 12 months after reporting date 42 42
201 162
(b) Long service leave liabilities have been classified as current where there is no unconditional right to defer settlement for at least 12 months after reporting date. Assessments indicate that actual settlement of the liabilities will occur as follows:
Within 12 months of reporting date 71 81More than 12 months after reporting date 208 169
279 250
(c) The settlement of annual and long service leave liabilities gives rise to the payment of employment on-costs including workers’ compensation premiums and payroll tax. The provision is measured at the present value of expected future payments. The associated expense is included in ‘Other expenses’.
Notes to the Financial Statements For the Year Ended 30 June 2007
55
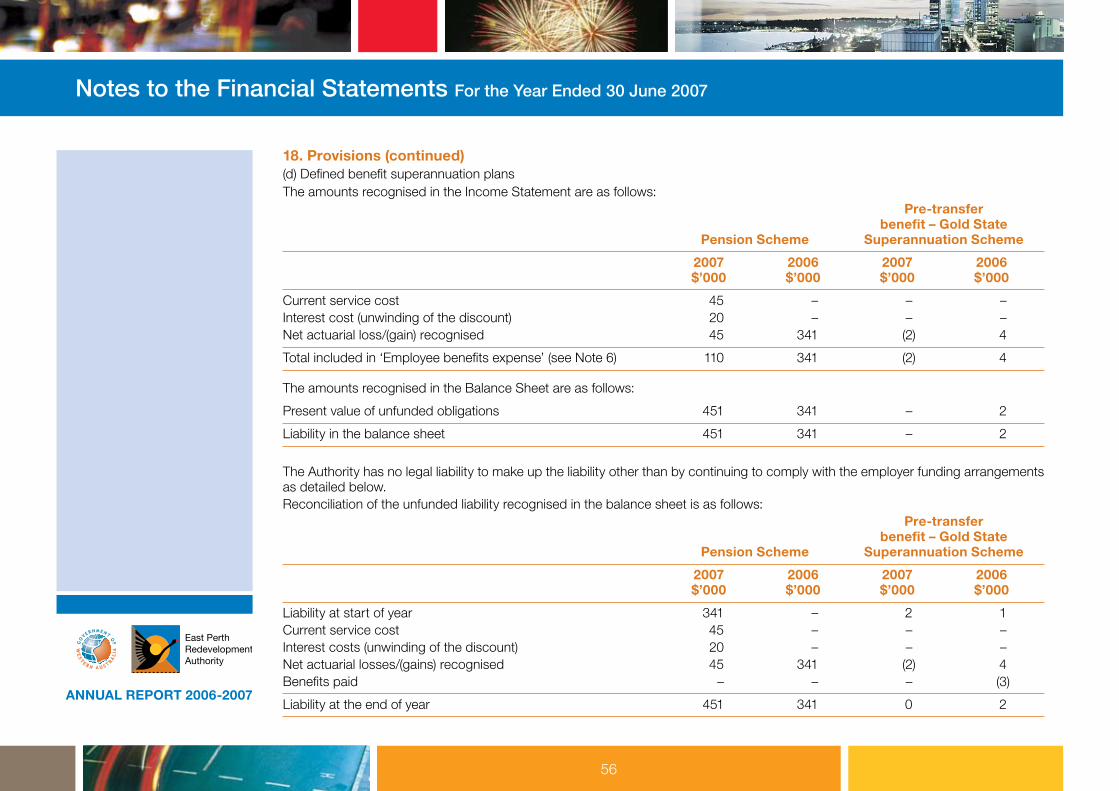
ANNUAL REPORT 2006-2007
18. Provisions (continued)(d) Defined benefit superannuation plansThe amounts recognised in the Income Statement are as follows: Pre-transfer benefit – Gold State Pension Scheme Superannuation Scheme
2007 2006 2007 2006 $’000 $’000 $’000 $’000
Current service cost 45 – – –Interest cost (unwinding of the discount) 20 – – –Net actuarial loss/(gain) recognised 45 341 (2) 4
Total included in ‘Employee benefits expense’ (see Note 6) 110 341 (2) 4
The amounts recognised in the Balance Sheet are as follows:
Present value of unfunded obligations 451 341 – 2
Liability in the balance sheet 451 341 – 2
The Authority has no legal liability to make up the liability other than by continuing to comply with the employer funding arrangements as detailed below.Reconciliation of the unfunded liability recognised in the balance sheet is as follows: Pre-transfer benefit – Gold State Pension Scheme Superannuation Scheme
2007 2006 2007 2006 $’000 $’000 $’000 $’000
Liability at start of year 341 – 2 1Current service cost 45 – – –Interest costs (unwinding of the discount) 20 – – –Net actuarial losses/(gains) recognised 45 341 (2) 4Benefits paid – – – (3)
Liability at the end of year 451 341 0 2
Notes to the Financial Statements For the Year Ended 30 June 2007
56

ANNUAL REPORT 2006-2007
18. Provisions (continued)The principal actuarial assumptions used (expressed as weighted averages) were as follows: 2007 2006
Discount rate 7.50% 5.81%Future salary increases 4.50% 4.50%
2007 2006 $’000 $’000
Historic summaryPension scheme:Present value of unfunded obligation 451 341Fair value of plan assets – –
Deficit 451 341
Pre-transfer benefit – Gold State Superannuation Scheme:Present value of unfunded obligation – 2Fair value of plan assets – –
Deficit 0 2
Experience adjustments arising on plan liabilities:Pension scheme 78 388Pre-transfer benefit – Gold State Superannuation Scheme (2) 4
The historic summary is to present information for the current reporting period and the previous four reporting period. AASB 1 allows an exemption to apply this requirement on a prospective basis from 2006.
Notes to the Financial Statements For the Year Ended 30 June 2007
57
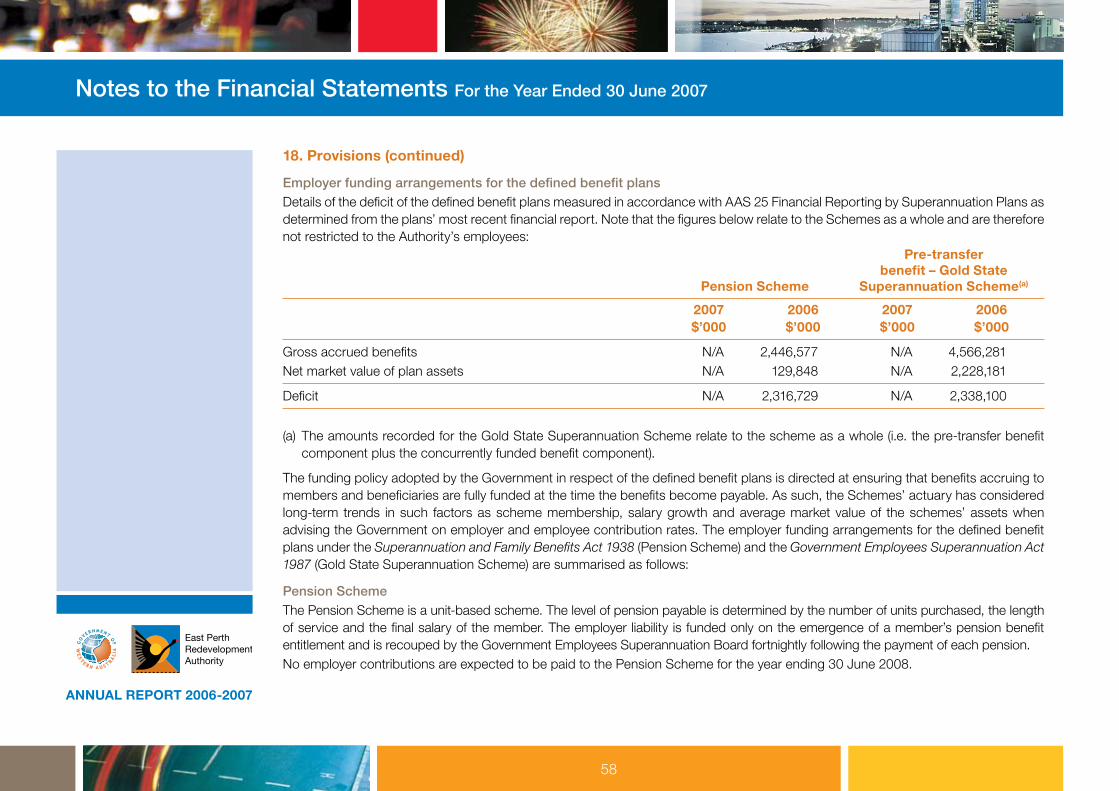
ANNUAL REPORT 2006-2007
18. Provisions (continued)
Employer funding arrangements for the defined benefit plansDetails of the deficit of the defined benefit plans measured in accordance with AAS 25 Financial Reporting by Superannuation Plans as determined from the plans’ most recent financial report. Note that the figures below relate to the Schemes as a whole and are therefore not restricted to the Authority’s employees: Pre-transfer benefit – Gold State Pension Scheme Superannuation Scheme(a)
2007 2006 2007 2006 $’000 $’000 $’000 $’000
Gross accrued benefits N/A 2,446,577 N/A 4,566,281Net market value of plan assets N/A 129,848 N/A 2,228,181
Deficit N/A 2,316,729 N/A 2,338,100
(a) The amounts recorded for the Gold State Superannuation Scheme relate to the scheme as a whole (i.e. the pre-transfer benefit component plus the concurrently funded benefit component).
The funding policy adopted by the Government in respect of the defined benefit plans is directed at ensuring that benefits accruing to members and beneficiaries are fully funded at the time the benefits become payable. As such, the Schemes’ actuary has considered long-term trends in such factors as scheme membership, salary growth and average market value of the schemes’ assets when advising the Government on employer and employee contribution rates. The employer funding arrangements for the defined benefit plans under the Superannuation and Family Benefits Act 1938 (Pension Scheme) and the Government Employees Superannuation Act 1987 (Gold State Superannuation Scheme) are summarised as follows:
Pension SchemeThe Pension Scheme is a unit-based scheme. The level of pension payable is determined by the number of units purchased, the length of service and the final salary of the member. The employer liability is funded only on the emergence of a member’s pension benefit entitlement and is recouped by the Government Employees Superannuation Board fortnightly following the payment of each pension.No employer contributions are expected to be paid to the Pension Scheme for the year ending 30 June 2008.
Notes to the Financial Statements For the Year Ended 30 June 2007
58
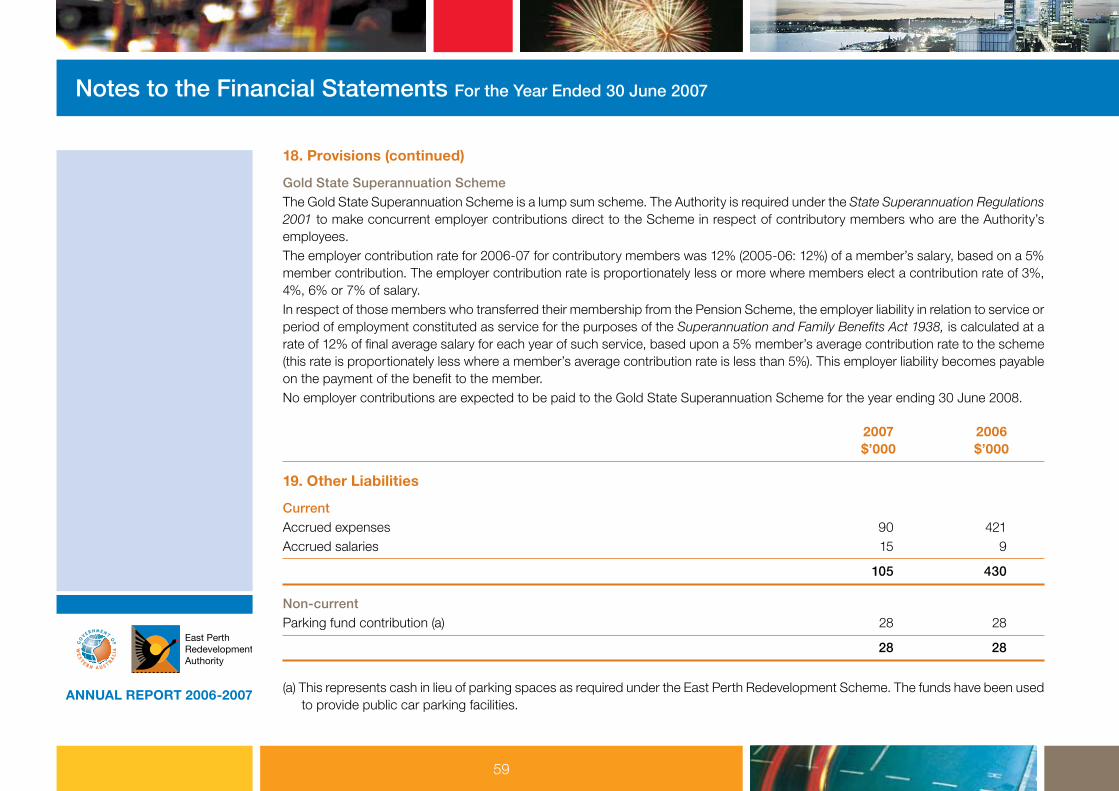
ANNUAL REPORT 2006-2007
18. Provisions (continued)
Gold State Superannuation SchemeThe Gold State Superannuation Scheme is a lump sum scheme. The Authority is required under the State Superannuation Regulations 2001 to make concurrent employer contributions direct to the Scheme in respect of contributory members who are the Authority’s employees.The employer contribution rate for 2006-07 for contributory members was 12% (2005-06: 12%) of a member’s salary, based on a 5% member contribution. The employer contribution rate is proportionately less or more where members elect a contribution rate of 3%, 4%, 6% or 7% of salary.In respect of those members who transferred their membership from the Pension Scheme, the employer liability in relation to service or period of employment constituted as service for the purposes of the Superannuation and Family Benefits Act 1938, is calculated at a rate of 12% of final average salary for each year of such service, based upon a 5% member’s average contribution rate to the scheme (this rate is proportionately less where a member’s average contribution rate is less than 5%). This employer liability becomes payable on the payment of the benefit to the member.No employer contributions are expected to be paid to the Gold State Superannuation Scheme for the year ending 30 June 2008.
2007 2006 $’000 $’000
19. Other Liabilities
CurrentAccrued expenses 90 421Accrued salaries 15 9
105 430
Non-currentParking fund contribution (a) 28 28
28 28
(a) This represents cash in lieu of parking spaces as required under the East Perth Redevelopment Scheme. The funds have been used to provide public car parking facilities.
Notes to the Financial Statements For the Year Ended 30 June 2007
59
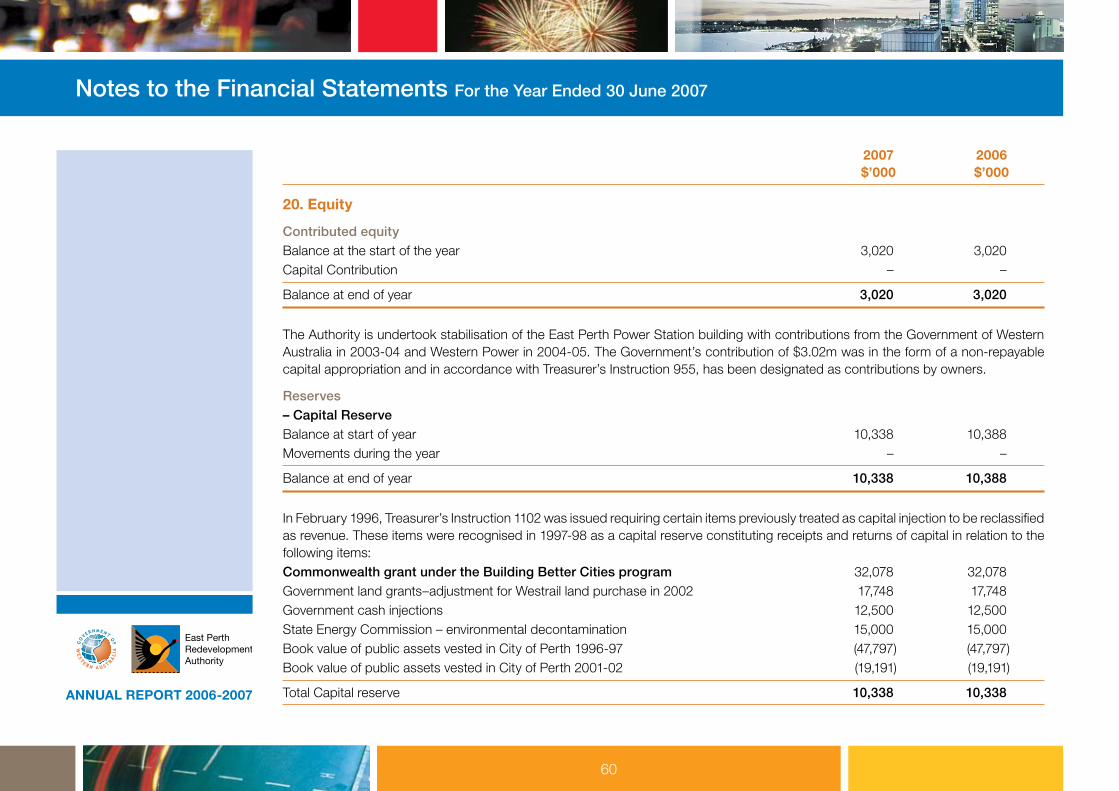
ANNUAL REPORT 2006-2007
2007 2006 $’000 $’000
20. Equity
Contributed equityBalance at the start of the year 3,020 3,020Capital Contribution – –
Balance at end of year 3,020 3,020
The Authority is undertook stabilisation of the East Perth Power Station building with contributions from the Government of Western Australia in 2003-04 and Western Power in 2004-05. The Government’s contribution of $3.02m was in the form of a non-repayable capital appropriation and in accordance with Treasurer’s Instruction 955, has been designated as contributions by owners.
Reserves– Capital ReserveBalance at start of year 10,338 10,388Movements during the year – –
Balance at end of year 10,338 10,388
In February 1996, Treasurer’s Instruction 1102 was issued requiring certain items previously treated as capital injection to be reclassified as revenue. These items were recognised in 1997-98 as a capital reserve constituting receipts and returns of capital in relation to the following items:Commonwealth grant under the Building Better Cities program 32,078 32,078Government land grants–adjustment for Westrail land purchase in 2002 17,748 17,748Government cash injections 12,500 12,500State Energy Commission – environmental decontamination 15,000 15,000Book value of public assets vested in City of Perth 1996-97 (47,797) (47,797)Book value of public assets vested in City of Perth 2001-02 (19,191) (19,191)
Total Capital reserve 10,338 10,338
Notes to the Financial Statements For the Year Ended 30 June 2007
60

ANNUAL REPORT 2006-2007
2007 2006 $’000 $’000
20. Equity (continued)
– Asset Revaluation ReserveBalance at start of year 729 604Net revaluation increments/(decrements):Land & Buildings 965 125
Balance at end of year 1,694 729
Retained EarningsBalance at start of year 64,291 63,084Result for the period 7,895 1,340Change in Accounting Policy – (133)
Balance at end of year 72,186 64,291
Notes to the Financial Statements For the Year Ended 30 June 2007
61

ANNUAL REPORT 2006-2007
2007 2006 $’000 $’000
21. Notes to the Cash Flow Statement
Reconciliation of cashCash at the end of the financial year as shown in the Cash Flow Statement is reconciled to the related items in the Balance sheet as follows:Cash and cash equivalents 42,632 35,445
42,632 35,445
Reconciliation of surplus/(deficit) to net cash flows provided by/(used in) operating activitiesSurplus 7,895 1,340Non-cash items:Depreciation and amortisation 152 195Net (gain)/loss on sale of property, furniture and equipment 9 43(Increase)/decrease in assets:Receivables (59) 96Other current assets 71 71Inventory charged to Cost of Sales 9,549 29,431Increase/(decrease) in liabilities:Payables 122 3Current provisions 64 74Other current liabilities (307) 128Non-current provisions 111 294Change in GST in receivable/payables (180) 984
Net cash provided by/(used in) operating activities 17,427 32,659
Notes to the Financial Statements For the Year Ended 30 June 2007
62
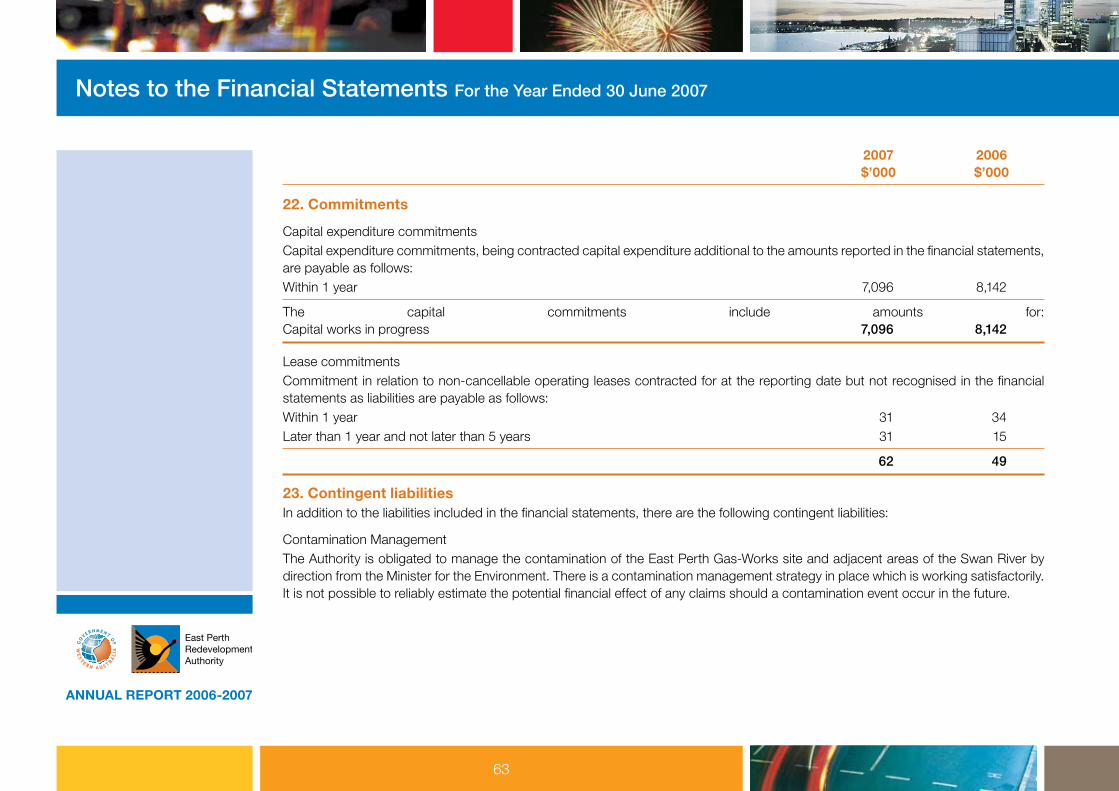
ANNUAL REPORT 2006-2007
2007 2006 $’000 $’000
22. Commitments
Capital expenditure commitmentsCapital expenditure commitments, being contracted capital expenditure additional to the amounts reported in the financial statements, are payable as follows:Within 1 year 7,096 8,142
The capital commitments include amounts for: Capital works in progress 7,096 8,142
Lease commitmentsCommitment in relation to non-cancellable operating leases contracted for at the reporting date but not recognised in the financial statements as liabilities are payable as follows:Within 1 year 31 34Later than 1 year and not later than 5 years 31 15
62 49
23. Contingent liabilitiesIn addition to the liabilities included in the financial statements, there are the following contingent liabilities:
Contamination ManagementThe Authority is obligated to manage the contamination of the East Perth Gas-Works site and adjacent areas of the Swan River by direction from the Minister for the Environment. There is a contamination management strategy in place which is working satisfactorily. It is not possible to reliably estimate the potential financial effect of any claims should a contamination event occur in the future.
Notes to the Financial Statements For the Year Ended 30 June 2007
63

ANNUAL REPORT 2006-2007
24. Explanatory StatementThis statement provides details of any significant variations between estimates and actual results for 2007 and between the actual results for 2006 and 2007. Significant variations are considered to be those greater than 10% and $500,000.
Significant variances between estimate and actual results for the financial year 2007 2007 Actual Estimates Variance $’000 $’000 $’000
IncomeSales Revenue 22,977 22,499 478
ExpenseCost of Sales 9,549 15,944 (6,395)
Sales Revenue:Sales revenue exceeded the estimate due to higher than estimated sale prices received from several lots and the carryover sale of a number of lots from 2005-06. This was offset by the deferral of several lots to 2007-08.
Cost of Sales:Cost of sales were less than estimate due to the deferral of several lots to 2007-08.
Significant variances between actual and prior year actual – revenues and expenditures
2007 2006 Variance $’000 $’000 $’000
IncomeSales Revenue 22,977 37,652 (14,675)
2007 2006 Variance $’000 $’000 $’000
ExpenseCost of Sales 9,549 29,431 (19,882)
Notes to the Financial Statements For the Year Ended 30 June 2007
64

ANNUAL REPORT 2006-2007
24. Explanatory Statement (continued)
Sales Revenue:Sales revenues were less than the previous year (2005-06) as a result of the size, use and location of lots being sold. In the previous year Riverside lots sold contributed to over $15 million of sales.
Cost of Sales:Cost of Sales decreased in 2006-07 as a result of a lower number of lots sold and the different size and cost of lots being sold.
25. Financial Instruments
(a) Financial Risk Management Objectives and PoliciesFinancial instruments held by the Authority are cash and cash equivalents, at-call, short term deposits, receivables and payables. The Authority has limited exposure to financial risks. The Authority’s overall risk management program focuses on managing the risks identified below.
Credit riskThe Authority trades only with recognised, creditworthy third parties. The Authority has policies in place to ensure that sales of products and services are made to customers with an appropriate credit history. In addition, receivable balances are monitored on an ongoing basis with the result that the Authority’s exposure to bad debts is minimal. There are no significant concentrations of credit risk.
Liquidity riskThe Authority has appropriate procedures to manage cash flows by monitoring forecast cash flows to ensure that sufficient funds are available to meet its commitments.
Cash flow interest rate riskThe Authority is not exposed to significant interest rate risks. The Authority has no borrowings so the only exposure to interest rate risk is the variable interest rates of cash deposits and at-call accounts.
Notes to the Financial Statements For the Year Ended 30 June 2007
65

ANNUAL REPORT 2006-2007
25. Financial Instruments (continued)
(b) Financial Instrument disclosuresInterest Rate Risk ExposureThe following table details the Authority’s exposure to interest rate risk as at the reporting date. Weighted Fixed Variable Average Interest Rate Interest Non Interest Interest Less Than 1 Year Rate Bearing Total
30-Jun-07 Rate $’000 $’000 $’000 $’000
Financial assets:Cash assets 6.10% 30,801 – – 30,801 4.32% – 11,830 – 11,830 – – 1 1Receivables – – 344 344Other assets – – 13 13
Total financial assets 30,801 11,830 358 42,990
Financial liabilities:Payables – – 945 945Income in advance – – 55 55Employee benefits – – 992 992Other Liabilities – – 133 133
Total financial liabilities 0 0 2,126 2,126
30,801 11,830 (1,767) 40,864
Notes to the Financial Statements For the Year Ended 30 June 2007
66

ANNUAL REPORT 2006-2007
25. Financial Instruments (continued) Weighted Fixed Variable Average Interest Rate Interest Non Interest Interest Less Than 1 Year Rate Bearing Total
30-Jun-06 Rate $’000 $’000 $’000 $’000
Financial assets:Cash assets 5.52% 31,490 – – 31,490 3.85% – 3,954 – 3,954 – – 1 1Receivables – – 285 285Other assets – – 84 84
Total financial assets 31,490 3,954 370 35,814
Financial liabilities:Payables – – 1002 1,002Income in advance – – 38 38Employee benefits – – 817 817Other Liabilities – – 458 458
Total financial liabilities – – 2,315 2,315
31,490 3,954 (1,945) 33,499
(c) Fair ValuesAll financial assets and liabilities recognised in the balance sheet, whether they are carried at cost of fair value, are recognised at amounts that represent a reasonable approximation of fair value unless otherwise stated in the applicable notes.
Notes to the Financial Statements For the Year Ended 30 June 2007
67

ANNUAL REPORT 2006-2007
26. Remuneration of members of the Accountable Authority and senior officers
Remuneration of Members of the Accountable AuthorityThe number of members of the Accountable Authority, whose total of fees, salaries, superannuation, non-monetary benefits and other benefits for the financial year, fall within the following bands are: 2007 2006
$ 1 – $ 10,000 4 6$ 10,001 – $ 20,000 1 2$ 20,001 – $ 30,000 1 –
$’000 $’000
Total remuneration of the members of the Board of the Authority is: 76 75
76 75
The superannuation included here represents the superannuation expense incurred by the Authority in respect of members of the Accountable Authority.
Notes to the Financial Statements For the Year Ended 30 June 2007
68

ANNUAL REPORT 2006-2007
27. Remuneration of members of the Accountable Authority and senior officers
Remuneration of Senior OfficersThe number of senior officers, other than senior officers reported as members of the Accountable Authority, whose total fees, salaries, superannuation, non-monetary benefits and other benefits for the financial year, fall within the following bands are: 2007 2006
$ 120,001 – $ 130,000 1 1$ 130,001 – $ 140,000 – 1$ 150,001 – $ 160,000 1 –$ 180,001 – $ 190,000 1 –$ 190,001 – $ 200,000 – 1$ 210,001 – $ 220,000 1 –
$’000 $’000
The total remuneration of senior officers is: 681 458
681 458
The superannuation included here represents the superannuation expense incurred by the Authority in respect of senior officers other than senior officers reported as members of the Accountable Authority.
28. Remuneration of AuditorsRemuneration payable to the Auditor General for the financial year is as follows:Auditing the accounts, financial statements and performance indicators 24 37
24 37
29. Supplementary financial information
Write-offsPublic property written-off by the Accountable Authority during the financial year 0 46
0 46
Notes to the Financial Statements For the Year Ended 30 June 2007
69
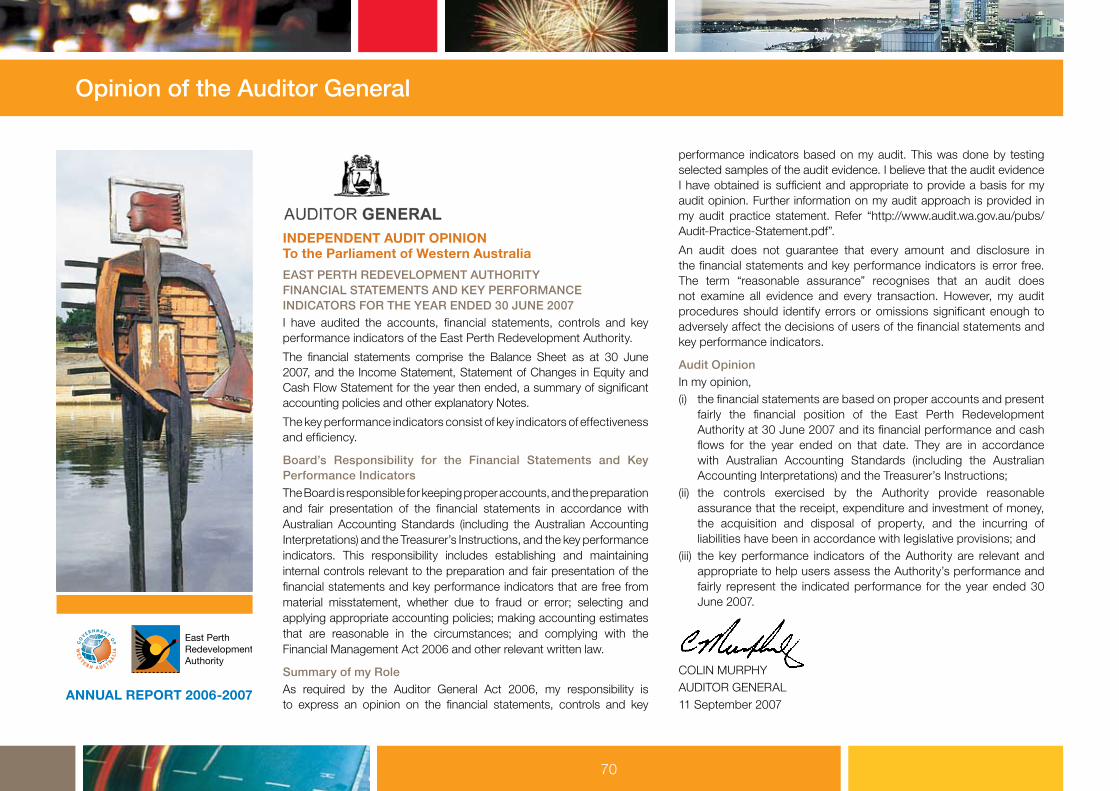
ANNUAL REPORT 2006-2007
INDEPENDENT AUDIT OPINION To the Parliament of Western Australia
EAST PERTH REDEVELOPMENT AUTHORITY FINANCIAL STATEMENTS AND KEY PERFORMANCE INDICATORS FOR THE YEAR ENDED 30 JUNE 2007I have audited the accounts, financial statements, controls and key performance indicators of the East Perth Redevelopment Authority.
The financial statements comprise the Balance Sheet as at 30 June 2007, and the Income Statement, Statement of Changes in Equity and Cash Flow Statement for the year then ended, a summary of significant accounting policies and other explanatory Notes.
The key performance indicators consist of key indicators of effectiveness and efficiency.
Board’s Responsibility for the Financial Statements and Key Performance IndicatorsThe Board is responsible for keeping proper accounts, and the preparation and fair presentation of the financial statements in accordance with Australian Accounting Standards (including the Australian Accounting Interpretations) and the Treasurer’s Instructions, and the key performance indicators. This responsibility includes establishing and maintaining internal controls relevant to the preparation and fair presentation of the financial statements and key performance indicators that are free from material misstatement, whether due to fraud or error; selecting and applying appropriate accounting policies; making accounting estimates that are reasonable in the circumstances; and complying with the Financial Management Act 2006 and other relevant written law.
Summary of my RoleAs required by the Auditor General Act 2006, my responsibility is to express an opinion on the financial statements, controls and key
performance indicators based on my audit. This was done by testing selected samples of the audit evidence. I believe that the audit evidence I have obtained is sufficient and appropriate to provide a basis for my audit opinion. Further information on my audit approach is provided in my audit practice statement. Refer “http://www.audit.wa.gov.au/pubs/Audit-Practice-Statement.pdf”.
An audit does not guarantee that every amount and disclosure in the financial statements and key performance indicators is error free. The term “reasonable assurance” recognises that an audit does not examine all evidence and every transaction. However, my audit procedures should identify errors or omissions significant enough to adversely affect the decisions of users of the financial statements and key performance indicators.
Audit OpinionIn my opinion,(i) the financial statements are based on proper accounts and present
fairly the financial position of the East Perth Redevelopment Authority at 30 June 2007 and its financial performance and cash flows for the year ended on that date. They are in accordance with Australian Accounting Standards (including the Australian Accounting Interpretations) and the Treasurer’s Instructions;
(ii) the controls exercised by the Authority provide reasonable assurance that the receipt, expenditure and investment of money, the acquisition and disposal of property, and the incurring of liabilities have been in accordance with legislative provisions; and
(iii) the key performance indicators of the Authority are relevant and appropriate to help users assess the Authority’s performance and fairly represent the indicated performance for the year ended 30 June 2007.
COLIN MURPHYAUDITOR GENERAL11 September 2007
Opinion of the Auditor General
70


This is the 15th Annual Report of the East Perth Redevelopment Authority.
EPRA’s office is at 12 Lindsay Street, Perth WA 6000Locked Bag 8, Perth Business Centre WA 6849
Telephone: (08) 9222 8000Facsimile: (08) 9281 6020Email: [email protected]: www.epra.wa.gov.au