East Henderson High School Improvement Plan, … · Web viewEast Henderson High School Improvement...
68
East Henderson High School 110 Upward Road East Flat Rock, NC Continuous School Improvement Plan 2012 - 2013 Submitted: October 22, 2012 Approved by staff: November 2, 2012 Principal: Matthew Gruebmeyer 1
Transcript of East Henderson High School Improvement Plan, … · Web viewEast Henderson High School Improvement...

East Henderson High School110 Upward RoadEast Flat Rock, NC
Continuous School Improvement Plan2012 - 2013
Submitted: October 22, 2012Approved by staff: November 2, 2012
Principal:Matthew Gruebmeyer
1

East Henderson High School Improvement Plan, 2012 - 2013
Table of Contents
School Improvement Team Members 3Mission and Belief Statements 4School Vision 4School Improvement Goals 5School Profile Narrative 6Progress on School Improvement Plan 6Narrative on SIP, 2012-2013 8Goal One: Student Performance and School Designation 10Goal Two: Efficient, Safe and Effective Learning Environment 12Goal Three: On-time Graduation and College / Career Readiness 13
Duty-free Lunch and Planning, Waivers 14
Statement of AssurancesThe School Improvement Plan has been developed and aligned to the requirements of the following initiatives.
Henderson County Public Schools Strategic Plan ABCs Accountability Model SACS/ CASI School and District Accreditation Standards No Child Left Behind Act
October 21, 2012 Page 2

East Henderson High School Improvement Plan, 2012 - 2013
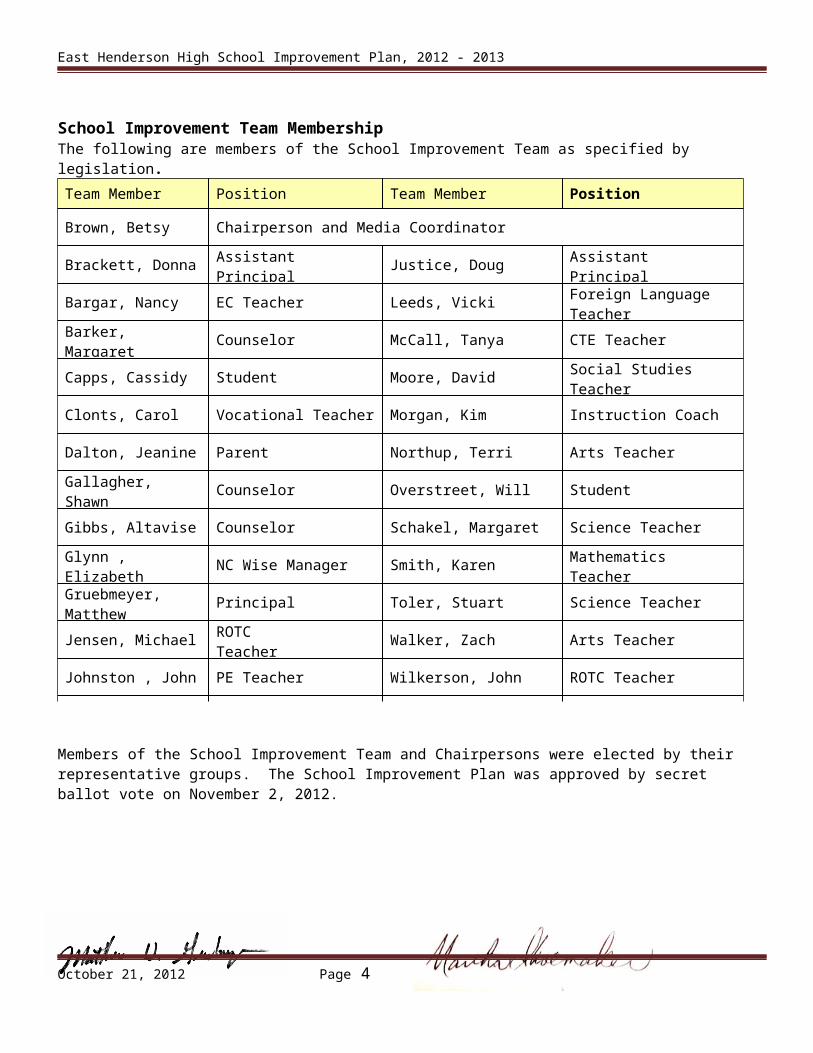
School Improvement Team MembershipThe following are members of the School Improvement Team as specified by legislation.
Team Member Position Team Member Position
Brown, Betsy Chairperson and Media Coordinator
Brackett, Donna Assistant Principal Justice, Doug Assistant Principal
Bargar, Nancy EC Teacher Leeds, Vicki Foreign Language Teacher
Barker, Margaret Counselor McCall, Tanya CTE Teacher
Capps, Cassidy Student Moore, David Social Studies Teacher
Clonts, Carol Vocational Teacher Morgan, Kim Instruction Coach
Dalton, Jeanine Parent Northup, Terri Arts Teacher
Gallagher, Shawn Counselor Overstreet, Will Student
Gibbs, Altavise Counselor Schakel, Margaret Science Teacher
Glynn , Elizabeth NC Wise Manager Smith, Karen Mathematics Teacher
Gruebmeyer, Matthew Principal Toler, Stuart Science Teacher
Jensen, Michael ROTCTeacher Walker, Zach Arts Teacher
Johnston , John PE Teacher Wilkerson, John ROTC Teacher
Members of the School Improvement Team and Chairpersons were elected by their representative groups. The School Improvement Plan was approved by secret ballot vote on November 2, 2012.
______________________________11/2/2012 ______________________ 11/2/2012 Principal Date School Improvement Chair Date
October 21, 2012 Page 3
East Henderson High School Improvement Plan, 2012 - 2013
Guiding Beliefs and Vision
HCPS MissionHenderson County Public Schools will provide all students the opportunity to learn and the encouragement to succeed in a safe environment. We will honor the individual and nurture the potential of all children .
HCPS Guiding PrincipleThe success of a child is the result of a collaborative partnership of school, child parent and community.
HCPS Core Values We are here for the children we serve. We value each child. We value the development of the whole child. We value a safe, supportive, and caring learning environment. We value respect, honesty, and integrity. We value the commitment of quality employees. We value effective learning through high-quality instruction. We value the pursuit of excellence.
East Henderson High School’s Mission:Our school will be a place of accomplishment and growth for every student. Our school will help students to become knowledgeable, talented and independent individuals, prepared for the challenges of the 21 st Century.
East Henderson High School’s Core BeliefsWe believe students achieve more in a safe, welcoming and respectful atmosphere.We believe every student deserves caring and effective educators.We believe in having high expectations for ourselves and for every child.We believe that students and their families need to be partners in the educational process.We are committed to our purpose: student success.
East Henderson High School Vision:East Henderson High School students will learn the knowledge and skills needed to succeed in school and to be prepared for college, life and work.
October 21, 2012 Page 4

East Henderson High School Improvement Plan, 2012 - 2013
The following are agreed upon goals that will support our vision for student achievement.
Goal 1. East Henderson High School students will achieve their annual measurable objectives and the school will receive the highest school designation under the new North Carolina ABCs.
Goal 2. East Henderson High School will have an efficient, safe and positive learning and teaching environment, as evidenced by a twenty five percent increase in stakeholder satisfaction on the Teacher’s Working Conditions Survey, a five percent reduction in student discipline referrals and an attendance rate of at least ninety-seven percent.
Goal 3. East Henderson High School students will stay in school, graduate on time with Future Ready Diplomas, and our school’s cohort graduation rates will improve to at least ninety percent.
October 21, 2012 Page 5

East Henderson High School Improvement Plan, 2012 - 2013
School Profile Narrative and Progress on School Improvement Plan 2012-2013
Narrative SummaryThe 2012-2013 School Improvement Plan was developed by the staff, students and parents of the School Improvement Team. During the fall of 2012, our team built this plan using federal, state, county and school-based objectives and data. Central to the plan are the characteristics of the school staff, students and community, the data on staff performance and student achievement and the information gathered from surveys and other sources. We are confident that the goals below are attainable and appropriate and that the strategies herein are the essential steps necessary to make our school a more effective place to learn and a more rewarding place to work.
The plan is based upon three central goals. We are committed to maximizing student success, to making the school a great place to study and to work, and to adding value to our students’ experiences, such that they are less likely to drop out and more likely to graduate on-time and prepared for the future.
Our goals for student achievement are based upon four premises. First, great schools have a large proportion of students that demonstrate an understanding of the content (proficiency). Secondly, great schools help average students to become good students, good students to become great students, and so on (student growth). Third, students in great schools demonstrate proficiency and show individual growth regardless of their socio-economic or ethnic backgrounds (equity). Finally, successful schools have staff that learns to discuss teaching and learning, focus on developing common (and rigorous) expectations, and generate increased capacity to deliver high-yield instruction.
ProgressThe first objective related to student achievement describes our school goals on student proficiency. East High had continued success in the 2011-2012 school-year, with proficiency reaching an all-time high of 84.1% on our EOC exams, up more than three points from 80.8% in 2010-2011. Specifically, Algebra I proficiency continued to improve (as it has every year since 2009), to 83.0% - its highest proficiency ever. Likewise, Biology has improved every year, and it, too reached its highest proficiency ever, at 83.6%. Finally, while not at its peak, English I proficiency reached 87.4%, close to its historical high of 90.0% (2010).
Just like last year, a closer look reveals that students of all abilities participated in this improvement, with our highest-ability students demonstrating proficiencies of 97% to 100%, middle-ability students of 85% to 94% and our lower-ability students 60% to 64%. Lower ability students showed the most gains (more than 4%) on their EOCs, improving their proficiency to 62% overall, from 58% in 2011 and 53% in 2010. Central to these results is our focus on EVAAS-style score predictions, in which teachers are given information helping them to identify students at risk of failing their subjects and exams. With immediate attention where it belongs (on the student who is underperforming), along with the early and appropriate identification of students who need remediation or enrichment, we believe that we are better able to meet the needs of all students and thereby improve the success of all of our students.
As we are seeing more frequently in the research, we know that the best data is often student by student, and classroom by classroom. With that in mind, our objectives have always included an increase in the number of classrooms that reach proficiency. Here, again the results are very encouraging. The best news in this area was that more classrooms than ever (groups of students taught and tested together) met the 80% proficiency threshold. Seventy-two percent (72%) of classrooms had proficiencies of 80% or better, up 10% over 2011’s 62% - and remarkably better than 2010’s 49% and 2009’s 33%. In addition, because our school continues to raise expectations (our new proficiency goal is 90%), it is encouraging to note that more of our classrooms reached the 90% threshold in 2012 (42% of tested classrooms) than met the 80% threshold in 2009 (33%)! We believe that the teaching and learning have never been better at our school.
October 21, 2012 Page 6

East Henderson High School Improvement Plan, 2012 - 2013
The second and third objectives in Goal One focus on student growth. As with our increases in proficiency, we think that our focus on EVAAS-style score predictions and the differentiation of instruction it leads to makes it more likely that students will be challenged appropriately - and the data indicates that we may be having some success. In 2011-2012, 48% of our students met their individual EOC targets, up 8% from 40% in 2011 and almost half-again as good as in 2009, in which 33% of our students met their targets. Interestingly, our middle ability students showed the greatest bump, improving 9 points to 52% from 43%. Finally, our highest ability students also showed gains, with 53% of them reaching their individual targets, up from 49% in 2011, while our lower-ability students dropped back a little, with 35% of them reaching their targets.
The final Goal One objective is that of AYP (now called AMO, or Annual Measurable Objectives) and student equity. Specifically, our objective was to decrease the achievement gap between our lowest ability students and our highest – and we are thrilled to say that we were successful. In 2012, East High School’s achievement gap was reduced to forty points (on all EOC exams) from fifty-two points the year before. Less encouraging, for the first time in nine years, EHHS did not achieve all of its AYP/AMO targets, missing our white student subgroup math target of 90.1%. At the same time, we are proud of the fact that we achieved 18 of our 19 AMO targets, or 94.7%.
Goal Two summarizes our efforts to make East High a good place to work and to learn. While our 2012 results in this area were mixed (our Teaching Working Conditions Survey was poor), a welcome bright spot was our continued good student attendance. Our overall attendance rate of 96.0% was near our best of 96.3% (2009) and we had the best ever recorded attendance in six of our nine months. In addition, we were successful in meeting our technology goal of completing the installation of basic technology in nearly every instructional space and we were able to make dramatic improvements in our security camera system, increasing by 300% the number of cameras on our network and by upgrading all of our cameras, the recording system and the user interface that makes our system so much easier to use. At the same time, work continues on the lower Teacher’s Working Conditions Survey items. We are encouraged already about the specific improvements already in place, and every indication is that all of the changes have not only been well-received by the EHHS staff, but also appear to accomplishing their purpose (more below).
Goal Three addresses dropout prevention and the success of at-risk students. Some of our greatest successes have traditionally come with this population. Dropouts remained at 18 in 2011-2012 (the second year in a row at that number), and down from 21 in 2009-2010, 28 in 2008-2009 and 38 in 2007-2008. While the 2012 plan broadened Goal Three to align more completely with changes in student accountability and curriculum, we were disappointed in our five-year graduation rate of 83.3%. While it is true that the Senior Class of 2012 was a challenging one (our cohort graduation rate would have been nearly 86% if our summer graduates had instead graduated in June) our goal is to maintain student success through all four years, so that all students graduate on time and have a valuable school experience that better prepares them for college and careers. On the bright side, measures of East High’s diploma quality remain very positive; in 2012, nearly 97% of our graduates completed high school with a College Prep and/or a College Tech Prep diploma. As detailed below, we remain committed to both diploma quality and on-time graduation rates and are confident that both will improve in the upcoming school year.
October 21, 2012 Page 7

East Henderson High School Improvement Plan, 2012 - 2013
EHHS School Improvement, 2012-2013As indicated in the research, great schools make school improvement planning a widely shared activity, with thoughtful input from a wide variety of staff and stakeholders and insight from carefully selected and evaluated data. Perhaps never before have so many staff been involved in an EHHS School Improvement Plan and so much data carefully analyzed and incorporated into our goals, objectives and strategies.
ProcessWork on the plan began early in the summer of 2012, with a series of two, then three (at the teachers’ request) meetings to evaluate the Teacher’s Working Conditions Survey and its implications for change at our school. At each session, participants closely examined our TWC results, provided perspective and priority on each section of the survey, heard proposals from school administration and leadership, and provided feedback on the perceived effectiveness of each strategy. For example, input from the staff on the perceptions of teacher support on discipline matters caused our focus to shift to communication about the hard work of managing student behaviors, rather than on whether discipline was being done effectively.
Work on the plan continued when the school-year resumed, with significant time again devoted to the Survey, but with the added value of additional student performance data. Stakeholder input was again thoughtful, and what emerged was an accurate and closely nuanced evaluation of where our school currently sits and to where we’d like for it to go. For example, a close comparison of successful graduation classes and the less successful Class of 2012 caused participants to come to a surprising conclusion. For some groups of students, academic success is more important in tenth grade, rather than in the more commonly emphasized ninth grade.
FocusOur data illustrates that there is still work to do when it comes to student growth, and to a lesser extent, student proficiency, although there are subgroups about whom we are concerned. Specifically, it remains true that our most able students never fail an EOC, that our lowest-ability students pass at a rate one-third lower than their most able peers, and that about half of our students achieve their growth targets. Further, while EHHS girls outperform the state by nearly five points on EOCs, our boys do better by only one percent. Students who qualify as economically disadvantaged at EHHS do better on their EOCs than their peers in our district, but our students who are not economically disadvantaged do worse. As a result, the EHHS School Improvement Team has selected student performance goals that address improving EOC proficiency and growth for all students, but especially for lower-performing subgroups of students. Strategies include the formation of Professional Learning Communities in all subject areas and in the area of subgroup performance, an even greater emphasis on common instructional practices and monitoring, and on maximizing our use of technologies.
Data from the Teacher Working Conditions survey indicate areas of focus, also. Survey items about the appearance of the campus and the conduct of our students were most striking. As a result, the EHHS School Improvement Team identified objectives based on the teaching and learning environment and on establishing positive and productive relationships with students and all stakeholders. Strategies include the alteration of custodial and teacher supervision schedules and changes in the lunch, discipline and student transportation procedures. Analysis of the TWC further illustrated that improvement in school communication systems could provide powerful improvements in the teaching environment. Consequently, the Team has instituted changes in the meeting structures in our school and how information produced in staff sessions is disseminated. Finally, because research supports the proposition that climate is better in schools that are smaller, the school has re-worked its homeroom practices, such that teachers have better support from their student’s homeroom teachers and so that students have more opportunities to establish meaningful relationships with their teachers.
October 21, 2012 Page 8

East Henderson High School Improvement Plan, 2012 - 2013
The afore-mentioned Cohort Graduation Rate and other data generated internally illustrates that not all EHHS students have an equal expectation of on-time graduation. On the other hand, highly positive results for East High School on EOC exams and standardized tests, especially our good SAT scores and special recognition for ACT growth, illustrate that East High students are generally well-prepared for college. As a result, our school has identified that we must both remediate some of our students who are at risk of not graduating on time and perpetuate the success of our students who are eager to maximize their opportunities in college. Therefore, the 2013 plan includes strategies to use Professional Learning Communities to support at risk students, to focus more deeply on identifying pedagogy that more explicitly prepares students for the SAT and ACT, and to expand the student and parent communication strategies that seemed to successfully support all students last year.
_________________________________ _______________________________________Principal Date School Improvement Chair Date
October 21, 2012 Page 9

East Henderson High School Improvement Plan, 2012 - 2013
Goal 1. East Henderson High School students will achieve their annual measurable objectives and the school will receive the highest school designation under the new North Carolina ABCs. (HCPS Strategic Plan: 1A, 1B, 3B, AdvancED: 1.3, 2.4, 4.5, 5.3, HCPS Technology: Priorities 2 and 4)
Measurable Objective Strategy Progress
Monitoring
Timeline of Evaluation, including interim & final
Professional Learning Needed to Support Strategy
Resources Required/Budgeted
Person(s) Responsible
Student performance will improve, as demonstrated by an increase in proficiency to 90% from 83%, and an increase in growth to 60% from 53%.
Use professional learning communities and data teams to align instruction with curriculum, to increase instructional consistency from classroom to classroom and to evaluate student work. Use the data and feedback from instructional monitoring by peers and administrators to more consistently implement successful teaching and learning strategies such as Learning-Focused®, Formative Assessment and other high-effect techniques.
Student Outcomes:IEP and tier progress, benchmark assessments, EOC / AMO reports, teacher grades.
Teacher Outcomes:PLC reports, common assessments and instructional practices, performance reports (ABC and EVAAS), EOC scores, growth summary reports
Student Outcomes: Every progress report period, every grading period, year-end
Teacher outcomes:PLC / Data Team / Building Leadership Meetings, Grading Periods, and Year-End
PLC and Data Teams, Learning Focus and other high effect strategies,Formative Assessment, EVAAS
Student Centered Leadership, Visible Learning, Data Teams: Leaders Make It Happen, Protocols in Professional Learning Communities, Empowering Underachieving Students, Other texts as identified EVAAS
PrincipalTeachersInstructional Coach
October 21, 2012 Page 10

East Henderson High School Improvement Plan, 2012 - 2013
Measurable Objective Strategy Progress
Monitoring
Timeline of Evaluation, including interim & final
Professional Learning Needed to Support Strategy
Resources Required/Budgeted
Person(s) Responsible
Student performance will improve such that all subgroups will meet their targets, and such that the achievement gaps associated with SES and gender will decrease by 25%
Use professional learning communities, teacher data teams and student performance predictions, such as EVAAS, to identify subgroup participants, assess their needs, deliver content consistent with their characteristics and monitor their performance and achievement.
Continue to use instructional technology innovations, such as Apple applications, Google tools and school software upgrades to assist teachers in targeting good instructional and motivational practices for all students.
Student Outcomes:Student Surveys, greater diversity of ents, and Tier progress, Benchmark Assessments, Teacher Grades,
Teacher Outcomes:Student Survey results, PLC products, classroom grade reports, Teacher Prediction-Performance Reports (ABC and EVAAS), EOC Scores, Growth Summary Reports
Student Outcomes: Every progress report period, every grading period, year-end
Teacher outcomes:Monthly Meetings, Semester surveys, Year-End
Common Core and Essential Standards Professional Learning Communities and Data Team use.
Apple, iPad, Google, and Power-School training.
Looking at Student Work. Ruby Payne and other at-risk resources.
Student Centered Leadership, Visible Learning, Data Teams: Leaders Make It Happen, Protocols in Professional Learning Communities, Empowering Underachieving Students, Other texts as identified.
PrincipalsInstructional CoachTeacher-Leaders,Teachers
October 21, 2012 Page 11
East Henderson High School Improvement Plan, 2012 - 2013
Goal 2. East Henderson High School will have an efficient, safe and positive learning and teaching environment, as evidenced by a twenty five percent increase in stakeholder satisfaction on the Teacher’s Working Conditions Survey, a five percent reduction in student discipline referrals and an attendance rate of at least ninety-seven percent. (HCPS Strategic Plan: 3D, 4B, 5A, AdvanceED: 1.2, 2.5, 4.3, HCPS Technology Priorities 2 and 4)
Measurable Objective Strategy Progress
Monitoring
Timeline of Evaluation, including interim & final
Professional Learning Needed to Support Strategy
Resources Required/Budgeted
Person(s) Responsible
The East Henderson High School campus will be cleaner and more conducive to learning as evidenced by a twenty-five percent improvement in stakeholder satisfaction.
Change custodial schedules and assignments, lunch procedures, parking lot use and teacher duties.
Student Outcomes:Positive Survey responses and informal feedback.
Stakeholder Outcomes:Survey responses and informal feedback.
Student Outcomes: Ongoing
Stakeholder outcomes:ongoing
Custodial training, as needed
Student and Teacher communications
Instructional Funds
Duty Rosters
Student Communications
PrincipalsCustodiansTeachers
School climate and educational relationships will improve, as evidenced by a 25% increase in stakeholder satisfaction, a 5% reduction in referrals, and an increase in student attendance to 97% from 96.3%.
Change discipline procedures in order to improve consistency, timeliness and communication among staff.
Change the homeroom structure to facilitate a “smaller school” and more individualized attention to student progress.
Increase the quality and of parent communication.
Student Outcomes:Student performance data, progress reports and survey data,
Teacher Outcomes:Referral Histories, Processing Data, teacher survey results and progress reports
Student Outcomes: Every grading period, year-end
Teacher outcomes:Grading Periods, Teacher Observations and Year-End
Research-based homeroom structures and curriculum, Ruby Payne: Framework for Understanding PovertyRuby Payne: Helping Under-resourced LearnersNorth Carolina Teacher Working Condition Survey
Student Code of Conduct, Discipline ProceduresHomeroom materials, Parent Assist, Alert Now®, Electronic newsletters, student surveys of their teachers
PrincipalsTeachersInstructional CoachCounselors
October 21, 2012 Page 12

East Henderson High School Improvement Plan, 2012 - 2013
Goal 3. East Henderson High School students will stay in school, graduate on time with Future Ready Diplomas and our school’s cohort graduation rates will improve to at least ninety percent. (HCPS Strategic Plan: 1B, 1C, 3B, 3D, 3E, AdvancEd: 1.1, 2.4, 2.6, 3.8, HCPS Technology: Priorities 2 and 4 )
Measurable Objective Strategy Progress
Monitoring
Timeline of Evaluation, including interim & final
Professional Learning Needed to Support Strategy
Resources Required/Budgeted
Person(s) Responsible
East High students will be better prepared for career and college, as demonstrated by an increase in the cohort graduation rates to 90% from 86% and a 5% increase in student proficiency and growth on the school’s standardized test scores, such as PLAN, ACT, PSAT and SAT.
Use professional learning communities and building/teacher data teams to identify students who are behind academically, to monitor their performance and to provide effective interventions and support.
Increase the quality and frequency of parent communication, using Parent Assist, Alert Now®, Electronic newsletters, traditional teacher / parent contact and a variety of student progress parent letters.
Use the curricular connections between standardized tests and state curriculum to help teachers teach lessons using PLAN/PSAT SAT/ACT format, content and skills.
Student Outcomes:Parent communications. Participation rates in advanced courses and standardized testing. Average scores and Standardized Test Reports
Teacher Outcomes:Test Prep lessons, test-oriented special help sessions, teacher survey data and curricular materials.
Student Outcomes:Concurrent with test administrations and reporting dates
Teacher Outcomes: Monthly Meetings, Semester End, Year-End.
PLC and Data Team resources as above, Ruby Payne, Teaching Students in Poverty, Positive Behavior Support, ACT/SAT prep materials
Standardized testing preparation materials.
Score Prediction andEVAAS Training.
Parent-Assist, and mail-merge.
PrincipalCounselorsInstructional CoachTeachersCounselors
October 21, 2012 Page 13

East Henderson High School Improvement Plan, 2012 - 2013
Duty Free PlanningTeachers at East Henderson High School teach three classes of 90 minutes each day. There is one 90 minute block of planning each day for every teacher.
Duty Free LunchTeachers at East Henderson High School supervise students on a rotating basis at lunch, before school and after school. Each teacher has a duty-free 40 minute lunch and/or a duty-free AM or PM work-time.
Building-Level Waiver Request2011-2012
School: East Henderson High School LEA Number: 450 School Number: 316Please insert the waiver you are requesting. (State Request)
We are requesting the flexibility to use state textbook funds to purchase Math and Business Applications for Career Math.
Identify the law, regulation or policy from which you are seeking an exemption.
General Statute 115c-9b. Use of textbooks not adopted by the State Board of Education
Please state how the waiver will be used.
Since there is not a state adopted textbook for Career Math, we request flexibility to use state textbook funds to purchase these books
Please state how the waiver will promote achievement of performance goals.
The use of these texts would enable teachers to help students meet the goals and objectives of the Career Math course.
_________________________________ _______________________________________Principal Date School Improvement Chair Date
October 2, 2011 Page 14

East Henderson High School Improvement Plan, 2012 - 2013
Building-Level Waiver Request2011-2012
School: East Henderson High School LEA Number: 450 School Number: 316Please insert the waiver you are requesting. (State Request)
We are requesting the flexibility to use state textbook funds to purchase Essentials for Athletic Training for Sports Medicine.
Identify the law, regulation or policy from which you are seeking an exemption.
General Statute 115c-9b. Use of textbooks not adopted by the State Board of Education
Please state how the waiver will be used.
Since there is not a state adopted textbook for Sports Medicine, we request flexibility to use state textbook funds to purchase these books.
Please state how the waiver will promote achievement of performance goals.
The use of these texts would enable teachers to help students meet the goals and objectives of the Sports Medicine Course
_________________________________ _______________________________________Principal Date School Improvement Chair Date
October 2, 2011 Page 15

East Henderson High School Improvement Plan, 2012 - 2013
Building-Level Waiver Request2011-2012
School: East Henderson High School LEA Number: 450 School Number: 316Please insert the waiver you are requesting. (State Request)
We are requesting the flexibility to use state textbook funds to purchase Landscape Plants: Their Identification, Culture, and Use for Horticulture II.
Identify the law, regulation or policy from which you are seeking an exemption.
General Statute 115c-9b. Use of textbooks not adopted by the State Board of Education
Please state how the waiver will be used.
The NC Department of Public Instruction blueprint and curriculum guide for Horticulture II references Landscape Plants: Their Identification, Culture, and Use.
Please state how the waiver will promote achievement of performance goals.
The use of these texts would enable teachers to help students meet the goals and objectives of the Horticulture II course.
_________________________________ _______________________________________Principal Date School Improvement Chair Date
Building-Level Waiver Request
October 2, 2011 Page 16

East Henderson High School Improvement Plan, 2012 - 2013
2011-2012
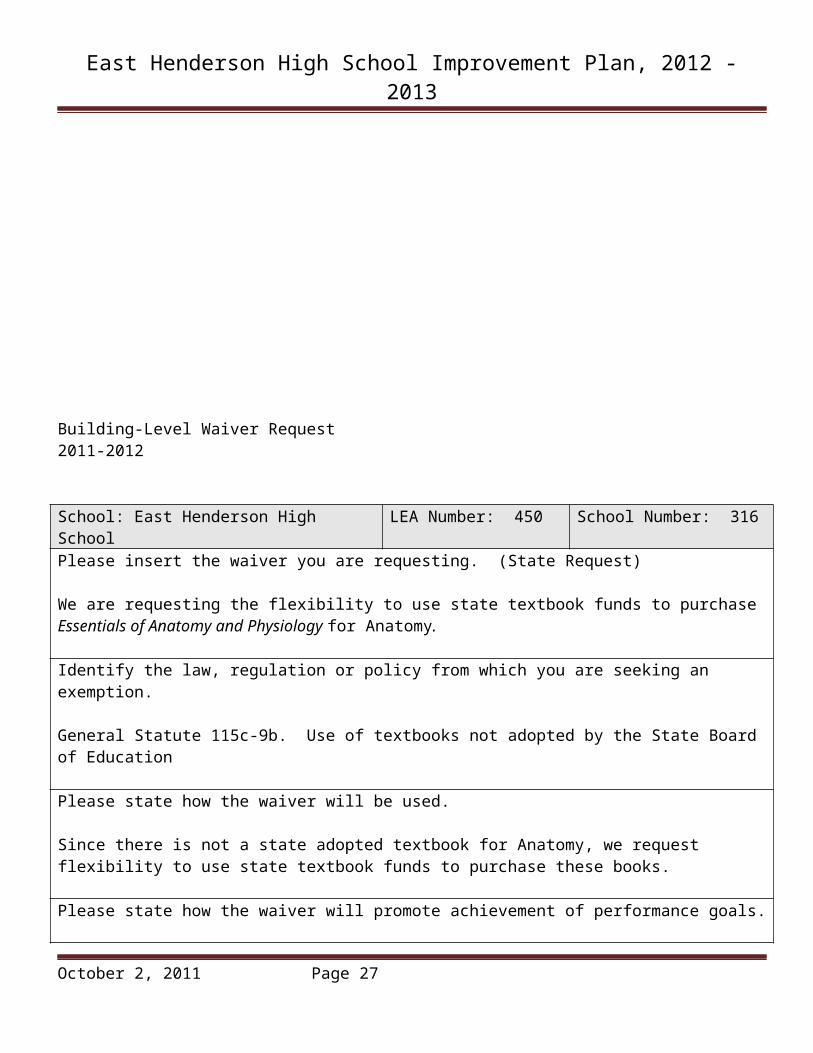
School: East Henderson High School LEA Number: 450 School Number: 316Please insert the waiver you are requesting. (State Request)
We are requesting the flexibility to use state textbook funds to purchase Essentials of Anatomy and Physiology for Anatomy.
Identify the law, regulation or policy from which you are seeking an exemption.
General Statute 115c-9b. Use of textbooks not adopted by the State Board of Education
Please state how the waiver will be used.
Since there is not a state adopted textbook for Anatomy, we request flexibility to use state textbook funds to purchase these books.
Please state how the waiver will promote achievement of performance goals.
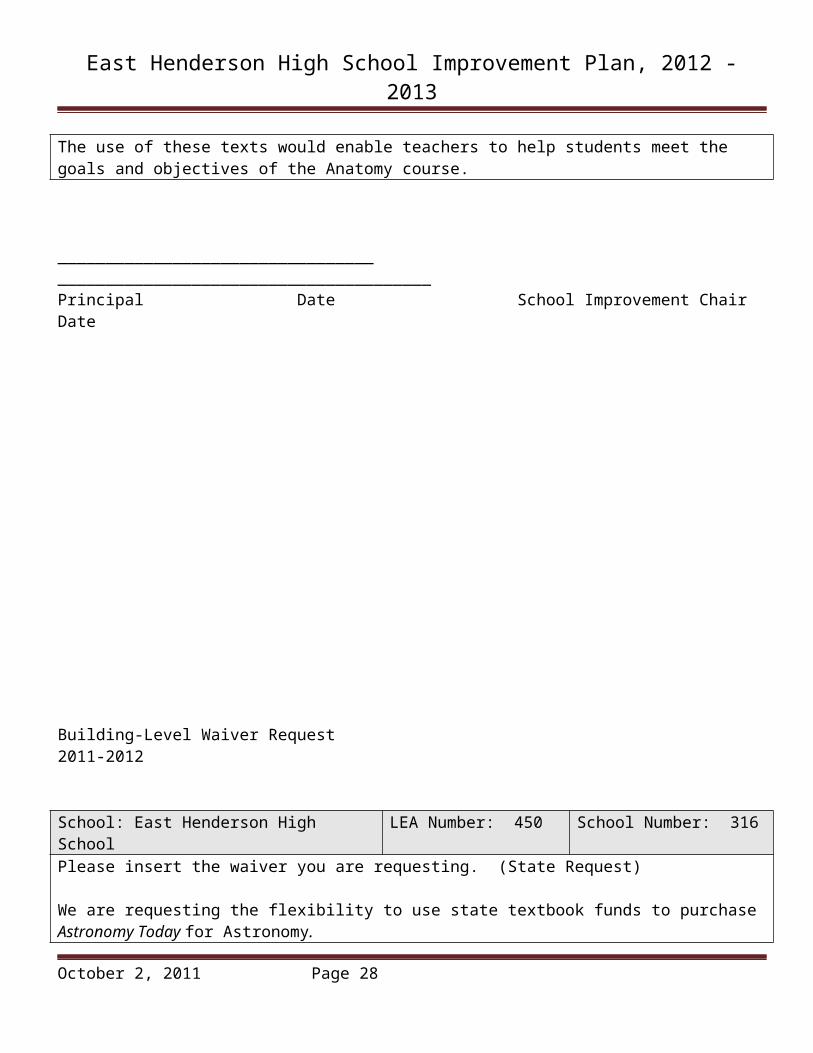
The use of these texts would enable teachers to help students meet the goals and objectives of the Anatomy course.
_________________________________ _______________________________________Principal Date School Improvement Chair Date
Building-Level Waiver Request2011-2012
October 2, 2011 Page 17

East Henderson High School Improvement Plan, 2012 - 2013
School: East Henderson High School LEA Number: 450 School Number: 316Please insert the waiver you are requesting. (State Request)
We are requesting the flexibility to use state textbook funds to purchase Astronomy Today for Astronomy.
Identify the law, regulation or policy from which you are seeking an exemption.
General Statute 115c-9b. Use of textbooks not adopted by the State Board of Education
Please state how the waiver will be used.
Since there is not a state adopted textbook for Astronomy, we request flexibility to use state textbook funds to purchase these books.
Please state how the waiver will promote achievement of performance goals.
The use of these texts would enable teachers to help students meet the goals and objectives of the Astronomy course.
_________________________________ _______________________________________Principal Date School Improvement Chair Date
Building-Level Waiver Request2011-2012
October 2, 2011 Page 18

East Henderson High School Improvement Plan, 2012 - 2013
School: East Henderson High School LEA Number: 450 School Number: 316Please insert the waiver you are requesting. (State Request)
We are requesting the flexibility to use state textbook funds to purchase Diversified Health Occupations for Allied Health.
Identify the law, regulation or policy from which you are seeking an exemption.
General Statute 115c-9b. Use of textbooks not adopted by the State Board of Education
Please state how the waiver will be used.
Since there is not a state adopted textbook for Allied Health, we request flexibility to use state textbook funds to purchase these books.
Please state how the waiver will promote achievement of performance goals.
The use of these texts would enable teachers to help students meet the goals and objectives of the Allied Health course.
_________________________________ _______________________________________Principal Date School Improvement Chair Date
Building-Level Waiver Request2011-2012
School: East Henderson High School LEA Number: 450 School Number: 316Please insert the waiver you are requesting. (State Request)
October 2, 2011 Page 19

East Henderson High School Improvement Plan, 2012 - 2013
We are requesting the flexibility to use state textbook funds to purchase Environmental Science and Technology for Environmental Science.
Identify the law, regulation or policy from which you are seeking an exemption.
General Statute 115c-9b. Use of textbooks not adopted by the State Board of Education
Please state how the waiver will be used.
Since there is not a state adopted textbook for Environmental Science, we request flexibility to use state textbook funds to purchase these books.
Please state how the waiver will promote achievement of performance goals.
The use of these texts would enable teachers to help students meet the goals and objectives of the Environmental Science course.
_________________________________ _______________________________________Principal Date School Improvement Chair Date
Building-Level Waiver Request2011-2012
School: East Henderson High School LEA Number: 450 School Number: 316Please insert the waiver you are requesting. (State Request)
We are requesting the flexibility to use state textbook funds to purchase Reading for Writers for English III.
October 2, 2011 Page 20

East Henderson High School Improvement Plan, 2012 - 2013
Identify the law, regulation or policy from which you are seeking an exemption.
General Statute 115c-9b. Use of textbooks not adopted by the State Board of Education
Please state how the waiver will be used.
Since there is not a state adopted textbook for English III, we request flexibility to use state textbook funds to purchase these books.
Please state how the waiver will promote achievement of performance goals.
The use of these texts would enable teachers to help students meet the goals and objectives of the English III course.
_________________________________ _______________________________________Principal Date School Improvement Chair Date
October 2, 2011 Page 21

East Henderson High School Improvement Plan, 2012 - 2013
Comprehensive Needs Assessment
We identified 4 types of data to examine as described below.
I. Demographic data describe the students, the staff, the school and the surrounding community. This information delineates the context in which the school operates and is crucial for understanding all other data. By disaggregating information by demographics, we can understand what impact the educational system is having on different groups of students.
II. Student Learning data include variety of measurements – norm-referenced tests, criterion-referenced tests, standard assessments, teacher-assigned grades, discipline referral and attendance data, student score predictions and at-risk information.
III. Perceptions data is gathered through questionnaires, interviews, and observations that help us understand what students, parents, teachers, and the community think about the learning environment. Foremost among this data is the Teachers’ Working Conditions Survey.
IV. School processes data include the school’s programs, instructional strategies, assessment strategies, and classroom practices.
October 2, 2011 Page 22

East Henderson High School Improvement Plan, 2012 - 2013
Data Sources
Demographic DataAbout StudentsSchool SizeAverage Class SizeEthnicityEconomically DisadvantagedLanguage ProficiencyMobilityRetention RatesGraduation RatesDropout RatesHonors/Advanced PlacementCTP/CUP CompletersOther
About Staff
Number of Classroom TeachersFully Licensed TeachersPercentage of Classes Taught by Highly Qualified TeachersTeachers with Advanced degreesNational Board Certified TeachersYears of Teaching ExperienceTeacher Turnover RateTeacher AbsencesOther
About the SchoolSchool HistorySchool Safety
Student Out-of-School suspensions and ExpulsionsCommunity SupportSpecial Programs OfferedOther
About the CommunityLocationMakeup of the PopulationEconomic BaseTypes of Employers in the CommunityCommunity/Business InvolvementProjections of GrowthOther
Student Learning DataPerformance on ABCs End-of-Course TestsPerformance on End-of-Course Tests by Student Groups10th Grade High School Comprehensive Test10th Grade Writing ScoresSAT ResultsTeacher Assigned Final Grade DistributionTeacher’s Use of Authentic or Portfolio AssessmentsSchool PerformanceConclusions and Implications for Student Improvement
Perception Data (From Stakeholders)School Process Data
Demographic DataDemographic data describe the students, the school staff, and the surrounding community. This information delineates the context in which the school operates and is crucial for understanding all data. By disaggregating information by demographics, we can understand what impact the school is having on different groups of students
October 2, 2011 Page 23

East Henderson High School Improvement Plan, 2012 - 2013
School: EAST HENDERSON
About StudentsSchool SizeThe total number of students in your school, and the average number of students in schools with similar grade ranges in your district and the state. (Source: state school report card)
2002-2003
2003-2004
2004-2005
2005-2006
2006-2007
2007-2008
2008-2009
2009-2010
2010-2011
2011-2012
Our School 955 956 1018 1029 1003 983 951 943 960 970
District 843 865 896 911 899 900 898 724 751 764
State 994 1017 1026 1004 989 854 826 793 794 829
Average Class Size (Source: state school report card)
2002-03 Eng I Alg I Alg II Geom Bio Chem PSCI Physic ELPS US History
Our School 16 17 25 22 20 19 16 17 19 20District 15 18 20 19 17 18 12 13 17 17State 18 19 21 21 20 20 19 16 20 19
2003-04 Eng I Alg I Alg II Geom Bio Chem PSCI Physic ELPS US History
Our School 19 20 26 21 21 20 13 21 --- ---District 18 21 22 20 18 19 11 14 --- ---State 19 19 22 21 20 20 19 16 --- ---
2004-05 Eng I Alg I Alg II Geom Bio Chem PSCI Physic ELPS US History
Our School 21 19 23 20 21 23 22 18 --- ---District 19 21 23 25 21 20 19 16 --- ---State 20 21 23 23 21 21 21 17 --- ---
2005-2006 Eng I Alg I Alg II Geom Bio Chem PSCI Physic Civic US History
Our School 24 23 23 24 25 23 23 15 24 24District 20 23 20 20 21 22 18 13 20 20State 19 20 20 19 19 19 18 15 19 19
October 2, 2011 Page 24

East Henderson High School Improvement Plan, 2012 - 2013
Average Class Size (cont.)
2006-2007 Eng I Alg I Alg II Geom Bio Chem PSCI Physic Civic US History
Our School 19 17 20 21 20 21 20District 15 20 19 16 17 18 16State 16 18 17 17 15 16 15
2007-2008 Eng I Alg I Alg II Geom Bio Chem PSCI Physic Civic US History
Our School 19 20 19 20 20 19 19 9 19 19District 19 21 20 19 17 19 18 9 18 19State 17 19 19 19 17 18 17 14 18 18
2008-2009 Eng I Alg I Alg II Geom Bio Chem PSCI Physic Civic US History
Our School 18 19 25 19 19 19 17 17 22 20District 19 21 24 21 18 17 19 14 19 17State 18 19 19 19 17 17 17 14 18 17
2009-2010 Eng I Alg I Alg II Geom Bio Chem PSCI Physic Civic US History
Our School 18 18 21 23 18 19 22 18District 17 21 22 22 17 17 19 18State 18 20 20 20 18 18 18 18
2010-2011 Eng I Alg I Alg II Geom Bio Chem PSCI Physic Civic US History
Our School 18 17 24 18 17 21 21District 19 21 20 18 16 19 18State 18 20 20 18 18 19 18
2011-2012 Eng I Alg I Alg II Geom Bio Chem PSCI Physic Civic US History
Our School 24 22 21District 20 22 19State 18 20 18
October 2, 2011 Page 25

East Henderson High School Improvement Plan, 2012 - 2013
3. Ethnicity(20 days report and Mo. 9 PMR)
Year 2006-07 2007-2008 2008-2009 2009-2010 2010-11 2011-12
Sub-Group
Our School Dist Our
School Dist Our School Dist Our
School Dist Our School Dist Our
School Dist
Male 51 51 51 51 49.7 51 52 na 53 na 53.7 na
Female 49 49 49 49 50.3 49 48 na 47 na 46.3 na
Amer Indian .6 0 .2 .3 .2 .4 .2 na .4 na .5 na
Asian .7 1.0 .9 1.4 1.3 1.4 .9 na 1.0 na 1.2 na
Hisp 12.4 14.0 12.2 14 11.6 15 12.2 na 15.2 na 16.9 na
Black 2.6 8.0 2.0 3.9 1.8 3.9 2.5 na 1.9 na 2.2 na
Multi Racial 1.0 -- 1.8 4.4 3.0 4.8 2.0 na 5.5 na 3.8 na
Total Min 17.2 23.0 17.0 24.0 17.9 25.5 17.8 na 24.0 na 24.6 na
4. Economically DisadvantagedThe percent of students who qualify for free or reduced lunch in our school.
2002-03
2003-04
2004-05
2005-06
2006-07
2007-08
2008-09
2009-10
2010-11
2011-12
Our School 24.8 29.8 34.6 34.4 26.3 28.5 31.9 41.6 48.8 50.7
District 38.1 39.3 40.7 39.4 43.1 46.0 48.4 50.5 52.8 55.1
State 43.5 46.5 47.7 na na na na na na na
October 2, 2011 Page 26
East Henderson High School Improvement Plan, 2012 - 2013
5. Language ProficiencyThe percent of students enrolled in our school who qualify as limited English Proficiency. (Source: HCPS LEP data base)
2002-2003
2003-2004
2004-2005
2005-2006
2006-2007
2007-2008
2008-2009
2009-2010
2010-2011
2011-2012
Our School 5 6 8 14 6 5 6 6 6 5
District 7 7 8 7 10 10 11 10 10 11
State .05 .05 .06 .06 na na na na na na
6. MobilityThe percent of students enrolled who joined or left our school since the first day of school (Source: principal’s 9th month report)
2002-2003
2003-2004
2004-2005
2005-2006
2006-2007
2007-2008
2008-2009
2009-2010
2010-2011
2011-2012
Our School 15 17 17 16 15 14 12 17District 23 24 23 25 21 19 17 na na na
Retention Rates
2006-07 Our school District 2007-08 Our School District 2008-09 Our
school District
Grade 9 16.4 11.6 Grade 9 14.7 8.5 Grade 9 10.2 9.2
Grade 10 8.0 5.8 Grade 10 11.3 7.3 Grade 10 4.4 4.0
Grade 11 5.8 4.7 Grade 11 7.1 2.5 Grade 11 2.2 3.2
Grade 12 3.8 1.3 Grade 12 5.0 2.2 Grade 12 1.3 1.5
2009-10 Our school District 2010-11 Our school District 2011-12 Our
school District
Grade 9 7.4 6.1 Grade 9 10 5.2 Grade 9 8.0 na
Grade 10 7.3 4.3 Grade 10 6 5.5 Grade 10 8.3 na
Grade 11 2.9 2.6 Grade 11 4 4.6 Grade 11 3.6 na
Grade 12 1.5 1.3 Grade 12 2 1.3 Grade 12 3.0 na
October 2, 2011 Page 27
East Henderson High School Improvement Plan, 2012 - 2013
Graduation RatesSource: State School Report Cards
2002-03
2003-04
2004-05
2005-06
2006-07
2007-08
2008-09
2009-10
2010-11
2011-12
Our School >95 94.8 94.8 78.4 80.6 86.3 80.9 84.7 80.8 81.3
District >95 >95 >95 74.5 79.0 79.4 79.3 79.0 82.9 84.9
State >95 >95 >95 68.7 69.5 70.3 71.7 74.2 77.9 80.9
Dropout RatesSource: DPI Dropout Statistics (7-12)
2002-03
2003-04
2004-05
2005-06
2006-07
2007-08
2008-09
2009-10
2010-11
2011-12
Our School 4.6 4.8 3.7 3.8 4.2 3.9 2.8 1.9 1.7 3.0
District 3.6 3.8 3.4 3.9 4.0 4.4 na 2.6 2.3 2.6
State 3.2 3.3 4.7 5.0 5.2 5.0 na na na na
Honors/Advanced Placement (Source: State School Report Cards)
Percentage of Total Course enrollment in:
2008-2009 2009-2010 2010-2011 2011-12AP or IB, CC and U
CTE** AP or IB, CC and U CTE** AP or IB,
CC and U CTE** AP or IB, CC and U CTE**
Our School 4 17 4 17 2 16 3 17
District 4 16 4 16 4 16 6 15
State 4 15 5 15 5 15 5 15
CTP/CUP Completers
2002-03
2003-04
2004-05
2005-06
2006-07
2007-08
2008-09
2009-10
2010-11
2011-12
Our School 71.5% 74.4% 80.8% 83.8% 89.7% 93.3% 99% 98% 99% 97%
About StaffClassroom Teachers(Source: State School Report Cards)
2002-03
2003-04
2004-05
2005-06
2006-07
2007-08
2008-09
2009-10
2010-11
2011-12
October 2, 2011 Page 28

East Henderson High School Improvement Plan, 2012 - 2013
Our School 69 70 71 74 76 75 73 70 71 70
District 60 61 61 63 64 65 64 52 52 52
State 69 69 71 69 63 61 59 54 52 54
Fully Licensed Teachers(Source: State School Report Cards)
2002-03
2003-04
2004-05
2005-06
2006-07
2007-08
2008-09
2009-10
2010-11
2011-12
Our School 86 87 89 89 96 95 89 90 92 97District 89 89 91 90 95 95 94 94 94 97State 82 82 85 84 89 89 59 93 94 94
Percentage of Classes Taught by Highly Qualified Teachers(Source: State School Report Cards)
2002-03
2003-04
2004-05
2005-06
2006-07
2007-08
2008-09
2009-10
2010-11
2011-12
Our school 94 100 92 100 98 100 100 100 100 100
District 94 96 89 99 99 99 99 99 100 100
State 97 97 88 91 96 96 97 96 97 98
Teachers with Advanced Degrees(Source: State School Report Cards)
2002-03
2003-04
2004-05
2005-06
2006-07
2007-08
2008-09
2009-10
2010-11
2011-12
Our School 28 29 29 31 30 29 29 31 34 34District 36 36 35 34 34 33 32 32 31 32State 26 26 25 25 25 25 25 26 26 27
National Board Certified Teachers(Source: School Report Cards)
2002-03
2003-04
2004-05
2005-06
2006-07
2007-08
2008-09
2009-10
2010-11
2011-12
Our School 6 6 10 14 17 17 20 20 22 21District 4 6 8 9 12 15 16 13 16 16State 4 6 7 7 8 8 8 8 9 10
Years of Teaching Experience(Source: State School Report Cards)
2008-2009 2009-2010 2010-11 2011-12
0-3 4-10 10+ 0-3 4-10 10+ 0-3 4-10 10+ 0-3 4-10 10+
October 2, 2011 Page 29

East Henderson High School Improvement Plan, 2012 - 2013
yrs yrs yrs yrs yrs yrs yrs yrs yrs yrs yrs yrsOur School 15 29 56 19 29 53 18 30 52 16 29 56District 11 27 62 14 29 60 14 30 57 14 26 60State 21 27 52 19 28 54 18 28 54 18 28 55
Teacher Turnover Rate (Source: State School Report Cards.
2002-03
2003-04
2004-05
2005-06
2006-07
2007-08
2008-09
2009-10
2010-11
2011-12
Our School 15 17 9 10 10 9 24 12 11 4District 11 12 13 10 12 8 13 10 13 8State 16 20 19 20 22 14 14 13 134 14
Teacher Absences(Source: School Data)
2002-03
2003-04
2004-05
2005-06
2006-07
2007-08
2008-09
2009-10
2010-11
2011-12
Our School 9.7 8.8 9.9 9.2 8.9 12.5 8.5 7.4 6.9 7.2
*This data includes sick, personal, and professional leave days, including absences for long-term events such as disability and maternity. The number was calculated by dividing the total number of absences of the entire faculty by the number of faculty members.
About the School
School HistoryEast Henderson High School was built in 1960. In 1972, an additional building was constructed to house the vocational classes. In 1992, a major renovation occurred which included the addition of a gym, arts classrooms, vocational classroom, media center and updating all other classrooms. In 2000, a practice field was added for the fall sports teams and a baseball field was constructed at the school. In 2001, dugouts were built on the softball field. In the summer of 2005, additional walkways were added to the stadium bleachers. In the spring of 2007, additional parking was added at the baseball field. In the spring/summer of 2007 a new field house/concession stand/public restrooms began to be constructed at the football field. In 2008 and 2009, new security gates were added at the entrances to the campus. In 2010, a new front gate was completed. In 2011, the road south of the B Building was rebuilt, connecting all parking lots to each other. In the summer of 2012, major grading and renovations were completed in the agricultural studies part of campus. From 1960 until 1992, East Henderson was a 10-12 high school. Since 1992, East Henderson has been a 9-12 school.
October 2, 2011 Page 30

East Henderson High School Improvement Plan, 2012 - 2013
School Safety DataThe number of acts of crime or violence per 100 students(Source: State School Report Cards
2002-03 2003-04 2004-05 2005-06 2006-07 2007-08 2008-09 2009-10 2010-11 2011-12
Our School 1.7 .2 1.8 1.4 1 3 2 1 .2 1.3
District 1 1 1 1 1 1 0 0 .6 .9
State 1 1 2 2 1 1 1 2 1.5 1.4
Student Out-of-School Suspensions & Expulsions(Source: State School Report Cards)
2003-04 2004-05 2005-06
ST Susp LT Susp Expul ST Susp LT Susp Expul ST Susp LT Susp ExpulOur School 12 0 0 10 2 0 20.1 .1 0
District 8 0 0 6 0 0 na na na
2006-07 2007-2008 2008-2009
ST Susp LT Susp Expul ST Susp LT Susp Expul ST Susp LT Susp ExpulOur School 14 0 0 13 1 0 14 0 0
District 6 0 0 11 0 0 12 0 0
2009-2010 2010-2011 2011-2012
ST Susp LT Susp Expul ST Susp LT Susp Expul ST Susp LT Susp ExpulOur School 18 0 0 18 .21 0 12 0 0
District 10 0 0 8 .05 0 9 0 0
October 2, 2011 Page 31

East Henderson High School Improvement Plan, 2012 - 2013
Community SupportBelow is brief list of some of the community involvement:Study Employment through the OCS programParent Volunteers – proctors, tutoring, teacher support, Project GraduationArea Building and Landscaping Businesses – Support for Carpentry and Horticulture programsArea Business who provide fabric and prizes – CTE classesTimes News – Free Newspapers in the Classroom ProgramVFW – Speakers and ScholarshipsArea Civic OrganizationsVisiting Artists and Arts OrganizationsArea ChurchesCongressman Heath Shuler’s officeFlat Rock Playhouse
Special Programs OfferedAir Force Junior ROTCAP courses27 sports programsMasonry, Carpentry, Horticulture, Culinary Arts, Health Occupations, Clothing and Interior Design, Drafting, Marketing, Travel and Tourism, E-commerce, Accounting, and ParentingDance, Choral Music, Theater, Orchestra, Visual Arts, and BandCore 44 and Careers Classes with Blue Ridge Community CollegeDistance learning courses with Blue Ridge Community CollegeOccupational Course of Study, Multi-handicapped, BED, TMH, and inclusion opportunities for LD studentsAIG, AP, Honors classes in all core subject areas and in arts, Governor’s schoolApprenticeships and internshipsAIM (Action, Inspiration, Motivation) ClubSEAT: Students Encouraging Acceptance and ToleranceAcademic competitions which include: Debate Team, Regional Math competition, Regional Knowledge Bowl, Robotics competitionNorth Carolina Virtual Public School
About the CommunityEast Henderson High School is located in the southeastern area of Henderson County in the community of East Flat Rock. The school is located less than a mile from Interstate 26 at the junction of Upward Road and Fairground Avenue. It serves the communities of East Flat Rock, Flat Rock, Dana, Tuxedo, Zirconia, Saluda, Valley Hill, Upward, and south Hendersonville.
October 2, 2011 Page 32

East Henderson High School Improvement Plan, 2012 - 2013
Makeup of the population(Source: 2010 census)
Characteristics Number Percent US %Total Population 89,173 100 100%Male 43,141 48.4 49.1%Female 46,002 51.6 50.9%White 82,505 92.5 75.1%Black 2,725 3.1 12.3%Am. Indian or Alaska Native 245 .3 .9%Asian 546 .6 3.6%Some other race 2,237 2.5 5.5%Multi-race 899 1.0 2.4%Hispanic or Latino (of any race) 4,880 5.5 12.5%Average household size 2.33 --- 2.59Average family size 2.78 --- 3.14Median Age (years) 42.7 X 35.3Under 5 years 5,007 5.6 6.8%18 years and over 70,621 79.2 47.3%65 years and over 19,341 21.7 12.4%Level of EducationLess than 9th grade --- 6.5 6.99th to 12th grade, no diploma --- 10.3 11.5High School graduate --- 29.2 29.5Some college, no degree --- 22.7 20.5Associate degree --- 7.2 6.5Baccalaureate degree --- 15.6 16.1Graduate or professional degree --- 8.5 9.0
October 2, 2011 Page 33

East Henderson High School Improvement Plan, 2012 - 2013
Economic Base41,450 people (16 years or older) representing 57% of the population are in the labor force. (2000 Census)The unemployment rate for 2000 is 2.1%, compared to state rate of 3.6% and national rate of 4.0% (Hendersonville Chamber of Commerce)In 2003, the largest economic engine for Henderson County is retail sales ($1.1 billion), which continues to show an increase every year. Other economic engines for the county are manufacturing (295 million), retirement (284 million), tourism (173 million), and agriculture (146 million) (Hendersonville Chamber of Commerce, 2003).40% of households in Henderson County have incomes less than 200% of the poverty line (Henderson County Work First Plan 2005-07).Since 1990 the median income in Henderson County has only increased by 5%, compared to a statewide increase of 10% (Henderson County Work First Plan 2005-07).The median income in Henderson County is $38,109, while income earned from employment is only $28,704 (2020 Plan for Henderson County).
Types of employmentThe largest employer in Henderson County is the Public School System (1,666), followed by Pardee Hospital (1,400), GE Lighting Systems (750), Park Ridge Hospital (732), Wilsonart International (720), Henderson County Government (652), Wal-Mart Super Center (650), ArvinMeritor Automotive, Inc. (590), Manual Woodworkers & Weavers (577), Ingles (539), BorgWarner Cooling Systems (450), Continental Teves (400), Kimberly Clark Corp. (400). (Hendersonville Chamber of Commerce, 2003)Over 125 manufacturing establishments in Henderson County employ approximately 7,000 workers which is 16.1% of the private workforce. The largest are: General Electric, Kimberly-Clark, ArinMeritor, Continental Teves, BorgWarner, and Wilsonart International (Hendersonville Chamber of Commerce).In the past 2 years, 1900 jobs have been lost to plant closings, while on 200 jobs in manufacturing have been created in the same time frame. Service jobs are the largest growing sector of employment in Henderson County, representing 28% of jobs. While the services sector is the largest, it also yields the lowest annual wage of less than $26,000 per year (Henderson County Work First Plan 2005-07).
Community/business involvementThe Henderson County community supports East Henderson in many ways:Study Employment through the OCS programParent Volunteers – proctors, tutoring, teacher support, Project GraduationArea Medical Providers and area hospitals – Allied Health ProgramArea Building and Landscaping Businesses – Support for the Carpentry and Horticulture programsArea Specialists – Guest SpeakersVFW – Speakers and ScholarshipsArea Civic OrganizationsVisiting Artists and Arts OrganizationsArea ChurchesFlat Rock Playhouse
Projections for growthThe East Henderson community has an abundance of available land and is conveniently located close to South Carolina. Many new homes are being built in this desirable area and the student population for East Henderson is expected to grow in the next few years. Affordable land is available for development in this part of the county. A trend of growth in East Henderson’s student population as well as student numbers from the feeder schools of Upward, Dana, Hillandale, and Atkinson substantiate this expectation.
October 2, 2011 Page 34

East Henderson High School Improvement Plan, 2012 - 2013
Student Learning Data(Source: State School Report Cards)
Overall Student Performance
2006-07 Eng I Alg I Alg II Geom Biology Chem PSCI Physics ELPS US Hist
Our School 80.0 70.0 58.0 62.0 81.0 79.0 80.0Tests Taken 244 267 200 239 247 259 231District 82.0 75.0 75.0 75.0 80.0 78.0 75.0State 72.0 67.0 65.0 63.0 65.0 66.0 65.0
2007-08 Eng I Alg I Alg II Geom Biology Chem PSCI Physics Civic US Hist
Our School 79.9 70.5 55.4 56.7 70.2 64.1 58.2 83.3 74.0 75.8Tests Taken 244 241 213 203 262 181 55 18 246 219District 83.5 77.3 68.4 71.9 75.0 74.9 59.8 86.7 73.5 77.6State 73.1 69.0 67.2 67.9 68.0 71.8 58.4 81.5 68.5 66.5
2008-09 Eng I Alg I Alg II Geometry Biology Chemis
try PSCI Physics Civic US Hist
Our School 75.5 67.4 56.9 72.4 77.8 67.2 56.9 76.2 71.4 65.5Tests Taken 265 236 204 174 270 186 51 21 224 203District 81.7 71.2 74 77.5 80.1 73.5 67.4 87.1 80.1 72.5State 73.8 67.7 72.9 73.3 71.2 77.7 62.7 85.9 71.4 71.2
2009-10 Eng I Alg I Alg II Geometry Biology PSCI Civic US Hist
Our School 90.0 78.7 90.3 93.3 82.3 77.1 78.9 79.0Tests Taken 240 239 195 90 243 96 242 195District 89.2 82.4 93.2 88.9 84.4 78.0 81.9 83.2State 82.4 77.8 84.9 82.3 81.1 76.4 78.7 81.6
2010-11 Eng I Alg I Alg II Biology PSCI Civic US Hist
Our School 84.1 80.3. 81.2 82.4 75.0 84.0 74.2Tests Taken 245 239 149 221 68 256 236District 85.3 83.0 86.6 86.0 76.1 86.7 81.0State 80.6 76.7 82.3 79.9 76.5 80.0 81.5
2011-12 Eng I Alg I Alg II Biology PSCI Civic US Hist
Our School 87.4 81.1 83.6Tests Taken 261 238 287District 88.0 82.4 86.9State 82.9 78.7 83.0
Student Performance Data by Student Groups
October 2, 2011 Page 35

East Henderson High School Improvement Plan, 2012 - 2013
(Source: State School Report Cards)
2005-06 All Male Fem White Black Hisp Amer Ind
AsianPacIsland
Multi-Racial LEP Migr
Stud
Stud with Dis-ability
Our School 77.8 80.9 74.5 81.0 45.9 53.3 75.0 >95 85.0 40.2 52.9 51.9
Tests Taken 1910 981 929 1656 37 180 8 9 20 97 17 154
District 80.9 82.9 78.8 83.5 59.8 65.4 64.0 79.7 74.8 44.1 63.5 58.6
State 71.8 72.6 71.1 81.2 52.9 60.1 62.7 80.2 75.4 42.5 45.1 45.6
2006-07 All Male Fem White Black Hisp Amer Ind Asia Multi-
Racial LEP Migr Stud
Stud with Dis
Our School 73.3 74.5 72.2 75.1 65.5 55.7 87.5 75.0 87.5 42.0 -- 49.6
Tests Taken 1,687 826 861 1,460 29 158 8 16 474 69 -- 121
District 77.2 78.5 75.9 80.2 58.3 58.5 66.7 84.7 67.5 38.9 -- 63.2
State 66.4 66.8 66.1 77.0 45.7 55.0 55.2 78.1 69.6 38.7 -- 38.2
2007-08 All Male Fem White Black Hisp Amer Ind
AsianPacIsland
Multi-Racial LEP Migr
Stud
Stud with Dis
Our School 68.7 68.3 69.1 72.0 33.3 50.5 66.7 54.5 72.2 61.5 72.0 34.0
Tests Taken 1,882 927 955 1,578 36 204 6 22 36 595 1,287 100
District 75.2 76.0 74.5 77.6 51.8 62.8 55.0 81.1 79.5 64.9 79.5 46.0
State 68.4 68.8 68.2 78.5 48.6 59.1 58.6 80.6 71.9 53.6 76.0 45.4
2008-09 A M F Wh Blk Hsp Am Ind
A-PIsle
MultRace E.D. N.E.
D LEP Migr Stud
Stud with Dis
Our School 69.5 97.0 71.8 72.3 27.8 59.2 n/a 72.4 64.2 60.9 74.3 45.5 n/a 53.8
Tests Taken 1834 901 933 1480 36 218 n/a 29 67 665 1169 99 n/a 143
District 76.3 76.7 75.9 78.7 54.2 66.6 66.7 80.7 72.1 67.5 81.0 51.1 All 69.8
State 71.4 71.6 71.3 81 53.2 63.6 62.6 83.3 74.0 58.0 79.1 52.1 48.7 43.9
October 2, 2011 Page 36

East Henderson High School Improvement Plan, 2012 - 2013
2009-10 All M F Wh Blk Hsp Am Ind
A-PIsle
MultRace E.D. N.E.
D LEP Migr Stud
Stud with Dis
Our School 83.3 82.5 84.1 87.2 58.6 61.9 N/A 75.0 84.3 76.9 88.9 44.2 62.5 59.0
Tests Taken 1540 802 738 1262 29 189 N/A 8 51 720 820 95 8 144
Dist 85.1 84.5 85.8 87.7 68.1 73.1 55.6 92.3 84.9 77.6 90.7 51.5 63.6 58.2
State 80.7 80.1 81.3 88.5 67.0 74.1 71.7 88 83.3 70.9 87.9 55.8 62.3 84.9
2010-11 All M F Wh Blk Hsp Am Ind
A-P Isle
Multi-Racial
E.D. N.E.D LEP Migr
Stud
Stud with Dis-
Our School 80.8 79.7 82.0 84.0 85.0 68.9 40.0 81.3 85.3 75.6 86.1 52.2 42.9 45.3
Tests Taken 1414 779 635 1059 25 241 5 16 68 717 697 90 7 170
Dist 84.2 82.1 86.5 86.7 63.2 76.0 84.2 88.3 85.1 76.8 90.3 49.6 42.9 50.6
State 79.7 78.4 81.0 87.7 66.0 74.0 71.3 86.6 82.6 69.4 88.2 48.7 59.2 45.0
2011-12 All M F Wh Blk Hsp Am Ind
A-P Isle
MultRace E.D. N.E.
D LEP Migr Stud
Stud with Dis-
Our School 84.1 79.5 89.2 86.4 57.9 76.3 na 87.5 90.9 79.3 89.5 51.1 71.4 47.7
Tests Taken 786 414 372 596 19 135 na 8 22 415 371 45 7 109
Dist 85.7 81.5 90.4 87.9 72.6 75.3 80 94.7 89.8 78.8 92.2 49.1 77.8 49.2
State 81.4 78.5 84.4 89.0 68.6 75.1 75.9 87.3 84.8 71.8 90.9 49.9 66.2 41.5
10th Grade Writing Scores
2004-2005
2005-2006
2006-2007
2007-2008
2008-2009
2009-2010
2010-2011
2011-2012
Our School 52 52.3 55.0 83.0 74.0 70.0 74.6 NA
October 2, 2011 Page 37

East Henderson High School Improvement Plan, 2012 - 2013
SAT Results(Source: State School Report Card)
2004-05 2005-06 2006-07 2007-08
Part. Rate
Average Total SAT
Part. Rate
Average Total SAT
Part. Rate
Average Total SAT
Part. Rate
Average Total SAT
Our School 44 1047 45.4 1054 49 1048 39.8 1073
District 54 1066 51.8 1056 57 1053 52.4 1055
State 74 1010 71 1010 71 1004 63.0 1007
Nation 49 1028 48 1021 48 1017 45.0 1017
2008-2009 2009-2010 2010-2011 2011-2012
Part Rate Average Total SAT Part Rate
Average Total SAT
Part RateAverage
Total SAT
Part RateAverage
Total SAT
Our School 40.1 1032 42 1040 51 1028 50 1025
District 52.2 1050 51 1032 55 1040 56 1042
State 63.0 1006 63 1008 67 1001 68 997
Nation 45 1016 47 1017 50 1011 52 1010
F. Teacher Assigned Final Grade Distribution(Source: School Data)
Our School 2004-05
2005-06
2006-07
2007-08
2008-09
2009-10
2010-11
2011-12
% Students Earning A’s 33 35 33 35 37 38 35 39
% Students Earning B’s 29 28 27 27 29 27 29 27
% Students Earning C’s 19 19 19 19 18 18 19 18
% Students Earning D’s 11 10 11 10 10 11 10 9
% Students Earning F’s 6 6 8 7 5 6 7 7
Teacher’s Use of Authentic AssessmentsThe teachers of East Henderson use authentic and traditional assessment. Some examples of the types of assessment used, other than testing, are hands-on experiences in career and technical education where students must apply what they have learned, verbal competence assessments in foreign language courses, performances and peer review in arts courses, technology presentations, and portfolios for interns. Many teachers use scoring rubrics with writing assignments, presentations, and other projects.
October 2, 2011 Page 38

East Henderson High School Improvement Plan, 2012 - 2013
School PerformanceEach year, schools in North Carolina may receive several designations based on their performance on the state’s ABCs test. Those designations are awarded on the basis of the percentage of students performing at grade level and on whether students have learned as much as they are expected to learn in one year. The designations earned by your school are displayed below, followed by a brief description of each designation
October 2, 2011 Page 39

East Henderson High School Improvement Plan, 2012 - 2013
Adequate Yearly Progress (AMO) ResultsNorth Carolina has set target goals that schools must meet to make Annual Measurable Objectives under the federal No Child Left Behind Act.
Designation Performance: Percent of Students at level III/IV
Growth:Learning achieved in one year
2005-06 76.4 School of Progress, Expected Growth
2006-07 71.6 School of Progress, High Growth
2007-08 70.3 School of No Recognition, No Growth
2008-09 70.7 School of No Recognition, No Growth
2009-10 82.3 School of Distinction, Expected Growth
2010-11 80.8 School of Distinction, Expected Growth
201112 84.1 School of No Recognition, No Growth
AYP Targets
2007-08 Our school did not make adequate yearly progress. We met 8 of our 13 performance targets.
2003-04 Our school did make adequate yearly progress. We met 13 of our 13 performance targets.
2004-05 Our school did make adequate yearly progress. We met 13 of our 13 performance targets.
2005-06 Our school did make adequate yearly progress. We met 13 of our 13 performance targets.
2006-07 Our school did make adequate yearly progress. We met 13 of our 13 performance targets.
2007-08 Our school didmake adequate yearly progress We met 13 of our 13 performance targets.
2008-09 Our school didmake adequate yearly progress We met 13 of our 13 performance targets.
2009-10 Our school didmake adequate yearly progress We met 13 of our 13 performance targets.
2010-11 Our school didmake adequate yearly progress We met 13 of our 13 performance targets.
2011-12Our school didnot make our Annual Measurable Objectives
We met 18 of our 19 performance targets.
Conclusions drawn from student learning data and implications for school improvement
October 2, 2011 Page 40

East Henderson High School Improvement Plan, 2012 - 2013
The student data illustrate that EHHS is a high-equity school that must now adjust its focus. By changing the way that AMOs are set, all subgroups must now compete with like groups across the state. Our school understands this change and are optimistic that we can be successful.
III. Perception Data from Stakeholders
Most Favorable ResultsThe following areas were reported as the most favorable on the survey from the indicated stakeholders.
TeachersIndex Item
4.38 Teachers are willing to give students individual help outside of class time.
4.37 Our school is doing a good job teaching fine arts.
4.21 In addition to written tests, students are provided a variety of ways to show their learning.
4.20 Teachers provide instructional activities that involve students in their learning.
4.16 In our school, students have access to a variety of resources to help them succeed.
StudentsIndex Item
3.91 I have an opportunity to participate in the activities that interest me.
3.79 In our school, students have access to a variety of resources to help them succeed.
3.79 Cheating is strongly discouraged at our school.
3.76 Teachers are willing to give me individual help outside of class time.
3.68 Students have opportunities to learn important knowledge and skills in each subject.
ParentsIndex Item
4.08 Cheating is strongly discouraged at our school.
4.02 Our school is doing a good job teaching fine arts.
4.02 In our school, students have access to a variety of resources to help them succeed.
4.00 Our school is doing a good job teaching career and vocational classes.
4.00 Our school is doing a good job teaching mathematics.
Common FindingsParent and teacher responses were positive toward the quality of education the students at East Henderson receive. Teachers and parents agree that the overall educational program offered at East Henderson is of high quality and students are prepared for the future.
October 2, 2011 Page 41

East Henderson High School Improvement Plan, 2012 - 2013
Least Favorable Results1. Teachers
Index Item
1.98 Substance abuse is not a problem at our school.
2.35 There are no problems with bullies at our school.
2.67 Students are respectful of school and community property.
2.72 School discipline is appropriately maintained at our school.
2.74 School rules apply equally to all students.
2. StudentsIndex Item
2.21 Substance abuse is not a problem at our school.
2.32 Student’s opinions are considered when important school decisions are made.
2.39 I look forward to going to school each day.
2.65 There are no problems with bullies at our school.
2.73 The amount of homework I am given helps me succeed in my studies.
3. ParentsIndex Item
2.57 Substance abuse is not a problem at our school.
2.88 There are no problems with bullies at our school.
3.13 The quality of schools influenced my decision to live in this community.
3.27 Parent opinions are considered when important school decisions are made.
3.29 Students see a relationship between what they are studying and their everyday lives.
4. Common findingsParents, students and teachers agree that substance abuse and student relationships are two areas of concern. Students and parents want to be more involved in school decisions. To address these issues, EHHS is in the process of restructuring its character education and leadership formats.
Conclusions drawn from the perception data and implications for school improvementThe perception data led the school leadership teams to spend some time discussing the differences and similarities between the teacher, student and parent survey results. Although their overall opinion of East Henderson was positive, there is not agreement between teachers and students on the quality of the education offered at East and the motivational characteristics of students. EHHS will address these issues in its safe schools and climate strategies.School Processes DataSchool process data include the school’s programs, instructional strategies, assessment strategies and classroom practices.
October 2, 2011 Page 42

East Henderson High School Improvement Plan, 2012 - 2013
Number of Books per Student (Source: State School Report Card)
2003-04 2004-05 2005-06 2006-07 2007-08 2008-09 2009-10Our School 13.68 10.76 12.45 11.63 10.68 10.64 10.64
District 17.32 18.05 17.31 18.68 18.64 17.33 18.26State 16.9 17.21 16.71 22.01 17.42 16.78 23.41
Average Age of Media Center/Library Collection (Source: State School Report Card)
2005-06 2006-07 2007-08 2008-09 2009-10 2010-11 2011-12Our School 1977 1979 1983 1985 1985 1991 1992
District 1988 1990 1991 1992 1994 1995 1996State 1990 1991 1992 1993 1993 1996 1997
Number of Students per Internet-Connected Digital Learning Device (Source: State School Report Card)
2005-06 2006-07 2007-08 2008-09 2009-10 2010-11 2011-12Our School 3.18 2.78 2.95 2.64 2.73 2.97 2.84
District 3.16 3.18 3.65 3.33 3.1 2.99 2.88State 3.24 3.06 3.31 2.72 2.4 2.14 1.79
Number of Students per Instructional Digital Learning Device (Source: State School Report Card)
2005-06 2006-07 2007-08 2008-09 2009-10 2010-11 2011-12Our School 3.19 2.78 2.79 2.64 2.73 2.97 2.84
District 3.28 3.2 2.96 3.33 3.1 2.99 2.88State 3.43 3.22 2.97 2.74 2.37 2.14 1.79
Percentage of Classrooms Connected to the Internet (Source: State School Report Card)
2005-06 2006-07 2007-08 2008-09 2009-10 2010-11 2011-12Our School 98.6 100 100 100 100 100 100
District 99.0 100 99.7 95.1 100 99.0 99.5State 98.8 99.3 99.3 99.1 99.7 97.8 98.8
Percentage of teachers using technology at least 3 times per week in the instructional program
October 2, 2011 Page 43

East Henderson High School Improvement Plan, 2012 - 2013
Currently 81% of the faculty use technology 3 times a week. This technology varies in each classroom and subject area. The use of technology is also limited by the number of available technology sources, i.e. computer lab time, number of LCD projectors, and class time to incorporate technology.
Student Participation in extended day or extended year programs
Percentage of students participating in extended day or extended year programs2003-04 N.A.2004-05 3.542005-06 5.822006-07 7.172007-08 Na2008-09 Na2009-10 3.942010-2011 5.12011-2012 6.2
October 2, 2011 Page 44

East Henderson High School Improvement Plan, 2012 - 2013
Teacher Professional LearningThe number of teachers engaging in highly qualified professional development (20+ hours inclusive of follow-up)
Percentage of teachers participating in high qualified professional development2003-04 602004-05 632005-06 1002006-07 1002007-08 1002008-09 1002009-10 1002010-2011 1002011-2012 100
Percentage of teachers routinely using differentiated student assignments
Percentage of teachers routinely using differentiated student assignments2003-04 812004-05 822005-06 852006-07 922007-08 n/a2008-09 n/a2009-10 802010-2011 822011-2012 80
October 2, 2011 Page 45