East Coast Study Project - National Geomorphic Framework ... · East Coast Study Project –...
67
Water Research Laboratory University of New South Wales School of Civil and Environmental Engineering East Coast Study Project – National Geomorphic Framework for the Management and Prediction of Coastal Erosion WRL Research Report 253 May 2013 by A Mariani, F Flocard, J T Carley, C Drummond, N Guerry, A D Gordon, R J Cox and I L Turner
Transcript of East Coast Study Project - National Geomorphic Framework ... · East Coast Study Project –...
Water Research Laboratory University of New South Wales
School of Civil and Environmental Engineering
East Coast Study Project – National Geomorphic Framework for the Management and Prediction of Coastal Erosion
WRL Research Report 253
May 2013
by A Mariani, F Flocard, J T Carley, C Drummond, N Guerry, A D Gordon, R J Cox and I L Turner
Bibliographic Data Sheet
Report Title East Coast Study Project – National Geomorphic Framework for the Management and Prediction of Coastal Erosion
Report Author(s) A Mariani, F Flocard, J T Carley, C Drummond, N Guerry, A D Gordon, R J Cox and I L Turner
Report No. 253 Report Status Final Report Date 31 May 2013 ISBN 978-0-85824-092-6 Number of Pages 107 Distribution Statement Sponsoring Organisation Geoscience Australia, Department of Climate Change and Energy Efficiency Keywords Beach Erosion, Recession, Climate Change, Probabilistic/Deterministic Approach
Document Status
Version Reviewed By Approved By Date Issued Final Draft R J Cox, I L Turner, J T Carley B M Miller 26/04/2013 Final Report J T Carley W C Glamore 31/05/2013
Water Research Laboratory 110 King Street, Manly Vale, NSW, 2093, Australia
Tel: +61 (2) 8071 9800 Fax: +61 (2) 9949 4188
ABN: 57 195 873 179
www.wrl.unsw.edu.au
Quality System certified to AS/NZS ISO 9001:2008
Expertise, research and training for industry and government since 1959
Abstract
Coastal response to extreme events and climate change was assessed at two case study sites along the coast of NSW, Australia. The applicability of deterministic and probabilistic approaches for the assessment of coastal response was evaluated. The study sites were characterised in terms of geological, oceanic and sediment transport processes. Sediment budgets were inferred with consideration to present day and future climate change scenarios. Numerical modelling techniques were used to estimate beach erosion due to storm events with average return periods ranging from 1 to 100 years. Long-term recession due to sea level rise and ongoing sediment imbalance was estimated at the two study sites for the 2100 timeframe using a coastal compartment sediment budget approach. The availability of long-term, high-quality beach and surfzone surveys was a key factor for the feasibility and reliability of both deterministic and probabilistic approaches. The investigation showed that storm sequencing and two-dimensional effects such as rip currents need to be considered in the evaluation of coastal response to extreme storm events. A sediment budget approach based on a probabilistic method provided a powerful framework for the evaluation of long-term shoreline response to climate changes.
- i -
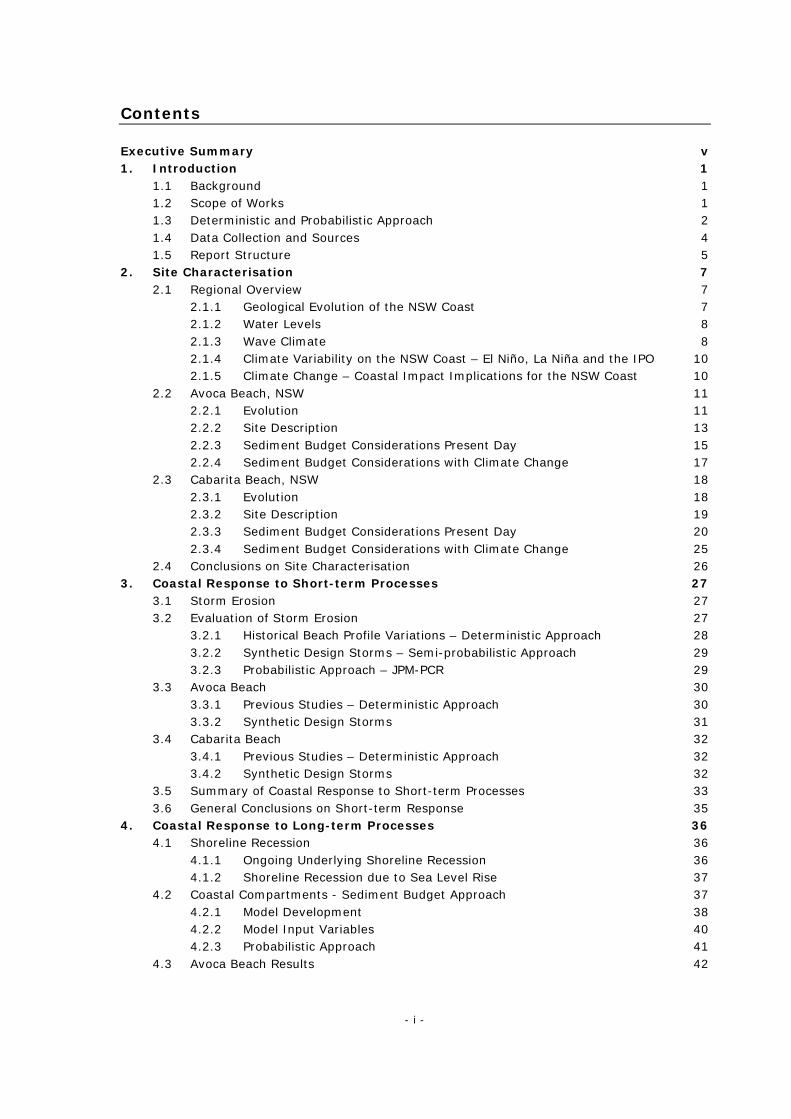
Contents
Executive Summary v 1. Introduction 1
1.1 Background 1 1.2 Scope of Works 1 1.3 Deterministic and Probabilistic Approach 2 1.4 Data Collection and Sources 4 1.5 Report Structure 5
2. Site Characterisation 7 2.1 Regional Overview 7
2.1.1 Geological Evolution of the NSW Coast 7 2.1.2 Water Levels 8 2.1.3 Wave Climate 8 2.1.4 Climate Variability on the NSW Coast – El Niño, La Niña and the IPO 10 2.1.5 Climate Change – Coastal Impact Implications for the NSW Coast 10
2.2 Avoca Beach, NSW 11 2.2.1 Evolution 11 2.2.2 Site Description 13 2.2.3 Sediment Budget Considerations Present Day 15 2.2.4 Sediment Budget Considerations with Climate Change 17
2.3 Cabarita Beach, NSW 18 2.3.1 Evolution 18 2.3.2 Site Description 19 2.3.3 Sediment Budget Considerations Present Day 20 2.3.4 Sediment Budget Considerations with Climate Change 25
2.4 Conclusions on Site Characterisation 26 3. Coastal Response to Short-term Processes 27
3.1 Storm Erosion 27 3.2 Evaluation of Storm Erosion 27
3.2.1 Historical Beach Profile Variations – Deterministic Approach 28 3.2.2 Synthetic Design Storms – Semi-probabilistic Approach 29 3.2.3 Probabilistic Approach – JPM-PCR 29
3.3 Avoca Beach 30 3.3.1 Previous Studies – Deterministic Approach 30 3.3.2 Synthetic Design Storms 31
3.4 Cabarita Beach 32 3.4.1 Previous Studies – Deterministic Approach 32 3.4.2 Synthetic Design Storms 32
3.5 Summary of Coastal Response to Short-term Processes 33 3.6 General Conclusions on Short-term Response 35
4. Coastal Response to Long-term Processes 36 4.1 Shoreline Recession 36
4.1.1 Ongoing Underlying Shoreline Recession 36 4.1.2 Shoreline Recession due to Sea Level Rise 37
4.2 Coastal Compartments - Sediment Budget Approach 37 4.2.1 Model Development 38 4.2.2 Model Input Variables 40 4.2.3 Probabilistic Approach 41
4.3 Avoca Beach Results 42
- ii -
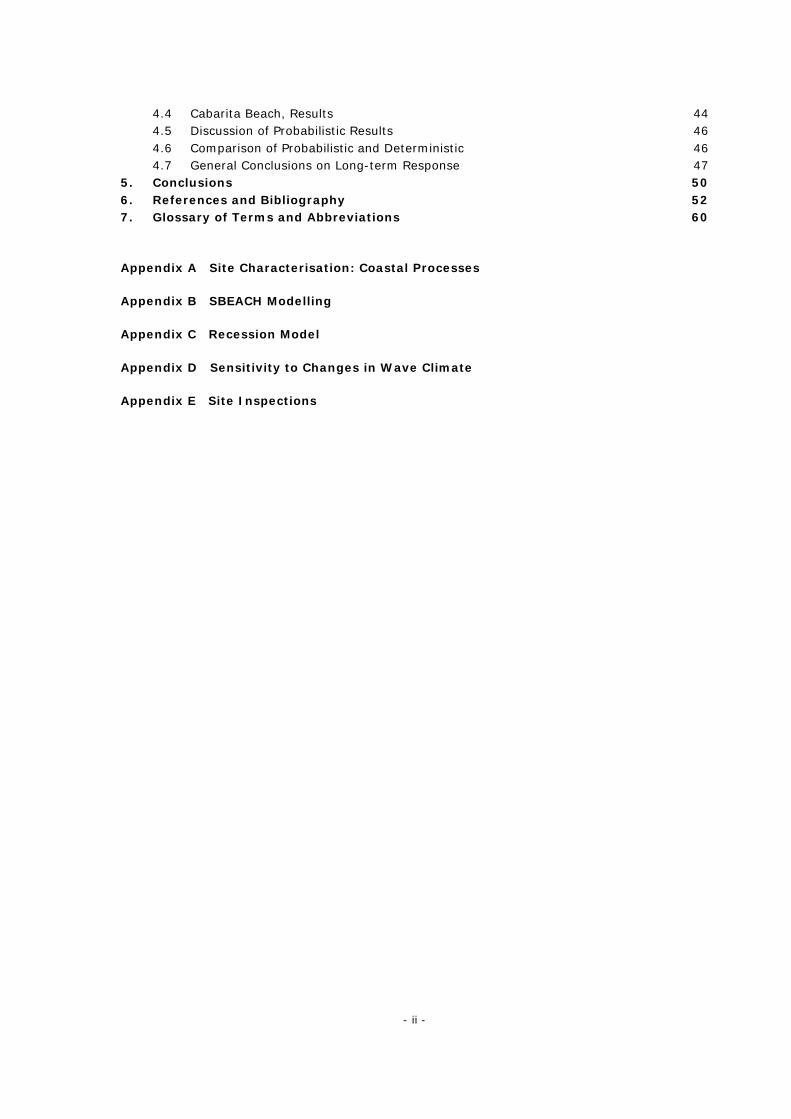
4.4 Cabarita Beach, Results 44 4.5 Discussion of Probabilistic Results 46 4.6 Comparison of Probabilistic and Deterministic 46 4.7 General Conclusions on Long-term Response 47
5. Conclusions 50 6. References and Bibliography 52 7. Glossary of Terms and Abbreviations 60
Appendix A Site Characterisation: Coastal Processes
Appendix B SBEACH Modelling
Appendix C Recession Model
Appendix D Sensitivity to Changes in Wave Climate
Appendix E Site Inspections
- iii -
List of Tables
Table 1: Avoca Beach Summary of Data and Literature Consulted for this Study 4Table 2: Cabarita Beach Summary of Data and Literature Consulted for this Study 5Table 3: Tidal Planes at Sydney (Source DECC, 2008) 8Table 4: Design Water Levels Tide + Storm Surge 8Table 5: Summary of Spatial Variation in One Hour Exceedance Hsig along the NSW Coast 9Table 6: Sediment Characteristics in Avoca Beach (source: ABSAMP Surf Life Saving Australia) 14Table 7: Littoral Drift Through Cabarita Compartment 23Table 8: Design Storm Demands from Previous Studies 31Table 9: Storm Demand Predictions for Avoca Beach 31Table 10: Storm Demand Predictions for Cabarita Beach 32Table 11: Probability Density Functions of Input Variables 41Table 12: Summary of 2100 Probabilistic Recession Estimates for Avoca Beach 42Table 13: Summary of 2100 Probabilistic Recession Estimates for Cabarita Beach 44Table 14: Deterministic Estimates of Recession 47 List of Figures
Figure 1.1*: Study Sites Location Figure 2.1: Sea Level Changes over Time and Spatial Scales Figure 2.2: Elevated Water Levels Figure 2.3: Coastal Inundation Byron Bay 1973 Figure 2.4: Avoca Beach Location Figure 2.5*: Avoca Beach Sedimentology Figure 2.5.1: ICOLL/Coastal Lagoon Conceptual Model Figure 2.5.2: Avoca Representative Beach Profiles Figure 2.5.3*: Avoca Bathymetry and Conceptual Sediment Budget Model Figure 2.6: Cabarita Beach Location Figure 2.7: Cabarita Prograded Barrier Figure 2.7.1: Cabarita Geology Figure 2.8: Cabarita Representative Beach Profiles Figure 2.9*: Photos of Sediment Pulse Around Cudgen Headland Figure 2.10*: Cabarita Bathymetry and Conceptual Sediment Budget Model Figure 3.1: Storm Demand and Horizontal Setback Distance Figure 3.2: Examples of 100 year ARI Synthetic Design Storm Figure 3.3: 100 year ARI SDS for Avoca and Cabarita Beach Figure 3.4: Estimates of Storm Demand for Avoca Beach Figure 3.5: Estimates of Storm Demand for Cabarita Beach Figure 3.6*: Summary of Synthetic Design Storm Short-term Predictions Figure 4.1: Belongil Beach +4 m AHD Contour Evolution Figure 4.2*: Flow Diagram of Probabilistic and Deterministic Approach Figure 4.2.1: Avoca and Cabarita Input Variables Probability Distributions Figure 4.3: Avoca Beach Representative Beach Profiles Figure 4.4: Avoca North 2100 Recession Estimates Figure 4.5: Avoca South 2100 Recession Estimates Figure 4.6: Avoca North and South Comparison 2100 Recession Estimates Figure 4.7*: Avoca South Contributions to Recession

- iv -
Figure 4.8: Avoca North and South 2100 Recession Estimates Against SLR Figure 4.9: Cabarita Beach Representative Beach Profiles Figure 4.10: Cabarita Centre 2100 Recession Estimates Figure 4.11: Cabarita North, South and Centre Comparison 2100 Recession Estimates Figure 4.12*: Cabarita Centre Contributions to Recession Figure 4.13: Cabarita Centre 2100 Recession Estimates Against SLR Figure 4.14: Avoca and Cabarita Comparison Figure 4.15*: Avoca North and South Deterministic and Probabilistic Comparison Figure 4.16: Cabarita Centre Deterministic and Probabilistic Comparison Figure 4.17*: Cabarita North and South Deterministic and Probabilistic Comparison *Figures are replicated within the main body of the report
- v -
Executive Summary
The “East Coast Case Study” is part of the collaborative program “National Geomorphic Framework for the Management and Prediction of Coastal Erosion”. The aim of the program is to develop a nationally consistent coastal compartment classification to inform and improve future assessments of coastal vulnerability to climate change, in particular sea level rise. The objective of the “East Coast Case Study” is to evaluate current approaches for the assessment of coastal response to climate change through the application at two study sites on the East Coast of Australia. The investigation consisted of three steps: (i) Site Characterisation, (ii) Assessment of Short-term Coastal Response and (iii) Assessment of Long-term Coastal Response.
Introduction
Avoca Beach on the NSW Central Coast and Cabarita Beach on the Far NSW North Coast were selected for this study. The two sites represent different geological settings and sediment transport processes: cross-shore sediment transport processes are dominant within Avoca while both cross-shore and longshore processes are important at Cabarita Beach. While Avoca Beach is currently in a state of dynamic equilibrium with a relatively “closed” sediment budget, Cabarita Beach presents ongoing shoreline recession due to by littoral drift imbalance.
Site Characterisation
The coastal response to extreme storm events was assessed at the two study sites. While data availability limited the application of fully probabilistic approaches, deterministic and semi-probabilistic methods were applied to estimate beach erosion for a range of storm events with probabilities ranging from 1 to 100 year ARI, and for single and sequences of two and three storms.
Short-term Coastal Response
A sediment budget approach was adopted at the two study sites to assess long-term recession due to (i) ongoing sediment imbalance within the coastal compartment and (ii) sea level rise. The sediment budget considered all potential sinks and sources within the coastal compartment including (where relevant) littoral drift, biogenic production/degradation, lagoon sequestration, onshore drift, dune overwash etc. A two-dimensional model was developed for this study to be used as a platform to provide deterministic predictions and to simulate probabilistic variations (using a Monte Carlo method) of future coastal response. The model was based on a long-term sediment budget approach and a two-dimensional profile geometric transformation.
Long-term Coastal Response
Accurate surfzone and nearshore bathymetry is necessary for erosion modelling. To provide realistic predictions of beach erosion during storm events, storm clustering (sequencing) needs to be taken into consideration as well as two-dimensional effects such as rip currents and sediment loss due to longshore currents. The probabilistic approach provides a powerful tool for the analysis of the sensitivity of shoreline behaviour to future variability in sediment budget components. It allows consideration of potential changes in wave climate as these are likely to result in sediment budget changes. Within those coastal compartments where large uncertainty remains in the quantification of the sediment budget and future impacts of climate change, a probabilistic approach is useful to manage the uncertainty and relate it to future shoreline behaviour.
Summary of Findings
WRL Research Report 253 FINAL REPORT May 2013 1
1. Introduction
1.1 Background
The Water Research Laboratory of the University of New South Wales undertook the “East Coast Study Project” as part of the collaborative program between Geoscience Australia (GA) and the Department of Climate Change and Energy Efficiency (DCCEE, now repealed): “National Geomorphic Framework for the Management and Prediction of Coastal Erosion”. This program aims to contribute towards the improvement of the ability, on a national level, to undertake coastal erosion and risk assessments, and enable a more integrated approach to the management of the coastal zone. The scope of the program is composed of two components:
(i) The development of a national coastal sediment system classification; and (ii) The improvement of the prediction of shoreline erosion assessments through two
case study projects: the East and West Coast projects. The development of a national coastal “compartment” classification based on sediment processes help coastal managers and planners adopt the best approach to modelling shoreline erosion under future climate by identifying the geographic extent of discrete coastal sediment systems – the sources, sinks and pathways of sediments within a section of coast. The case study projects demonstrate the potential utility of the coastal compartment classification for assessing and modelling coastal vulnerability and shoreline response to climate change, and in particular to sea level rise. The purpose of the “East Coast Study Project” was to evaluate approaches currently implemented by practitioners for the assessment of coastal response to climate change including sea level rise. In particular, the assessment of coastal response in the short and long-term at two case study sites is used to compare and evaluate the deterministic versus probabilistic approaches in the context of the coastal sediment compartment characterisation.
1.2 Scope of Works
The work undertaken was divided into the following tasks:
Task 1. Characterisation of the two study sites; Task 2. Evaluation of the applicability of deterministic and probabilistic approaches for
coastal response to extreme events and climate change at the two study sites; and
Task 3. Qualitative assessment of deterministic and probabilistic approaches and recommendations for best practice in coastal hazard definition.
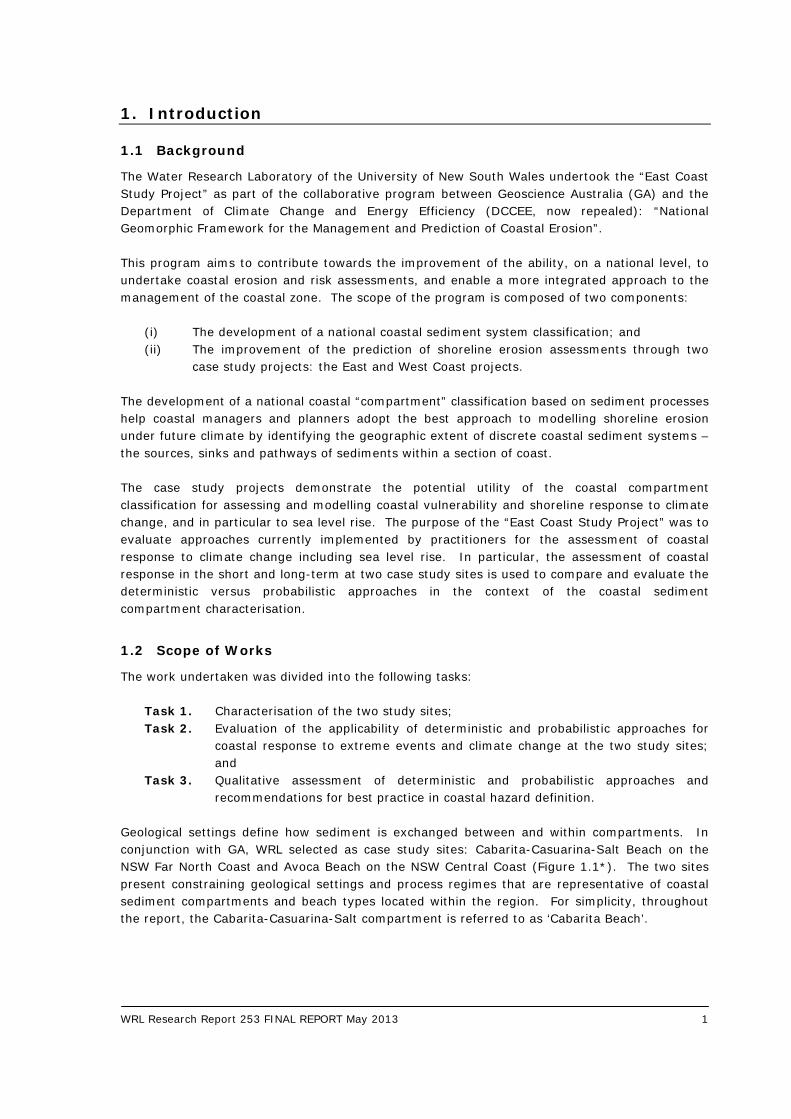
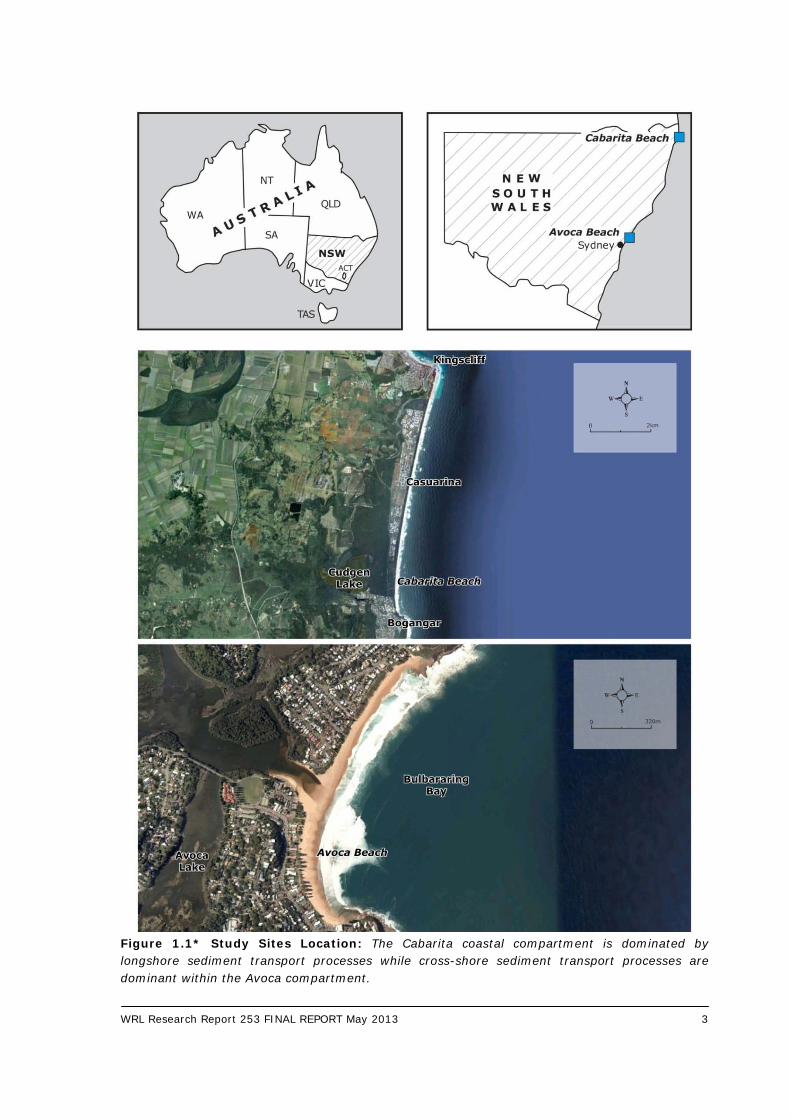
Geological settings define how sediment is exchanged between and within compartments. In conjunction with GA, WRL selected as case study sites: Cabarita-Casuarina-Salt Beach on the NSW Far North Coast and Avoca Beach on the NSW Central Coast (Figure 1.1*). The two sites present constraining geological settings and process regimes that are representative of coastal sediment compartments and beach types located within the region. For simplicity, throughout the report, the Cabarita-Casuarina-Salt compartment is referred to as ‘Cabarita Beach’.
WRL Research Report 253 FINAL REPORT May 2013 2
As part of Task 1, WRL collated and reviewed a large amount of literature and existing data relevant to Avoca and Cabarita Beach, including:
• Coastal processes and management studies; • Coastal hazard assessment studies; • Photogrammetry data; • Bathymetric data including recent Marine LiDAR data; and • Geological and sedimentology mapping.
Characterisation of the study sites was completed in terms of geological, oceanic and sediment transport processes. Sediment budgets were inferred with consideration to present day and future climate change scenarios. As part of Task 2, WRL undertook the evaluation of coastal response to extreme events and climate change. The evaluation included the analysis, at the two study sites, of:
• Short-term processes (storm erosion); and • Long-term processes (shoreline recession).
Short-term processes considered erosion from individual extreme storm events and clustering of up to three extreme storm events. Long-term processes considered the effect of recession due to sediment imbalance within the coastal cell and sea level rise (SLR). Qualitative considerations of potential effects of changes in wave climatology were also addressed. The evaluation of coastal response at Task 2, considered the application of deterministic and probabilistic approaches. As part of Task 3, relative merits of the two approaches are discussed with regards to the evaluation of short and long-term processes at the two study sites and recommendations are formulated for future direction in coastal erosion and risk assessments.
1.3 Deterministic and Probabilistic Approach
Coastal erosion and risk assessments involve the prediction/estimation of the future likely response of the coastline under different sets of initial conditions, including beach bathymetry, topography, wave and water level conditions, coastal geomorphology etc. The predictions are typically obtained through the setting up of a system or a series of models capable of delivering (empirical, analytical or numerical) estimates of coastal response (output) from a given initial state (input). It is important to note that the purpose of this study was the evaluation of deterministic and probabilistic approaches at two contrasting coastal sites, and that the choice of the model (or series of models) and their level of complexity was not, per se, relevant in the perspective of this study. With a deterministic approach, the initial state is uniquely defined through a set of single-value variables as is the model output describing the future state. With a probabilistic (or stochastic) approach, the initial state is allowed to vary by defining the input variables using a range of possible values (probability distributions). Consequently, the future state will also be described through a probability distribution (estimates based on their likelihood) instead of a single deterministic estimate.
WRL Research Report 253 FINAL REPORT May 2013 3
Figure 1.1* Study Sites Location: The Cabarita coastal compartment is dominated by longshore sediment transport processes while cross-shore sediment transport processes are dominant within the Avoca compartment.
WRL Research Report 253 FINAL REPORT May 2013 4
To date, in Australia, coastal hazard assessments including the evaluation for planning purposes of coastal erosion and recession processes, are primarily undertaken using a deterministic approach. Recent studies (Woodroffe et al., 2012; Cowell et al., 2006) have highlighted the merits of a probabilistic approach to manage the often large uncertainty surrounding the physical variables driving the erosion and recession processes and the importance of providing forecasts coupled with a measure (probability) of the uncertainty related to the forecasts.
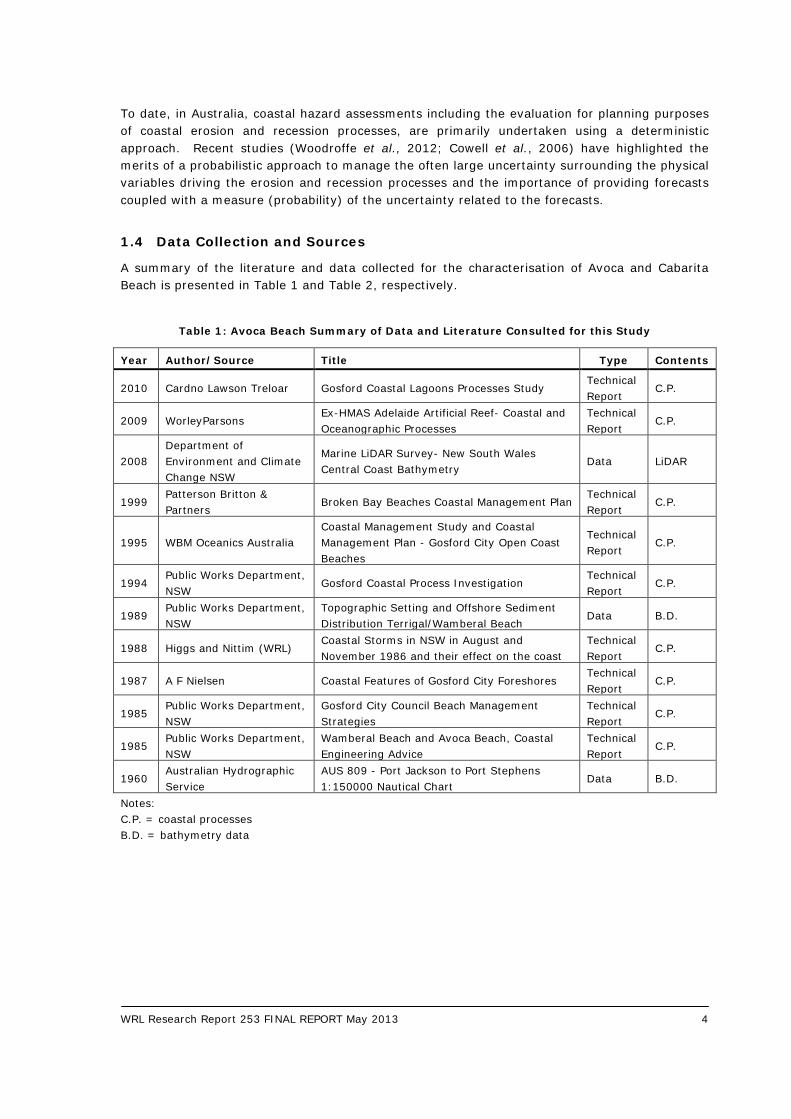
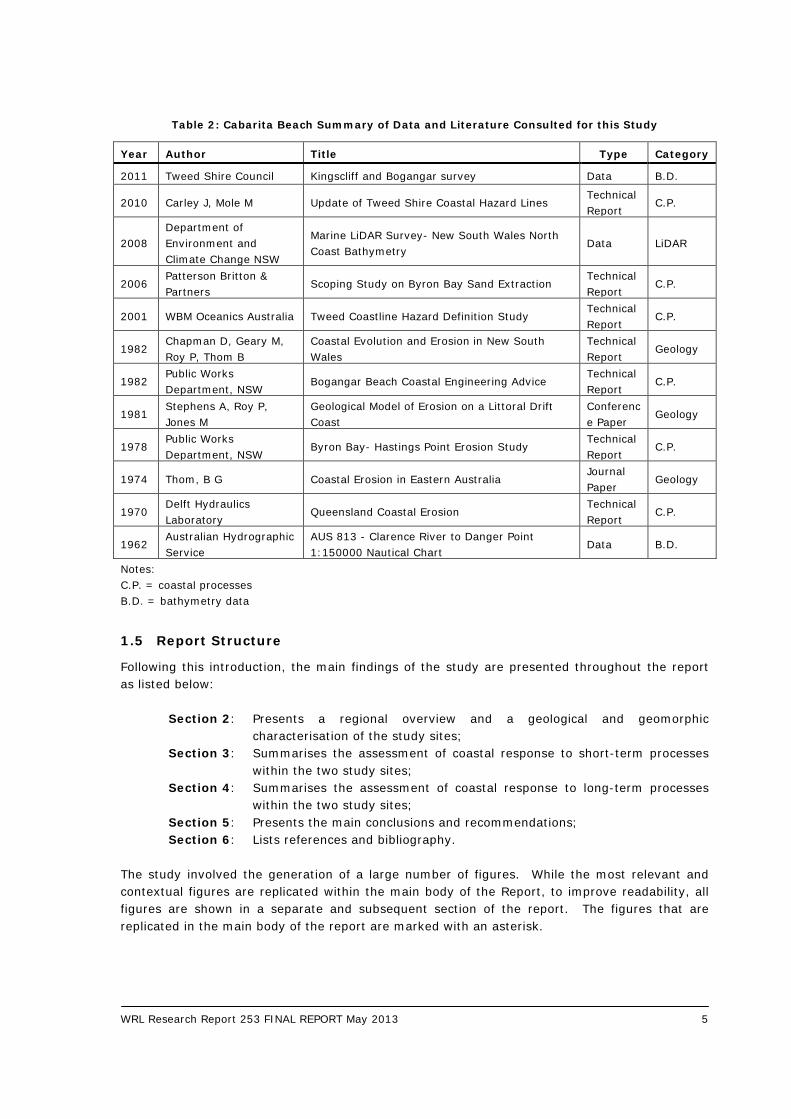
1.4 Data Collection and Sources
A summary of the literature and data collected for the characterisation of Avoca and Cabarita Beach is presented in Table 1 and Table 2, respectively.
Table 1: Avoca Beach Summary of Data and Literature Consulted for this Study
Year Author/Source Title Type Contents
2010 Cardno Lawson Treloar Gosford Coastal Lagoons Processes Study Technical Report
C.P.
2009 WorleyParsons Ex-HMAS Adelaide Artificial Reef- Coastal and Oceanographic Processes
Technical Report
C.P.
2008 Department of Environment and Climate Change NSW
Marine LiDAR Survey- New South Wales Central Coast Bathymetry
Data LiDAR
1999 Patterson Britton & Partners
Broken Bay Beaches Coastal Management Plan Technical Report
C.P.
1995 WBM Oceanics Australia Coastal Management Study and Coastal Management Plan - Gosford City Open Coast Beaches
Technical Report
C.P.
1994 Public Works Department, NSW
Gosford Coastal Process Investigation Technical Report
C.P.
1989 Public Works Department, NSW
Topographic Setting and Offshore Sediment Distribution Terrigal/Wamberal Beach
Data B.D.
1988 Higgs and Nittim (WRL) Coastal Storms in NSW in August and November 1986 and their effect on the coast
Technical Report
C.P.
1987 A F Nielsen Coastal Features of Gosford City Foreshores Technical Report
C.P.
1985 Public Works Department, NSW
Gosford City Council Beach Management Strategies
Technical Report
C.P.
1985 Public Works Department, NSW
Wamberal Beach and Avoca Beach, Coastal Engineering Advice
Technical Report
C.P.
1960 Australian Hydrographic Service
AUS 809 - Port Jackson to Port Stephens 1:150000 Nautical Chart
Data B.D.
Notes: C.P. = coastal processes B.D. = bathymetry data
WRL Research Report 253 FINAL REPORT May 2013 5
Table 2: Cabarita Beach Summary of Data and Literature Consulted for this Study
Year Author Title Type Category
2011 Tweed Shire Council Kingscliff and Bogangar survey Data B.D.
2010 Carley J, Mole M Update of Tweed Shire Coastal Hazard Lines Technical Report
C.P.
2008 Department of Environment and Climate Change NSW
Marine LiDAR Survey- New South Wales North Coast Bathymetry
Data LiDAR
2006 Patterson Britton & Partners
Scoping Study on Byron Bay Sand Extraction Technical Report
C.P.
2001 WBM Oceanics Australia Tweed Coastline Hazard Definition Study Technical Report
C.P.
1982 Chapman D, Geary M, Roy P, Thom B
Coastal Evolution and Erosion in New South Wales
Technical Report
Geology
1982 Public Works Department, NSW
Bogangar Beach Coastal Engineering Advice Technical Report
C.P.
1981 Stephens A, Roy P, Jones M
Geological Model of Erosion on a Littoral Drift Coast
Conference Paper
Geology
1978 Public Works Department, NSW
Byron Bay- Hastings Point Erosion Study Technical Report
C.P.
1974 Thom, B G Coastal Erosion in Eastern Australia Journal Paper
Geology
1970 Delft Hydraulics Laboratory
Queensland Coastal Erosion Technical Report
C.P.
1962 Australian Hydrographic Service
AUS 813 - Clarence River to Danger Point 1:150000 Nautical Chart
Data B.D.
Notes: C.P. = coastal processes B.D. = bathymetry data
1.5 Report Structure
Following this introduction, the main findings of the study are presented throughout the report as listed below:
Section 2: Presents a regional overview and a geological and geomorphic characterisation of the study sites;
Section 3: Summarises the assessment of coastal response to short-term processes within the two study sites;
Section 4: Summarises the assessment of coastal response to long-term processes within the two study sites;
Section 5: Presents the main conclusions and recommendations; Section 6: Lists references and bibliography.
The study involved the generation of a large number of figures. While the most relevant and contextual figures are replicated within the main body of the Report, to improve readability, all figures are shown in a separate and subsequent section of the report. The figures that are replicated in the main body of the report are marked with an asterisk.

WRL Research Report 253 FINAL REPORT May 2013 6
Five appendices were generated for this study:
Appendix A: Details the coastal processes characterisation of the two study sites; Appendix B: Describes the numerical short-term erosion modelling; Appendix C: Describes the numerical long-term recession modelling; Appendix D: Summarises sensitivity to wave climate changes; Appendix E: Provides a photographic depiction of the two study sites.
WRL Research Report 253 FINAL REPORT May 2013 7
2. Site Characterisation
2.1 Regional Overview
2.1.1 Geological Evolution of the NSW Coast
Beach systems, and the shape and position of the shorelines formed by unconsolidated sandy sediments are dynamic in the short and medium term, and also evolve over geological timescales. A brief summary of the evolution of NSW beaches over the last two major interglacials provides a context in which to understand the current configuration of the unconsolidated coastal sediments and the likely developments that will potentially occur with a changing climate. Approximately 125,000 years before present (BP), evidence indicates that sea level was 4 to 6 m above its present level (Marshall and Thom, 1976; Stephens et al., 1981) as shown in Figure 2.1. Figure 2.1 also presents schematically temporal and spatial scales relevant for coastal evolution and processes. Coastal processes associated with the sea level rise, leading up to the Pleistocene high still stand 125,000 years BP, moved sand onshore from the continental shelf. This sand formed coastal plains and dune systems which can still be observed today in many of the deeper embayments of the NSW coast, such as Newcastle Bight (Roy and Crawford, 1980), and along much of the NSW north coast (Roy and Thom, 1981; PWD, 1982; Stephens et al., 1981). As the sea level receded following the Pleistocene high stand, many of these coastal plains and dune formations were left stranded. After the Pleistocene high still stand the Last Glacial saw sea level fluctuating between 20 and 80 m on several occasions, while progressively trending down to a low still stand approximately 120 to 130 m below present. This low still stand occurred around 17,000 to 18,000 years BP (Roy and Thom, 1981; see Figure 2.1). With the coast well out on the present day continental shelf, creeks and rivers eroded paths through these Pleistocene deposits transporting some of the sediment back down the shelf to the “new” (“low stand”) coast. The creeks and rivers incised themselves into the underlying rock forming new, or deepening existing, watercourses. For the smaller coastal compartments, or for those with steep sided bedrock and/or large rivers, the Pleistocene still stand deposits may have been truncated or completely removed by erosion. However, for the larger coastal compartments, particularly those without major rivers, the beach ridges and dunes of the Pleistocene coastal plains remain today, albeit somewhat modified in form by wind and vegetation. At around 17,000 years BP a progressive de-glaciation commenced, eventually resulting in sea level rising to approximately its present level around 6,000 to 6,500 years BP: the Holocene epoch. As the sea level rose, the sandy sediments moved progressively up to establish the current coastal profile (Thom, 1978; Stephens et al., 1981). The de-glaciation, and resulting sea level rise over the terrain, produced what is referred to as a drowned coast. The valleys incised by the rivers and creeks at the lower sea level became what are classified as “drowned river valleys” (Chapman et al., 1982). As with the Pleistocene sea level rise, the Holocene sea level rise moved shelf sand back onshore to form the precursor to the present day coast. During the 6,000 years of the Holocene still stand the sea level may have varied at times by up to ± 1 m (Chapman et al., 1982).
WRL Research Report 253 FINAL REPORT May 2013 8
Additionally, longshore drift of sand into and out of compartments, and climatic variations in the net wave energy flux, have modified the coastal form to produce what is the present day shoreline beach alignment.
2.1.2 Water Levels
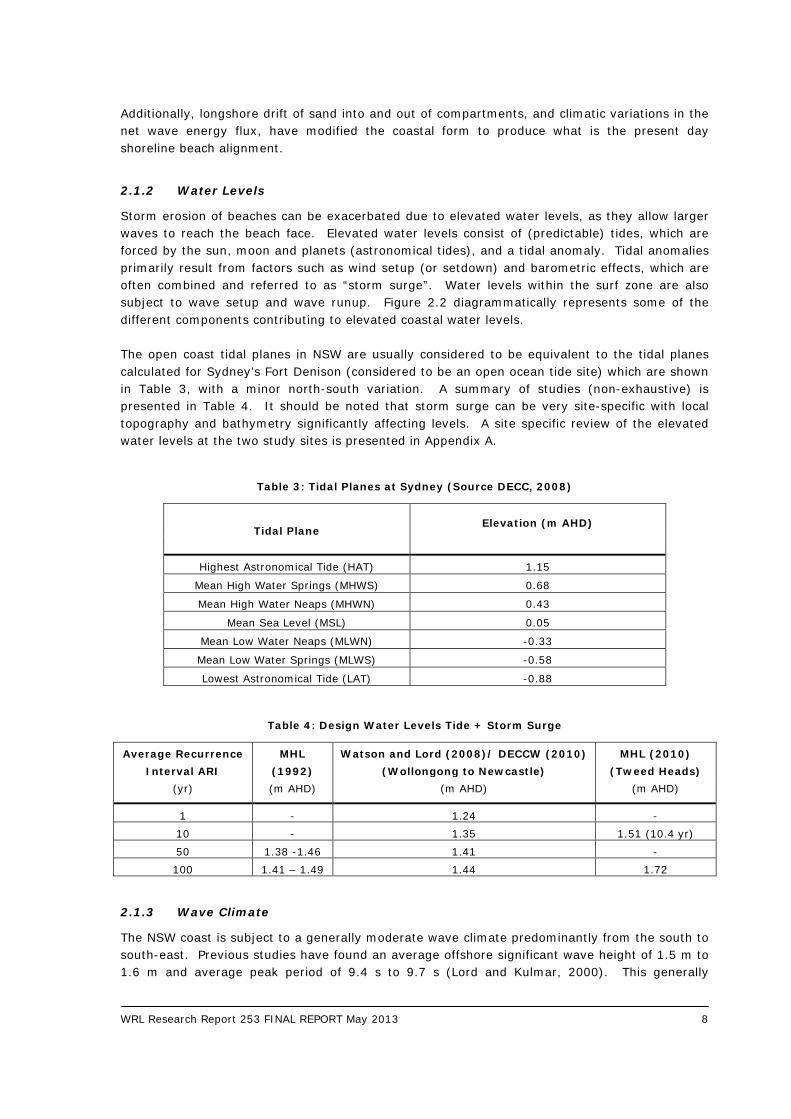
Storm erosion of beaches can be exacerbated due to elevated water levels, as they allow larger waves to reach the beach face. Elevated water levels consist of (predictable) tides, which are forced by the sun, moon and planets (astronomical tides), and a tidal anomaly. Tidal anomalies primarily result from factors such as wind setup (or setdown) and barometric effects, which are often combined and referred to as “storm surge”. Water levels within the surf zone are also subject to wave setup and wave runup. Figure 2.2 diagrammatically represents some of the different components contributing to elevated coastal water levels. The open coast tidal planes in NSW are usually considered to be equivalent to the tidal planes calculated for Sydney’s Fort Denison (considered to be an open ocean tide site) which are shown in Table 3, with a minor north-south variation. A summary of studies (non-exhaustive) is presented in Table 4. It should be noted that storm surge can be very site-specific with local topography and bathymetry significantly affecting levels. A site specific review of the elevated water levels at the two study sites is presented in Appendix A.
Table 3: Tidal Planes at Sydney (Source DECC, 2008)
Tidal Plane Elevation (m AHD)
Highest Astronomical Tide (HAT) 1.15
Mean High Water Springs (MHWS) 0.68
Mean High Water Neaps (MHWN) 0.43
Mean Sea Level (MSL) 0.05
Mean Low Water Neaps (MLWN) -0.33
Mean Low Water Springs (MLWS) -0.58
Lowest Astronomical Tide (LAT) -0.88
Table 4: Design Water Levels Tide + Storm Surge
Average Recurrence Interval ARI
MHL (1992)
Watson and Lord (2008)/ DECCW (2010) (Wollongong to Newcastle)
MHL (2010) (Tweed Heads)
(yr) (m AHD) (m AHD) (m AHD)
1 - 1.24 - 10 - 1.35 1.51 (10.4 yr) 50 1.38 -1.46 1.41 - 100 1.41 – 1.49 1.44 1.72
2.1.3 Wave Climate
The NSW coast is subject to a generally moderate wave climate predominantly from the south to south-east. Previous studies have found an average offshore significant wave height of 1.5 m to 1.6 m and average peak period of 9.4 s to 9.7 s (Lord and Kulmar, 2000). This generally
WRL Research Report 253 FINAL REPORT May 2013 9
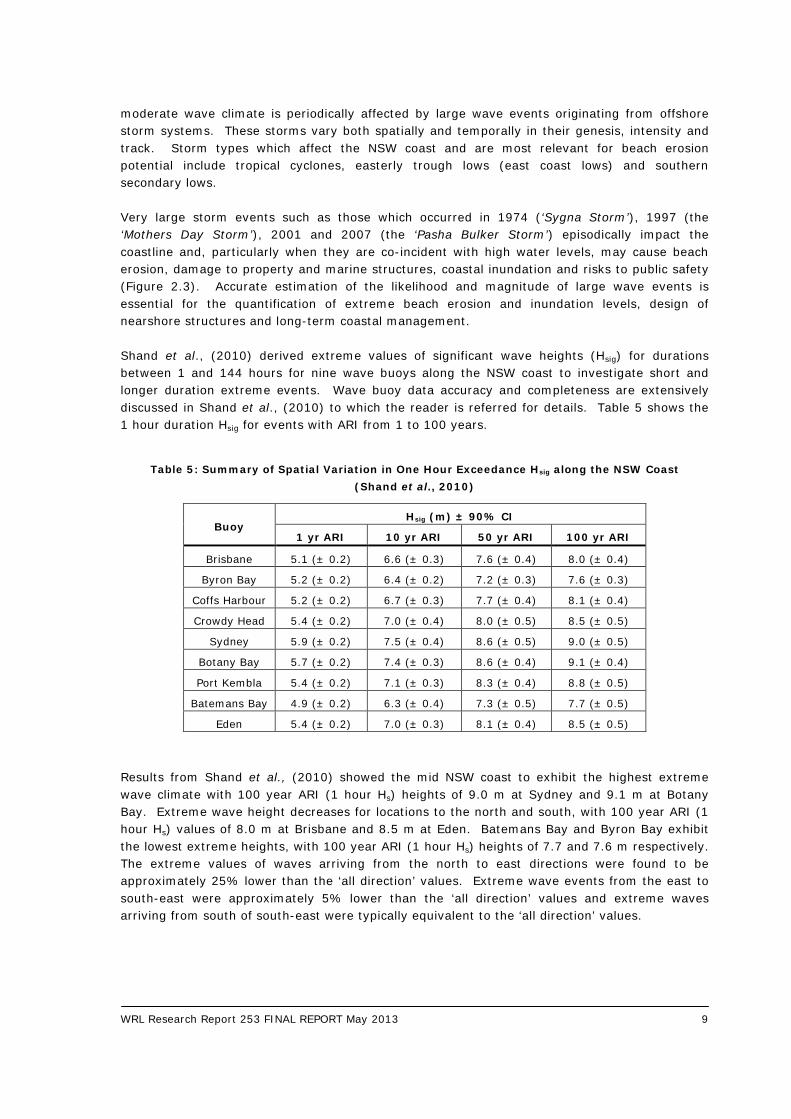
moderate wave climate is periodically affected by large wave events originating from offshore storm systems. These storms vary both spatially and temporally in their genesis, intensity and track. Storm types which affect the NSW coast and are most relevant for beach erosion potential include tropical cyclones, easterly trough lows (east coast lows) and southern secondary lows. Very large storm events such as those which occurred in 1974 (‘Sygna Storm’), 1997 (the ‘Mothers Day Storm’), 2001 and 2007 (the ‘Pasha Bulker Storm’) episodically impact the coastline and, particularly when they are co-incident with high water levels, may cause beach erosion, damage to property and marine structures, coastal inundation and risks to public safety (Figure 2.3). Accurate estimation of the likelihood and magnitude of large wave events is essential for the quantification of extreme beach erosion and inundation levels, design of nearshore structures and long-term coastal management. Shand et al., (2010) derived extreme values of significant wave heights (Hsig) for durations between 1 and 144 hours for nine wave buoys along the NSW coast to investigate short and longer duration extreme events. Wave buoy data accuracy and completeness are extensively discussed in Shand et al., (2010) to which the reader is referred for details. Table 5 shows the 1 hour duration Hsig for events with ARI from 1 to 100 years.
Table 5: Summary of Spatial Variation in One Hour Exceedance Hsig along the NSW Coast (Shand et al., 2010)
Buoy Hsig (m) ± 90% CI
1 yr ARI 10 yr ARI 50 yr ARI 100 yr ARI
Brisbane 5.1 (± 0.2) 6.6 (± 0.3) 7.6 (± 0.4) 8.0 (± 0.4)
Byron Bay 5.2 (± 0.2) 6.4 (± 0.2) 7.2 (± 0.3) 7.6 (± 0.3)
Coffs Harbour 5.2 (± 0.2) 6.7 (± 0.3) 7.7 (± 0.4) 8.1 (± 0.4)
Crowdy Head 5.4 (± 0.2) 7.0 (± 0.4) 8.0 (± 0.5) 8.5 (± 0.5)
Sydney 5.9 (± 0.2) 7.5 (± 0.4) 8.6 (± 0.5) 9.0 (± 0.5)
Botany Bay 5.7 (± 0.2) 7.4 (± 0.3) 8.6 (± 0.4) 9.1 (± 0.4)
Port Kembla 5.4 (± 0.2) 7.1 (± 0.3) 8.3 (± 0.4) 8.8 (± 0.5)
Batemans Bay 4.9 (± 0.2) 6.3 (± 0.4) 7.3 (± 0.5) 7.7 (± 0.5)
Eden 5.4 (± 0.2) 7.0 (± 0.3) 8.1 (± 0.4) 8.5 (± 0.5)
Results from Shand et al., (2010) showed the mid NSW coast to exhibit the highest extreme wave climate with 100 year ARI (1 hour Hs) heights of 9.0 m at Sydney and 9.1 m at Botany Bay. Extreme wave height decreases for locations to the north and south, with 100 year ARI (1 hour Hs) values of 8.0 m at Brisbane and 8.5 m at Eden. Batemans Bay and Byron Bay exhibit the lowest extreme heights, with 100 year ARI (1 hour Hs) heights of 7.7 and 7.6 m respectively. The extreme values of waves arriving from the north to east directions were found to be approximately 25% lower than the ‘all direction’ values. Extreme wave events from the east to south-east were approximately 5% lower than the ‘all direction’ values and extreme waves arriving from south of south-east were typically equivalent to the ‘all direction’ values.
WRL Research Report 253 FINAL REPORT May 2013 10
2.1.4 Climate Variability on the NSW Coast – El Niño, La Niña and the IPO
El Niño and La Niña are short-term phases of variability in climate that generally last 2 to 4 years. While the physical features, and effects, defining the two phases are well known, the causation mechanism is not. During either phase one of the phenomena are dominant but the other may still occur from time to time. The El Niño phase produces relatively quiescent conditions on the NSW coast. Hence the El Niño phase is usually associated with periods of beach and dune building where the modal beach profile reflects the bulk of active sediment being onshore and there being weak offshore bar conditions. The La Niña phase tends to produce stormier coastal conditions on the NSW coast with a greater tendency for onshore winds and storm cell development in the lower Coral and the Tasman Seas. During a La Niña-dominated period the modal beach profile has less sand in the sub-aerial beach and dune system, and more in the offshore bar formations. There is mounting evidence of a cyclic phenomenon with a periodicity of 60 or so years. This may be associated with the phenomenon termed the Inter-decadal Pacific Oscillation (IPO). Presently, relatively little is known about this phenomenon; its generating mechanisms and impacts. However, the available coastal information points to periods of approximately 30 years of dominantly quiescent periods, though still with some storms during strong La Niña phases, followed by approximately 30 years which are dominated by storms, again with some breaks during strong El Niño phases. The usual feature of the 30 years of storms is not just their intensity but also their tendency to group or follow on before full beach recovery can occur. Helman (2007) and Callaghan and Helman (2008) have recently examined the available information in some detail and their work supports the concept of inter-decadal cycles of storm activity and coastal response. From the mid-1970s until recently there were few tropical cyclones that tracked down from the Coral Sea and had impacts on the NSW coast. Also during that 30 year period there were few intense east coast lows. Therefore this period featured a marked beach and dune-building phase. Since about 2005 there has been a notable increase in the development of intense low-pressure cells in the Coral and Tasman Seas, often following on from one another before the beach has had the opportunity to recover. The 30 years from the mid-1940s until the mid-1970s were marked by a succession of storms that caused major coastal damage and a number of cyclones that tracked south from the Coral Sea and along the northern NSW coast. Prior to the 1940s reliable evidence is more difficult to access due to the paucity of the weather records. However, early aerial photos, family snapshots and tourist postcards show wide sandy beaches during the 1920s and 1930s and there are few reports of storm damage, with one or two exceptions. Callaghan and Helman, (2008) provide a detailed tabulation of storm activity on the northern NSW coast.
2.1.5 Climate Change – Coastal Impact Implications for the NSW Coast
Changes in storminess (i.e. intensity, frequency and direction) are likely to alter the modal position, shape and dynamic equilibrium of beach profiles. A greater storminess would tend to shift the equilibrium profile and therefore the shoreline, landward. Lesser storminess will likely have the opposite effect. A change in the net wave energy flux due to weather systems shifting latitudes (Hemer, 2012) is anticipated to alter beach alignments on exposed and semi-exposed coasts. This in turn will exacerbate existing beach response e.g. erosion or accretion of different ends of a beach compartment (Short et al., 2000).
WRL Research Report 253 FINAL REPORT May 2013 11
A further issue is the enhancement (or reduction) of longshore drift systems around headlands. This could cause the re-starting (or conversely a reduction) of supply into a compartment as well as an enhancement of losses around down-drift headlands. The impact of changes in wind energy flux and rainfall on dune stability is often overlooked. An enhancement of wind born losses inland as a result of losses in dune stability can produce significant shoreline erosion (Gordon, 1992). Changes in rainfall regimes and patterns may impact dune stability through elevated phreatic levels, pore pressure changes and vegetation changes (Engineers Australia 2012). A recent development has been the postulation that anthropogenic climate change could bring with it an increased acidification of the oceans (Geosciences Australia, Oz Coast - Australia Online Coastal Information, Laxton 2009). It has also been proposed that such an increase in acidification will reduce shell production and increase shell degradation. Beaches with adjacent offshore reefs commonly have moderate to high percentages of shell making up their bulk volume. A loss of shell content would translate to a loss of sediment bulk and hence enhanced shoreline recession. To date, most emphasis has been placed on sea level rise. The warming of the oceans with a consequent expansion of the water will affect differently coastlines depending on location including latitude and resident ocean current systems. Additionally, the delayed influence of land-based ice melt will also contribute to sea level rise, however, this may be offset by the increased precipitation at higher elevations and hence the growth of high altitude ice fields. To date the IPCC (2001; 2007a and 2007b) has produced a range of sea level rise scenarios of which Australian states and the Commonwealth have tended to adopt the highest (DCC, 2009), although some argue the highest IPCC scenario is less than the potential highest sea level rise scenarios if ice melt is included at an earlier stage. Currently there is a proclivity, in NSW, to use a sea level rise projection of 0.4 m by 2050 and 0.9 m by 2100 (DECCW NSW, 2009, now repealed). While it has no jurisdictional power, the Commonwealth assumed a sea level rise of 1.1 m in its 2009 national coastal vulnerability assessment (DCC, 2009).
2.2 Avoca Beach, NSW
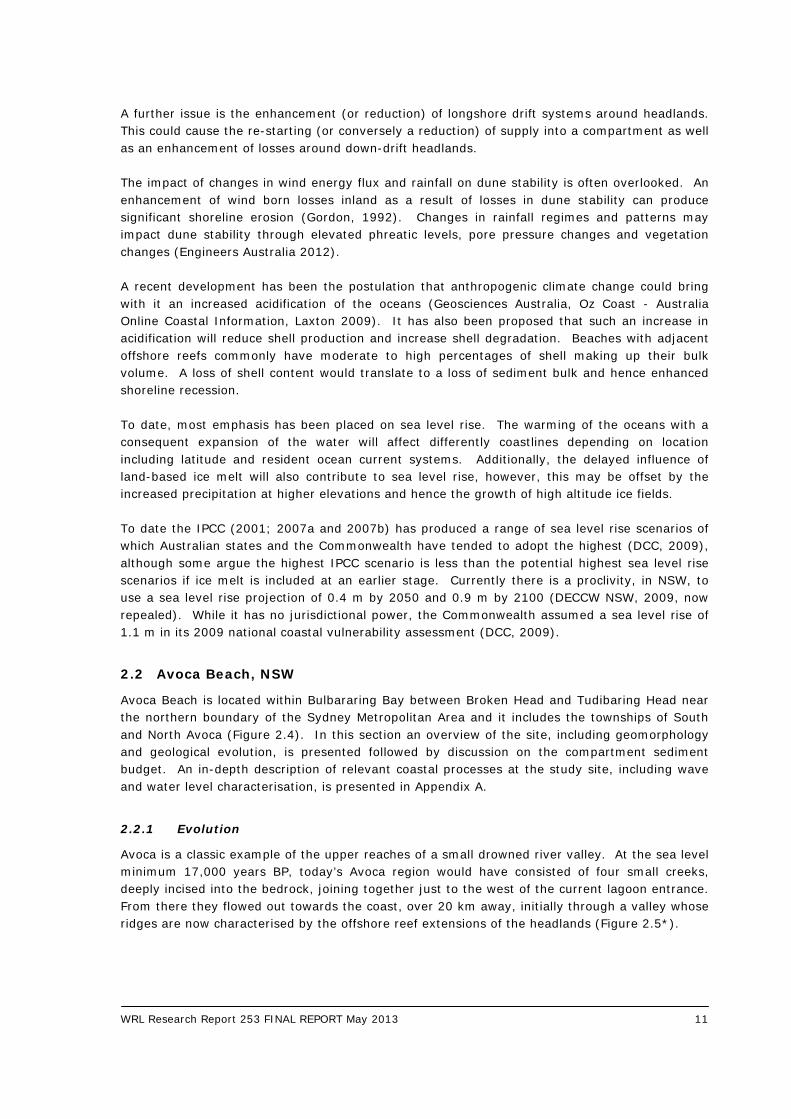
Avoca Beach is located within Bulbararing Bay between Broken Head and Tudibaring Head near the northern boundary of the Sydney Metropolitan Area and it includes the townships of South and North Avoca (Figure 2.4). In this section an overview of the site, including geomorphology and geological evolution, is presented followed by discussion on the compartment sediment budget. An in-depth description of relevant coastal processes at the study site, including wave and water level characterisation, is presented in Appendix A.
2.2.1 Evolution
Avoca is a classic example of the upper reaches of a small drowned river valley. At the sea level minimum 17,000 years BP, today’s Avoca region would have consisted of four small creeks, deeply incised into the bedrock, joining together just to the west of the current lagoon entrance. From there they flowed out towards the coast, over 20 km away, initially through a valley whose ridges are now characterised by the offshore reef extensions of the headlands (Figure 2.5*).
WRL Research Report 253 FINAL REPORT May 2013 12
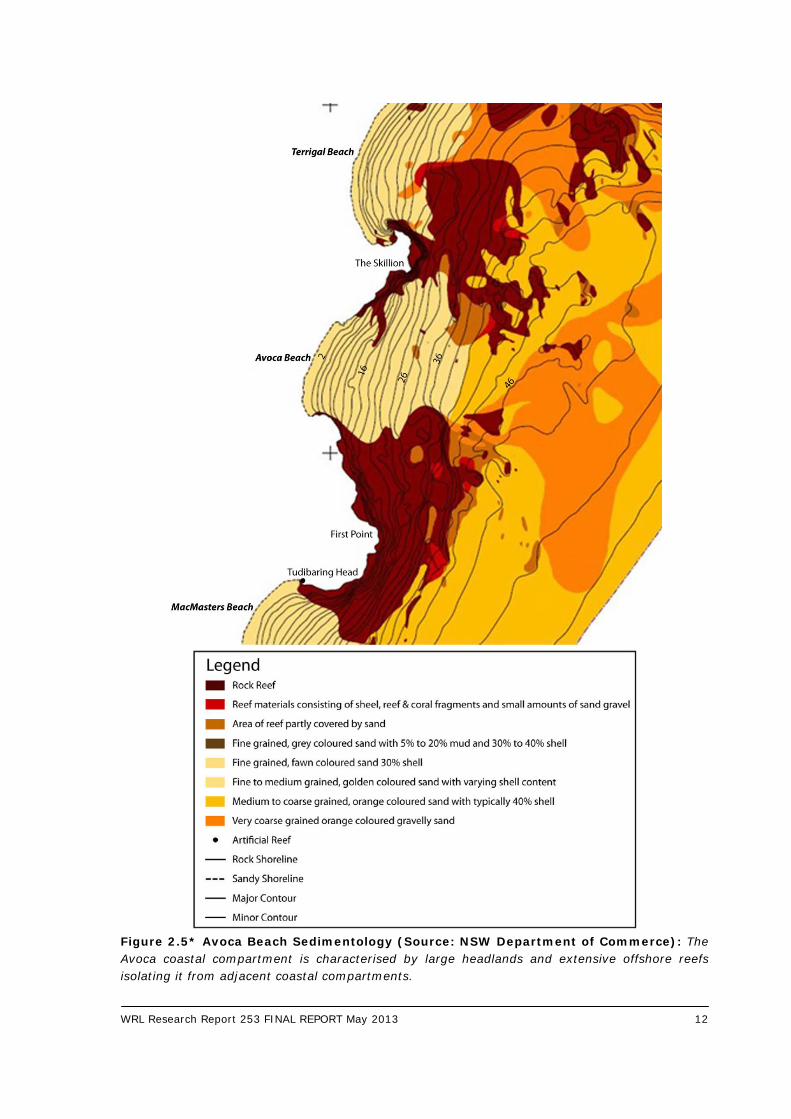
Figure 2.5* Avoca Beach Sedimentology (Source: NSW Department of Commerce): The Avoca coastal compartment is characterised by large headlands and extensive offshore reefs isolating it from adjacent coastal compartments.
WRL Research Report 253 FINAL REPORT May 2013 13
The steepness of the catchments of the creek system in the vicinity of the present day Avoca area would have likely resulted in the scouring out of any of the old Pleistocene beach deposits during the low still stand. As the sea level again rose, during the Holocene transgression, sediments were transported up the offshore Avoca valley to form the present day beach system. Given the strong valley/ridge formation offshore of the present day shoreline, it is likely that a fixed volume of sediment was available to the beach building process. As the Holocene still stand was reached the beach system stabilised, forming a sand berm across the headwaters of the four creeks, thereby creating a lagoon, with four arms. While there was some infill at the entrance, as a berm was formed, the main infilling of the lagoon has been from terrestrial sediments washed down from the catchments of the creeks. This terrestrial sediment infill is progressively turning the open water areas of the lagoon into wetlands. The present day lagoon entrance demonstrates the characteristics expected of an Intermittently Closed and Open Lake or Lagoon (ICOLL). This includes breakouts and entrance scour during times of heavy rain and infill, a short period of tidal behaviour, then reformation of the berm from sand in the active beach system (Gordon, 1990). The lagoon entrance reportedly sometimes displays a tendency to drift south during breakout (PWD, 1994). This is possibly a function of differential wave set-up in the embayment. Figure 2.5*.1 shows a conceptual model of coastal lagoon/ICOLL. The configuration of the hinterland, the tendency of the unconsolidated sediments to adopt a planform dictated by the net wave energy flux, and the limited volume of sediment available from the Holocene sea level rise process have produced a relatively low, narrow, back-of-beach coastal strip to the south of the lagoon entrance. To the north of the entrance, these same factors have resulted in a broader, higher, back-of-beach dune formation.
2.2.2 Site Description
The 1.7 km long Avoca Beach is a moderately embayed beach that lies between two prominent 60 m high sandstone headlands. First Point, including Tudibaring Head to the south forms the southern boundary to the Avoca compartment. First Point is part of Cape Three Points, a large and dominant coastal feature with extensive offshore reefs (Figures 2.4 and 2.5). Broken Head, incorporating The Skillion, and again an extensive offshore reef formation (PWD 1989), is the northern headland for the Avoca embayment. The headlands are of the Terrigal Formation, which comprises a series of siltstones and sandstones with minor breccia, claystone and conglomerate (PWD, 1994). The sandstone tends to be near water level and is overlain by the siltstone, so its slow erosion is unlikely to add much sandy material to the beach because the siltstone materials do not produce beach sized sediments as they erode. The northern and central sections of Avoca Beach face approximately east-south-east (ESE), which is the predominant wave direction. The southern part of the beach faces north-east (NE) and is therefore more sheltered from wave action by the adjacent headland. The beach has a zeta planform shape; its alignment reflects the refraction/diffraction characteristics of the net wave energy flux from the SSE to SE direction and the dominance of the south and north headlands. Although not apparently deeply embayed, the extensive offshore reef extensions of the headlands (PWD, 1989) results in a greater level of embayment than might otherwise be assumed, based on the above water headland features.

WRL Research Report 253 FINAL REPORT May 2013 14
The beach morphology is generally rhythmic with transverse bars and rips grading to rhythmic bars in the northern part of the beach. The beach face is relatively steep and swash zone grain size is coarse (PWD, 1994). The beach nearshore sediments extend seaward to a depth of about 35 m along a relatively steep nearshore profile (average slope of 1V:50H out to 35 m water depth). Rock reef separates this nearshore sediment from the adjacent nearshore sand bodies within the MacMasters (to the south) and Terrigal/Wamberal (to the north) embayments, although as the reef offshore of North Avoca is quite low in relief, it is unlikely to prevent sediment transport during storms. Typical sediment characteristics for Avoca are shown in Table 6.
Table 6: Sediment Characteristics in Avoca Beach (source: ABSAMP Surf Life Saving Australia)
Site Location Grain Size D50 (mm) % Carbonate North Avoca Swash 0.31 45
Avoca Swash 0.26 30
In the offshore region there is a change in sediment from more typical beach and active offshore profile sand to the coarser “Inner Shelf Sand” at a depth of 35 m. Given that in the Greater Metropolitan Region the outer limit of active profile movement is approximately 40 m (Gordon 1990b, 2009) the clear sediment break at 35 m could reasonably be adopted for the purpose of this study as the outer limit of the coastal processes for the Avoca coastal compartment. Avoca Lake backs the centre of the beach and opens during flood events. The beach north of the lake’s entrance is generally referred to as North Avoca with the beach to the south referred to as Avoca. The beach is backed by a dune system which increases in height towards the north due to its greater exposure to prevailing onshore winds and wave action. This beach/barrier encloses Avoca Lake, which like Cockrone Lake to the south at Copacabana-MacMasters, and Terrigal and Wamberal Lagoons to the north, is only occasionally open to the ocean. The southern portion of the beach has a relatively flat beach and offshore slope due to the sheltered nature of this end of the embayment. It is backed by a now residentially developed, but underlying, sandy dune area that has an elevation of approximately 3 to 5 m above mean sea level at the seaward end of the residential lots. To the north of the lagoon entrance, the northern section of the embayment demonstrates its exposure to a higher wave climate than the southern end. Hence there are more commonly offshore bar formations. Between the residential development and the back of the sandy beach there is a well-developed dune region that is generally 20 to 30 m wide. This provides a storm cut buffer that has, at times such as in the 1970s, been eroded back to the property boundaries. Subsequent dune restoration works have re-established this buffer. However, its vulnerability to changes in sea level and net wave energy flux requires careful consideration. Figure 2.5.2 shows diagrams of representative beach profiles for North and South Avoca. Cliff erosion may add some sediment to the compartment over time, however, much of the cliff material in this area is siltstone, mudstone and clay (PWD, 1994) with only very small percentages of sandstone, or sandy material suitable to be retained in the coastal processes of the embayment. The finer material contained in much of the cliff formations is rapidly transported offshore to be deposited in the mid shelf muddy zone.
WRL Research Report 253 FINAL REPORT May 2013 15
2.2.3 Sediment Budget Considerations Present Day
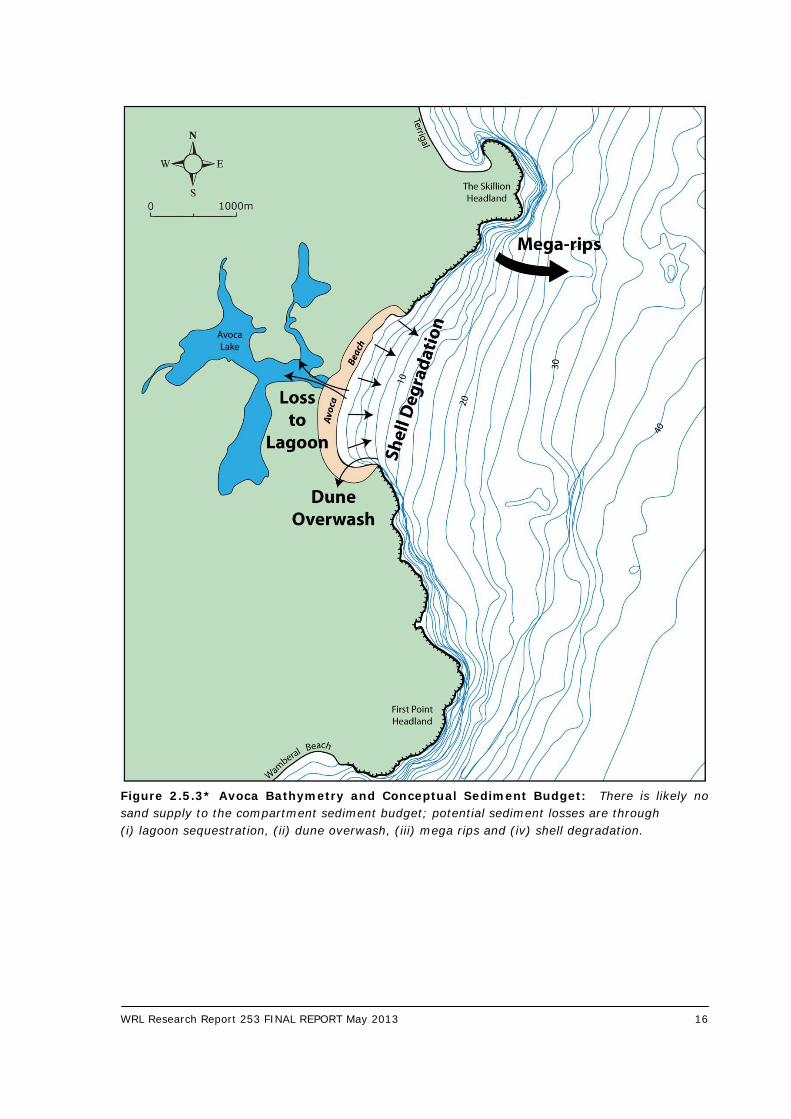
There is no evidence of present day longshore drift into or out of the Avoca Beach embayment. The extensive offshore reefs and the large headlands isolate it from the adjacent compartments. The reefs, which extend down to near the offshore limit at 35 m depth, 2 km offshore, combined with the fact that the offshore profile is concave up, means there is likely to be no present day supply of sand to the sediment budget of the compartment. Figure 2.5.3* presents a conceptual model of sediment budget within the Avoca compartment and nearshore bathymetry. While the entrance berm of the lagoon is of a dynamic nature, there is no evidence suggesting any long-term migration of beach sand into the lagoon. This is because the relatively short time the lagoon is tidal and hence the lack of an enduring process to develop a flood tide delta. The coarser fraction of the terrestrial sediments from the catchment are being trapped towards the rear of the lagoon, in each of the four embayments, and do not appear to be supplying beach sized material into the open coast compartment, although much of the finer fractions of terrestrial sediments are discharged during breakout. Assuming that the shell supply to the beach from the offshore reefs has reached a long-term state of balance with the rate of shell breakdown, Avoca demonstrates the characteristics of a closed coastal compartment. During severe storms, the beach and dunes, erode and escarpments form at the back of the beach. The sand moves offshore to form bars but is contained within the compartment by the headlands and offshore reefs. During the ensuing quieter periods, the sand moves onshore again to reform the beach and the dunes. Depending on the severity of the storm, the recovery phase may be relatively short or may take some years, as it did following the storms of the 1970s. During the extreme storm events, large scale “mega rips” tend to form within the relatively embayed beaches of the Central Coast (Short, 1985; Evans et al., 2000). Mega rips provide a mechanism for the seaward transport of sediment to considerable depths and possibly even the inner continental shelf where it may have difficulty returning to the beach (i.e. permanently lost to the compartment). Localised erosion associated with rip development has been observed by Council officers on Avoca beach both during and immediately following storms in both 1974 and 1978 (PWD, 1994). Large scale mega rips have been observed by Council officers on the beach during storms. The erosion associated with these rips is reported in PWD (1994) to have directly threatened development north of Avoca lagoon entrance. Similarly the lagoon entrance and the adjacent beach experiences a state of dynamic equilibrium with breakouts and closures resulting in short-term beach cut and fill of the adjacent berm. That is, while in the very short-term the lagoon entrance berm is a source of sand for the surf zone, it rapidly becomes a sink as the entrance closes. However, overall it is neither a source nor sink in the medium term as the berm simply rebuilds to its former shape. Only lagoon entrances that remain open for extended periods because of the tidal volume of the estuary, such as Narrabeen Lagoon, behave as a sink as the flood tide delta progressively encroaches into the lagoon.
WRL Research Report 253 FINAL REPORT May 2013 16
Figure 2.5.3* Avoca Bathymetry and Conceptual Sediment Budget: There is likely no sand supply to the compartment sediment budget; potential sediment losses are through (i) lagoon sequestration, (ii) dune overwash, (iii) mega rips and (iv) shell degradation.

WRL Research Report 253 FINAL REPORT May 2013 17
2.2.4 Sediment Budget Considerations with Climate Change
Although Avoca Beach is believed to be currently in a state of dynamic equilibrium it is potentially quite vulnerable to changes in sea level and/or net wave energy flux because of the limited volume of sediment contained within the compartment. It has a potential vulnerability to alteration in shell production or shell degradation rates, lagoon sequestration, loss through mega rips and dune overwash. Given the size of the headlands and offshore reefs and the lack of excess sediment in adjacent compartments it is not considered likely that even significant changes in sea level and/or net wave energy flux will trigger longshore movement of sand into or out of the Avoca Beach compartment. Similarly, it is considered highly unlikely that climate change will trigger any onshore or offshore movement across the offshore boundary of the compartment. However, a rising sea level and/or an increase in wave energy is likely to cause the entrance berm of the lagoon to be overtopped and rolled back further into the lagoon. Combined with the impacts of a sea level rise and/or change in wave energy flux the lagoon berm roll back is likely to produce a three dimensional response from the active beach system. That is, not only is there likely to be shoreline recession in response to sea level rise but also there is likely to be a component of recession produced by the on-shore loss of beach sediment into the lagoon as the berm will need to be larger in order to accommodate the greater berm height. In the northern section of the bay the principal issue is the limited amount of material available in the dune formation. Experience during the 1970s suggests that well developed dunes in this region were only just sufficient to withstand the storm cut produced by the combination of 1970s storms. Any change in net wave energy flux may alter the alignment of the embayment. Given the relatively delicate balance and proximity of developed assets to the back of the beach any significant change of alignment would have consequences for both ends of the beach. A review of the predicted wave climate scenarios and a qualitative assessment of the sensitivity to potential changes in wave climate are reported in Appendix D. Climatic changes to rainfall may result in either more or less lagoon breakouts. A greater number of breakouts mean more instability of the beach in the vicinity of the entrance. A lesser number of breakouts mean higher berm levels and hence higher flood levels in the lagoon. Further, a rise of sea level will result in a higher berm and hence higher flood levels, regardless of changes in rainfall. An increase in average lagoon levels will result from increased entrance berm levels. This will produce two separate impacts. Firstly the elevated lagoon levels will be akin to setting the lagoon back in time in regard to the fringing ecology and the ability to accept sediments from the catchment. Secondly, it will also increase the water table elevation in the beach and the phreatic line profile through the back-of-beach sediment deposits thereby decreasing the stability of the foundations of the residential development in this region. The question of shell production and degradation also need to be considered (Laxton, 2009). Given the relatively high proportion of shell material making up the total volume of material available in the compartment, a reduction in the volume could significantly increase shoreline recession, over and above what would otherwise be expected. However, this vulnerability is
WRL Research Report 253 FINAL REPORT May 2013 18
expected to be minor within the timeframe considered for this study. With some researchers postulating acidification of the oceans as a result of climate change (Guinotte and Fabry, 2008; Wright and Davidson, 2007), with a resulting drop in shell production and potential increase in degradation, it is pertinent to consider a sensitivity analysis of what a reduction in shell might mean. Unfortunately, at this point of time, the issue of acidification and potential shell loss is unclear with some researchers convinced it will occur while others such as Carter (2010) argue that it will not. The dunes at the northern end of the beach are of sufficient elevation that even a 0.9 m sea level rise is unlikely to result in losses due to overwash. However, at the southern end of the embayment, the relatively low relief of the area immediately behind the present-day beach means that overwash losses are likely to occur as the area behind the current beach builds up to the same relative level as exists today between the ocean and the land. That is, for the low-lying areas it could be expected these will potentially elevate by up to 0.9 m. In summary the key issues to consider with climate change are (Figure 2.5.3*):
• Loss of sediment due to lagoon sequestration; • Loss of sediment via overwash at the south end of the beach; • Loss of sand through large scale “mega rips” during extreme storm events; and • Potential shell degradation.
2.3 Cabarita Beach, NSW
Cudgen Headland is the northern point of the Cabarita (Casuarina-Salt) compartment. It is approximately 10 km south of the border between New South Wales and Queensland. The Cabarita compartment stretches 8 km south from Cudgen Headland to Norries Head in the village of Bogangar and includes in the central-north section, the recent developments of Casuarina and Salt (Figure 2.6). In this section an overview of the site, its geomorphology and its geological evolution (Figures 2.7 and 2.7.1) are presented. The sediment budget is also discussed in this section while an in-depth description of the relevant coastal processes (including wave and water level analysis) at the study site is presented in Appendix A.
2.3.1 Evolution
The Cabarita compartment contrasts to that of Avoca. During the Pleistocene high sea levels, significant quantities of sandy sediment were deposited to form an extensive coastal plain on the seaward side of the basalt hinterland ( Figures 2.7 and 2.7.1). The Pleistocene deposits are up to 50 m thick (PWD, 1979) and today are recognisable in two different surface forms: slightly elevated (former) beach ridges, with crest levels at about 6 m AHD, between 1.5 and 4 km inland from the current beach; and a low level (1 m to 2 m above sea level), swampy, sand sheet to the east of the beach ridges, between the ridges and Cudgen Creek. This type of overall Pleistocene deposit is termed an Inner Barrier (Thom, 1965). Unlike Avoca, the Pleistocene deposits of the Inner Barrier at Cabarita experienced only minor erosion, in set drainage paths, as the sea receded to its 17,000 years BP low of -130 m, approximately 25 km offshore of the present Cabarita shoreline. The proximity, and drainage paths, of the Tweed Valley to the north may have accounted for the lack of runoff scour of the Pleistocene deposits at Cabarita during the lower sea level phase, however, the disturbed agricultural land in the northern end of the compartment may disguise a Glacial Low drainage path.

WRL Research Report 253 FINAL REPORT May 2013 19
The Holocene transgression transported sediments up from the continental shelf as the sea level rose from 17,000 years BP to 6,000 years BP (Roy and Thom, 1981). This led to the formation of the Outer Barrier which is about 0.5 km wide at its widest part, although it may have been wider when first formed. The post 6,000 years BP longshore redistribution of sediments due to the dominant northward littoral drift system, may mean that today’s Outer Barrier shoreline also reflects a state of long-term coastal recession since the barrier formed. Furthermore, although narrower than the Inner Barrier, the land surface is higher with dune crests up to 10 m to 15 m above sea level. The Outer Barrier has been heavily sand mined, hence much of today’s surface relief is artificial. However, the pre-mining evidence suggests the original dunes were of the same general elevation as today’s surface and miners were usually required to restore the mined areas to something approaching its pre-mined form. Based on experience elsewhere, the Outer Barrier dunes are generally higher than would otherwise be expected from Holocene beach ridge formations. This may mean that at some time in the past the vegetation of the Outer Barrier was destabilised and the barrier subjected to wind driven landward transport processes that formed transgressive dunes; an indicator of a past inland sediment movement by wind. Cudgen Lake and Cudgen Creek form a continuous estuary system that was created when the sand of the Outer Barrier stopped migrating landward. They are the low-lying swale trapped between the Outer and the Inner Barriers. Both the Lake and the Creek are on the Pleistocene deposit as a result of the Holocene barrier forming a shore-parallel berm along the full length of the compartment. The resulting relatively flat drainage slopes of the Creek bed cause it to meander northward from the Lake, through the wide swale between the Inner and Outer Barriers, until it exits to the north of Cudgen Headland. The Lake and Creek therefore play no part in the present day coastal processes of the Cabarita compartment and would only do so if the Outer Barrier was breached. Even with the high range sea level rise projections this outcome is highly unlikely within several centuries.
2.3.2 Site Description
The Cabarita–Casuarina-Salt compartment is a 8 km long relatively straight beach facing east, extending from Norries Head in the south to Cudgen Headland to the north (Figure 2.6). Cabarita Beach consists predominantly of medium grained sand across its width (typical grain size, D50 = 0.25 mm; carbonate content ~10%), of a consistent size throughout the compartment. In this region of the NSW coast there is a strong net northward littoral drift system due to the obliquity of the net wave energy flux to the overall coastal alignment (Hoffman, 1979; PWD, 1982; WBM, 2001; Chapman et al., 1982). Both Norries Head and Cudgen Headland locally anchor the overall coastal alignment but do not protrude sufficiently to present a significant impediment to the average net northward littoral drift that dominates the region. The reefs off both headlands are of low relief and hence they also have minimal impact on the average net drift. There is a slight zeta shape to the shoreline, immediately north of Norries Head and north of Cudgen Headland, characteristic of a beach with a south to north net longshore transport in the nearshore zone and which is indicative of the role of the headlands as intermittent interrupters of the northward littoral drift.

WRL Research Report 253 FINAL REPORT May 2013 20
The main dune system is extensive and relatively high at typically 6 to 10 m AHD, the higher dunes being in the central beach area. It has been re-contoured after extensive sand mining in the 1960-70s to a more or less even slope in most areas, sloping seawards from the Kingscliff-Bogangar road which runs along a back barrier dune ridge at an of elevation 10 m AHD at its western extremity, some 250 to 300 m from the beach. The dune barrier is today covered with casuarina trees (casuarina cristata) where not developed. Diagrams of representative beach profiles are presented in Figure 2.8. A recreation reserve exists at Norries Head. This reserve extends north-west from the headland to cover the narrow strip of land between Cabarita township and the beach. It terminates at the northern end of the township. A similar reserve at the northern end of the beach unit extends some 1.5 km south from Cudgen Headland. To the west of the road, the barrier dunes gently slope down to low lying wetlands and the Cudgen Lake/Cudgen Creek system. This system flows out of Cudgen Lake towards the north behind the barrier dunes and discharges through minor rock training walls at Kingscliff, adjacent to the northern side of Cudgen Headland. Development in the 2000s established new residential and commercial centres known as Salt and Casuarina Beach along the central portion of the beach. This development occupies a substantial part of the previously mined dune barrier commencing about 2 km north of Norries Head and is planned to extend northward eventually for a distance of about 5 km. Erosion reportedly in 1974, although possibly in 1967, created a distinct scarp in the main dune which persists today. In the central beach area, the top of this scarp is some 10 to 12 m AHD, while to the north and south it reaches to a height of about 5 to 6 m. A well- developed foredune exists seaward of the toe of the scarp in the main dune (WBM 2001). Inspections and surveys over the past 20 years show that this foredune extends up to 50 m wide, is typically well vegetated with sand binding spinifex grass, and is wind formed to a peak height of about 4 to 5 m AHD. At some locations, this foredune is separated from the main dune erosion scarp by a swale in which thick vegetation, both native and exotic, is prevalent. A complicating feature of the Cabarita compartment is the shape of the offshore profile. While the normally expected concave-up shape of the profile extends offshore to approximately 35 m of water depth, around 2 km offshore, the profile then becomes convex up, out to 50 m of depth, approximately 7 km offshore. Insufficient information is available to interpret this anomaly, however, Hoffman (1979) and PWD (1982) speculated that it could be evidence of an offshore sand lobe.
2.3.3 Sediment Budget Considerations Present Day
A vegetated dune backs Cabarita Beach, between the beach and the development, with the rest of the Holocene Outer Barrier either developed or well vegetated. There is no evidence of any significant, present day, wind driven sand losses into the dunes along the length of the compartment. Hence this potential sink can reasonably be eliminated from sediment budget considerations. The Cudgen estuary (Lake and Creek) forms a shore parallel feature inland of the Outer Barrier deposit. The estuary exits to the ocean to the North of Cudgen Headland. Therefore, while technically the estuary is within the Cabarita compartment its interaction is not with the Cabarita
WRL Research Report 253 FINAL REPORT May 2013 21
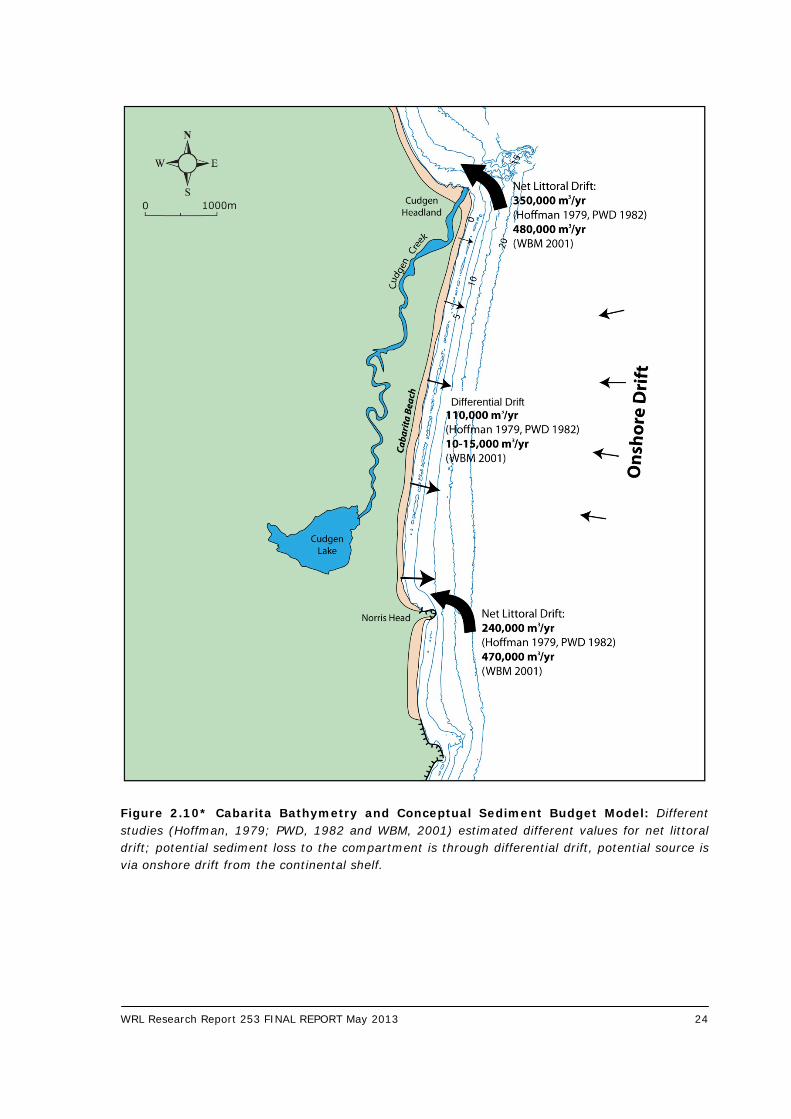
compartment but rather with the Kingscliff compartment. That is, there are no losses or gains from, or to, the Cabarita coastal compartment from the Cudgen estuary. Hoffman (1979) and PWD (1982) pointed to a long-term recessional trend of the shoreline resulting in a progressive retreat of the active beach into the back-of-beach Holocene dune formation. This on-going loss of sediment from the Holocene formation should be considered, in terms of the sediment budget, as a “source” of material to the coastal process system. Based on the previous offshore sedimentology and geology studies (PWD 1982; Hoffman 1979) the offshore boundary of the Cabarita coastal compartment can reasonably be assumed to be the 35 m depth contour. The inshore limit of the lobe, postulated by Hoffman (1979) and PWD (1982) is at 35 m, which is also the likely outer limit of the active coastal profile movement. However, the possibility of sediment exchange from the offshore lobe back into the inshore coastal zone was considered in the compartment sediment budget and long-term coastal response (see Table 11). The key to understanding the Cabarita sediment budget is the consideration of the differential littoral drift occurring within the compartment, i.e. the difference between the net littoral drift of sediment flowing into the compartment from the south around Norries Head and the net littoral drift flowing out of the compartment to the north around Cudgen Headland. An yearly average net is used because in any one year the drift may vary markedly as both the gross and the net drift will be dependent on the wave climate for the year and the availability of sand on the south side of Norries Head. Refer to the Glossary of Terms section for useful definitions of technical terms. As previously described, the headlands at Norries and Cudgen both act like groynes protruding through the active surf zone. Sand tends to build up on their south (updrift) sides until bypassing occurs when the updrift areas are filled to capacity. During times of elevated wave action a pulse of sediment can be moved around the headland, often partially depleting the updrift area, which has to re-fill before bypassing is again fully established. Figure 2.9* shows aerial photographs of a ‘sand pulse’ bypassing Cudgen Headland into Kingscliff, north of the Cabarita compartment. This behaviour must be taken into account both when analysing historical shoreline data and when postulating the inner workings of the coastal process system of the compartment. Hence, while it is important to recognise that the “sediment pulse effect” can dictate shoreline and bar behaviour within the compartment, it is, however, the average net differential of inflow versus outflow, that determines whether the shoreline of the compartment is undergoing long-term recession. Hoffman (1979) and PWD (1982) assessed the net drift around Norries Head to be 240,000 m3/year and the average net littoral drift differential for the Cabarita compartment to be 110,000 m3/year. This implies an average recession rate of 0.9 m/year that, as Hoffman (1979) and PWD (1982) noted, agrees surprisingly closely to the average 1 m/year recession rate calculated from the analysis of aerial photography and survey data. That is, the littoral drift differential into and out of the compartment is made up by long-term shoreline recession. Figure 2.10* shows a conceptual model of littoral drift through the Cabarita compartment.

WRL Research Report 253 FINAL REPORT May 2013 22
Figure 2.9* Photographs of Sediment Pulse Around Cudgen Headland: Cudgen Headland and Cudgen Creek training wall during normal conditions (above) and with sand pulse bypassing into Kingscliff (below). (Source Google earth®)
WRL Research Report 253 FINAL REPORT May 2013 23
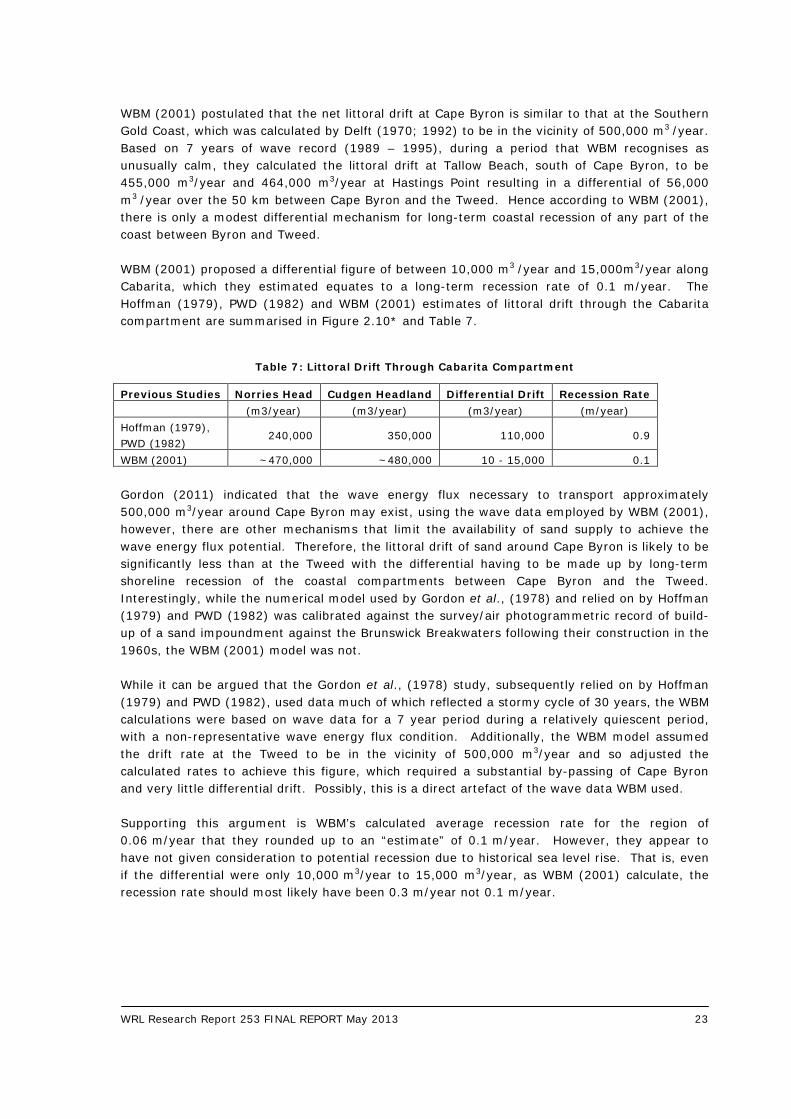
WBM (2001) postulated that the net littoral drift at Cape Byron is similar to that at the Southern Gold Coast, which was calculated by Delft (1970; 1992) to be in the vicinity of 500,000 m3 /year. Based on 7 years of wave record (1989 – 1995), during a period that WBM recognises as unusually calm, they calculated the littoral drift at Tallow Beach, south of Cape Byron, to be 455,000 m3/year and 464,000 m3/year at Hastings Point resulting in a differential of 56,000 m3 /year over the 50 km between Cape Byron and the Tweed. Hence according to WBM (2001), there is only a modest differential mechanism for long-term coastal recession of any part of the coast between Byron and Tweed. WBM (2001) proposed a differential figure of between 10,000 m3 /year and 15,000m3/year along Cabarita, which they estimated equates to a long-term recession rate of 0.1 m/year. The Hoffman (1979), PWD (1982) and WBM (2001) estimates of littoral drift through the Cabarita compartment are summarised in Figure 2.10* and Table 7.
Table 7: Littoral Drift Through Cabarita Compartment
Previous Studies Norries Head Cudgen Headland Differential Drift Recession Rate (m3/year) (m3/year) (m3/year) (m/year) Hoffman (1979), PWD (1982)
240,000 350,000 110,000 0.9
WBM (2001) ~470,000 ~480,000 10 - 15,000 0.1 Gordon (2011) indicated that the wave energy flux necessary to transport approximately 500,000 m3/year around Cape Byron may exist, using the wave data employed by WBM (2001), however, there are other mechanisms that limit the availability of sand supply to achieve the wave energy flux potential. Therefore, the littoral drift of sand around Cape Byron is likely to be significantly less than at the Tweed with the differential having to be made up by long-term shoreline recession of the coastal compartments between Cape Byron and the Tweed. Interestingly, while the numerical model used by Gordon et al., (1978) and relied on by Hoffman (1979) and PWD (1982) was calibrated against the survey/air photogrammetric record of build-up of a sand impoundment against the Brunswick Breakwaters following their construction in the 1960s, the WBM (2001) model was not. While it can be argued that the Gordon et al., (1978) study, subsequently relied on by Hoffman (1979) and PWD (1982), used data much of which reflected a stormy cycle of 30 years, the WBM calculations were based on wave data for a 7 year period during a relatively quiescent period, with a non-representative wave energy flux condition. Additionally, the WBM model assumed the drift rate at the Tweed to be in the vicinity of 500,000 m3/year and so adjusted the calculated rates to achieve this figure, which required a substantial by-passing of Cape Byron and very little differential drift. Possibly, this is a direct artefact of the wave data WBM used. Supporting this argument is WBM’s calculated average recession rate for the region of 0.06 m/year that they rounded up to an “estimate” of 0.1 m/year. However, they appear to have not given consideration to potential recession due to historical sea level rise. That is, even if the differential were only 10,000 m3/year to 15,000 m3/year, as WBM (2001) calculate, the recession rate should most likely have been 0.3 m/year not 0.1 m/year.
WRL Research Report 253 FINAL REPORT May 2013 24
Figure 2.10* Cabarita Bathymetry and Conceptual Sediment Budget Model: Different studies (Hoffman, 1979; PWD, 1982 and WBM, 2001) estimated different values for net littoral drift; potential sediment loss to the compartment is through differential drift, potential source is via onshore drift from the continental shelf.
Differential Drift
WRL Research Report 253 FINAL REPORT May 2013 25
Given the significant differences (up to an order of magnitude) in the existing study results in regard to both the net drift and the drift differential, and the very real question about how representative each study is over a full Inter-decadal Pacific Oscillation (IPO) cycle of 60 to 80 years, it would be prudent to adopt a sensitivity approach when setting up the coastal compartment model for Cabarita. The lower and upper bounds of net littoral drift differential should be set to 10,000 m3/year and 120,000 m3/year, respectively.
2.3.4 Sediment Budget Considerations with Climate Change
The following components of the sediment budget within the Cabarita compartment were considered in the perspective of climate change:
• Sediment exchanges (loss or gain) from the beach to the dune system; • In situ biogenic sediment production/degradation; • Sediment exchange at the offshore boundary (onshore drift); and • Littoral drift of sediment into and out of the coastal compartment.
Climate change may alter the wind and rainfall regimes in the Cabarita region, however, it is unlikely that the changes will de-stabilise the dunes and vegetation, given the intensity of development, and the incentives to manage the dune vegetation. Therefore, as for the present, it is considered reasonable to assume that it is not likely that the dunes will become a future sink, in terms of the sediment budget. Further, the dunes have sufficient elevation that an overwash sediment loss into the dunes at a higher (0.9 m) sea level is unlikely. As with the present day situation, however, the long-term recession of the shoreline into the Holocene formation will mean that the dunes are a source of material for the overall sediment budget. The shell content of the beach and dune systems is low (~10%) and there is only a modest amount of reef offshore, not just at Cabarita but also for the coastline well to the south. Therefore, should acidification of the oceans occur, there are only minor implications in terms of this being a potential cause of a significant change in the overall volume of either sand in the compartment, or sand being moved into or out of the compartment, in the future. In regards to the offshore boundary, a rise in sea level is likely to reduce any onshore sediment drift at the boundary. The most relevant potential issues to consider are:
• Any change in the littoral drift differential demand within the compartment as a result of changes to wave energy flux because of alterations in the location of weather systems (latitude shift in the weather systems);
• Changes in the net drift into or out of the compartment due to the greater outstand of the headlands from the coast, that, is their increasing “groyne effect” as a result of a raised sea level at the beach, and enhanced beach recession; and
• Changes to the sand supply to the compartment from the south because of changes to the availability of sand from the compartments to the south.
A review of the projected wave climate change scenarios and a qualitative assessment of the sensitivity to potential changes in wave climate are reported in Appendix D.
WRL Research Report 253 FINAL REPORT May 2013 26
2.4 Conclusions on Site Characterisation
The two sites present constraining geological settings and process regimes that are representative of coastal sediment compartments and beach types located within the NSW coast. At both sites, the geological settings define how sediment is exchanged between and on compartments. The main points to consider in the assessment of coastal response are presented below. At Avoca Beach: 1. The dominant sediment transport process within the compartment is cross-shore with the extensive offshore reefs and large headlands isolating it from the adjacent compartments. 2. Avoca is currently in a state of dynamic equilibrium, however, it is potentially vulnerable to changes in sea level and/or net wave energy flux because of the limited volume of sediment contained within the compartment. In particular the main issues to consider are:
• Direct impact of SLR on shoreline recession; • Alteration in shell production or shell degradation rates; • Lagoon and lagoon barrier sediment sequestration; • Sediment loss through dune overtopping and overwash; and • Sediment loss through “mega rips” during major storms.
At Cabarita Beach: 1. The dominant sediment transport is a net northward littoral drift due to the obliquity of the net wave energy flux to the overall coastal alignment. The headlands at the northern and southern end of the beach do not present a significant impediment to the northward net littoral drift. 2. Cabarita Beach is in a state of long-term recession caused by sediment imbalance within the compartment. It is expected that sea level rise will exacerbate recession. The main issues to consider in the assessment of future coastal response are:
• Direct impact of SLR on shoreline recession; • Changes in differential littoral drift caused by changes in wave energy flux; • Alteration in sediment exchanges at the offshore boundary; and • Changes in sediment supply from the south due to increased capacity of headlands to
impound sediment with SLR and/or decreased sediment availability from compartments to the south.
WRL Research Report 253 FINAL REPORT May 2013 27
3. Coastal Response to Short-term Processes
3.1 Storm Erosion
Coastal response to short-term processes refers to the rapid response of a beach to changing wave and water level conditions during or following ocean storms. During a storm, the beach will respond to wave attack by eroding. Beach erosion is defined as the removal by waves of sand from above mean sea level by a single extreme storm event, or from several storm events in close succession. Therefore, the timeframe considered for the assessment of coastal response is of the order of days to weeks to months i.e. the duration of a single or multiple closely spaced storm events. During storms sand is eroded from the beachface and transported offshore to the nearshore bars and shoreface. As the bars build up, wave energy dissipation within the surf zone increases and eventually wave attack at the beachface reduces if storm conditions were to persist. If the volume of sand available within the beach berm is not sufficient to meet the requirements for offshore transport and bar formation then erosion continues into the foredunes and ultimately in the backbeach area resulting in a threat to any infrastructure located there. Therefore, evaluation of beach erosion is crucial in the estimation of the potential hazard by storm events to coastal developments. The beach response to a storm is generally manifested in a “storm bite” from the sub-aerial beach moving sediment offshore during the storm. The amount of sand (typically above 0 m AHD) transported offshore by wave action is referred to as “storm demand” and typically expressed as a volume of sand per metre length of beach (m3/m). This volume estimate can be converted to a horizontal “storm bite” setback distance for hazard zone mapping, and coastal planning and management purposes. In engineering practice, an allowance for geotechnical slope instability is also considered for the determination of the horizontal setback distance (Figure 3.1).
3.2 Evaluation of Storm Erosion
In current engineering practice, the storm demand is usually determined for a representative length of beach, and can consequently be related to a horizontal setback based on site-specific beach profiles. Three approaches were considered in the estimation of the storm demand at the two study sites considered here:
1. Deterministic; 2. Semi-probabilistic; and 3. Fully probabilistic.
The deterministic approach widely used by practitioners is based on the analysis of historical beach survey records (when available) and photogrammetry data. Photogrammetry allows elevation data to be derived from historical aerial photographs. Historical beach profiles along the beach can therefore be obtained from the analysis of historical beach profile and volumes fluctuations. Gordon (1987) analysed 40 years of photogrammetry data at 19 coastal locations in NSW and derived empirical formulations relating storm demand to storm annual exceedance probabilities (AEP) or storm average recurrence intervals (ARI).
WRL Research Report 253 FINAL REPORT May 2013 28
Following the approach utilising process-based models introduced in Carley and Cox (2003), Shand et al., (2010; 2011) derived Synthetic Design Storm (SDS) from detailed statistical analysis of extreme storm characteristics including wave heights, periods and cumulative storm energy from available wave buoy data for a range of return periods. With a semi-probabilistic approach, SDS time series relative to different return periods can be used as inputs to a beach erosion model to provide estimates of beach profile fluctuations and storm demand for a range of probability of occurrence (Carley and Cox, 2003; Mariani et al., 2012). Callaghan et al., (2008; 2009) and Ranasinghe et al., (2011) implemented a fully probabilistic approach (Joint Probabilistic Method – Probabilistic Coastline Recession, JPM-PCR) to the data rich site of Narrabeen Beach NSW in order to obtain estimates of storm demand and long-term shoreline recession. The method was based on the derivation of joint probability distributions for extreme storm characteristics from wave buoy data, random generation of time series of storm sequences (clustering) and implementation of a simple dune erosion model to provide estimates of beach volume changes.
3.2.1 Historical Beach Profile Variations – Deterministic Approach
Estimates of extreme storm demands can be obtained from the analysis of historical beach profile variations due to large storms. Ideally, field data sets would incorporate pre- and post-storm beach profile and nearshore bathymetry. However, these data sets are often scarce and limited to selected key locations where beach surveys have been undertaken regularly and in concomitance with significant storm events. Narrabeen Beach and Bengello/South Broulee/Moruya Beach in NSW, and the Gold Coast in QLD are examples of data rich sites. In the usual absence of such survey records, photogrammetry data is important in identifying historical profile variations and deriving estimates of storm demand. The main limitations of photogrammetry data are that: it provides no information on the underwater bathymetry, and analysis is restricted to the dates for which aerial photography exists (usually 2 to 10 years apart) which does not necessarily coincide with pre- and post-storm conditions. As stated above, Gordon (1987) presented representative storm bite statistics for the New South Wales coast between Sydney and the Queensland border. Due to the limitations of photogrammetry, only eroded volumes above mean sea level were given. A distinction was made between volumes for “low demand, open beaches” and “high demand, rip heads” with the following equation presented:
• VL = 5 + 30 ln(ARI) (1) • VH = 40 + 40 ln(ARI)
Where:
• VL and VH are eroded volumes above AHD for “low demand, open beaches” and “high demand, rip heads”, respectively (m3/m);
• ln is the natural (base e) logarithm; • ARI is average recurrence interval (years);
Due to the nature of the timing of the aerial photography, the eroded volumes may not have resulted from a single storm event, but rather the cumulative effect of a sequence of several storm events. Thus the ARIs presented refer to “erosion event” eroded volumes rather than erosion arising from single storm events of a particular ARI.
WRL Research Report 253 FINAL REPORT May 2013 29
Gordon (1987) suggested that the erosion that occurs on the NSW coast for a 100 year ARI event falls between 140-220 m3/m for low and high demand beaches, respectively. It was cautioned by Gordon (1990) that the indicated equations are suggested relationships only and that the database behind them is limited. The findings, however, provide a useful order of magnitude for the erosion volumes expected for the NSW coast and has been widely used by practitioners for the past 25 years.
3.2.2 Synthetic Design Storms – Semi-probabilistic Approach
Synthetic design storms (SDS) time-series were derived from relatively long-term records (in excess of 30 years) of wave measurements from nine wave buoys Australia-wide by Shand et al., (2011). The methodology for the SDS derivation was introduced by Carley and Cox, (2003) and was implemented on a larger scale of wave buoy network by Shand et al., (2011). The derivation of SDS for a range of return periods (ARI) is based on extreme storm statistics analysis including the following parameters: wave height, wave period, storm duration, storm shape and cumulative storm energy. Examples of 100 year ARI SDS are presented in Figure 3.2. Shand et al., (2011) recommended that SDS derived within their study should be adopted for use in engineering design studies, hazard assessment and climate change adaptation studies. As presented in Carley and Cox, (2003) SDS can be used as input to a process-based erosion model to generate estimates of beach profile fluctuations and storm demand under a range of storm events with different probability of occurrence. The methodology was recently applied to generate estimates of storm erosion at 50 locations around Australia (Mariani et al., 2012). For the purpose of this study, the SBEACH model (Larson and Kraus, 1989; Kraus and Byrnes, 1990) was implemented at Avoca Beach and Cabarita Beach. SBEACH has been developed and extensively verified with field and laboratory data collected during major American field experiments (Duck and Super Duck experiments, Larson and Kraus, 1989). In Australia, SBEACH was successfully calibrated and verified for a number of beaches including Warilla, Collaroy, Narrabeen, Wamberal and the Gold Coast (Carley et al., 1998; Carley and Cox, 2003). At these sites, SBEACH was able to model measured storm erosion events. SBEACH is suggested in many state policies for the numerical modelling of beach erosion (Mariani et al., 2012).
3.2.3 Probabilistic Approach – JPM-PCR
Ranasinghe et al., (2011) presented a probabilistic semi-process based model (the Probabilistic Coastline Recession model, PCR). This model couples simplified erosion and accretion models with temporal forcing conditions (sequences of storm conditions followed by recovery periods) to provide estimates of storm erosion based on full temporal simulation of erosional and accretion events (Woodroofe et al., 2012; Callaghan et al., 2008). By including mean sea level changes in the temporal simulation, probabilistic estimates of shoreline position at a future date can be generated. A random process is implemented in PCR to generate sequences of storms sampled from joint probability distributions of storm characteristics (wave height, period, duration, etc.) derived from wave buoy data analysis (the Joint Probability Method, JPM, Callaghan et al., 2008). For computational efficiency, simplified erosion models (Larson et al., 2004; Kriebel and Dean, 1993) are used rather than more complete profile response models (although the authors note that such models could be incorporated). The approach was successfully applied to Narrabeen Beach where the exceptionally rich, long-term beach survey record (32 years of monthly beach survey, (Short and Trembanis, 2004))

WRL Research Report 253 FINAL REPORT May 2013 30
allowed model calibration (Ranasinghe et al., 2011) and validation of model storm demand predictions. Callaghan et al., (2009) compared JPM storm demand predictions at Narrabeen Beach to values predicted using the SDS method and observed that for return periods:
• Less than 3 years: SDS and JPM provided similar estimates; • Less than 10 years: SDS predictions were non-conservative and JPM compared well with
measured values; and • More than 10 years: accuracy of predictions could not be evaluated for sampling error
due to the “limited” 30 years record length. Callaghan concluded that for higher return periods (>10 years), the validity of SDS and JPM predictions could not be compared and both were feasible methods. The key identified weakness of the SDS method under-predicting known erosion statistics when SDS is applied with a single storm, can be overcome with the use of multiple sequential storms as recommended in Carley and Cox (2003) and WA State Policy. That is, a 10 year ARI erosion event will involve more erosion than that caused by a single 10 year ARI storm event, but will be comparable to the combined impact of a sequence of two or three (10 year ARI) storm events. While the JPM-PCR method presents a powerful framework for assessing short-term and long-term shoreline response, the reliance of the erosion and accretion models on site-specific calibration limits its application to the study sites considered here.
3.3 Avoca Beach
3.3.1 Previous Studies – Deterministic Approach
There have been a limited number of previous coastal hazard studies undertaken for this section of coastline, including PWD (1985), WRL (1988), PWD (1994), WBM (1995). These studies have all investigated the coastal erosion hazards caused by storm demand based on photogrammetric analysis of aerial photography. It should be noted that the more recent WBM (1995) study used results of the PWD (1994) storm demand analysis but re-contextualised them in a coastal management plan. The storm bite analysis on Avoca Beach as performed by WRL and PWD, was based on the volume changes between 22/4/72 and 19/6/74; 9/1/77 and 2/8/78; and 23/8/84 and 18/8/86 measured above 0 m AHD and 2 m AHD. These sets of photographs separated the major storm events in June 1974, June 1978 and August 1986. The PWD (1994) study reported that volume changes during storms were the largest in the central and northern parts of the beach. Maximum storm bite was measured between 22/4/72 and 19/6/74 just north of Avoca lagoon entrance. Here volume change of around 200 m3/m above 0 m AHD was measured. The calculated storm bite in the southern section of Avoca was found to be significantly lower (around 50 m3/m) due to its orientation offering natural protection for storm events originating from the south-east.

WRL Research Report 253 FINAL REPORT May 2013 31
Table 8: Design Storm Demands from Previous Studies
Representative Profile Location
Volume of Storm Demand (m3/m)
Previous Studies PWD (1985) PWD (1994) WBM (1995)(1)
Avoca North 200 120-160 205 Avoca Central North 200 150-200 205 Avoca Central South 50 50-170 100-200 Avoca South 50 0-60 50-100
Notes: (1) WBM (1995) study provides design storm erosion demand based on the results of the PWD (1994) study. It should be noted that the design volumes of storm demand given in the WBM (1995) study were significantly higher than PWD (1994) on the northern section of the beach as they allowed for additional storm erosion due to formation of rips during the storm. Moreover, while all the photogrammetric analysis was based on the volume changes in the beach system due to predominantly south-east wave attack, it is important to consider the potential risk of storm erosion at the southern end by east to north-east waves and adopt conservative erosion extents on this section of beach.
3.3.2 Synthetic Design Storms
SBEACH modelling for storm demand was carried out for a range of storm events with probabilities ranging from 1 to 100 year ARI and for single and a sequence of two and three storms. Detailed reporting of model setup, calibration and results are presented in Appendix B. The 100 year ARI synthetic design storms used as input to the SBEACH model for Avoca and Cabarita Beach are shown in Figure 3.3. Predicted storm demands for the 1, 10 and 100 year ARI storm events are presented for three representative locations (Figure 2.4) along Avoca Beach in Figure 3.4. Storm demand predictions using the Gordon (1987) empirical formulations are also plotted. A summary of the values is shown in Table 9.
Table 9: Storm Demand Predictions for Avoca Beach
Storm Demand (m3/m) Avoca South Avoca Central North Avoca North Previous Studies 50-100 150-205 120-205 Gordon (1987) 100 yr ARI 140-220 140-220 140-220 3×100 yr ARI SDS 90 140 140
For the lower range return periods (less than 10 years), the SDS predictions were in reasonably good agreement with the Gordon statistics and historical photogrammetry evidence (Figure 3.4). That is, they are representative at the three modelled locations along Avoca Beach and for both single and clustering of storms, with the sequencing of three storms yielding, as expected, the higher range of storm demands. For the higher return periods (more than 10 years), the single and sequencing of two storms significantly under-estimated storm demand in comparison to both Gordon predictions and site-specific photogrammetry analysis. The clustering of three storms, yielded predictions in reasonable agreement with the lower range of Gordon and predictions from previous studies in the northern, more exposed section of the beach. While in the southern, more sheltered part of
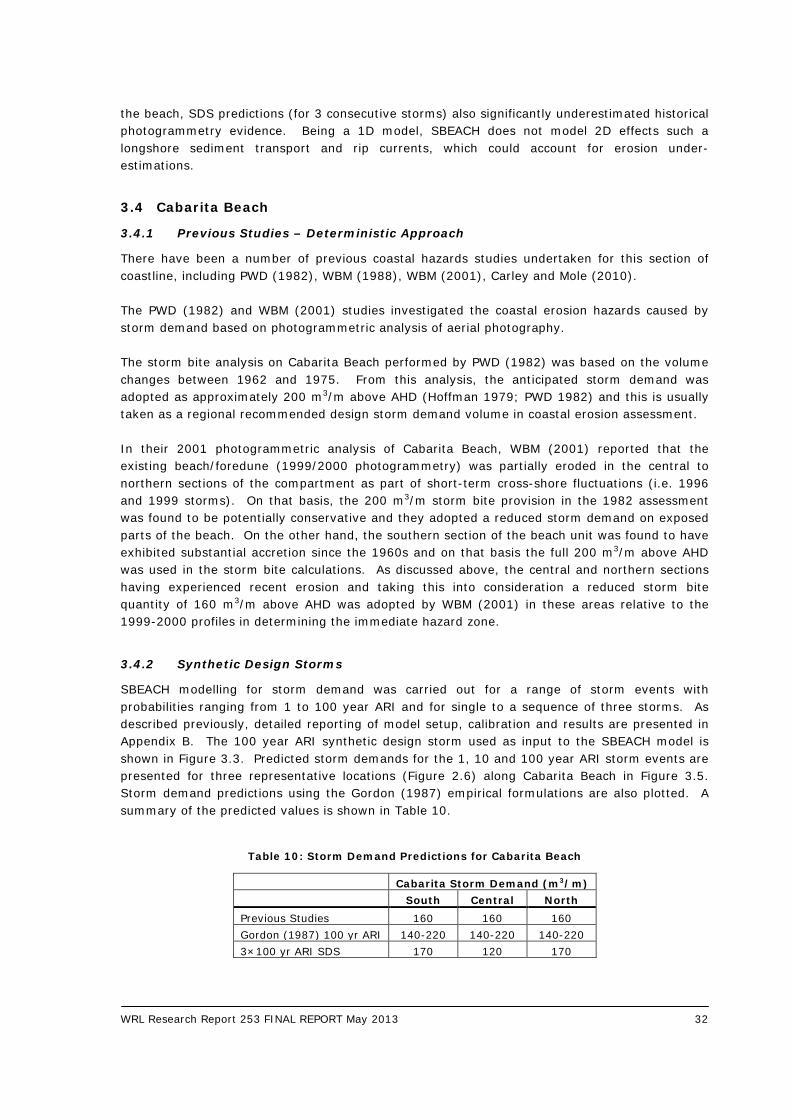
WRL Research Report 253 FINAL REPORT May 2013 32
the beach, SDS predictions (for 3 consecutive storms) also significantly underestimated historical photogrammetry evidence. Being a 1D model, SBEACH does not model 2D effects such a longshore sediment transport and rip currents, which could account for erosion under-estimations.
3.4 Cabarita Beach
3.4.1 Previous Studies – Deterministic Approach
There have been a number of previous coastal hazards studies undertaken for this section of coastline, including PWD (1982), WBM (1988), WBM (2001), Carley and Mole (2010). The PWD (1982) and WBM (2001) studies investigated the coastal erosion hazards caused by storm demand based on photogrammetric analysis of aerial photography. The storm bite analysis on Cabarita Beach performed by PWD (1982) was based on the volume changes between 1962 and 1975. From this analysis, the anticipated storm demand was adopted as approximately 200 m3/m above AHD (Hoffman 1979; PWD 1982) and this is usually taken as a regional recommended design storm demand volume in coastal erosion assessment. In their 2001 photogrammetric analysis of Cabarita Beach, WBM (2001) reported that the existing beach/foredune (1999/2000 photogrammetry) was partially eroded in the central to northern sections of the compartment as part of short-term cross-shore fluctuations (i.e. 1996 and 1999 storms). On that basis, the 200 m3/m storm bite provision in the 1982 assessment was found to be potentially conservative and they adopted a reduced storm demand on exposed parts of the beach. On the other hand, the southern section of the beach unit was found to have exhibited substantial accretion since the 1960s and on that basis the full 200 m3/m above AHD was used in the storm bite calculations. As discussed above, the central and northern sections having experienced recent erosion and taking this into consideration a reduced storm bite quantity of 160 m3/m above AHD was adopted by WBM (2001) in these areas relative to the 1999-2000 profiles in determining the immediate hazard zone.
3.4.2 Synthetic Design Storms
SBEACH modelling for storm demand was carried out for a range of storm events with probabilities ranging from 1 to 100 year ARI and for single to a sequence of three storms. As described previously, detailed reporting of model setup, calibration and results are presented in Appendix B. The 100 year ARI synthetic design storm used as input to the SBEACH model is shown in Figure 3.3. Predicted storm demands for the 1, 10 and 100 year ARI storm events are presented for three representative locations (Figure 2.6) along Cabarita Beach in Figure 3.5. Storm demand predictions using the Gordon (1987) empirical formulations are also plotted. A summary of the predicted values is shown in Table 10.
Table 10: Storm Demand Predictions for Cabarita Beach
Cabarita Storm Demand (m3/m) South Central North Previous Studies 160 160 160 Gordon (1987) 100 yr ARI 140-220 140-220 140-220 3×100 yr ARI SDS 170 120 170
WRL Research Report 253 FINAL REPORT May 2013 33
For the lower range return periods (less than 10 years), the SDS predictions were found to be within the range predicted using Gordon empirical formulations and historical photogrammetry evidence. At the three representative locations along Cabarita Beach, the single storm and the sequencing of two and three storms produced results within the lower, medium and higher range of Gordon’s envelope. For the higher return periods (more than 10 years), the single and sequencing of two storms significantly under-estimated storm demand in comparison to both Gordon predictions and site-specific photogrammetry analysis. The clustering of three storms, yielded predictions in reasonable agreement with the mid-lower range of Gordon predictions while they matched the storm demand predictions from previous studies in the southern and northern segment of the beach.
3.5 Summary of Coastal Response to Short-term Processes
While a fully probabilistic method (Callaghan et al., 2008; 2009) presents a potentially powerful framework for assessing short-term shoreline response, site-specific calibration limits its application to a small number of data rich sites. Moreover, the extrapolation of storm demand predictions from stochastic simulations to high return periods (100 year ARI or 1% AEP) is limited, for sampling error, by the data record length. Given that the actual annual probabilistic exceedance level selected in coastal erosion assessments is of the order of 1% AEP, i.e. 100 year ARI, the selection of a fully probabilistic method such as the JPM-PCR over a semi-probabilistic method such as the SDS approach is not presently feasible at the great majority of locations where data is generally limited. The use of Synthetic Design Storms derived from long-term wave buoy records to drive refined process-based erosion models (Mariani et al., 2012) offers a reliable alternative (Carley and Cox, 2003) to estimate storm erosion for different probabilistic scenarios at typical “data poor” locations. The erosion model’s dependence on a limited number of calibration coefficients is a key factor in the applicability and transferability of the models at different locations where pre- and post-storm survey data record are limited or not available. Results at the two case study sites show that the sequencing (clustering) of two or more storms is necessary to produce estimates of storm demand that match historical measurements. The application of the SDS approach to Avoca Beach showed that underestimation in prediction of storm demand for higher return periods is not uncommon. Or, the deterministic storm demand estimates by Gordon (1987) are overly conservative. Figure 3.6* summarises storm demand predictions using SDS at Avoca and Cabarita Beach. A key limitation is that two-dimensional effects such as rip currents, sediment loss due to longshore currents and overwash which have been observed to occur at Avoca Beach during large storms, are not modelled in SBEACH, and are plausible reasons for the underestimation of predictions. Long-term coastal planning and hazard definition also requires a consideration of other processes apart from storm erosion. The accuracy of the surfzone and nearshore bathymetry was found to be an important factor in the modelling of short-term erosion processes with under-prediction common when interpolation from offshore to the nearshore data is undertaken to compensate for lack of detailed nearshore surveys (Mariani et al., 2012). Consequently, high quality nearshore survey data is a necessary input for erosion modelling reliability.
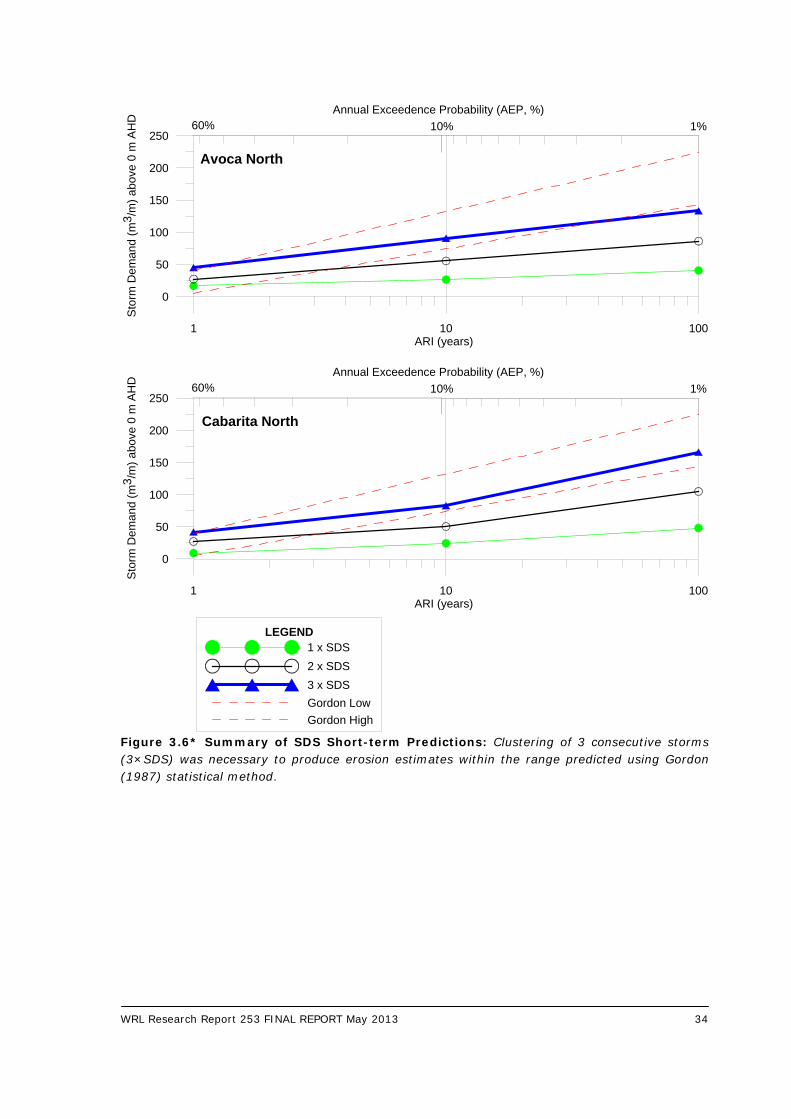
WRL Research Report 253 FINAL REPORT May 2013 34
Figure 3.6* Summary of SDS Short-term Predictions: Clustering of 3 consecutive storms (3×SDS) was necessary to produce erosion estimates within the range predicted using Gordon (1987) statistical method.
1 10 100ARI (years)
0
50
100
150
200
250S
torm
Dem
and
(m3 /
m) a
bove
0 m
AH
D 10% 1%60%Annual Exceedence Probability (AEP, %)
Avoca North
1 10 100ARI (years)
0
50
100
150
200
250
Sto
rm D
eman
d (m
3 /m
) abo
ve 0
m A
HD 10% 1%60%
Annual Exceedence Probability (AEP, %)
LEGEND1 x SDS2 x SDS3 x SDSGordon LowGordon High
Cabarita North
WRL Research Report 253 FINAL REPORT May 2013 35
The Marine LiDAR data made available by OEH for the two study sites proved adequate for the purpose of the modelling. However, the bathymetric data used in the modelling is only representative of a single morphodynamic beach state corresponding to when the survey was undertaken. The initial state of the beach is an important factor to consider. The contribution of the surfzone gradient and morphological features, such as sand bars, to the final erosion estimates are as important as the choice of the hydrodynamic input. Differing beach types occur in a spatial and temporal continuum with storm events and accretionary periods driving a transformation in beach type due to the co-adjustment of beach and surf zone morphology to re-establish dynamic equilibrium with the higher (lower) wave power. As such, a more dissipative surfzone profile (at the time of the bathymetric survey) would lead to lower estimates in the prediction of storm demands. When detailed nearshore bathymetry data is available for different dates, the analysis and the modelling of the corresponding beach states is recommended.
3.6 General Conclusions on Short-term Response
1. Fully probabilistic methods (Callaghan et al., 2008; 2009) present powerful frameworks for assessing short-term shoreline response. However, site-specific calibration limits its application to sites where extensive data record exists for both beach response, and wave and water level conditions. 2. The use of Synthetic Design Storms derived from long-term wave buoy records to drive refined process-based erosion models (Mariani et al., 2012) offers a reliable alternative (Carley and Cox, 2003) to estimate storm erosion for different probabilistic scenarios at typical “data poor” locations. 3. To provide realistic predictions of beach erosion during storm events, storm clustering needs to be taken into consideration as well as two-dimensional effects such as rip currents, sediment loss due to longshore currents and overwash. 4. Surfzone and nearshore bathymetric data is crucial for the modelling of beach erosion processes.
WRL Research Report 253 FINAL REPORT May 2013 36
4. Coastal Response to Long-term Processes
4.1 Shoreline Recession
Shoreline recession refers to the long-term trend of a shoreline to move landward in response to a net loss in the sediment budget. Additional shoreline recession is also predicted to result from future sea level rise. Beaches undergo long-term fluctuations which may involve either the addition or removal of sediment. Those beaches receiving a net addition of sediment, are called accreting or prograding beaches. While still experiencing short-term erosion events, these beaches generally display a seaward movement or progradation of the beach-foredune system over time. Beaches undergoing longer term removal of sand are called receding beaches and experience a landward migration of the beach/ dune system. They are generally characterised by a prominent back beach escarpment which moves landward during major storm events. The timeframe related to long-term processes is of the order of decades to centuries and millennia. However, for engineering assessments and coastal planning purposes, the timeframe considered is typically of the order of 50 to 100 years. For the purpose of this study, the 2100 future scenario was considered. Current engineering practice considers separately:
• Ongoing underlying shoreline recession; and • SLR shoreline recession.
Both are expressed in terms of change over years in volume of sand within the active beach system (m3/m/year) and/or corresponding landward shoreline movement (m/year).
4.1.1 Ongoing Underlying Shoreline Recession
Shoreline recession may result from increasing water levels and/or sediment loss due to imbalance in longshore/cross-shore sediment transport, aeolian sand transport or irregularities in longshore alignment due to beach rotation. Long-term trends of underlying shoreline recession are typically estimated from the analysis of long-term data records of beach surveys or historical photogrammetry data by:
• Assessing the change over years in volume of sand within the beach and the dune system; and
• Assessing the shoreline evolution. Typically in NSW, the upper dune face (between +3 and +6 m AHD contours) would be used as the morphological indicator of the shoreline as it lies above the seasonal fluctuations of beaches.
As an example, Figure 4.1 shows the +4 m AHD contour position in 1967, 1987 and 2010 for Belongil Beach, Byron Bay, NSW.
WRL Research Report 253 FINAL REPORT May 2013 37
4.1.2 Shoreline Recession due to Sea Level Rise
While it is a commonly applied theory that an elevation in sea level will result in recession of the coastline (Bruun, 1962; 1983; Cowell et al., 1992; Komar et al., 1997), much controversy remains in regard to the methods for quantifying the future recession due to SLR. A number of methods for estimating coastal response to changes in sea level have been developed over the past 50 years. These methods include approaches based on basic geometric principles to more complex process-based assessment. While some methods are used more widely than others, none have been proved categorically correct nor adopted universally. Mariani et al., (2012) provided a general overview of methods to estimate SLR recession including the Bruun model (1962), the Shoreface Translation Model (Cowell et al., 1992; 1995), the Komar et al., (1997) Geometric Model of Foredune Erosion, the Probabilistic Coastline Recession model (Ranasinghe et al., 2011), Shoreline Response Model (Huxley, 2009), etc. The most widely known and applied model for beach response is that of Bruun (1962). The Bruun model assumes that as sea level is raised, the equilibrium profile is moved upward and landward conserving mass and original shape. This occurs by the following assumptions (SCOR, 1991):
1. The upper beach is eroded due to the landward translation of the profile; 2. The material eroded from the upper beach is transported immediately offshore and
deposited, such that the volume eroded is equal to the volume deposited; and 3. The rise in the nearshore profile as a result of this deposition is equal to the rise in sea
level. Validations, limitations and critical reviews of the Bruun model application are provided within SCOR (1991); Cooper and Pilkey (2004); Cowell et al., (2006) and Ranasinghe et al., (2007). However, in general, while the overall principles of the Bruun model (i.e. an increase in sea level results in an upward and landward shift in the profile) can be verified for particular geomorphic and geologic circumstances, the quantitative accuracy of the Bruun Rule has not been verified.
4.2 Coastal Compartments - Sediment Budget Approach
In order to evaluate the applicability and relative merits of a deterministic versus a probabilistic approach in the perspective of a coastal compartment classification, a sediment budget approach was adopted for the present study. A sediment budget approach provides a logical methodology for defining the boundaries and boundary conditions of coastal compartments. A sediment budget approach also provides the natural framework for evaluating long-term shoreline response to climate change. For a given sea level, if more sand enters than leaves over/through the longshore, offshore and onshore boundaries of a compartment, then it accretes/progrades. Conversely, if more sand leaves than enters, it erodes/recedes. A sediment budget approach provides the methodology for examining “sources” and “sinks” of sediment associated with a coastal compartment thereby enabling determination as to whether there is a net gain (accretion) or a net loss (erosion), and hence the shoreline reaction.
WRL Research Report 253 FINAL REPORT May 2013 38
Furthermore, if the sea level alters, as a consequence of climate change, then the sediment budget may also alter as the flow of sediment across the boundaries may change. The availability of sediment within the compartment to adjust to a sea level change may become limited. Similarly, the amount of sand entering or leaving a coastal compartment may alter if the net wave energy flux, or the net wind energy flux alters. The sensitivity of the overall budget, hence of the shoreline behaviour, to climate change impacts can be usefully tested using this approach.
4.2.1 Model Development
A simple two-dimensional model was developed for this study to be used as a platform to provide deterministic predictions and to simulate probabilistic variations of future coastal response. The model was based on a long-term sediment budget approach and a two-dimensional profile geometric transformation (Woodroffe et al., 2012; Cowell et al., 2006). The adopted approach is diagrammatically presented in Figure 4.2. The model’s simplicity was essential to allow the large number of iterations associated with the stochastic simulations required in this study. The choice of the model and its level of complexity and accuracy in the description of the coastal processes was not, per se, relevant in the perspective of this study, as this study aimed to provide a qualitative evaluation of deterministic versus probabilistic approaches at two contrasting coastal sites. The model rationale is that any change in time of beach profile elevation (h) is constrained by the principle of sediment mass continuity which in simple terms translates to:
dh/dt ∝ dQ/dt (2)
where Q is the net rate of sediment supply (loss) and depends on sediment exchanges at offshore/onshore/longshore boundaries and in situ production/degradation. Horizontal translations of the beach profile, R (m), are driven by changes in:
• Sea level, S (m); • Sediment budget; and • Beach profile geometry.
A number of assumptions were adopted in order to simplify the recession model. A description of the model setup is presented in Appendix C. In particular:
• Embayments were reduced to representative two-dimensional beach profiles extracted from (OEH) Marine LiDAR data analysis;
• While the model is time-dependent, it is driven only by changes in sea level and gains or losses in the sediment budget rather than any hydrodynamic forcing. A single time step, present day to 2100 scenario, was implemented for the purpose of this analysis;
• A simple geometric translation was implemented in the model to provide analytical solutions to equation (2). The geometric transformation did not accommodate variations in sediment properties across the profile or profile control by hard structures such as substrate geology or adjacent headlands or engineered structures. However, this simplification was considered reasonable for this study due to the beach and shoreface profile characteristics at the two study sites.
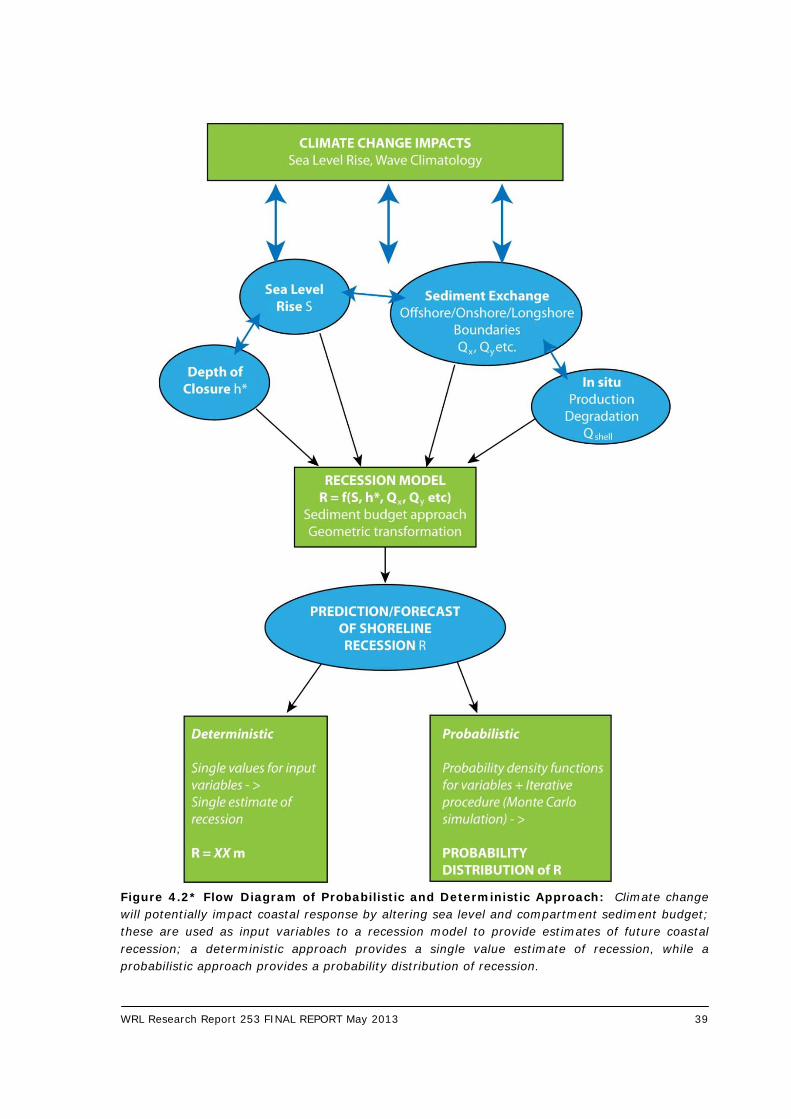
WRL Research Report 253 FINAL REPORT May 2013 39
Figure 4.2* Flow Diagram of Probabilistic and Deterministic Approach: Climate change will potentially impact coastal response by altering sea level and compartment sediment budget; these are used as input variables to a recession model to provide estimates of future coastal recession; a deterministic approach provides a single value estimate of recession, while a probabilistic approach provides a probability distribution of recession.
WRL Research Report 253 FINAL REPORT May 2013 40
4.2.2 Model Input Variables
The model variables defined the initial state of the coastal compartment and determined, through the application of the recession model, the predicted future (2100) shoreline behaviour (Figure 4.2*). The analysis of recent LiDAR bathymetric data and the sediment budget considerations described in Section 2 allowed the identification of:
• Geometric variables related to beach profiles representative of two study sites; and • Sediment budget variables relevant at the two study sites.
As described in Section 2, in defining the coastal compartment it was convenient to define the longshore boundaries as being headlands. The onshore boundary was established as being the landward limit of the active coastal zone, which included actively transgressive, wind driven, dunes. For ease of analysis, the offshore boundary was set as the limit of on shore/off shore sediment movement of the seabed profile. Detailed studies of a number of open coast locations in the Greater Metropolitan Sydney region showed that this is achieved by a depth of approximately 40 m (Gordon, 1990b; 2009). The following geometric variables were determined for each representative beach profile at the two study sites:
• Depth of closure; • Distance of closure; • Dune height; and • Total length of embayment;
The depth of closure is defined as the depth corresponding to the offshore limit of active sediment transport. Its determination is subject to large uncertainty, with practitioners generally relying on site specific geology/sedimentology evidence or empirical methods (Bruun, 1988; Hallermeier, 1978; 1981; 1983; and Birkemeier, 1985). The sediment budget variables considered losses or gains through:
• Sediment exchange across or through onshore, offshore and longshore boundaries; and • In situ sediment production or degradation.
A coastal compartment may be classified as “open” when there is sand flow across the boundaries, including the onshore landward boundary. Losses across the landward boundary may include wind driven transport across or losses into an onshore sink, such as an estuary. Sand gains across onshore boundaries can be due to terrestrial sands reaching the coastal compartment from river or creek transport, or when there is long-term recession into the Holocene or Pleistocene sandy deposits. Depending on the quantum of flow across boundaries a compartment may be fully open (for example, the longshore drift in around one headland is equal to the longshore drift out around the other headland), or partially open where the drift in is greater than the drift out. Where a coastal compartment is considered “closed” there is no flow of sandy sediments across any of the boundaries. At Avoca Beach, the site characterisation (Section 2) identified the following potentially relevant sediment budget components:
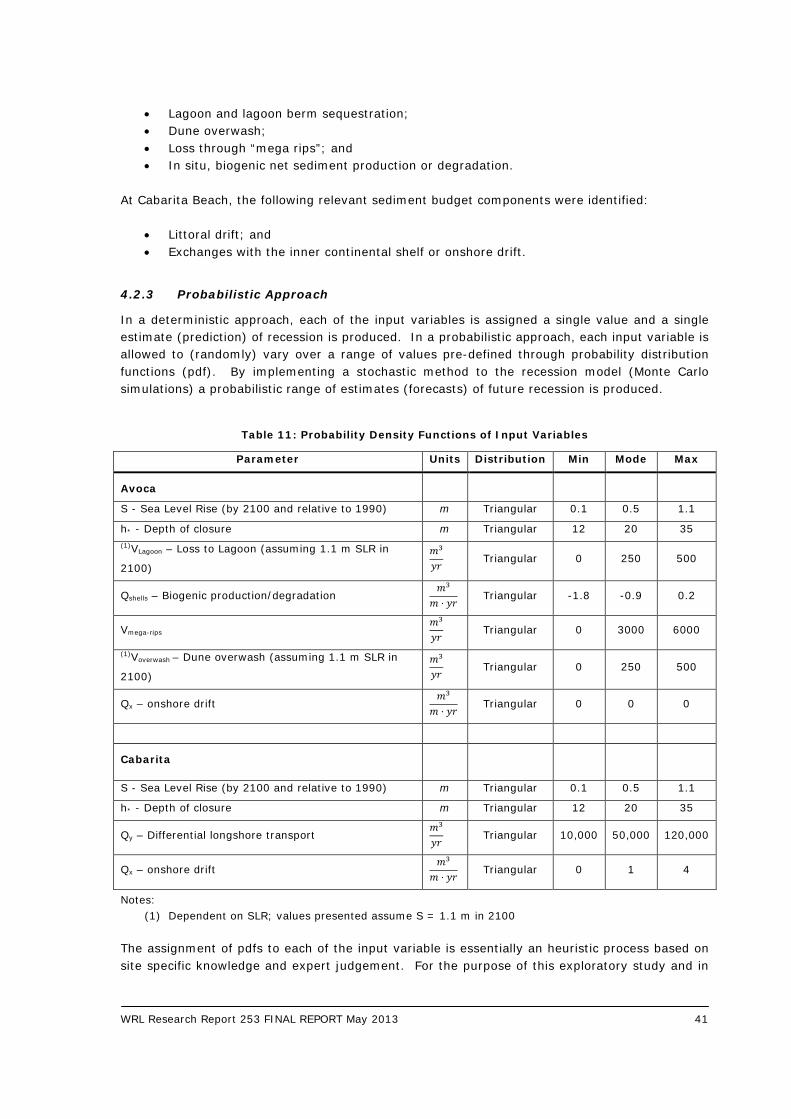
WRL Research Report 253 FINAL REPORT May 2013 41
• Lagoon and lagoon berm sequestration; • Dune overwash; • Loss through “mega rips”; and • In situ, biogenic net sediment production or degradation.
At Cabarita Beach, the following relevant sediment budget components were identified:
• Littoral drift; and • Exchanges with the inner continental shelf or onshore drift.
4.2.3 Probabilistic Approach
In a deterministic approach, each of the input variables is assigned a single value and a single estimate (prediction) of recession is produced. In a probabilistic approach, each input variable is allowed to (randomly) vary over a range of values pre-defined through probability distribution functions (pdf). By implementing a stochastic method to the recession model (Monte Carlo simulations) a probabilistic range of estimates (forecasts) of future recession is produced.
Table 11: Probability Density Functions of Input Variables
Parameter Units Distribution Min Mode Max
Avoca
S - Sea Level Rise (by 2100 and relative to 1990) m Triangular 0.1 0.5 1.1
h* - Depth of closure m Triangular 12 20 35 (1)VLagoon – Loss to Lagoon (assuming 1.1 m SLR in
2100) 𝑚3
𝑦𝑟 Triangular 0 250 500
Qshells – Biogenic production/degradation 𝑚3
𝑚 ⋅ 𝑦𝑟 Triangular -1.8 -0.9 0.2
Vmega-rips 𝑚3
𝑦𝑟 Triangular 0 3000 6000
(1)Voverwash – Dune overwash (assuming 1.1 m SLR in
2100) 𝑚3
𝑦𝑟 Triangular 0 250 500
Qx – onshore drift 𝑚3
𝑚 ⋅ 𝑦𝑟 Triangular 0 0 0
Cabarita
S - Sea Level Rise (by 2100 and relative to 1990) m Triangular 0.1 0.5 1.1
h* - Depth of closure m Triangular 12 20 35
Qy – Differential longshore transport 𝑚3
𝑦𝑟 Triangular 10,000 50,000 120,000
Qx – onshore drift 𝑚3
𝑚 ⋅ 𝑦𝑟 Triangular 0 1 4
Notes: (1) Dependent on SLR; values presented assume S = 1.1 m in 2100
The assignment of pdfs to each of the input variable is essentially an heuristic process based on site specific knowledge and expert judgement. For the purpose of this exploratory study and in
WRL Research Report 253 FINAL REPORT May 2013 42
the absence of additional information, simplified triangular pdfs were assigned to each input variables through the definition of:
• More frequent expected value (mode); and • Lower and upper bounds (minimum and maximum).
Numerous alternative probability distributions are available, however, these are beyond the scope of this study. Such alternatives could easily be incorporated into the framework presented in this study. Table 11 summarises the input parameters for the two study cases and Figure 4.2.1 shows plots of input parameter pdfs for Avoca and Cabarita Beach. While the results presented were derived from 10,000,000 simulations, convergence tests showed that by 100,000 simulations, differences between stochastic outputs were negligible. In both cases, computing time was of the order of few minutes. Plots of convergence tests are shown in Appendix C.
4.3 Avoca Beach Results
For the purpose of this analysis, the Avoca embayment was subdivided into two representative sections north and south of the lagoon entrance. Using Marine LiDAR bathymetric data, two beach and shoreface profiles were selected as representative of North and South Avoca. Profile locations are shown in Figure 2.4 and profile plots are presented in Figure 4.3. The south section of Avoca is characterised by lower foredunes (approximately 4 m AHD) and flatter gradient (slope) compared with the north profile (approximately 6 m AHD). Estimates of projected recession by 2100 derived from 10,000,000 stochastic simulations are presented in Figure 4.4 for North Avoca and Figure 4.5 for South Avoca. Both simulated probability distribution and corresponding cumulative probability functions of recession are presented. A comparison of recession estimates in terms of cumulative probability distribution at North and South Avoca are presented in Figure 4.6. In order to evaluate the sensitivity of the shoreline behaviour to the various input variables, simulations were run by, in turn, zeroing the contribution of each variable and re-calculating distributions for the simulated recession. As an example, contributions of each input variable to total recession are presented for Avoca South through plots of probability distributions (Figure 4.7*) and mean recession plus or minus one standard deviation. Median, 10th and 90th percentile of simulated recession estimates are plotted against sea level rise values in Figure 4.8 for Avoca North and South. Tabulated values of probabilistic estimates of recession at Avoca Beach are summarised in Table 12.
Table 12: Summary of 2100 Probabilistic Recession Estimates for Avoca Beach
Total Recession Mean Median Min Max std 90%ile 10%ile Skewness Kurtosis
Avoca North
R [m] 26.1 25.5 1.9 56.6 8.1 37.1 15.8 0.27 2.69
R [m3/m/yr] 8.8 8.3 0.5 26.7 3.4 13.4 4.9 0.79 3.60
Avoca South
R [m] 30.4 29.9 1.9 61.4 9.4 43.3 18.4 0.17 2.53
R [m3/m/yr] 9.2 8.8 0.6 26.6 3.4 13.8 5.2 0.65 3.32
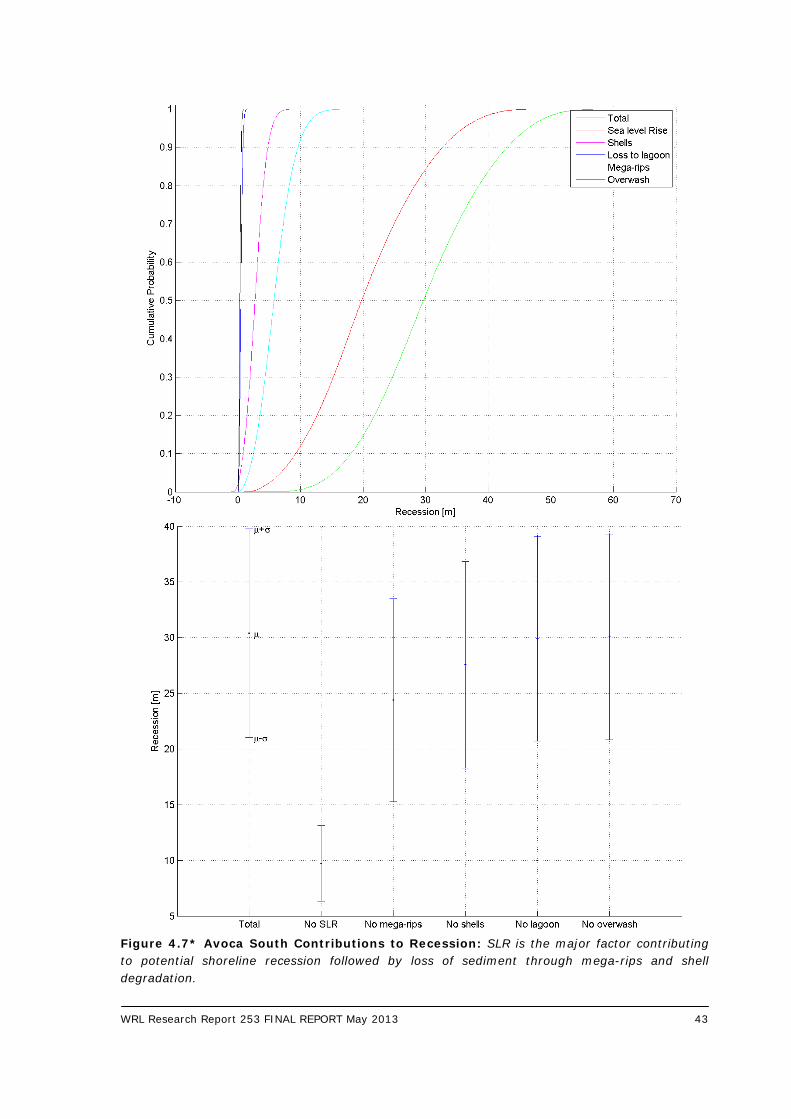
WRL Research Report 253 FINAL REPORT May 2013 43
Figure 4.7* Avoca South Contributions to Recession: SLR is the major factor contributing to potential shoreline recession followed by loss of sediment through mega-rips and shell degradation.
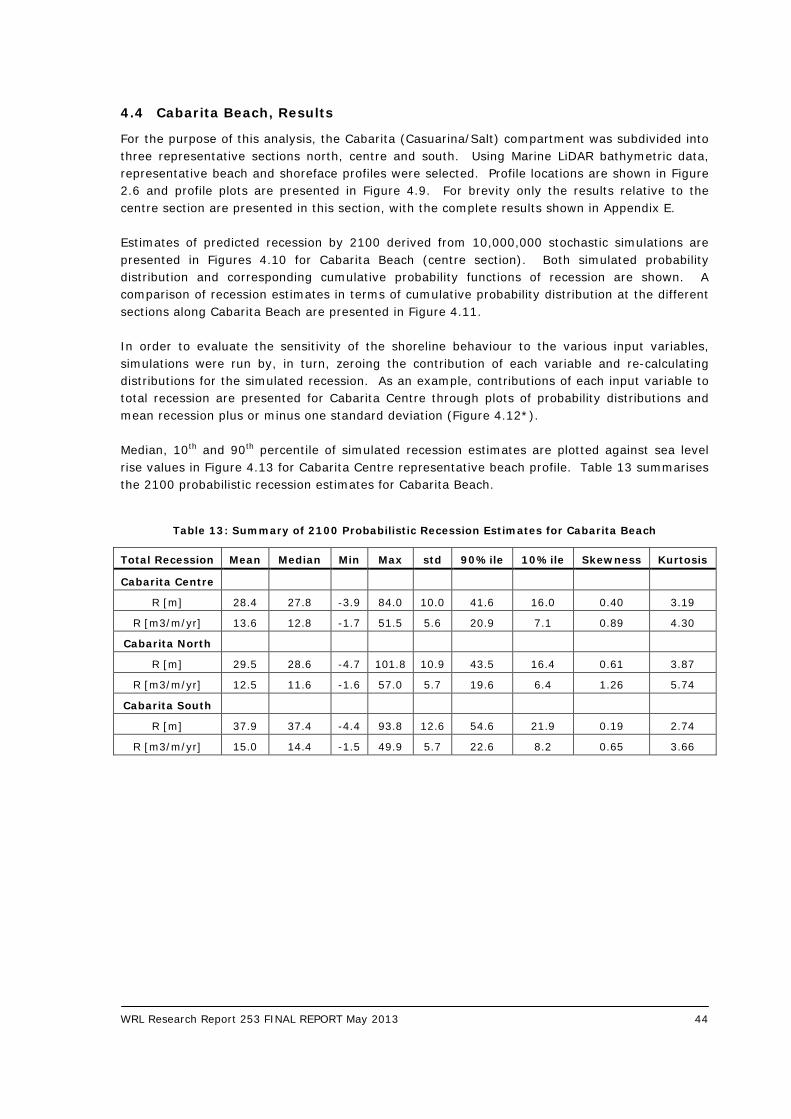
WRL Research Report 253 FINAL REPORT May 2013 44
4.4 Cabarita Beach, Results
For the purpose of this analysis, the Cabarita (Casuarina/Salt) compartment was subdivided into three representative sections north, centre and south. Using Marine LiDAR bathymetric data, representative beach and shoreface profiles were selected. Profile locations are shown in Figure 2.6 and profile plots are presented in Figure 4.9. For brevity only the results relative to the centre section are presented in this section, with the complete results shown in Appendix E. Estimates of predicted recession by 2100 derived from 10,000,000 stochastic simulations are presented in Figures 4.10 for Cabarita Beach (centre section). Both simulated probability distribution and corresponding cumulative probability functions of recession are shown. A comparison of recession estimates in terms of cumulative probability distribution at the different sections along Cabarita Beach are presented in Figure 4.11. In order to evaluate the sensitivity of the shoreline behaviour to the various input variables, simulations were run by, in turn, zeroing the contribution of each variable and re-calculating distributions for the simulated recession. As an example, contributions of each input variable to total recession are presented for Cabarita Centre through plots of probability distributions and mean recession plus or minus one standard deviation (Figure 4.12*). Median, 10th and 90th percentile of simulated recession estimates are plotted against sea level rise values in Figure 4.13 for Cabarita Centre representative beach profile. Table 13 summarises the 2100 probabilistic recession estimates for Cabarita Beach.
Table 13: Summary of 2100 Probabilistic Recession Estimates for Cabarita Beach
Total Recession Mean Median Min Max std 90%ile 10%ile Skewness Kurtosis
Cabarita Centre
R [m] 28.4 27.8 -3.9 84.0 10.0 41.6 16.0 0.40 3.19
R [m3/m/yr] 13.6 12.8 -1.7 51.5 5.6 20.9 7.1 0.89 4.30
Cabarita North
R [m] 29.5 28.6 -4.7 101.8 10.9 43.5 16.4 0.61 3.87
R [m3/m/yr] 12.5 11.6 -1.6 57.0 5.7 19.6 6.4 1.26 5.74
Cabarita South
R [m] 37.9 37.4 -4.4 93.8 12.6 54.6 21.9 0.19 2.74
R [m3/m/yr] 15.0 14.4 -1.5 49.9 5.7 22.6 8.2 0.65 3.66
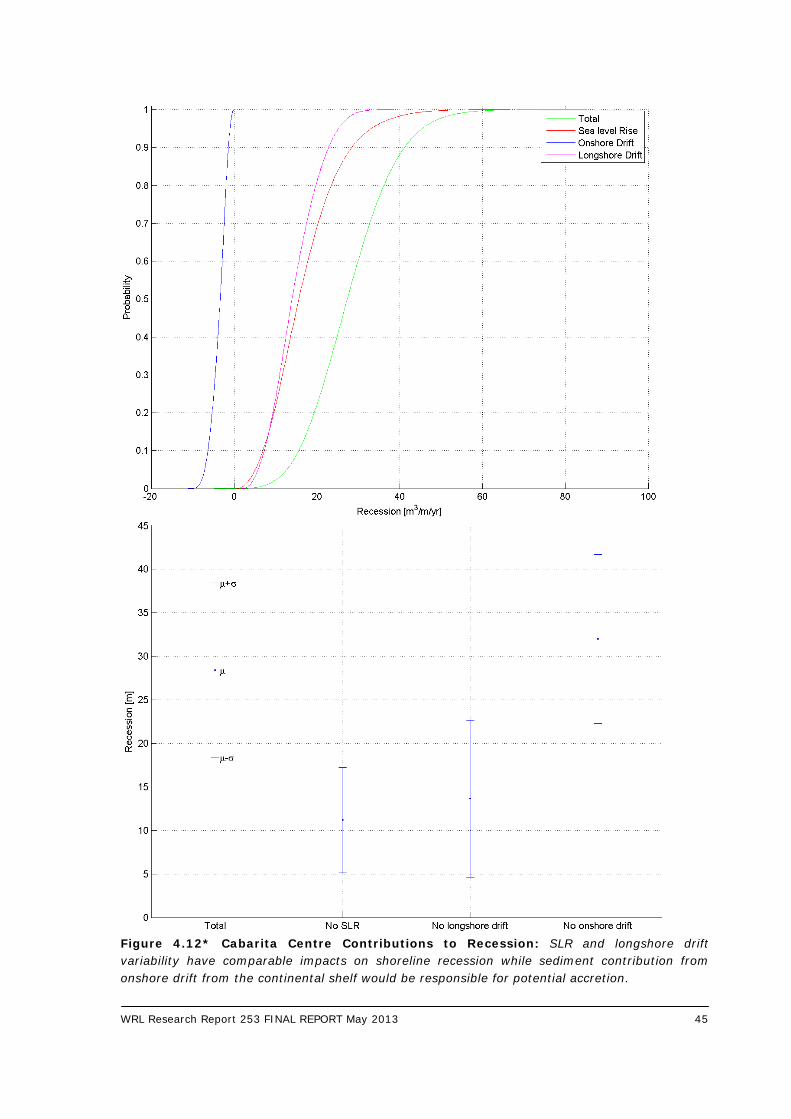
WRL Research Report 253 FINAL REPORT May 2013 45
Figure 4.12* Cabarita Centre Contributions to Recession: SLR and longshore drift variability have comparable impacts on shoreline recession while sediment contribution from onshore drift from the continental shelf would be responsible for potential accretion.
WRL Research Report 253 FINAL REPORT May 2013 46
4.5 Discussion of Probabilistic Results
Based on the probabilistic results, the southern section of Avoca Beach will be more vulnerable to long-term recession (taking into account SLR) with the mean predicted recession for 2100 of 30 m (9.2 m3/m/yr) compared to 26 m (8.8 m3/m/yr) in the northern section. The 90th percentile recession estimates were 43 and 37 m (13.4 and 13.8 m3/m/yr), respectively for South and North Avoca. At Cabarita, recession estimates for 2100 are similar for the central and northern sections of the compartment with average recession estimates of approximately 28 m (13 m3/m/yr) and 90th percentile of approximately 42 m (20 m3/m/yr). However, higher recession rates were estimated in the southern section of Cabarita Beach with estimates ranging from an average of 38 m (15 m3/m/yr) in 2100 to 55 m (22.6 m3/m/yr) for the 90th percentile. Based on the probabilistic results, the main driving factor of recession in both the Avoca and Cabarita compartments by 2100 (assuming stationary wave climate conditions) is sea level rise. In Avoca, the loss of sediment to the compartment through mega-rips and through shell degradation have similar contributions to future shoreline recession. In particular the inclusion of loss via mega-rips and shell degradation increased mean recession estimates by approximately 29% and 11% respectively, while sediment loss to the lagoon and through dune overwash were found to have minimal impact (less than 3% increase) on projected shoreline recession (Figure 4.7*). At Cabarita, the contribution to long-term recession by littoral drift differentials was found to be similar magnitude to the SLR contribution, while the inclusion of the sediment gain via onshore drift from the continental shelf caused a reduction in recession on average of approximately 18% (Figure 4.12*). Based on the probabilistic results, Cabarita Beach was found to be more vulnerable to long-term recession due to sediment imbalance and sea level rise. Moreover, recession estimates for 2100 were found to span over a wider range of possible values due to the high variability in net littoral drift differential (10,000 to 120,000 m3/yr). Figure 4.14 shows plots of projected recession against sea level rise scenarios (ranging from 0.1 to 1.1 m in 2100) for both Avoca and Cabarita. While the lower bound (10th percentile) of the envelope of predictions coincides at the two sites, the median (50th percentile) and higher bound (90th percentile) at Cabarita exceeds by approximately 50% the ones at Avoca for all SLR scenarios. Future changes in wave climate (Appendix D) could result in changes in the net differential littoral drift, however, it is expected that these changes would be within the range (10,000 to 120,000 m3/yr) considered in the probabilistic approach.
4.6 Comparison of Probabilistic and Deterministic
In order to qualitatively evaluate relative merits of deterministic versus probabilistic approach, the probabilistic estimates of recession obtained from the Monte Carlo simulations were compared to the deterministic estimates from Section 3 and previous assessments at the two contrasting study sites. Detailed deterministic analysis of long-term recession due to ongoing recession and SLR at the two study sites is presented in Appendix A. Table 14 shows values of ongoing recession and Bruun factors adopted in this study to calculate deterministic estimates of 2100 recession. For
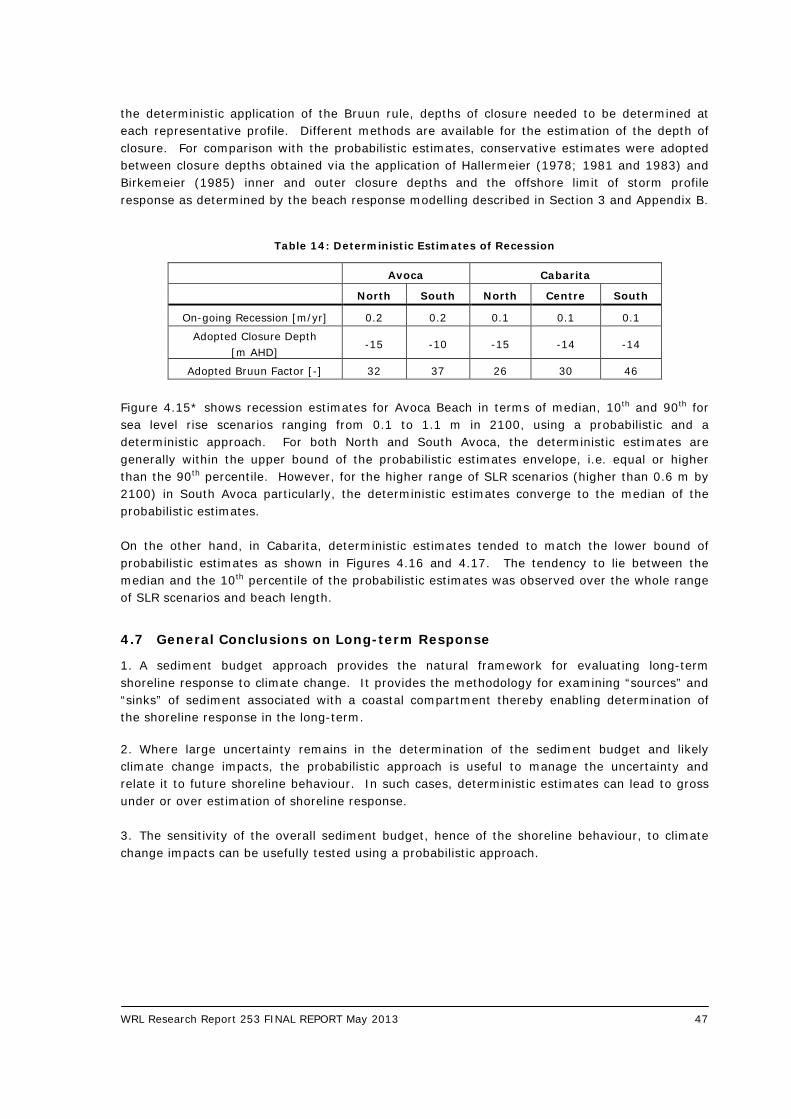
WRL Research Report 253 FINAL REPORT May 2013 47
the deterministic application of the Bruun rule, depths of closure needed to be determined at each representative profile. Different methods are available for the estimation of the depth of closure. For comparison with the probabilistic estimates, conservative estimates were adopted between closure depths obtained via the application of Hallermeier (1978; 1981 and 1983) and Birkemeier (1985) inner and outer closure depths and the offshore limit of storm profile response as determined by the beach response modelling described in Section 3 and Appendix B.
Table 14: Deterministic Estimates of Recession
Avoca Cabarita
North South North Centre South
On-going Recession [m/yr] 0.2 0.2 0.1 0.1 0.1
Adopted Closure Depth [m AHD]
-15 -10 -15 -14 -14
Adopted Bruun Factor [-] 32 37 26 30 46
Figure 4.15* shows recession estimates for Avoca Beach in terms of median, 10th and 90th for sea level rise scenarios ranging from 0.1 to 1.1 m in 2100, using a probabilistic and a deterministic approach. For both North and South Avoca, the deterministic estimates are generally within the upper bound of the probabilistic estimates envelope, i.e. equal or higher than the 90th percentile. However, for the higher range of SLR scenarios (higher than 0.6 m by 2100) in South Avoca particularly, the deterministic estimates converge to the median of the probabilistic estimates. On the other hand, in Cabarita, deterministic estimates tended to match the lower bound of probabilistic estimates as shown in Figures 4.16 and 4.17. The tendency to lie between the median and the 10th percentile of the probabilistic estimates was observed over the whole range of SLR scenarios and beach length.
4.7 General Conclusions on Long-term Response
1. A sediment budget approach provides the natural framework for evaluating long-term shoreline response to climate change. It provides the methodology for examining “sources” and “sinks” of sediment associated with a coastal compartment thereby enabling determination of the shoreline response in the long-term. 2. Where large uncertainty remains in the determination of the sediment budget and likely climate change impacts, the probabilistic approach is useful to manage the uncertainty and relate it to future shoreline behaviour. In such cases, deterministic estimates can lead to gross under or over estimation of shoreline response. 3. The sensitivity of the overall sediment budget, hence of the shoreline behaviour, to climate change impacts can be usefully tested using a probabilistic approach.
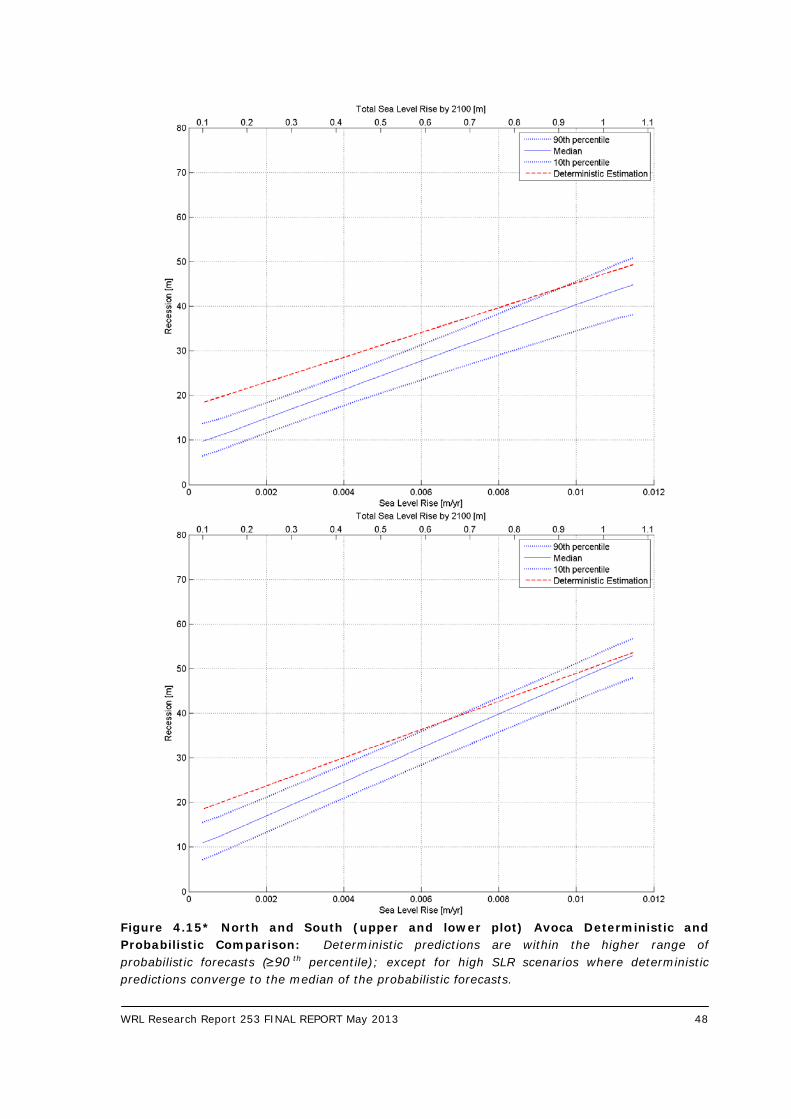
WRL Research Report 253 FINAL REPORT May 2013 48
Figure 4.15* North and South (upper and lower plot) Avoca Deterministic and Probabilistic Comparison: Deterministic predictions are within the higher range of probabilistic forecasts (≥90 th percentile); except for high SLR scenarios where deterministic predictions converge to the median of the probabilistic forecasts.
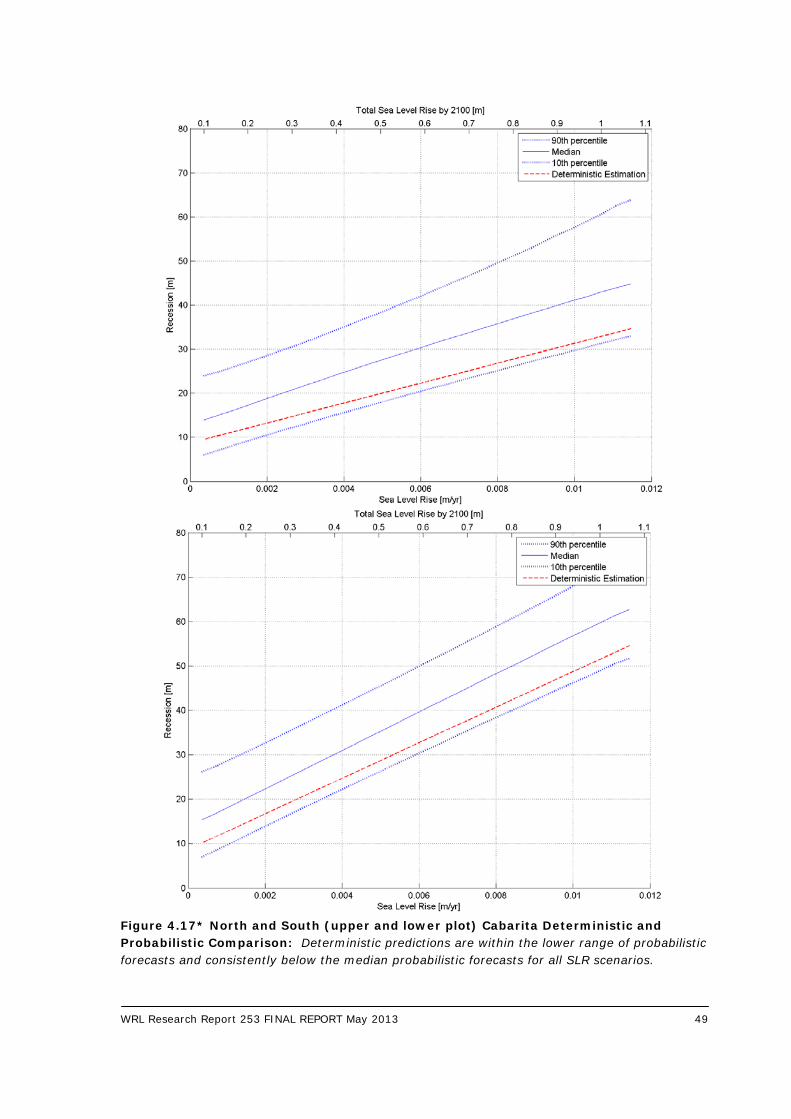
WRL Research Report 253 FINAL REPORT May 2013 49
Figure 4.17* North and South (upper and lower plot) Cabarita Deterministic and Probabilistic Comparison: Deterministic predictions are within the lower range of probabilistic forecasts and consistently below the median probabilistic forecasts for all SLR scenarios.
WRL Research Report 253 FINAL REPORT May 2013 50
5. Conclusions
The assessment of coastal response was undertaken at two study sites along the NSW coast. Avoca Beach on the NSW Central Coast and Cabarita-Casuarina-Salt Beach on the northern NSW Coast were selected as representative in terms of differing regional geological setting and sediment processes. The assessment was undertaken considering short-term and long-term processes, deterministic and probabilistic approaches. Short-term processes included beach erosion in response to one or a sequence of storm events over the timeframe of days or weeks. Long-term processes included shoreline recession in response to sediment imbalance and changes in mean sea level, which are both potential impacts of climate change. Analysis of coastal response to long-term processes was undertaken for the 2100 timeframe. For the assessment of (short-term) erosion due to storm events, the applicability of fully probabilistic, semi-probabilistic and deterministic methods was investigated. The applicability of fully probabilistic methods such as JPM-PCR (Callaghan et al., 2008; Ranasinghe et al., 2011) was limited by data availability at the two representative study sites. The use of Synthetic Design Storms derived from long-term wave buoy records to drive refined process based erosion models (Carley and Cox, 2003; Shand et al., 2011; Mariani et al., 2012) offered a reliable alternative to estimate storm erosion for different probabilistic scenarios at “data poor” locations. Results at the two study cases show that the sequencing (clustering) of two or more storms is necessary to produce realistic estimates of storm demand that match historical measurements. The accuracy of the surfzone and nearshore bathymetry was found to be an important factor in the modelling of short-term erosion processes, with high quality and frequent nearshore survey data necessary for the erosion modelling to be representative of different morphodynamic beach states. For the assessment of long-term processes, a probabilistic approach based on Monte Carlo stochastic simulations, and coastal compartment sediment budget coupled to simple two-dimensional geometric transformation, was applied to the two study sites. Deterministic estimates of 2100 shoreline recession were compared with probabilistic projections in the perspective of the two coastal sediment cell cases investigated. In a relatively closed compartment such as Avoca, deterministic estimates were found to provide conservative estimates of recession matching the upper bound of probabilistic predictions. However, in the Cabarita compartment, deterministic estimates under-estimated the median of probabilistic predictions. At this location, the probabilistic approach allowed investigation of the sensitivity of the shoreline behaviour due to the large variability (one order of magnitude) in littoral drift differential. The probabilistic approach was found to provide a powerful tool for the analysis of the sensitivity of shoreline behaviour to future variability in sediment budget components. The probabilistic approach also indirectly accounted for future changes in wave climate as these are likely to result in sediment budget changes. Within those coastal compartments where large uncertainty remains in the quantification of the sediment budget, a probabilistic approach is useful to manage the uncertainty and relate it to future shoreline behaviour. The following points are provided for consideration for future coastal erosion/recession and risk assessments:
WRL Research Report 253 FINAL REPORT May 2013 51
1. The continuous improvement of beach monitoring data quality and frequency is a key factor in the improvement of reliability and feasibility of both deterministic and probabilistic approaches:
• Long-term, high quality and frequent beach and surfzone bathymetric surveys, possibly in concomitance with storm events, will allow validation of erosion (and accretion) models and shoreline recession estimates; and
• Beach and surfzone surveys will increase the feasibility of approaches based on stochastic methods by increasing the sampling population for the derivation of probabilistic forecasts;
2. The use of synthetic design storms (SDS) derived from the analysis of long-term wave buoy data is a practical and reliable method to estimate coastal response to extreme storm events at data poor locations:
• Upgrading and maintenance of the current wave buoy and tide gauge networks will allow improved reliability of storm characteristics predictions;
• The inclusion of the effects of wave direction (when information is available) is recommended; and
• The analysis of joint occurrence of extreme wave heights and water levels is recommended when information/data exists.
3. Storm sequencing and two-dimensional (2D) effects need to be considered in the analysis of coastal response to extreme storm events:
• The use of storm sequences to drive erosion models is recommended together with the comparison with historical (if available) measurements of storm erosion; and
• Two-dimensional effects (such as rip currents) have the potential to significantly increase localised erosion. Erosion estimates from one-dimensional models are therefore prone to underestimation at those locations where 2D effects are relevant. Allowances for 2D effects need to be included in the erosion estimates.
4. A sediment budget approach based on a probabilistic approach provides a powerful framework for the evaluation of long-term shoreline response to climate changes, including sea level rise and wave climate changes:
• It provides the methodology for examining “sources” and “sinks” of sediment within a coastal compartment thereby enabling determination as to whether there is a net gain (accretion) or a net loss (recession); and
• Changes in both mean sea level and wave energy flux will alter the sediment processes within the coastal compartment. If large uncertainty remains in the definition of the sediment budget components, a probabilistic approach provides a useful tool to evaluate the sensitivity of the overall budget, hence the shoreline reaction, to changes in budget components.
WRL Research Report 253 FINAL REPORT May 2013 52
6. References and Bibliography
Birkemeier, W.A., (1985) "Field Data on Seaward Limit of Profile Change" J. Waterway, Port, Coastal and Ocean Division, v. III, n. 3, ASCE,p. 598-602 Booij, N., Ris, R.C. and Holthuijsen, L.H. (1999a) “A Third-generation Wave Model for Coastal Regions, Part II, Verification”, Journal of Geophysical Research C4, 104, 7667-7681 Booij, N., Ris, R.C. and Holthuijsen, L.H. (1999b) “A Third-generation Wave Model for Coastal Regions, Part I, Model Description and Validation”, Journal of Geophysical Research C4, 104, 7649-7666 Bruun, P. (1962) “Sea-level Rise as a Cause of Shore Erosion” Journal of Waterways and Harbours Division, 88:117-130 Bruun, P. (1988) “The Bruun Rule of Erosion by Sea Level Rise: A Discussion on Large-scale Two- and Three-dimensional Usages” Journal of Coastal Research, 4, 627–648 Bruun, P. and Schwartz, M. (1985) “Analytical Predictions of Beach Profile Change in Response to a Sea-level Rise”, Z. Germorph., Suppl-Bd 57 pp33-50 Callaghan J. and Helman P. (2008) “Severe Storms on the East Coast of Australia 1770–2008” Griffith Centre for Coastal Management, Griffith University Callaghan, D.P., Nielsen, P., Short, A.D. and Ranasinghe, R. (2008) “Statistical Simulation of Wave Climate and Extreme Beach Erosion” Coastal Engineering, 55(5), 375-390 Callaghan, D.P., Ranasinghe, R. and Short, A. (2009) “Quantifying the Storm Erosion Hazard for Coastal Planning”. Coastal Engineering 56 1: 90-93 Carley, J.T., Couriel, E.D. and Cox, R.J. (1998) “Numerical Modelling Sand Nourishment Profiles/Quantities and Beach Erosion due to Storms and Sea Level Rise”, WRL Technical Report 1998/04. Water Research Laboratory, University of NSW, Sydney Carley, J.T. and Cox, R.J. (2003) “A Methodology for Utilising Time-Dependent Beach Erosion Models for Design Events”, Proceedings of 16th Australasian Coasts and Ports Conference, Auckland, New Zealand Carley, J.T. and Mole, M.A. (2010) “Update of Tweed Shire Coastal Hazard Lines” WRL Technical Report 2010/11, Water Research Laboratory, University of NSW, Sydney Carter, R.M. (2010) “Climate: the Counter Consensus”. Stacey international, ISBN: 978-1-906768-29-4, 315pp Chapman, D., Geary, M., Roy, P.S. and Thom, B.G. (1982) “Coastal Evolution and Coastal Erosion in New South Wales”, Coastal Council of NSW, Sydney Chief Scientist and Engineer (2012) “Assessment of the Science Behind the NSW Government's Sea Level Rise Planning Benchmarks”, NSW Government Cardno Lawson Treloar (2010) “Gosford Coastal Lagoons Processes Study”, Volume 1 July 2010
WRL Research Report 253 FINAL REPORT May 2013 53
Coghlan I.R., Carley J.T., Shand T.D., Blacka M.J., Cox R.J., Davey E.K. and Blumberg G.P. (in prep.), “Kingscliff Beach Foreshore Protection Works Part A - Alternative Terminal Seawall Designs and Beach Nourishment and Beach Nourishment”, WRL Technical Report 2011/25. Water Research Laboratory, University of NSW, Sydney Cooper, J.A.G. and Pilkey, O.H. (2004) “Sea-level Rise and Shoreline Retreat: Time to Abandon the Bruun Rule” Global and Planetary Change Vol. 43 Issue 3 p157-171 Dean, R.G. and Dalrymple, R.A. (2002) “Coastal Processes with Engineering Applications” Cambridge University Press Drummond, C.D. (2011) “The Implications of Climate Change for the Beaches of the Central Coast”, B. Eng thesis, University of NSW, Sydney Cowell, P.J., Roy, P.S. and Jones, R.A. (1992) “Shoreface Translation Model: Computer Simulation of Coastal Sand Body Response to Sea Level Rise” Mathematics and Computers in Simulation 33 (1992) 603-608 Cowell, P.J., Roy, P.S., and Jones, R.A. (1995) “Simulation of Large Scale Coastal Change Using a Morphological Behaviour Model” Marine Geology, 126, 45–61 Cowell, P.J., Thom, B.G., Jones, R.A., Everts, C.H. and Simanovic, D. (2006) "Management of Uncertainty in Predicting Climate-Change Impacts on Beaches" Journal of Coastal Research 221: 232-245 Dallas M. and Tuck D., (2008) “Aboriginal and European Cultural Heritage Assessment Casuarina Town Centre Kingscliff South, NSW”, Mary Dallas Consulting Archaeologists, Report to Kings Beach No. 2 Pty Ltd DEFRA UK (2006) “Coastal Defence Appraisal Guidance FCDPAG3 Economic Appraisal Supplementary Note to Operating Authorities – Climate Change Impacts October 2006” UK Department for Environment, Food and Rural Affairs Delft Hydraulics Laboratory, (1970) “Gold Coast Queensland Australia – Coastal Erosion and Related Problems” Report 257. Prepared for the Queensland Government. 1970 Delft Hydraulics, (1992) “Gold Coast Queensland Australia - Southern Gold Coast Littoral Sand Supply”, Final Report Volume II Full Report. Prepared for the Queensland Government. October 1992 DCC (2009) “Climate Change Risks to Australia’s Coast, A First Pass National Assessment” Australian Government Department of Climate Change, ISBN: 978-1-921298-71-4 Department of Environment, Climate Change and Water (2009) “Sea Level Rise Policy”, NSW Government Department of Environment, Climate Change and Water (2010) “Coastal Risk Management Guide: Incorporating Sea Level Rise Benchmarks in Coastal Risk Assessments”, NSW Government
WRL Research Report 253 FINAL REPORT May 2013 54
Duke, A., (2012) “Cabarita Beach/Bogangar Community Project Plans Report”, Report for the Cabarita Beach Bogangar Community Economic Development Committee Evans, P., Hanslow, D., Coutts-Smith, A. and You, Z.J. (2000) “Nearshore-Inner Shelf Sediment Exchange on the NSW Central Coast”. 27 th Int. Conf. on Coastal Eng., ASCE, 3151–3164 Engineers Australia (2012) “Guidelines for Responding to the Effects of Climate Change in Coastal and Ocean Engineering”, Engineers Australia National Committee on Coastal and Ocean Engineering, 3rd ed., ISBN: 9780858259195. Engineers Australia (2012a) “Climate Change Adaptation Guidelines in Coastal Management and Planning”, Engineers Australia National Committee on Coastal and Ocean Engineering, ISBN: 9780858259515. Garber, S., Treloar, D. and Beadle, C., (2010) “Wollongong LGA Coastal Hazards Study, Some Unique Aspects”, The 19th NSW Coastal Conference, Batemans Bay, NSW, Australia Goda Y. (2000), “Random Seas and design of Maritime Structures.” World Scientific Gordon, A.D., Lord, D.B. and Nolan, M.W. (1978) “Byron Bay – Hastings Point Erosion Study” NSW Department of Public Works, Coastal Engineering Branch, Report No 78026, November 1978 Gordon, A.D. (1987) “Beach Fluctuations and Shoreline Change: NSW”, 8th Australasian Conference on Coastal and Ocean Engineering, pp 104-108 Gordon, A.D., (1990a) “Coastal Lagoon Entrance Dynamics” Proceedings 22nd International Conference on Coastal Engineering, American Society of Civil Engineers, Delft, The Netherlands 1990: 2880-2893 Gordon. A.D., (1990b) “Beach Fluctuations and Shoreline Change - N.S.W.”, Australian Civil Engineering Transactions, Institution of Engineers, Australian Vol., CE32No. 1. 1990: 7-13 Gordon, A.D. (1992) “The Restoration of Bate Bay, Australia – Plugging the Sink” Proceedings 23rd International Conference on Coastal Engineering, American Society of Civil Engineers, Venice, Italy, October 1992, 3319-3330 Gordon, A.D. (2009) “The Potential for Offshore Sand Sources to Offset Climate Change Impacts on Sydney’s Beaches” Proceedings 19th Australasian Conference on Coastal and Ocean Engineering as included in Coast and Ports 2009, Engineers Australia in conjunction with the New Zealand Coastal Society, Wellington September 2009 Gordon, A.D. (2011) “Anchoring Coastlines – Natural and Artificial Headlands” Proceedings Coasts and Ports Conference 2011. Engineers Australia Guinotte, J.M. and Fabry, V.J. (2008) “Ocean Acidification and its Potential Effects on Marine Ecosystems” Ann. NY Academy of Science 1134:320-342 Hallermeier, R.J. (1978) “Uses for a Calculated Limit Depth to Beach Erosion” Proc. Coastal Eng. Conf. 16th, Hamburg, Germany, pp 1493 – 1512.Eng. Conf., 16th, Hamburg, Germany, pp. 1493--1512
WRL Research Report 253 FINAL REPORT May 2013 55
Hallermeier, R.J. (1981) “A Profile Zonation for Seasonal Sand Beaches from Wave Climate” Coastal Engineering 4, 253-277 Hallermeier R.J. (1983) “Sand Transport Limits in Coastal Structure Designs”. Proceedings of a Specialty Conference on Design, Construction, Maintenance and Performance of Coastal Structures. ASCE, Arlington, pp 703–716 Harley M.D., Turner I.L., Short A.D. and Ranasinghe, R. (2009) “Interannual Variability and Controls of the Sydney Wave Climate”, International Journal of Climatology, Royal Meteorological Society Helman, P. (2007) “Two Hundred years of Coastline Change and Future Change, Fraser Island to Coffs Harbour, East Coast Australia”, PhD Thesis, Southern Cross University Hemer, M.A., McInnes, K.L. and Ranasinghe, R. (2012) “Projections of Climate Change-driven Variations in the Offshore Wave Climate off South Eastern Australia”, International Journal of Climatology 2012 Higgs, K.B. and Nittim, R. (1988) “Coastal Storms in N.S.W. in August and November 1986 and their Effect on the Coast”. WRL Technical Report 1988/06, Prepared for Public Works Department. Water Research Laboratory, University of NSW, Sydney Hoffman, J.G, Evans, H.G. and Messner, J.P. (1979) “Bogangar-Kingscliff Coastal Engineering Advice”, Department of Public Works, Coastal Engineering Branch, Sydney Huxley, C. (2009) “Shoreline Response Modelling – Assessing the Impacts of Climate Change” Proceedings of the 18th NSW Coastal Conference, Ballina, 3–6 November Institute of Engineers Australia (2004) National Committee on Coastal and Ocean Engineering. “Guidelines for Responding to the Effects of Climate Change in Coastal and Ocean Engineering 2004 Update.” ACT: The Institution of Engineers Australia IPCC (2001) Technical Summary of the Working Group I Report and Summary for Policymakers, The United Nations Intergovernmental Panel on Climate Change, Cambridge University Press, UK IPCC (2007a) Summary for Policymakers. In: Climate Change 2007: The Physical Science Basis. Contribution of Working Group I to the Fourth Assessment Report of the Intergovernmental Panel on Climate Change [Solomon, S., D. Qin, M. Manning, Z. Chen, M. Marquis, K.B. Averyt, M. Tignor and H.L. Miller (eds.)]. Cambridge University Press, Cambridge, United Kingdom and New York, NY, USA IPCC (2007b), Climate Change 2007 - The Physical Science Basis. Contribution of Working Group I to the Fourth Assessment Report of the Intergovernmental Panel on Climate Change, (ISBN 978 0521 88009-1 Hardback; 978 0521 70596-7 Paperback), [Solomon, S, D Qin, M Manning, Z Chen, M Marquis, K B Averyt, M Tignor and H L Miller (eds.)]. Cambridge University Press, Cambridge, United Kingdom and New York, NY, USA, 996 pp James Cook University of North Queensland (1977), “Numerical Simulation of Tropical Cyclone Surge Along the Queensland Coast”, Part X, Gold Coast. Report Prepared for Beach Protection Authority of Queensland, November
WRL Research Report 253 FINAL REPORT May 2013 56
Komar, P.D., McDougal, W.G., Marra, J.J. and Ruggiero, P. (1997) “The Rational Analysis of Setback Distances: Application to the Oregon Coast” Shore and Beach Vol. 67 (1) 41-49 Knutson, T.R., McBride, J.L., Chan, J., Emanuel, K., Holland, G., Landsea, C., Held, I., Kossin, J.P., Srivastava, A.K. and Sugi, M. (2010), “Tropical Cyclones and Climate Change”, Nature Geoscience 21 February 2010 Kraus, N., Larson, M., Rosati, J. and Wise, R. (1993), “SBEACH: Numerical Model for Simulating Storm-Induced Beach Change”, User's Manual. US Army Corps of Engineers Kriebel, D.L. and Dean, R.G. (1993) “Convolution Method for Time-dependent Beach-profile Response”, Journal of Waterway, Port, Coastal and Ocean Engineering, Vol 119 (2), pp 204-226 Laxton, J.H. and Laxton, E.S. (2009), The Effects of Climate Change on Beaches in Pittwater, Warringah and Manly Local Government Areas. Private Research Project by J.H. & E.S. Laxton - Environmental Consultants P/L, June 2009 Larson M., Erikson, L. and Hanson, H. (2004) “An Analytical Model to Predict Dune Erosion due to Wave Impact” Coast Engineering 51(8–9):675–696 Larson M. and Kraus N.C. (1989) “SBEACH: Numerical Model for Simulating Storm-Induced Beach Change, Report 1: Theory and Model Foundation”, Technical Report CERC-89-9, US Army Engineer Waterways Experiment Station, Coastal Engineering Research Center, Vicksburg USA Lord D.B. and Kulmar M.A. (2000) “The 1974 Storms Revisited: 25 years. Experience in Ocean Wave Measurement Along the South-East Australian Coast”, Proceedings International Conference of Coastal Engineering, pp 559-572, ASCE Manly Hydraulics Laboratory (2010) NSW Ocean Water Levels, Draft MHL Report 1881, December Mariani A., Shand T.D., Carley J.T., Goodwin I.D., Splinter K., Davey E.K., Flocard F .and Turner I.L. (2012) “Generic Design Coastal Erosion Volumes and Setbacks for Australia”, WRL Research Report 247, Antarctic Climate and Ecosystems Cooperative Research Centre, Hobart, Tasmania Marshall, J.F. and Thom, B.G. (1976) “The Sea level in the Last Interglacial”, Nature 263, 120–121 McInnes, K, Abbs, D, O’Farrell, S, Macadam, I, O’Grady, J and Ranasinghe, R (2007). Projected Changes in Climatological Forcing for Coastal Erosion in NSW, a project undertaken for the Department of Environment and Climate Change NSW, CSIRO Marine and Atmospheric Research, Victoria McLean, R. and Shen, J-S. (2006), “From Foreshore to Foredune: Foredune Development Over the Last 30 Years at Moruya Beach, New South Wales, Australia”, Journal of Coastal Research, Volume 22, Number 1, pp 28-36 MSQ (2011), Semidiurnal Tidal Planes. Queensland Tide Tables 2012, Marine Safety Queensland, September 2011
WRL Research Report 253 FINAL REPORT May 2013 57
Nielsen, A.F. (1987) “Coastal Features of Gosford City Foreshores”, Gosford Geographical Society February 1987 Nielsen, A.F. and Adamantidis, C.A. (2007) Defining the Storm Erosion Hazard for Beaches, Australian Journal of Civil Engineering, Volume 3, Number 1, pp. 39-50 Patterson Britton & Partners (1999) “Broken Bay Beaches Coastal Management Plan” Issue No 3 August 1999 Patterson Britton & Partners (2006) “Scoping Study on Byron Bay Sand Extraction” Final Report March 2006 Public Works Department, NSW (1978) “Byron Bay- Hastings Point Erosion Study”, Public Works Department- Coastal Engineering Branch, Report No PWD 78026 Public Works Department, NSW (1982) “Bogangar Beach Coastal Engineering Advice”, Public Works Department- Coast and Flood Division, Report No PWD 81022 Public Works Department, NSW (1985) “Gosford City Council Beach Management Strategies” Public Works Department May 1985 Public Works Department, NSW (1985) “Wamberal Beach and Avoca Beach Coastal Engineering Advice” Public Works Department- Civil Engineering Division, Report No PWD 85040 Public Works Department, NSW (1989) “Topographic Setting and Offshore Sediment Distribution Terrigal/Wamberal Beach”, Survey taken 1984-1989 Public Works Department, NSW (1994) “Gosford Coastal Process Investigation”, Public Works Department- Coast and Flood Division Pugh, D.T. and Vassie, J.M. (1979) “Extreme Sea Levels from Tide and Surge Probability”, pp.911-930 in Vol 1, Proceedings of the Sixteenth Coastal Engineering Conference, 1978, Hamburg, Germany. New York: American Society of Civil Engineers, 3060pp Ranasinghe, R., Watson, P., Lord, D., Hanslow, D. and Cowell, P. (2007) “Sea Level Rise, Coastal Recession and the Bruun Rule” Proceedings of Coasts and Ports ‘07, Melbourne, Vic, Australia. On CD Rom produced by Engineers Australia Ranasinghe, R., Callaghan, C. and Stive, M.J.F. (2011) “Estimating Coastal Recession due to Sea Level Rise: Beyond the Bruun Rule”, Climate Change June 2010 Ris, R.C., Holthuijsen L.H. and Booij N. (1994) “A Spectral Model for Waves in the Near Shore Zone”, 24th International Conference of Coastal Engineering, Kobe, October 1994, pp 68-78 Ryan, D.A., Heap, A.D., Radke, L. and Heggie, D.T. (2003) “Conceptual Models of Australia’s Estuaries and Coastal Waterways: Applications for Coastal Resource Management, Geoscience Australia, Record 2003/09, 136pp Roy, P.S. (1973) “Coastal Geology of the Cudgen Area – North Coast of NSW”, Geological Survey of NSW, Department of Mines Geological Survey Report No. GS 1973/286, September, 1973
WRL Research Report 253 FINAL REPORT May 2013 58
Roy, P.S. and Crawford, E.A. (1980) “Quaternary Geology of Newcastle Bight Inner Continental Shelf, New South Wales, Australia” New South Wales Geological Survey Records, 19. 145-88 Roy, P.S. and Thom, B.G. (1981) “Coastal Quaternary Deposits of New South Wales: A Model for Development in the Late Quaternary” Journal of Geol. Soc. Aust., 28, 471-489 SCOR Working Group 89 (1991) “The Response of Beaches to Sea-level Changes: A Review of Predictive Models” Journal of Coastal Research, 7(3), 895-921 Shand, T.D., Goodwin, I.D., Mole, M.A., Carley, J.T., Coghlan, I.R., Harley, M.D. and Peirson, W L. (2010) “NSW Coastal Inundation Hazard Study: Coastal Storms and Extreme Waves”, prepared by the Water Research Laboratory and Macquarie University for the Department of Environment, Climate Change and Water. WRL Technical Report 2010/16, University of NSW, Sydney Shand, T.D., Mole, M.A., Carley, J.T., Peirson, W.L. and Cox, R.J. (2011) “Coastal Storm Data Analysis: Provision of Extreme Wave Data for Adaptation Planning”, WRL Research Report 242, Water Research Laboratory, University of NSW, Sydney Short, A.D. (1985) “Rip-current Type, Spacing and Persistence, Narrabeen Beach, Australia.” Journal of Marine Geology, 65 1985 Short, A.D. and Turner, I.L. (2000) Beach Oscillation, Rotation and the Southern Oscillation, Narrabeen Beach, Australia, Proceedings Coastal Engineering 2000, ASCE, 2439-2452 Short, A.D. and Trembanis, A.C. (2004) "Decadal Scale Patterns in Beach Oscillation and Rotation Narrabeen Beach, Australia-Time Series, PCA and Wavelet Analysis" Journal of Coastal Research 20(2): 523-532 Stephens, A.W., Roy, P.S. and Jones, M.R. (1981) “Model of Erosion on a Littoral Drift Coast”, Proceedings of the Fifth Australian Conference on Coastal and Ocean Engineering, Perth. WA. pp. 171-6. Sydney: The Institute of Engineers. Australia Thom, B.G. (1965) “Late Quaternary Coastal Morphology of the Port Stephens-Myall Lakes Area, NSW”, J. Proc. R. Soc. NSW, 98, pp23-26, 1965 Thom, B.G. (1974) “Coastal Erosion in Eastern Australia”, Search, 5, pp198-209 Thom, B.G. (1978) “Coastal Sand Deposition in Southeast Australia during the Holocene”, Landform Evolution in Australasia, ed. J.L. Davies and M.A.G. Williams, pp. 197-214. Canberra: ANU Press Thom, B.G. and Hall, W. (1991) “Behaviour of Beach Profiles During Accretion and Erosion Dominated Periods”, Earth Surface Processes and Landforms, Volume 16, pp 113-127 Tweed Shire Council (2012d) Ordinary Council Meeting Thursday 25 October 2012, Council Minutes Watson P.J and D.B Lord (2008). “Fort Denison Sea Level Rise Vulnerability Study”, a report prepared by the Coastal Unit, NSW Department of Environment and Climate Change, October
WRL Research Report 253 FINAL REPORT May 2013 59
Watson, P.J., (2011) “Is There Evidence Yet of Acceleration in Mean Sea Level Rise Around Mainland Australia?”, Journal of Coastal Research, 27(2), 368–377. West Palm Beach (Florida), ISSN 0749-0208 WBM (1995) “Coastal Management Study and Coast Management Plan- Gosford City Open Coast Beaches”, WBM Oceanics Australia WBM (1988) “Coastal Engineering Advice: Ocean Paradise Estates Bogangar Beach Tweed Shire, NSW”, prepared for Lenen Developments Pty Ltd by Winders, Barlow and Morrison, QLD, Report Number 3869 WBM (2001) “Tweed Coastline Hazard Definition Study” – Final Report (Revision 3), R.B12876.002.03.doc, Brisbane, (Council has advised that the stated year of 2007 is a typographical error, with 2001 being the correct year of issue) Woodroffe, C.D., Cowell, P.J., Callaghan, D.P., Ranasinghe, R., Jongejan R., Wainwright, D.J., Barry, S.J., Rogers, K., Dougherty, A.J. (2012) “Approaches to Risk Assessment on Australian Coasts: A Model Framework for Assessing Risk and Adaptation to Climate Change on Australian Coasts”, National Climate Change Adaption Research Facility, Gold Coast pp.203 WorleyParsons (2009) “Ex-HMAS Adelaide Artificial Reef Coastal and Oceanographic Processes”, Report prepared for NSW Land and Property Management Authority, Newcastle NSW Wright, S. and Davidson, A. (2007) “Ocean Acidification: A Newly Recognised Threat”, 10 Australian Antarctic Magazine 27 (2007) You, Z.J. (2007) “Extrapolation of Extreme Wave Height with a Proper Probability Distribution Function”, Proceedings of the Australasian Coasts and Ports Conference, Melbourne, The Institute of Engineers Australia Young, I.R., Zieger, S. and Babanin, A.V. (2011) “Global Trends in Wind Speed and Wave Height”, Science, 332 (6028), 451-455
WRL Research Report 253 FINAL REPORT May 2013 60
7. Glossary of Terms and Abbreviations
Average Recurrence Interval (ARI): The average time between which a threshold is reached or exceeded (e.g. large wave height or high water level) of a given value. Also known as Return Period. Annual Exceedance Probability (AEP): The probability (expressed as a percentage) of an exceedance (e.g. large wave height or high water level) in a given year. Coastal Sediment Compartment: Structural features related to the geologic frameworks on the coast. The framework is responsible for the structural evolution of the planform of the coastline. Compartments are defined based on coastal aspect and land systems, as well as the large coastal geomorphology landforms. Cross-shore Transport: Refers to the sediment moved in a cross-shore direction to the coastline induced by water motions due to waves and undertow. Extreme Storm Event: Storm for which characteristics (wave height, period, water level etc.) were derived by statistical ‘extreme value’ analysis. Typically these are storms with ARIs ranging from 1 to 100 years. JPM-PCR: Joint Probability Method – Probabilistic Coastline Recession model. ICOLL: Intermittently closed or open lakes and lagoons. Longshore Transport = Littoral Drift: Refers to the sediment moved along a coastline under the action of wave-induced longshore currents (Dean and Dalrymple, 2002). The net drift is the sum of the positive (conventionally northwards direction in NSW) and negative (southwards in NSW) direction. The gross drift is the sum of the drift magnitudes (absolute values). The differential drift is the difference between the net drift into and out of a coastal compartment. Both gross and net drift are typically averaged over a year and expressed in m3/yr. Pdf(s): probability density/distribution function. SDS: Synthetic Design Storms. SLR: Sea Level Rise. 2D: Two-dimensional. 3D: Three-dimensional.