EAST ASIA AND PACIFIC INFRASTRUCTURE...
46
EAST ASIA AND PACIFIC INFRASTRUCTURE STRATEGY
Transcript of EAST ASIA AND PACIFIC INFRASTRUCTURE...
EAST ASIA AND PACIFICINFRASTRUCTURE STRATEGY

PART A: THE EAST ASIA INFRASTRUCTURE CHALLENGE
1. Infrastructure, growth and poverty reduction: The East Asia story
2. Emerging infrastructure challenges: A new environment
3. Infrastructure needs and financing 4. A new framework for policy makers
PART B: THE EAP BUSINESS STRATEGY1. Overview2. Program characteristics, emerging trends and
implementation of the new analytical framework

PART A. THE EAST ASIA INFRASTRUCTURE CHALLENGE
• The East Asia development model – NICs led the way• Strong aggregate growth supporting impressive
poverty reduction• Virtuous cycle of savings, investment and
infrastructure expenditures, enhancing competitiveness
• But significant variation remains in service access
1. Infrastructure, Growth And Poverty Reduction: The East Asia Story

From infrastructure to poverty reduction, through growth and service access
Growth Service Access
Poverty Reduction
Infrastructure Growth Determinants
Access Determinants
Source: Connecting East Asia: A New Framework for Infrastructure, The World Bank

The East Asia development model
Hong Kong (China) Korea Taiwan (China)
Hong Kong
0
2,000
4,000
6,000
8,000
10,000
12,000
1960
1970
1980
1990
Korea
0
20,000
40,000
60,000
80,000
100,000
1960
1970
1980
1990
2000
Taiwan
0
10,000
20,000
30,000
40,000
1960
1970
1980
1990
2000
Singapore Japan Malaysia
Singapore
0
1,000
2,000
3,000
4,000
5,000
1960
1970
1980
1990
2000
Japan
0
50,000
100,000
150,000
200,000
250,000
1960
1970
1980
1990
2000
0.90.91.01.01.11.11.21.2
mil
Right Axis
Malaysia
0
2,000
4,000
6,000
8,000
10,000
12,000
1960
1970
1980
1990
2000
010203040506070
'000
Right Axis
5Total Road Length (km) � Electricity generating capacity (million kWh) < Main Telephone Lines (000s)
Growth in infrastructure stocks, East Asian NICs, 1960 - 2000
?
• Export led model supported by• Strong levels of investment and savings• Strong centralized vision and co-ordination by effective planning agencies• Directed savings through development banks • Infrastructure as integral part of the model
• High growth helped maintain policy consensus
• Much of the inner-workings hidden from public view
• Under increasing stress from the 1990s
NICs led the way…
Source: Connecting East Asia: A New Framework for Infrastructure, The World Bank
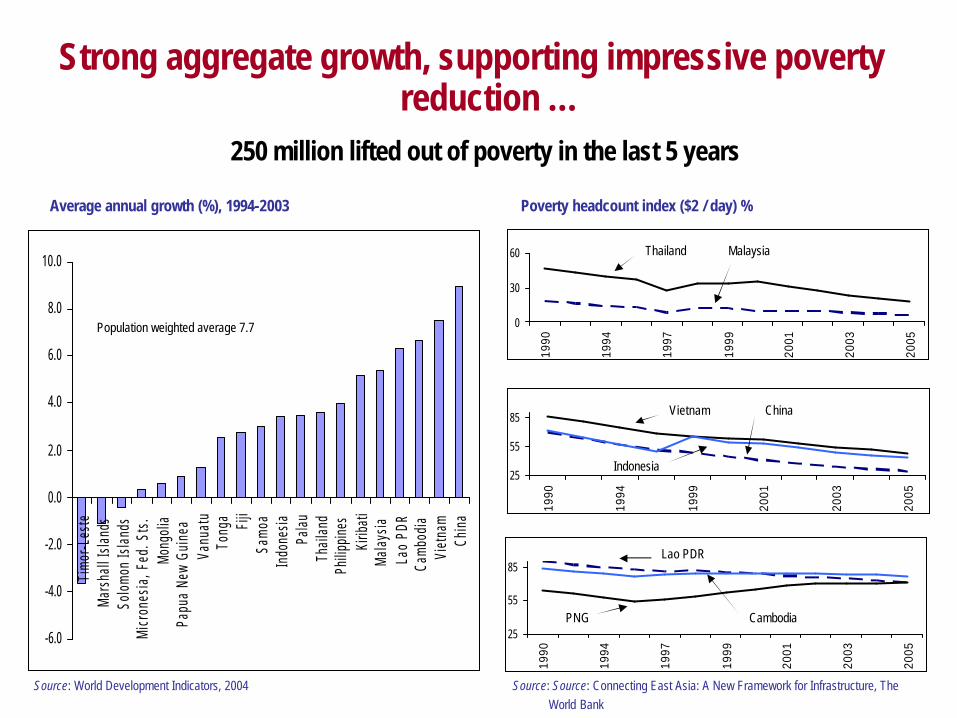
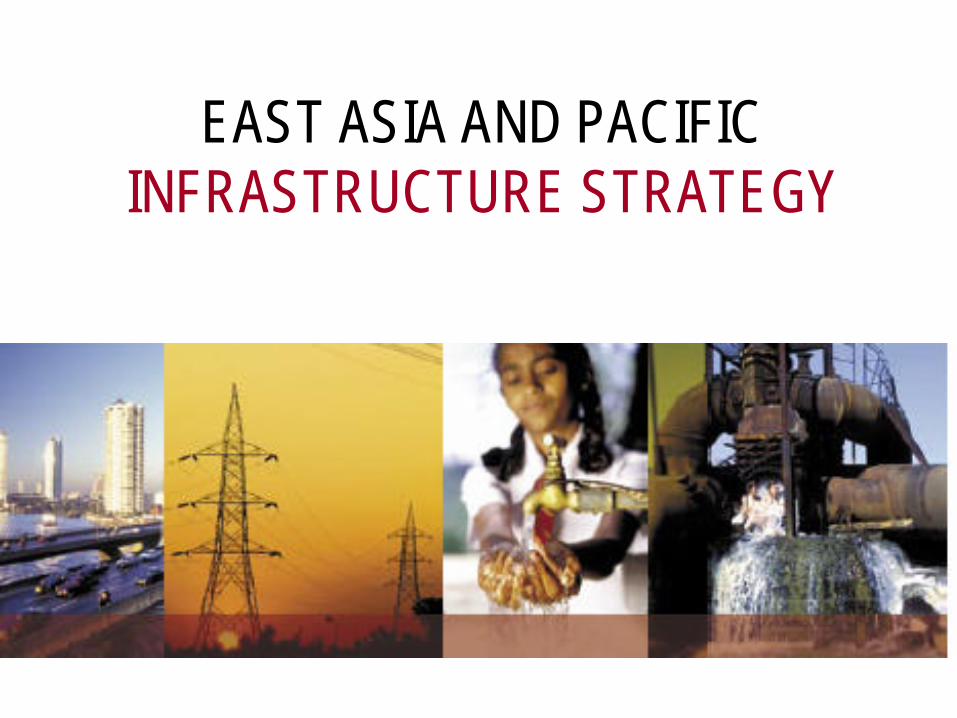
Average annual growth (%), 1994-2003 Poverty headcount index ($2 / day) %
25
55
85
1990
1994
1999
2001
2003
2005
0
30
60
1990
1994
1997
1999
2001
2003
2005
25
55
85
1990
1994
1997
1999
2001
2003
2005
Thailand
Vietnam China
Indonesia
Lao PDR
CambodiaPNG
Malaysia
Strong aggregate growth, supporting impressive poverty reduction …
250 million lifted out of poverty in the last 5 years
Source: World Development Indicators, 2004 Source: Source: Connecting East Asia: A New Framework for Infrastructure, The World Bank
-6.0
-4.0
-2.0
0.0
2.0
4.0
6.0
8.0
10.0
Tim
or-L
este
Mars
hall
Isla
nds
Solo
mon
Isla
nds
Mic
rone
sia,
Fed
. Sts
.Mo
ngol
iaPa
pua
New
Guin
eaVa
nuat
uTo
nga Fiji
Sam
oaIn
done
siaPa
lau
Thai
land
Philip
pine
sKi
ribat
iMa
lays
iaLa
o PD
RCa
mbod
iaVi
etna
mCh
ina
Population weighted average 7.7

Savings and investment (% GDP) 1993-2002
Infrastructure investment (% GDP)
0 20 40
SSA
LAC
SA
ECA
MENA
EAP
Cambodia
Vanuatu
Mongolia
Philippines
Vietnam
Indonesia
Thailand
China
Malaysia
Investment Savings
0-3% 4-7% Over 7%
Cambodia Lao PDR China
Indonesia Mongolia Thailand
Philippines Vietnam
0% 50% 100%
Thailand
Indonesia
Philippines
China
Lao PDR
Vietnam
0% 50% 100% 150%
Philippines
Lao PDR
Indonesia
Thailand
China
Vietnam
Expansion of infrastructure stocks, 1990 – 2000
Total road network Electricity generation capacity
… supported by a virtuous cycle of savings, investment and infrastructure expenditures
Source: World Development Indicators, 2004 Source: Connecting East Asia: A New Framework for Infrastructure, The World Bank

Infrastructure quality ranking, World Competitiveness Report, East Asia
Note: Rankings are shown for developing East Asian economies (darker bars), and advanced East Asian economies (lighter bars). Vertical line is the average for all 102 surveyed countries, both within and outside of East Asia.
Intra-regional exports
Emerging East Asia (China, ASEAN, newly industrializing economies, Mongolia), share of world exports (%)
0.0
5.0
10.0
15.0
20.0
1990
1991
1992
1993
1994
1995
1996
1997
1998
1999
2000
2001
2002
2003
Intra-regional exports increase from 32percent to 41 % of EAP
trade
East Asia infrastructure compares well with the rest of the world and accounts for a growing share of world exports …
Source: IMF, Direction of Trade Statistics
T e l e p h o n e s
0 . 0 2 . 0 4 . 0 6 . 0 8 . 0
Japan
Taiwan
Korea
Hong Kong
Singapore
Phi l ippines
Vietnam
Indonesia
China
Thailand
Ma lays ia
O v e r a l l i n f r a s t r u c t u r e
q u a l i t y
0 . 0 2 . 0 4 . 0 6 . 0 8 . 0
Japan
Taiwan
Korea
Hong Kong
Singapore
Phi l ipp ines
Vietnam
Indonesia
China
Thai land
Ma lays ia
E l e c t r i c i t y s u p p l y
0 . 0 2 . 0 4 . 0 6 . 0 8 . 0
Japan
Taiwan
Korea
Hong Kong
Singapore
Phi l ipp ines
Vietnam
Indonesia
China
Thailand
Malays ia
P o r t s
0 . 0 2 . 0 4 . 0 6 . 0 8 . 0
Japan
Taiwan
Korea
Hong Kong
Singapore
Phi l ipp ines
Vietnam
Indonesia
China
Thai land
Ma lays ia
R a i l r o a d s
0 . 0 2 . 0 4 . 0 6 . 0 8 . 0
Japan
Taiwan
Korea
Hong Kong
Singapore
Phi l ipp ines
Vietnam
Indonesia
China
Thai land
Ma lays ia
A i r T r a n s p o r t
0 . 0 2 . 0 4 . 0 6 . 0 8 . 0
Japan
Taiwan
Korea
Hong Kong
Singapore
Phi l ipp ines
Vietnam
Indonesia
China
Thailand
Malays ia
0
25
50
75
100
PNG
Cam
bodi
a
Viet
nam
Lao
PDR
Mon
golia
Solo
mon
Mya
nmar
Chin
a
Indo
nesia
Pala
u
Philip
pine
s
Vanu
atu
Mal
aysia
Thai
land
Sam
oa
Tong
a
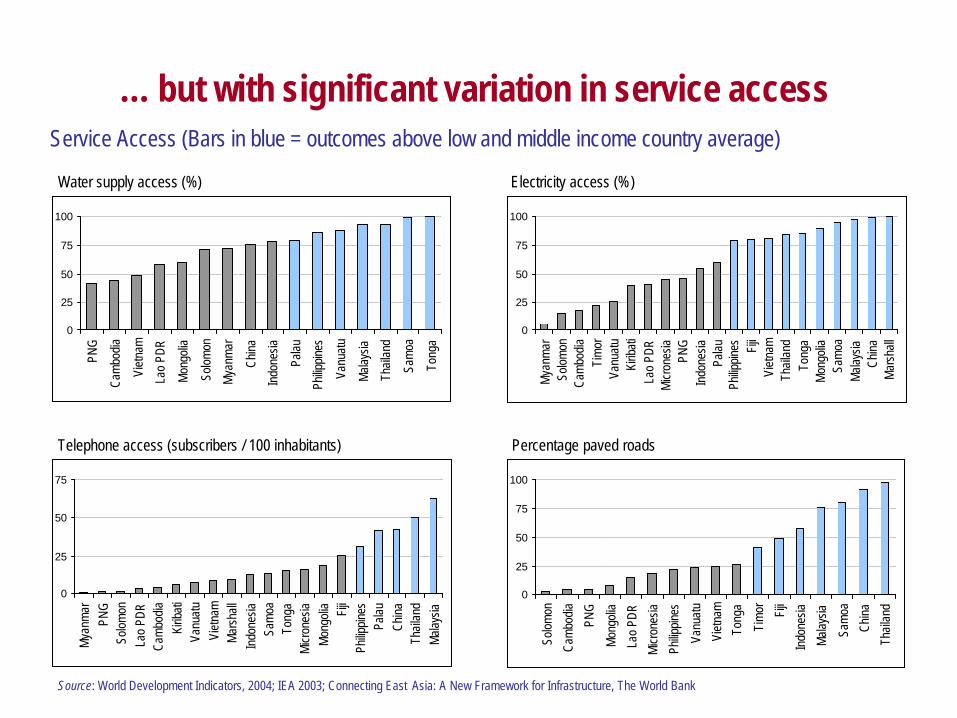
Service Access (Bars in blue = outcomes above low and middle income country average)
Water supply access (%) Electricity access (%)
0
25
50
75
100
Mya
nmar
Solo
mon
Cam
bodi
aTi
mor
Vanu
atu
Kirib
ati
Lao
PDR
Micr
ones
iaPN
GIn
done
siaPa
lau
Philip
pine
s Fiji
Viet
nam
Thai
land
Tong
aM
ongo
liaSa
moa
Mal
aysia
Chin
aM
arsh
all
Telephone access (subscribers / 100 inhabitants) Percentage paved roads
0
25
50
75
Mya
nmar
PNG
Solo
mon
Lao
PDR
Cam
bodi
aKi
ribat
iVa
nuat
uVi
etna
mM
arsh
all
Indo
nesia
Sam
oaTo
nga
Micr
ones
iaM
ongo
lia Fiji
Philip
pine
sPa
lau
Chin
aTh
aila
ndM
alay
sia
0
25
50
75
100
Solo
mon
Cam
bodi
a
PNG
Mon
golia
Lao
PDR
Micr
ones
ia
Philip
pine
s
Vanu
atu
Viet
nam
Tong
a
Tim
or Fiji
Indo
nesia
Mal
aysia
Sam
oa
Chin
a
Thai
land
… but with significant variation in service access
Source: World Development Indicators, 2004; IEA 2003; Connecting East Asia: A New Framework for Infrastructure, The World Bank

2. EMERGING CHALLENGES: A NEW ENVIRONMENT
• Rapid urbanization • Growing inequalities and disparities in
access• Changing governance model • Increased regional integration • Growing environmental concerns

1960
2025
2000
1980
0
25
50
75
100
SSA SA MENA LAC OECD EAP
Urbanization is the new driver for productivity and infrastructure
Urban population (% total population) Growth in number of cities over one million inhabitants
500 million more people move into Asian cities
0
20
40
60
80
100
120
140
160
180
2000 2005 2010 2015
… in 20 years, East Asia will be an urban region
Source: World Development Indicators, 2004; United Nations World Urbanization Prospects, 2003
Source: United Nations World Urbanization Prospects, 2003

Inequality – A contrasted picture
Poor provinces in the hinterland, but concentration of the poor along the coast …
Percentage population living below $2 / day (each dot = 50 000 people)Percentage population living below $2 / day (by region)
% of population living below PPP$2/day in 2002
20% 40% 60% 80%
Source: Poverty Reduction and Economic Management Unit, The World Bank, 2004 Source: Poverty Reduction and Economic Management Unit, The World Bank, 2004

Access to improved sanitation (2002)
0
20
40
60
80
100
120
China
Indone
siaKiri
bati
Marshal
l Island
s
Micrones
ia, Fed.
Sts.
Myanmar Pala
u
Philipp
ines
Vietnam
of p
opul
atio
n w
ith a
cces
s to
impr
oved
san
itatio
n
Rural Urban
Inequality – The rural-urban challenge
Access to electricity
0
20
40
60
80
100
120
Indonesia 1997 Philippines 1998 Vietnam 2004
% o
f hou
seho
lds
with
acc
ess
to e
lect
ricity
Rural Urban
0
20
40
60
80
100
China
Indone
siaKiriba
ti
Mongolia
Myanmar Pala
u
Philipp
inesTha
iland
% o
f pop
ulat
ion
with
acc
ess
to im
prov
es w
ater
sou
rce
Rural Urban
Access to improved water source (2002)
Disparities between rural and urban access are large and growingAccess to telecommunications (2003)
0
5
10
15
20
25
30
35
China Mongolia Myanmar Tonga Thailand
Mai
nlin
es p
er 1
00 p
eopl
e
Rural Urban
Source: World Development Indicators, 2004; Demographic and Health Surveys 1990-2001
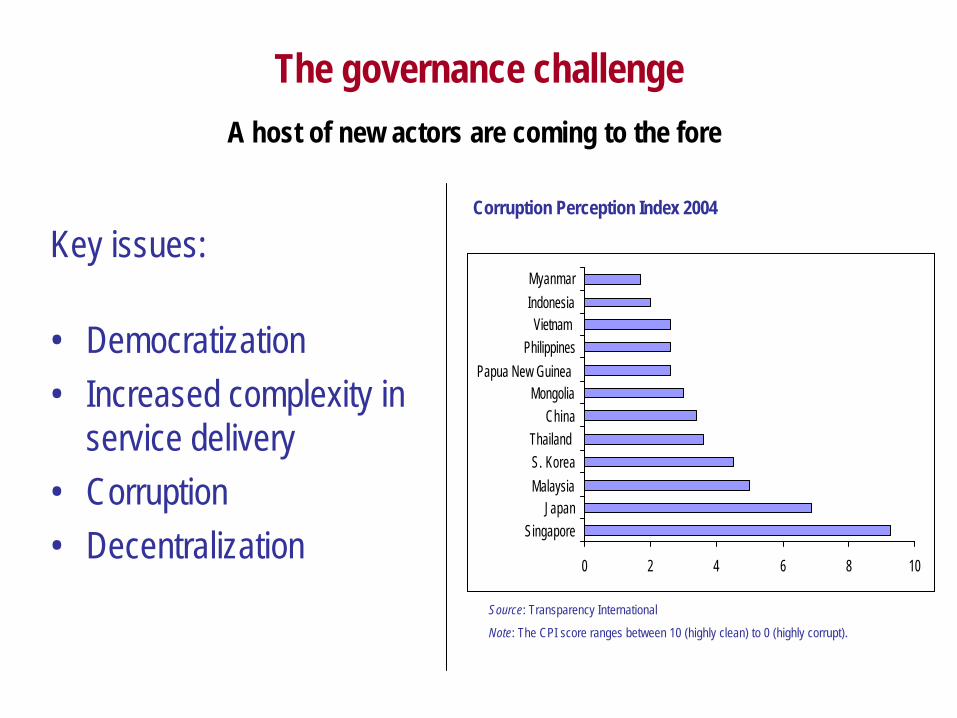
The governance challenge
Key issues:
• Democratization• Increased complexity in
service delivery• Corruption• Decentralization
Corruption Perception Index 2004
Source: Transparency International
Note: The CPI score ranges between 10 (highly clean) to 0 (highly corrupt).
A host of new actors are coming to the fore
0 2 4 6 8 10
SingaporeJapan
MalaysiaS. KoreaThailand
ChinaMongolia
Papua New Guinea Philippines
Vietnam IndonesiaMyanmar

Decentralization
Key challenges:
• Managing spillovers in service provision
• Fragmentation• The missing middle• Implementation of
integrated vision
Expenditure decentralization – sub-national expenditure (% total national expenditure)
0 10 20 30 40 50 60 70
Germany (1990s)
USA (1990s)
Japan (1990s)
OECD countries (1990s)
Pakistan (1990s)
Russia (1990s)
India (1990s)
Thailand (2001)
Philippines (2002)
Indonesia (2002)
Vietnam (2002)
China (2002)
All transition countries (1990s)
All developing countries (1990s)
Adapting the role of the state to a new reality
Source: East Asia Decentralizes—Making Local Government Work, The World Bank

Increased regional interdependence
Interdependence of auto-manufacturing in ASEAN
Philippines
Philippines Mindanao
Mongolia
Indonesia Sulawesi
Laos
Hong Kong
TaiwanSingapore
KoreaJapan
Thailand NE
Malaysia
ChinaThailand
China Inland
Vietnam Inland
-1.00
PNG
-2.00
-1.50
-1.00
-0.50
0.00
0.50
1.00
1.50
2.00
2.50
-15.00 -10.00 -5.00 0.00 5.00 10.00 15.00
Accessibility
Trade Openness
Cambodi
a
Indices of trade openness and accessibility in East Asia
East Asia’s growing intra-regional trade places increasing demand on regional access
Source: Nomura Research Institute, Reprinted in Connecting East Asia: A New Framework for Infrastructure, The World Bank
Source: Connecting East Asia: A New Framework for Infrastructure, The World Bank

Infrastructure and the environment
Exponential increases in the demand for energy and its uses will have major environmental consequences
Actual and projected growth in energy demand in EAP, by fuel type, 1990-2030
Source: World Bank RAINS - Asia Database
Projected no. of automobiles, China 2000 - 2020
0
10
20
30
40
50
60
70
80
90
2000
2002
2003
2004
2005
2006
2007
2008
2009
2010
2011
2012
2013
2014
2015
2016
2017
2018
2019
2020
Proj
ecte
d no
. of a
utom
obile
s (in
mill
ions
) 13 million
77 million
Source: International Energy Agency, 2005; World Bank Staff Estimates
3: INFRASTRUCTURE NEEDS AND FINANCING
• East Asia needs are large and increasing • At the macro level, financing is not a constraint • But infrastructure needs vary significantly across
countries• Finance mobilization
– Private sector – the bubble has burst, but sentiment remains positive
– Public Sector – there is a need to create fiscal space – International donors – play a small role in most of the
region • Getting the priorities right: financial engineering is no
substitute for sound project design (tax payers and users must pay)
0
20
40
60
80
100
120
140
160
180
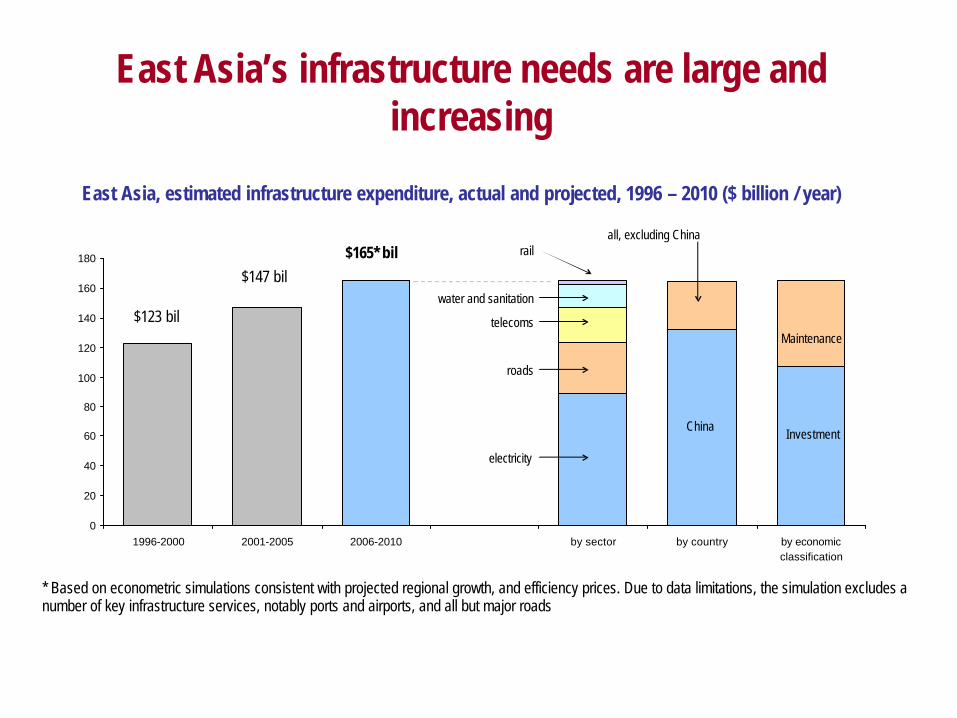
1996-2000 2001-2005 2006-2010 by sector by country by economicclassification
* Based on econometric simulations consistent with projected regional growth, and efficiency prices. Due to data limitations, the simulation excludes a number of key infrastructure services, notably ports and airports, and all but major roads
East Asia’s infrastructure needs are large and increasing
East Asia, estimated infrastructure expenditure, actual and projected, 1996 – 2010 ($ billion / year)
$123 bil
$147 bil$165* bil
electricity
roads
telecoms
water and sanitation
rail
China
all, excluding China
Investment
Maintenance

At the macro level, financing is not a constraint in East Asia …
Selected macroeconomic indicators 2004 (US$ billion)
4913*67Malaysia
193*28199S. Korea
1100*172845Japan
75746*623China
Gross domestic savings
Current a/c surplus
Foreign exchange reserves
0.0
1.0
2.0
3.0
4.0
5.0
6.0
7.0
8.0
China Low income Middle income
6.9 %6.3 %
3.6 %
… but, infrastructure needs vary significantly across countries
East Asia, estimated infrastructure expenditure, 2006-2010, % GDP
Source: Connecting East Asia: A New Framework for Infrastructure, The World Bank
Source: World Development Indicators 2004, 2003
* Numbers for 2003

Finance mobilization – The private sector
The private sector bubble has burst… … but sentiment is positive
0
5
10
15
20
25
30
35
40
45
1990
1991
1992
1993
1994
1995
1996
1997
1998
1999
2000
2001
2002
2003
0
20
40
60
80
100
120
140
24%
10%
88%
8%4%
67%
increase sustain decrease
Global firms East Asian firms
Does your company expect to increase, sustain, or decrease your total sector investment in the region in the next two years?
Private sector investment in infrastructure ($ billion)
To EAP (left axis)
To all developing countries (right axis)
… with new regional actors emerging
Source: World Bank PPI Database, 2005 Source: East Asia and Pacific Private Investors in Infrastructure Perception Survey 2004
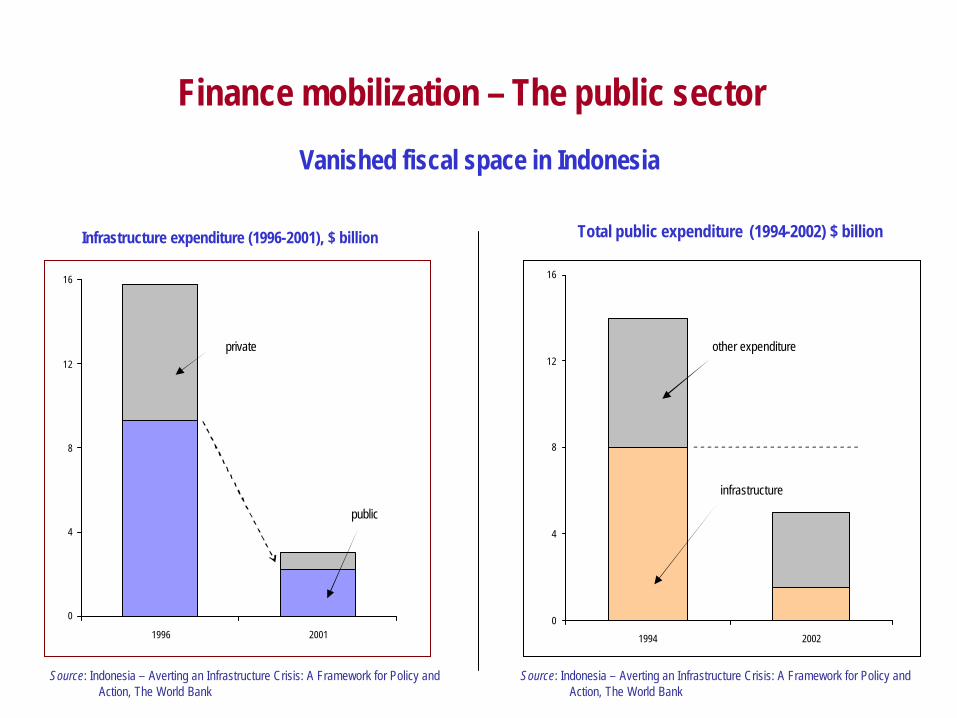
Finance mobilization – The public sector
0
4
8
12
16
1996 20010
4
8
12
16
1994 2002
Vanished fiscal space in Indonesia
Total public expenditure (1994-2002) $ billionInfrastructure expenditure (1996-2001), $ billion
private
public
infrastructure
other expenditure
Source: Indonesia – Averting an Infrastructure Crisis: A Framework for Policy and Action, The World Bank
Source: Indonesia – Averting an Infrastructure Crisis: A Framework for Policy and Action, The World Bank

Finance mobilization – The international community
-10 0 10 20 30 40 50 60
Thailand
China
Malaysia
East Asia & Pacific
Indonesia
Philippines
Vietnam
Cambodia
Mongolia
Aid (% of GDP and % of investment, 2003)
Donors are small players in most of the region
Aid (% of investment)
Aid (% of GDP)
Estimated regional infrastructure needs (percentage of GDP) – 6.2 %
For the region as a whole, aid is only a small portion
of infrastructure needs
Source: World Development Indicators, 2004
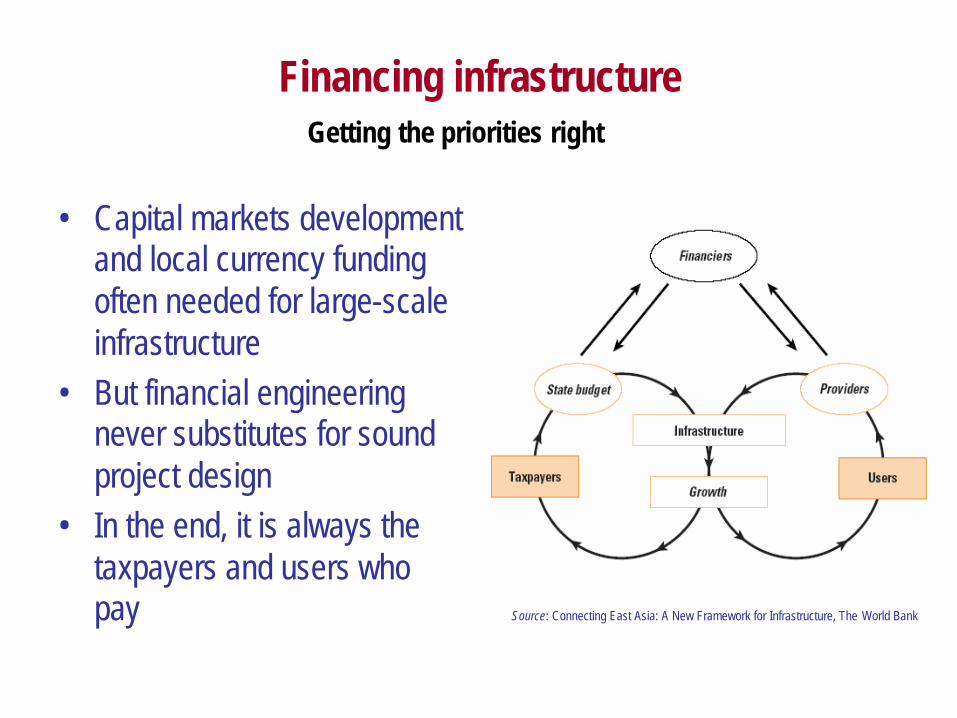
Financing infrastructure
• Capital markets development and local currency funding often needed for large-scale infrastructure
• But financial engineering never substitutes for sound project design
• In the end, it is always the taxpayers and users who pay
Getting the priorities right
Source: Connecting East Asia: A New Framework for Infrastructure, The World Bank
4: A NEW FRAMEWORK FOR POLICY MAKERS
• Inclusive development
– Coordination– Accountability– Risk management
• Operationalization: A model on three levels

A new analytical framework for policy makers
Accountabilityand
Risk Management
Coordination
InclusiveDevelopment
Reconciling need for central vision with decentralization and market forces; getting expenditures right;
managing fiscal space
Clarifying rules of the game and social objectives; improving competition, regulation, and
oversight mechanisms
Economic growth, plus sharing the benefits of
growth to reduce poverty
Establishing public-private partnership frameworks; sharing risks and managing contingent liabilities
Inclusive development: A stool with three legs – coordination, accountability and risk management
Operationalization: A model on three levels
• New role of central agencies – Fiscal space and priorities– PPP framework – Modalities for government support – Risk management
• Clarity of sector development plans and reform agenda
– Predictability and clear rules of the game – With incentives for efficiency and sustainability
• Appropriate pipeline of complementary quality transactions
PART B: THE EAP BUSINESS STRATEGY
• Sustained engagement over time
• But reliable partner?
• Recent resumption in infrastructure lending, but accounting only for a fraction of total infrastructure needs
• Focus on leverage and impact
1. Overview

World Bank lending for infrastructure in East Asia & Pacific region 1951-2005
0
5
10
15
20
25
30
35
40
45
50
51 54 56 57 58 59 60 61 62 63 64 65 66 67 68 69 70 71 72 73 74 75 76 77 78 79 80 81 82 83 84 85 86 87 88 89 90 91 92 93 94 95 96 97 98 99 00 01 02 03 04 05
0
500
1,000
1,500
2,000
2,500
3,000
3,500
4,000
4,500
5,000
# Proj
IBRD+IDA+Grant
Total lending for Infrastructure in East Asia & Pacific (1951-2005): Over $60 billion
Sustained engagement over time


World Bank Group lending, EAP Region, 1995 to 2005 ($ million)
Note: No projects for 1994-2004 = PE+GEF+SF; FY05 includes also two operations postponed to FY06
But reliable partner?
EAP infrastructure: New projects and commitments: 1995-2005
18 1917 18
13 13
9
13
18 1719
3,3603,555
2,930
2,2991,843
1,152970
1,356
1,8491,700
1,841
0
5
10
15
20
25
30
35
40
1995 1996 1997 1998 1999 2000 2001 2002 2003 2004 20050
500
1000
1500
2000
2500
3000
3500
4000
No. Projects
IBRD + IDA + Grant Amt
EASIN PORTFOLIO
• 105 projects with netcommitments of $12.0 billion
• Lending doubled over three years to $1.7 billion
• Sustainable pipeline of around 18 projects, approximating $2 billion / year
• 60 percent of EAP net commitments
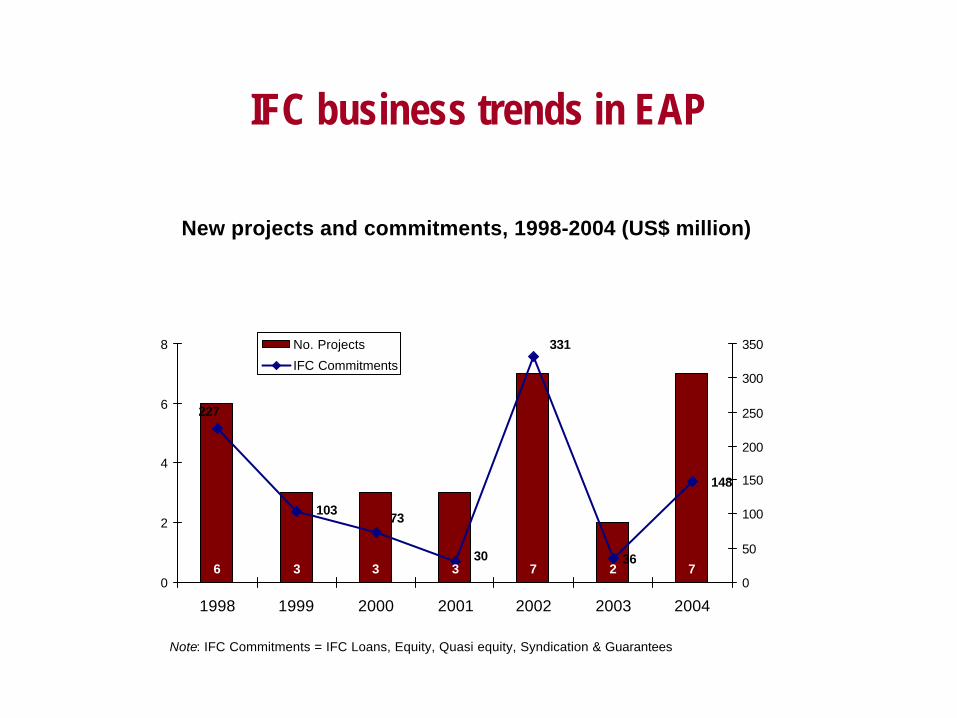
IFC business trends in EAP
New projects and commitments, 1998-2004 (US$ million)
Note: IFC Commitments = IFC Loans, Equity, Quasi equity, Syndication & Guarantees
6 3 3 3 7 2 736
227
10373
30
331
148
0
2
4
6
8
1998 1999 2000 2001 2002 2003 20040
50
100
150
200
250
300
350No. Projects
IFC Commitments
0.0
0.5
1.0
1.5
2.0
2.5
3.0
3.5
4.0
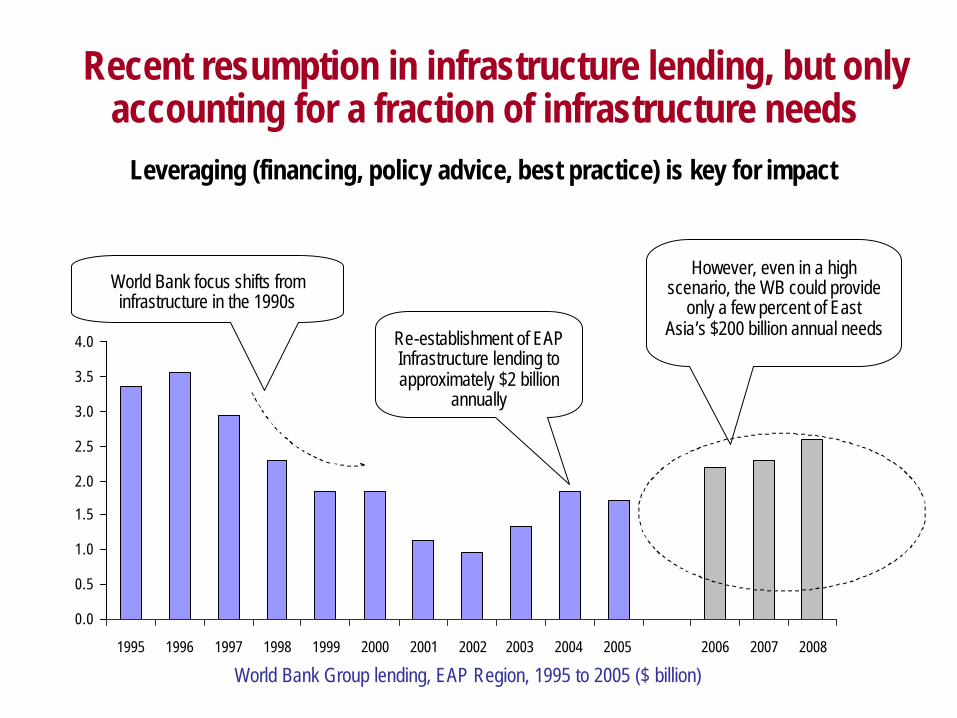
1995 1996 1997 1998 1999 2000 2001 2002 2003 2004 2005 2006 2007 2008
World Bank Group lending, EAP Region, 1995 to 2005 ($ billion)
World Bank focus shifts from infrastructure in the 1990s
Re-establishment of EAP Infrastructure lending to approximately $2 billion
annually
However, even in a high scenario, the WB could provide
only a few percent of East Asia’s $200 billion annual needs
Recent resumption in infrastructure lending, but only accounting for a fraction of infrastructure needs
Leveraging (financing, policy advice, best practice) is key for impact

Leveraging large volumes of private flowsExample: Nam Theun 2, Laos
• $1.45 billion hydro project (incl. contingent financing) exporting energy to Thailand
• Leveraged private sector financing of $1.2 billion through IDA grant of $20 million and combination of IDA and MIGA guarantees up to $100 million, matched by ADB.
• Entailed partnership with other donors and consortium of international and Thai Banks.

Phu My 3 PowerPhu My 2-2 Power
• Private sector with IDA guarantee
• 715 MW gas-fired power plant• Total project cost: US$ 400
million• Bank Group Support - IDA:
– US$ 75 M Partial Risk Guarantee
• Fully private supported by MIGA guarantee
• 716 MW combined cycle gas-fired power plant
• Total project cost: US$412 million
• Bank Group Support - MIGA:– US$ 48 M Equity– US$ 90 M Debt (P&I)
20032002
The evolving role of Bank Group enhancement Example: Phu My 1, 2, 3, Vietnam
Phu My 2-1 Power
1996
• Public financed project• 336 MW gas-fired power plant
(with subsequent expansions)• Bank Group supported the
development of first phase – IDA:– US$ 180 M equivalent
Credit

2. PROGRAM CHARACTERISTICS, EMERGING TRENDS & IMPLEMENTATION OF NEW
ANALYTIC FRAMEWORK
• 5 platforms of engagement
• EAP infrastructure business: by country, by sector, and by instrument
• Emerging trends
• Implementation of the new analytical framework

Five platforms of engagement
EAP BUSINESS STRATEGY
Global
Regional
National / Sovereign
Sub-sovereign
Community
• NT2
• Infrastructure regulator’s Forum
• Marine Electronic Highway (Singapore-Indonesia-Malaysia)
• GMS partnership - transport and energy
• East Asia Flagship
• Pacific Island Infrastructure strategy (REDI)
• Shanghai Urban Environment Program
• Laos Provincial Infrastructure
• Small town development in China (AAA)
• GEF and carbon financing: Xiaogushan Hydro; Mongolia District Heating
• GEF land pollution and air quality programs
• International Privatization experience (AAA for Malaysia)
• Bulk of EAP lending
• Indonesia, Philippines, Vietnam Infrastructure strategies (REDIs)
• Kabubatan Development Project
• Vietnam rural roads

Existing active portfolio by country (no. of operations)
China (54)Vietnam (15)
Indonesia (9)
Philippines (8)Cambodia (4)PNG(4)Samoa & Mongolia (3 each)Lao PDR & Timor Leste (2
each)Thailand & Tonga (1 each)
EAP infrastructure business by country …
• In savings-rich fast-growing countries, focus on introducing best practice, or scaling up and supporting existing policies and programs (Vietnam, China)
• In countries faced with fiscal constraints, focus on leveraging private sector finance (Philippines, Indonesia)
• In IDA countries, focus on meeting financing needs for basic infrastructure and on partnerships (Laos, Mongolia, Pacific Islands)
China (8739)
Vietnam (1973)
Indonesia (1096)
Philippines (475)
Cambodia (131)
Thailand, PNG, Mongolia, Lao PDR, Samoa, Tonga, Timor Leste (300)
Existing active portfolio by country (net commitments $ million)

• Strong transport portfolio across countries
• Fast growing portfolio in urban infrastructure
• Fluctuations in energy following sharp reductions in 1990s
• Growing multisectoralapproaches
… by sector
Existing active portfolio by sector (net commitments $ million)
Urban, water and sanitation (3798)
Transport (5733)
Energy and mining (3208)
I CT (4.5)
ICT (1)
Energy and mining (26)
Urban, water and
sanitation (35)
Transport (44)
Existing active portfolio by sector (no. of operations)

… and by instrument
Existing active portfolio by product line• Covering access and growth requirements
• Major focus on capacity expansion (Category A projects)
• Environmental management (water & sanitation) and renewable energy
• Growing GEF and PCF programs
IBRD (72)
IDA (28)
GEF (4)
Carbon Finance (3)
Special Financing (2)
Guarantees (1)
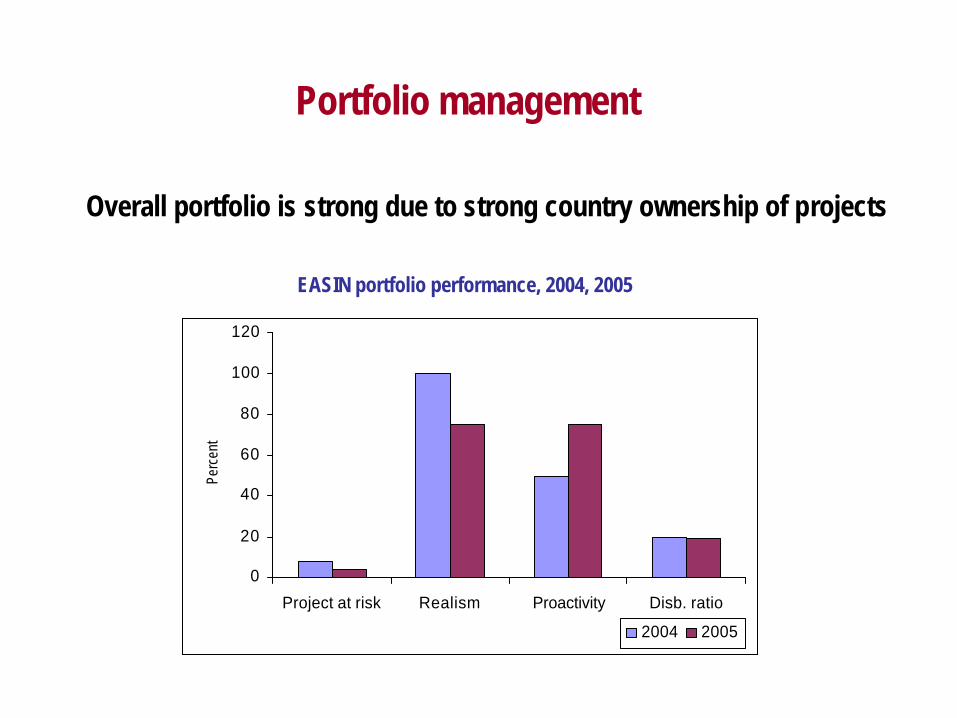
Portfolio management
EASIN portfolio performance, 2004, 2005
Overall portfolio is strong due to strong country ownership of projects
0
20
40
60
80
100
120
Project at risk Realism Proactivity Disb. ratio
Perc
ent
2004 2005

Analytical work
• Strong AAA and R&D crucial to support value added, relevant policy advice, sharing of experiences, and operational impact
– 12% of BB budget and 3-4 times leverage of Bank’s BB with trust funds over last 3 years
• Increasing focus on integrated cross-sectoral work – Infrastructure strategies (Indonesia, Philippines,
Vietnam, Pacific Islands, Mongolia) – PPP frameworks – Infrastructure finance
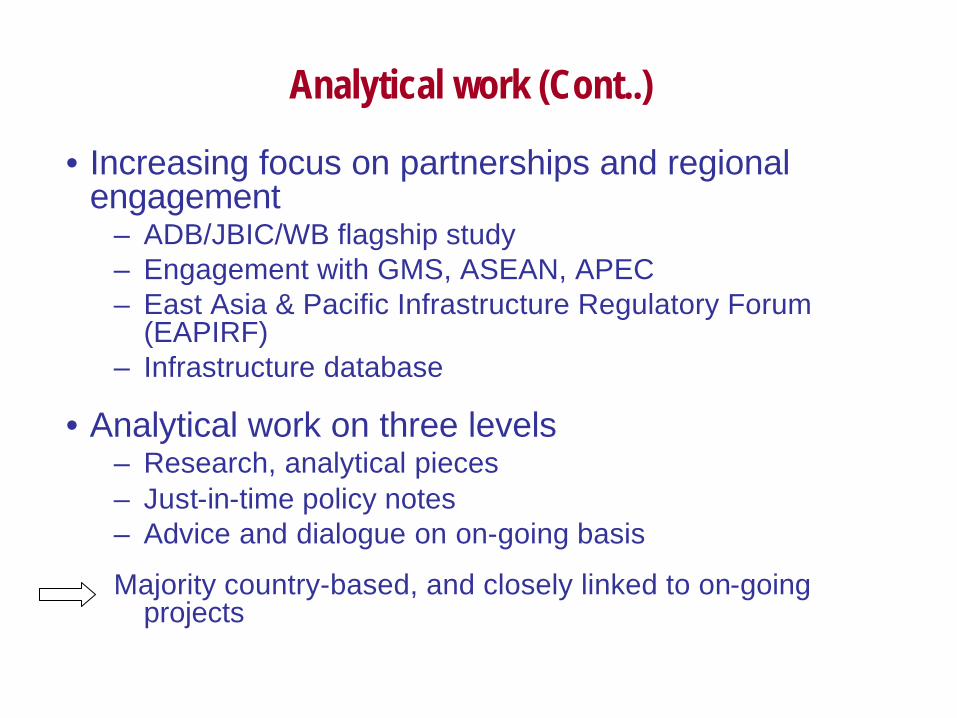
Analytical work (Cont..)
• Increasing focus on partnerships and regional engagement
– ADB/JBIC/WB flagship study– Engagement with GMS, ASEAN, APEC– East Asia & Pacific Infrastructure Regulatory Forum
(EAPIRF)– Infrastructure database
• Analytical work on three levels– Research, analytical pieces– Just-in-time policy notes– Advice and dialogue on on-going basis
Majority country-based, and closely linked to on-going projects

Emerging trends
• The infrastructure program is not constrained by demand, but by country borrowing requests, creditworthiness issues and IDA constraints.
• New priorities – Public-private partnerships agenda (cross-sectoral)– Subnational and infrastructure finance– Regional: GMS and regional GEFs– GEF and PCF– Renewed demand for energy (and hydro) generation– Cross-sectoral reform agenda.
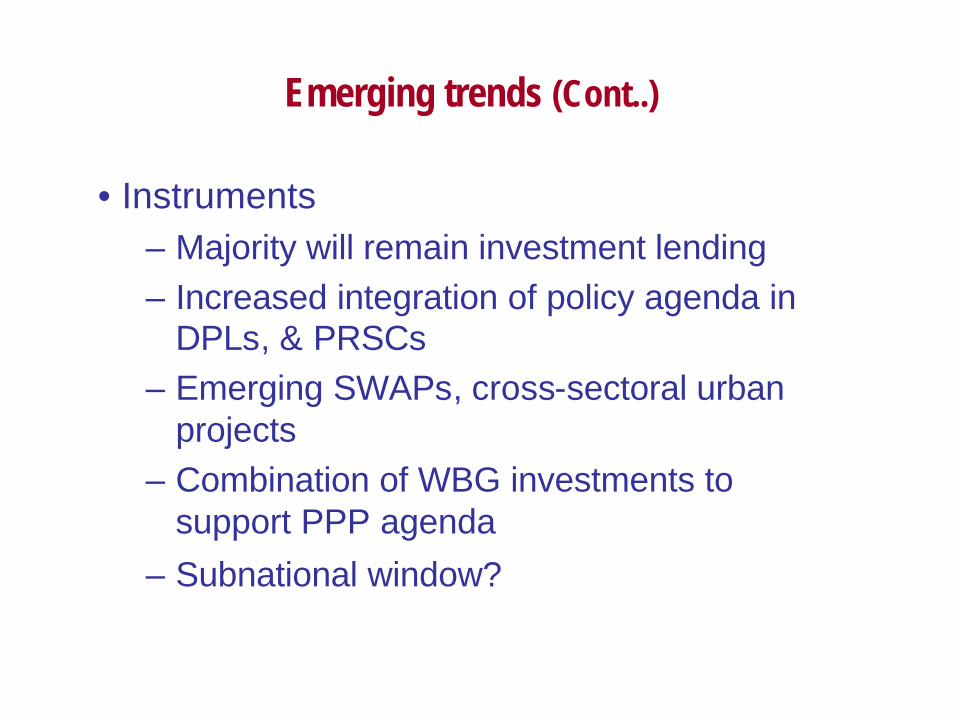
Emerging trends (Cont..)
• Instruments– Majority will remain investment lending – Increased integration of policy agenda in
DPLs, & PRSCs– Emerging SWAPs, cross-sectoral urban
projects– Combination of WBG investments to
support PPP agenda– Subnational window?
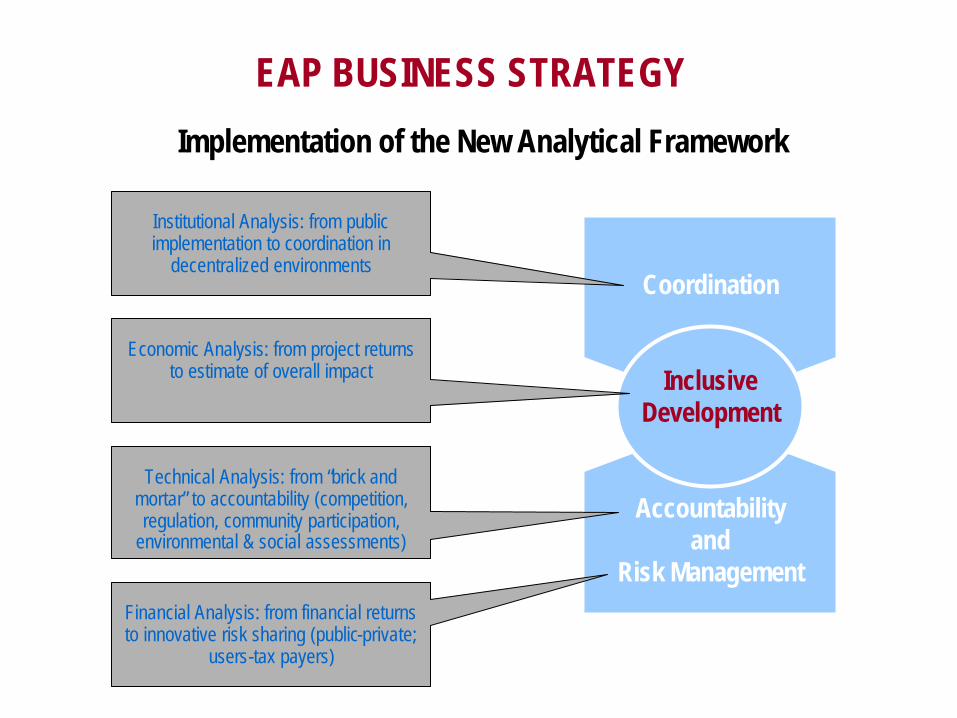
EAP BUSINESS STRATEGY
Accountabilityand
Risk Management
Coordination
InclusiveDevelopment
Implementation of the New Analytical Framework
Institutional Analysis: from public implementation to coordination in
decentralized environments
Economic Analysis: from project returns to estimate of overall impact
Technical Analysis: from “brick and mortar” to accountability (competition, regulation, community participation,
environmental & social assessments)
Financial Analysis: from financial returns to innovative risk sharing (public-private;
users-tax payers)