EAST AFRICAN REGIONAL ANALYSIS OF YOUTH DEMOGRAPHICS · East African Regional Analysis of Youth...
80
EAST AFRICAN REGIONAL ANALYSIS OF YOUTH DEMOGRAPHICS
Transcript of EAST AFRICAN REGIONAL ANALYSIS OF YOUTH DEMOGRAPHICS · East African Regional Analysis of Youth...

I
EAST AFRICANREGIONAL ANALYSIS OFYOUTH DEMOGRAPHICS


EAST AFRICANREGIONAL ANALYSIS OFYOUTH DEMOGRAPHICS
May 2018

Disclaimer: This document is an output from a project funded by the UK Department for International Development (DFID) through the Research for
Evidence Division (RED) for the benefit of developing countries. However, the views expressed and information contained in it are not necessarily
those of, or endorsed by DFID, which can accept no responsibility for such views or information or for any reliance placed on them.

East African Regional Analysis of Youth Demographics V
Table of ContentsLIST OF FIGURES.................................................................................................VII
LIST OF TABLES...................................................................................................VIII
ABBREVIATIONS..................................................................................................IX
EXECUTIVE SUMMARY......................................................................................XI
1. INTRODUCTION................................................................................................2
2. RATIONALE, PROBLEM STATEMENT.............................................................4
3. DEMOGRAPHY OF THE FOUR EAC COUNTRIES....................................8
3.1. Demographic Profiles .............................................................................. 8
3.2. Pathways to a Youth Bulge ................................................................... 10
3.3. Priority Policy Areas Necessary to Harness a
Sizeable Demographic Dividend .........................................................13
4. YOUTH CHALLENGES IN THE EAC.............................................................15
4.1. Health Challenges for Youth....................................................................15
Policy and programmatic responses to the health challenges.........16
4.2. Education.....................................................................................................17
Policy and programme responses to education challenges............18
4.3. Economy, Employment and Job Creation.......................................... 20
Actions to grow jobs in the EAC ......................................................... 22
4.4. Urbanisation............................................................................................. 24
Policy and programme responses to challenges of urbanisation..24
5. FUTURE SCENARIOS...................................................................................... 26
5.1. Population projections............................................................................. 26
5.2. Timing of the first Demographic Dividend............................................ 28
5.3. Future demands for services.................................................................... 31
Demand for quality education and skills development..................... 31
Demand for modern methods of contraception................................. 32
Youth not in "Employment, Education, or Trainings”.......................... 33
6. MODELLING THE POTENTIAL IMPACT OF THE DEMOGRAPHIC
DIVIDEND IN EAST AFRICA.......................................................................... 35
6.1. DEMDIV results........................................................................................ 36
KENYA....................................................................................................... 37
RWANDA.................................................................................................. 38
TANZANIA............................................................................................... 39
UGANDA.................................................................................................. 40
6.2. Business-as-Usual Scenario: What are the risks of inaction?.......... 41
7. SUMMARY AND RECOMMENDATIONS............................................... 43
Recommendations to EAC governments: Priority Areas for Investment... 44
Recommendations to DFID and Development partners............................. 45

East African Regional Analysis of Youth Demographics VI
REFERENCES........................................................................................................ 48
APPENDICES........................................................................................................ 52
APPENDIX 1: Methods ......................................................................... 52
APPENDIX 2: Population Projections................................................... 55
APPENDIX 3: Summary Results on the Association
between Fertility and Education, and Fertility
and Household Wealth............................................... 57
APPENDIX 4: Key Findings from Population Projections ................ 58
APPENDIX 5: The Demographic Window of Opportunity
for Developing Countries in Advanced
Demographic Transition............................................... 60
APPENDIX 6: DemDiv Demographic Dividend Modelling
Policy Scenarios and Variables for Kenya,
Rwanda, Tanzania,and Uganda................................ 61

East African Regional Analysis of Youth Demographics VII
List of Figures Figure 1: Africa’s share of the world population, 2015-2063.
UN Medium Variant Scenario, 2017 Revision and
share of Gross Domestic Product in 2015..................................... 5
Figure 2: Simplified Conceptual Framework: Youth Bulge and the
Demographic Dividend...................................................................... 6
Figure 3: Population pyramids of Kenya, Rwanda, Tanzania, and
Uganda compared with Malaysia and South Korea, 2015...... 9
Figure 4: Growth of global youth population (15-24 years), by regions of
the world. UN Medium Variant scenario, 2017 Revision...........10
Figure 5: Pathways to the youth bulge in East Africa.....................................11
Figure 6: Estimated changes in Senegal’s Support Ratio and
First Demographic Dividend, 1950-2050 (CREFAT, 2015).......12
Figure 7: Deaths per 10,000 youth population (10-24 years)...................15
Figure 8: Age-specific fertility rates for four EAC countries, DHS/MIS
2014-2016............................................................................................16
Figure 9: Unmet need for contraception among sexually
active 15-24 year old women by marital status,
DHS 2014 -16.................................................................................... 16
Figure 10: GDP growth rate trends for Kenya,
Rwanda,Tanzania and Uganda.................................................. 20
Figure 11: Projected population pyramids by 2050 for
the four EAC countries under varying scenarios...................... 28
Figure 12: Theoretical ratio of producers (20-64 years) to
young and old dependents (0 -19 and 65+)............................29
Figure 13: Rate of change in the theoretical support ratio
(Producers 20-64 years to Dependents 0-19 and 65+
years)................................................................................................... 29
Figure 14: Estimated number (thousands) of secondary
school places under two scenarios, 2015-2065..................... 31
Figure 15: Number of youth, 15-34 years (‘000s) in
need of modern contraception, 2015-2065............................ 32
Figure 16: Projected numbers of youth (‘000s) Not in Education,
Employment or Training [NEET] ................................................. 33
Figure 17: Kenya - Projected Per capita GDP (in US$).............................. 37
Figure 18: Kenya - Projected Human Development Index......................... 37
Figure 19: Rwanda - Projected Per capita GDP (in US$).......................... 38
Figure 20: Rwanda - Projected Human Development Index ................... 38
Figure 21: Tanzania - Projected Per capita GDP...........................................39
Figure 22: Tanzania- Projected Human Development Index.................... 39
Figure 23: Uganda - Projected Per capita GDP...........................................40
Figure 24: Projected Human Development Index.........................................40
Figure 25: Priority investment areas to harness the
demographic dividend ................................................................. 43
Figure 26: “Business-as-usual” or disinvestment in youth........................... 43

East African Regional Analysis of Youth Demographics VIII
Table 1: Demographic profiles of EAC countries.......................................... 8
Table 2: Comparison of select socio-economic and demographic
indicators for EAC countries, Malaysia and South Korea............10
Table 3: Health policies and their objectives targeting youth in the
EAC........................................................................................................ 17
Table 4: Enrolment rates in primary, secondary and tertiary institutions
in the four countries............................................................................. 18
Table 5: Education policies and their objectives targeting youth
in the EAC............................................................................................. 19
Table 6: Youth unemployment rates in the EAC............................................ 21
Table 7: Ranking EAC countries on economic competitiveness............... 22
Table 8: Employment and related policies and their objectives
targeting youth in the EAC............................................................... 22
Table 9: Selected current and projected urbanisation indicators
in the four countries..............................................................................24
Table 10: Results - Scenario modelling...........................................................27
Table 11: Key Characteristics of the Policy Scenarios
used in the modelling........................................................................36
List of Tables

East African Regional Analysis of Youth Demographics IX
AFIDEP African Institute for Development Policy
AU African Union
AUC African Union Commission
CPR Contraceptive Prevalence Rate
CSOs Civil Society Organisations
DD Demographic Dividend
DFID UK Department for International Development
DHS Demographic and Health Survey
EAC East African Community
EARF East Africa Research Fund
ECE Early Childhood Education
FDI Foreign Direct Investment
FP Family Planning
GAF Gender Analysis Framework
GCI Global Competitiveness Index
GDP Gross Domestic Product
HDI Human Development Index
HIV/AIDS Human Immuno-deficiency Virus /Acquired Immuno-deficiency Syndrome
HPP Health Policy Project
ICT Information and Communication Technology
ILFS Integrated Labour Force Survey
ILO International Labour Organisation
IMR Infant Mortality Rate
JAB Joint Admissions Board
LSMS Living Standards and Measurement Survey
mCPR Modern Contraceptive Prevalence Rate
MDG Millennium Development Goals
MICS Multiple Indicator Cluster Surveys
MMR Maternal Mortality Ratio
NAYS National Adolescents and Youth Survey
NBS National Bureau of Statistics
Abbreviations

East African Regional Analysis of Youth Demographics X
NCDs Non-Communicable Diseases
NEET Not in Education, Employment or Training
NER Net Enrolment Rate
NGOs Non-governmental Organisations
NTA National Transfer Accounts
NYS National Youth Service
ReAYD Regional Analysis of Youth Demographics
SDG Sustainable development Goals
SRH Sexual and Reproductive Health
SSA Sub-Saharan Africa
SWTS School to Work Transition Survey
TFR Total Fertility Rate
TVET Technical and Vocational Education and Training
U5MR Under-Five Mortality Rate
UBEP Undugu Basic Education Programme
UK United Kingdom
UN United Nations
UNDP United Nations Development Programme
UNFPA United Nations Population Fund
USAID United States Agency for International Development
WEF World Economic Forum
WHO World Health Organization
YTCs Youth Training Centres

East African Regional Analysis of Youth Demographics XI
According to the United Nations (UN) projections, the world’s population
will reach 10 billion by 2055 and more than 95% of this growth will
happen in low and middle - income countries. Of the 2.45 billion people
expected to be added to the global population between 2017 and
2055, more than 1.4 billion (57%) will be added in Africa. Decades of
very high fertility in Africa, coupled with rapidly declining child mortality
have created a population age-structure dominated by young people
under the age of 25. The demographics of the East African Community
(EAC), particularly those of Kenya, Rwanda, Tanzania and Uganda,
mirror those of Africa. Around 20% of the 127 million people in these four
countries are between the ages of 15 and 24, and can be labelled as
“youth” according to the United Nations definition. In the last population
and housing censuses in the four countries conducted between 2009
and 2014, about 40% of the Rwandese population were children below
the age of 15, and the corresponding percentages were 43% in Kenya,
45% in Tanzania, and 52% in Uganda. Such youthful population, if
healthy, skilled, and gainfully employed, can be a catalyst for accelerated
social and economic development. When the ratio of the working-age
population to dependents increases, a window of opportunity opens for
accelerated economic growth, a phenomenon called the demographic
dividend (DD).
Economists have estimated that the demographic dividend contributed
25-33% to the Asian Tigers’ economic growth in the 1980s. However,
the demographic dividend is not automatic. Firstly, a slow pace of fertility
decline is insufficient to open the window of opportunity to capture the
demographic dividend since the ratio of the working-age population to
young dependents will continue to be unfavourable. Secondly, even with
rapid declines in fertility and child mortality, countries can squander the
opportunity if they do not invest in human capital and create an enabling
environment for savings, investments, and creation of jobs. For example,
some economists have claimed that the demographic bonus has been
squandered by Tunisia and South Africa since their windows of opportunity
are about to close. Critically, there should be equitable access to jobs for
young people that is devoid of any form of discrimination or favouritism.
Rather than the youth becoming catalysts for transformational development,
there is the real risk that, due to lack of strategic and timely action to
invest in them in the EAC in particular and Africa in general, this youthful
population may become a major burden or even a threat to the continent’s
security and economic development, with spill-over effects for the rest of
the world.
This report summarises the findings of research on the socioeconomic
implications of youth demographics in four East African Community (EAC)
countries namely: Kenya, Rwanda, Tanzania, and Uganda. For the study,
we used systematic mapping approaches to conduct a review of existing
literature and data sources, and to develop a conceptual framework of
the pathways through which youth demographics affect access to and
demand for basic and critical services including schooling, housing, health
care, and jobs. In addition, we employed modelling techniques including
cohort component population projections and the DemDiv model
(developed by the United States Agency for International Development-
funded Health Policy Project implemented by Futures Group) to show,
under different scenarios, the short, medium, and long-term implications
of youth population dynamics on the countries’ socioeconomic status up
to 2050. Finally, we developed recommendations which bring together
evidence from the literature, data review, and the scenario modelling to
highlight the policy and implementation implications for each of the four
countries and for the region, to benefit from the youth bulge.
Future Youth Demographics in EAC Countries
The results from the cohort component population projections show that
in all the four countries, as indeed is the case for most African countries,
there will be a significant increase in the total population for the next
30-50 years, irrespective of what population and social development
policies the countries adopt. This is because the decades of high fertility
have created a high population momentum, implying that even if total
fertility reached replacement level (2.1 children per woman) in the next
few years, there will still be large numbers of women added to the pool
of reproductive women every year. Childbearing among these women
will add to the population size for several decades. However, the pace
of growth and the level at which the population will be stable can be
influenced by policies that countries make today. Under the UN Medium
Variant scenarioi, Rwanda’s youth population (age 15-34) will increase
from 4.2 million in 2015 to 7.1 million in 2050 and 7.7 million by 2065;
in Kenya, the numbers will increase from 17 million in 2015 to 24 million
and 35 million in 2050 and 2065 respectively; in Tanzania, the change
will be from 17.9 million in 2015 to 47.4 million by 2050 and to 62.3
million by 2065; while for Uganda the youth population will increase
from 23 million in 2015 to 38 million and 48 million by 2050 and 2065
respectively. Under the Accelerated Modelii, the corresponding growth
of youth population by 2065 will be 7.2 million in Rwanda, 30 million
in Kenya, 48 million in Tanzania, and 42 million in Uganda. It should be
noted that except for Rwanda, none of the other EAC countries will reach
replacement level fertility by 2065 under the Medium Variant Scenario.
Under the Accelerated Model, the most realistic scenario is that Rwanda
and Kenya will reach replacement level fertility by 2065, but Uganda
and Tanzania will have higher fertility. The consequences of the growth
in population size and high dependency ratio will be pressure on basic
services such as primary and secondary school places, health care,
housing and infrastructure. Rapid population growth will also put pressure
on land, water, and other natural resources and this could contribute to
food insecurity and resource-based conflicts.
Demand for quality education and skills development: Between 2015 and 2065, the secondary school age population in
Tanzania will more than double from 4.8 to 14.2 million under the Medium
Variant or to 9.7 million under the Accelerated Model. In Uganda, the
secondary school age population will increase from 5.8 to 16.2 million
under the Medium Variant or to 13.4 million under Accelerated Model.
On the other hand, because of significant drops in fertility in Kenya and
Executive Summary
iThe UN Medium Variant Scenario assumes that increases in contraceptive use and education will result in lower fertility in patterns similar to the experience of other countries that have gone through the demographic transition.
iiThe Accelerated Model assumes that countries intensify efforts to lower fertility significantly by 2065 including significantly reducing early childbearing, unmet need for modern contraception, and child mortality.

East African Regional Analysis of Youth Demographics XII
Rwanda, there will be declines in the school-age population by 2050 in
both countries. All of the EAC countries will need to significantly invest in
increasing the number of places for primary and secondary schools while
at the same time improving the quality of education and skills training.
Demand for modern methods of contraception: Using
the UN Medium Variant population projections, we estimated the total
demand for contraception among sexually active female youth (married
and unmarried) in the four EAC countries. The results indicate that the
demand for contraception among female youth will increase significantly.
For example, in Rwanda, among the female youth 15-19 years, the
demand for contraception will grow more than 8-fold by 2065, from
35,000 women in 2015 to over 331,000. In Uganda, among young
females aged 30-34, the demand will rise almost four times from 805,000
women in 2015 to 3.9 million by 2065.
Employment and “NEETs”: Unemployment among youth is a
widespread problem in Africa and EAC is no exception. For example, in
Uganda, youth unemployment is around 21% among women and 11%
among men, while in Tanzania, roughly 14% of those 15-24 years old are
unemployed, with females having 1.5 times higher unemployment rates
than males. Furthermore, many are in vulnerable employment, thus they are
unlikely to have access to benefits or social protection programmes. The
share of young people who are not in education, employment or training
(NEET) provides a broad measure of the untapped potential of young
people who could contribute to national development through work. The
International Labour Organisation (ILO) argues that this group deserves
attention since the youth are neither improving their future employability
through investments in skills nor gaining experience through employment.
If the levels of employment, school enrolment, and training remain the
same, the projected number of NEETS in the four East African countries will
increase from 9.8 million to nearly 23 million by 2050 (Kenya, from 4.9
to 9.1 million; Tanzania,3.1 to 9.2; Uganda, 1.5 to 4 million; and Rwanda
310,000 -532,000).
Modelling the Potential Impact of the Demographic Dividend in EAC
The DemDiv modelling tool was used in the four EAC countries to estimate
the impact on development indicators of adopting different investment
scenarios as follow:
i) Business as Usual: Characterised by maintaining the status quo across all sectors.
ii) Economic Emphasis: Economic reforms to enhance productive
efficiency and accelerate economic growth, job creation, and poverty
reduction.
iii) Social Emphasis: Combining economic reforms as in (ii) above and
investing in education to achieve universal secondary education and at
least two years post-secondary education.
iv) Combined Emphasis: Concurrently emphasising economic reforms
and education and prioritising family planning to achieve contraceptive
prevalence rate of at least 64% by 2050-55.
The results show that under the “Business as Usual” Scenario, rapid
population growth will continue to put serious pressure on development
and a youth bulge will not be achieved over the next few decades. Under
this scenario, human development will remain low and the countries will
remain stuck at low-income levels (see Figure i).
$4,595
$3,457
$3,878
$3,483
$896
$2,264
$2,063
$927
$0 $500 $1,000 $1,500 $2,000 $2,500 $3,000 $3,500 $4,000 $4,500 $5,000
Kenya
Rwanda
Tanzania
Uganda
Business-as-usual
Demographic dividend. (difference in per capita GDP between the Combined scenario and Economic emphasis only)
Figure i: Demographic Dividend versus Status Quo by 2050

East African Regional Analysis of Youth Demographics XIII
On the other hand, under the Combined Investment Scenario, the four
countries could quickly witness a change in their age structures to have
a youth bulge and subsequent working-age bulge that would reduce
young age dependency and allow them to maximise the benefits of
the demographic dividend. The four countries could harness sizeable
demographic dividends if they invested in: comprehensive sexuality
education and providing universal access to contraception and
healthcare; access to basic quality education for all and significantly
improved access to tertiary training and skills development; economic
reforms that spur entrepreneurship and job creation, with equitable access
to available jobs; and strengthening the rule of law, good governance and
accountability.
Policy responses and recommendations
This report provides two sets of recommendations: to the governments
of the EAC countries, and to DFID and other development partners
and are in line with the African Union’s roadmap for harnessing the
demographic dividend which has identified four pillars: employment and
entrepreneurship; education and skills development; health and wellbeing;
and rights, governance, and youth empowerment.
Recommendations for priority investments by governments of EAC countries
Family planning and health
i. Child survival programmes such as immunisation programmes
and efforts to eradicate malaria, to improve human capital and to
accelerate fertility decline.
ii. Universal access to contraception to address the high unmet need,
especially among those living in rural areas, urban slums, and
among the youth.
iii. Prevention of new HIV infections among youth and treatment of
those who are infected to improve human capital.
iv. Good nutrition and promoting active life-styles to prevent
overweight/obesity epidemic among youth.
Education and skills development
i. Invest in school-construction projects to match the growth in
population.
ii. Put in place measures to evaluate and improve learning outcomes
aimed attaining quality education and training.
iii. Increase female participation in secondary and tertiary education.
iv. Involve employers in curriculum reforms for tertiary and Technical
and Vocational Education and Training (TVET) institutions to ensure
that appropriate transferable skills form part of the training.
Economic reforms that promote job creation
i. Create an enabling environment for the creation of jobs, youth
entrepreneurship, and encourage savings for pensions.
ii. Promote innovation hubs and facilitate the financial inclusion of
youth to stem unemployment in the EAC.
iii. Provide decent livelihood opportunities to prevent crime and
insecurity among the youth and discourage the brain drain of young
people moving to other countries in search of jobs.
iv. Develop agribusiness and encourage greater youth participation in
the sector.
v. Eliminate any form of discrimination in access to available jobs,
particularly in the formal sector to promote equity.
Women’s and girls’ empowerment
i. Empower girls to participate in secondary and tertiary education
and in science, technology, and mathematics.
ii. Outlaw practices that affect women’s empowerment such as child
marriages and gender-based violence and ensure these are
enforced.
Environment and climate
i. Work with youth to raise awareness of environmental issues and
good stewardship of natural resources.
ii. Urban planning should take into consideration both natural growth
and rural-to-urban migration. Rural development schemes that offer
attractive livelihood opportunities for youth can help to manage
rapid urbanisation.
Governance and accountability
i. Improve governance and accountability to improve security and
shared prosperity.
ii. Include youth in decision-making spaces especially on matters that
affect them.
Recommendations to DFID and Development partners
To support countries in the region to benefit from the demographic
dividend, strategic technical and financial support from development
partners should focus on the following areas:
i. In-depth policy prioritisation analysis: Development partners should
provide the technical support for in-depth prioritisation analysis
of population and development policies. In particular there is
need to provide such guidance at sub-national level as significant
differences on population and development outcomes exist across
regions and within countries.
ii. Systems thinking and integrated planning capacity: Supporting
capacity development for planning officials and programme
designers on systems thinking and integrated planning. Systems
thinking is an approach to problem solving that views “problems” as
part of a wider dynamic system. It demands deeper understanding
of linkages, relationships, interactions and behaviours among the
elements that characterise the entire system.

East African Regional Analysis of Youth Demographics XIV
iii. Cost-benefit analysis: Provide technical expertise and support
for cost-benefit analyses of interventions aimed at harnessing the
demographic dividend.
iv. Sustainable funding for demographic dividend interventions:
The Combined Emphasis Scenario which provides the best
options for harnessing a sizeable demographic divided can be
a daunting undertaking given the multiple linkages across social
and economic development sectors. Development partners should
support innovative funding aimed at providing sustainable funds for
interventions to harness the demographic dividend.
v. Coordination and accountability systems: Provide support for
the development/enhancement and implementation of strong
coordination and accountability systems for population and
development. Examples include the creation of strong national
councils for population or councils for population and development
to coordinate the implementation of programmes on population and
development-- including universal access to effective contraception.
vi. Role of the private sector and other stakeholders: Engage the private
sector, civil society and other critical ministries like education, youth,
labour, and industrial development in the agenda to harness the
demographic dividend and integrate population dynamics in their
existing policies and planning.

East African Regional Analysis of Youth Demographics 1
1

East African Regional Analysis of Youth Demographics 2
The African Institute for Development Policy (AFIDEP), in partnership
with the University of Southampton and local collaborators, conducted
a desk-based analysis project in 2017 titled “Regional Analysis of
Youth Demographics” (ReAYD) which was funded by the East African
Research Fund of the United Kingdom (UK) Department for International
Development (DFID). The main purpose of the project was to understand
the implications of the present and future changes to the demography
of youth (15-24 years) in the East Africa Community (EAC) on basic
services, labour force, and socio-economic development. The East African
Community is a regional inter-governmental partnership between five
countries (Burundi, Kenya, Rwanda, Uganda, and the United Republic
of Tanzania). It was originally conceived in 1967 by three founder states
(Kenya, Uganda, and Tanzania), and formally established in 2000
by a treaty. The pillars of integration, which are at various stages of
implementation, include a customs union, common market, monetary union,
and ultimately political federation.
The Terms of Reference of the ReAYD project specified that the project
should focus on four EAC countries: Kenya, Rwanda, Tanzania and
Uganda. The project was implemented through the following work
packages (WP):
WP 1: Systematic mapping of existing literature to develop a conceptual
framework of the pathways through which youth demographics affect
access to and demand for basic and critical services including schooling,
housing, healthcare, and jobs;
WP 2: Scenario modelling using secondary data sources to show, under
different scenarios, the short, medium, and long-term implications of youth
population dynamics on the countries’ economic development;
WP 3: Developing recommendations which bring together evidence
from the literature and scenario modelling to highlight the policy and
implementation implications of youth demographics for each of the four
countries and for the region;
WP 4: Use data visualisation to communicate the findings to policymakers
and youth in the region including web-accessible interactive maps,
infographics, and videos.
The detailed methodology applied in this study are provided in Appendix
1 and Appendix 2.
Introduction

East African Regional Analysis of Youth Demographics 3
2

East African Regional Analysis of Youth Demographics 4
According to population projections by the United Nations (UN), the
world will reach 10 billion people by 2055 and more than 95% of this
growth will happen in low and middle-income countries.1 Of the 2.45
billion people expected to be added to the global population by 2055,
more than 1.4 billion (57%) will be added in Africa and by 2063,
there will be more than 3.2 billion people living in Africa (see Figure 1).
Decades of very high fertility in Africa, coupled with rapidly declining child
mortality, have led to high population growth rates (currently averaging
2.5% per annum). As a result, the age-structure of many African countries
has a high percentage of people under the age of 25 (average of 60% in
2015, compared with 41% globally).1 Such youthful population, if healthy,
skilled, and gainfully employed can be a catalyst for accelerated social
and economic development. When fertility and childhood mortality fall
sharply so that the ratio of dependents to economically active people
decreases, a window of opportunity opens for accelerated economic
growth, a phenomenon called the demographic dividend. In theory,
countries benefit since resources that would have been used for building
extra schools, hospitals and other services can be invested in human
capital to increase productivity or saved, while productive adults facilitate
increased Gross Domestic Product (GDP).
Rationale and Problem Statement
A youth bulge is a temporary demographic phenomenon which occurs when child mortality declines and fertility falls rapidly so that the previous cohort of births is larger than subsequent cohorts. As the large cohorts of births move into the working ages (15-64 years), we get a bulge in the population pyramid.
The Youth Bulge and the Demographic Dividend
If the youth are skilled and productively employed, the youth bulge can lead to the demographic dividend, a temporary economic benefit which can span five or more decades. The benefits of the demographic dividend include:
• Higher consumption per capita.
• Increase in savings.
• More resources for infrastructure and increase in productivity.
• Potential for a second, larger demographic dividend.
The first demographic dividend eventually wanes because falling birth rates mean that there is a reduction in the number of people joining the labour force. Also, higher living standards can lead to longer life expectancy and an ageing population which increases old-age dependency.
As the first demographic dividend is waning, a second demographic dividend, potentially larger and lasting longer, can happen if appropriate actions and policies are in place to encourage savings and asset accumulation for older ages and investing in higher labour productivity.
The second demographic dividend can lead to a permanent increase in living standards.
There are a number of caveats.
a) A youth bulge requires both child mortality and fertility to decline sharply. A fall in child mortality alone is not sufficient to achieve a youth bulge.
• If fertility remains high, subsequent cohorts will continue to grow and the ratio of young dependents to working ages will continue to be unfavourable.
• The slow decline in fertility maintains high young-age dependency age structures whose effect on economic growth is modest or negative.
• Sustained fall in fertility to replacement level fertility (2.1) is the best option for maximising the benefits of the demographic dividend.
b) Converting the youth bulge into a demographic dividend is not automatic. A country can “squander away” this opportunity if:
• Youth are under-educated or unskilled leading to low productivity.
• There is high youth unemployment or under-employment.
• Youth who are not economically productive become disenchanted and cause civil unrest.

East African Regional Analysis of Youth Demographics 5
Figure 2 is a simplified diagram demonstrating the potential relationship
between population dynamics and economic development. The
first demographic dividend can last up to 50 years. If during the first
demographic dividend people are encouraged to invest or save for older
ages, a second demographic dividend, which is longer and more durable,
can occur. Economists have estimated that the demographic dividend
contributed 25-33% to the economies of South-East Asian countries (South
Korea, Taiwan, Singapore) in the 1980s.2, 3
Over the past five years, the African Union (AU) and multilateral agencies
have led the agenda on harnessing the demographic dividend in Africa.
This agenda has brought some optimism among many African leaders
and led to demands for national analyses on the prospects of harnessing
the demographic dividend. However, there is lack of understanding on
what investments to make and what policies are needed to move from
this optimism to action. For example, the necessity of significantly investing
in family planning to accelerate fertility decline as a pre-condition for
harnessing a sizeable demographic dividend is being underplayed both
at the AU level and in most countries. Secondly, even though the four
EAC countries have youth policies, these show lack of awareness of the
short and long-term implications of the youth demographics on basic
and critical services. Instead of reaping a demographic dividend, African
countries may find that the youthful population is a bane especially if they
adopt “business-as-usual” actions. In the less benign situation, the window
of opportunity may pass by without countries realising the economic
benefit from the demographic age-structure as is the case of South Africa
and Tunisia.4, 5 In the worst-case scenario, the large youthful population
could translate into an army of discontented unemployed youth who might
Figure 1: Africa’s share of the world population, 2015-2063. UN Medium Variant Scenario, 2017 Revision and share of Gross Domestic Product in 2015

East African Regional Analysis of Youth Demographics 6
Figure 2: Simplified Conceptual Framework: Youth Bulge and the Demographic Dividend
increase social risks and tensions.6 Other consequences of this worst-case
scenario include effects on the environment, unplanned urbanisation, and
poverty (see Figure 2). Each of the EAC countries must today confront two
major challenges: (1) Address the doubling or even tripling by 2050 of
their working-age population; and (2) Better prepare for the future of their
upcoming young generations.

East African Regional Analysis of Youth Demographics 7
3

East African Regional Analysis of Youth Demographics 8
The demographic characteristics of the four countries are shown in Table 1.
Roughly, the four countries make up over 10% of the continent’s population.
Approximately 20% of the population of these countries (i.e. about 25.5
million) are youth aged 15-24, the official United Nations definition of
youth. This definition varies: the EAC uses 15-34 years; Rwanda uses 16-
30 years; Tanzania 15-35 years; Kenya uses 18-34 years; and Uganda
uses 15-30 years. In the report, we use the UN and EAC age-ranges so
that data are comparable with other youth studies.
The average number of children that an East African woman can expect to
have during her lifetime (total fertility rate [TFR]) ranges from 3.9 in Kenya
to 5.4 in Uganda (see Table 1) compared with averages of 4.4 for Africa
and between 1.6 and 2.3 for the rest of the world. Although fertility rates
are still high in EAC, there has been some decline since 1990. Between
1990 and 2015, TFRs declined by 45% in Kenya; 33% in Rwanda; 27% in
Uganda; and 13% in Tanzania. Much of the decline in fertility is attributed
to the significant increase in the use of modern contraceptives by married
women, which was made possible through public family planning
programmes. Modern contraceptive prevalence rate (mCPR), which is
the percentage of married women who are using modern contraception,
is highest in Kenya and there have been large increases in all the four
countries.
Currently, the population age-structures of the four countries are typical
of most African countries, with a large base of young people (see Figure
3). In comparison, the population pyramids of Malaysia and South Korea
show that the two countries are well advanced in their demographic
transitions, reflecting a much more favourable ratio of working-age
population to dependents. These two countries had the same population
pyramids and roughly similar total fertility rates as the EAC countries in the
1960s. While Malaysia’s and South Korea’s total fertility rates dropped
from about six children in 1960 to below two children in 2015, fertility rates
for the EAC countries during this period only dropped by about one to two
children.
Demography of the Four EAC Countries
This section looks at the population characteristics of the four countries. It first outlines the demographic profiles, comparing the population age structures with other Asian countries that have benefited from the demographic dividend. The projected population growth in different regions of the world is presented next, followed by the concept of the youth bulge and how it is created. Finally, we present the policy options that have been shown to increase the magnitude of the demographic dividend earned in countries that have gone through the demographic transition.
Table 1: Demographic profiles of EAC countries
Sources: (a) National Population and Housing Census projection Reports (Kenya, 2012), Rwanda (2014), Tanzania (2015), Uganda (2016); (b) United Nations, 2017 Revision, World Population Prospects; (c) Demographic and Health Surveys/ Multiple Indicator Surveys.
Country Totalpopulationin millions(2015)a
Youth,15-24 years
as a %of total
population(2015)
Children,0 -14 years
as a % of total
population (2015)
Total fertility rate Percentage of married women (15-49 years) using modern contraceptives
Under-five mortality- deaths/1000 live
births
Early 1990sc
2014-16c Early 1990s
2014-16 Early 1990s
2014-16
Kenya 44.2 20% 42% 6.7 3.9 27 53 90 52
Rwanda 11.3 20% 40% 6.2 4.2 13 48 151 50
Tanzania 53.9 19% 45% 6.2 5.2 7 32 141 67
Uganda 35.5 21% 47% 7.4 5.4 3 35 177 64
Africa 1256b 19% 41% 5.7 4.4 10 33 167 75
3.1. Demographic Profiles

East African Regional Analysis of Youth Demographics 9
The population pyramids capture the total population of a country by 5-year age groups (y-axis). The pyramid depicts the percentage contribution of each five-year age group to the total population (x-axis).
Figure 3: Population pyramids of Kenya, Rwanda, Tanzania, and Uganda compared with Malaysia and South Korea, 2015
KENYA, 2015
Male Female
RWANDA, 2015
Male Female
UGANDA, 2015
Male Female
SOUTH KOREA, 2015
Male Female
TANZANIA, 2015
Male Female
MALAYSIA, 2015
Male Female
10 8 6 4 2 0 2 4 6 8 10
0-4 yrs.
5-9 yrs.
10-14 yrs.
15-19 yrs.
20-24 yrs
25-29 yrs
30-34 yrs.
35-39 yrs.
40-44 yrs.
45-49 yrs.
50-54 yrs.
55-59 yrs.
60-64 yrs.
65-69 yrs.
70-74 yrs.
75-79 yrs.
80-84 yrs.
85-89 yrs.
90-94 yrs.
95-99 yrs.
100+ yrs.
PERCENT
AGE
10 8 6 4 2 0 2 4 6 8 10
0-4 yrs.
5-9 yrs.
10-14 yrs.
15-19 yrs.
20-24 yrs
25-29 yrs
30-34 yrs.
35-39 yrs.
40-44 yrs.
45-49 yrs.
50-54 yrs.
55-59 yrs.
60-64 yrs.
65-69 yrs.
70-74 yrs.
75-79 yrs.
80-84 yrs.
85-89 yrs.
90-94 yrs.
95-99 yrs.
100+ yrs.
PERCENT
AGE
10 8 6 4 2 0 2 4 6 8 10
0-4 yrs.
5-9 yrs.
10-14 yrs.
15-19 yrs.
20-24 yrs
25-29 yrs
30-34 yrs.
35-39 yrs.
40-44 yrs.
45-49 yrs.
50-54 yrs.
55-59 yrs.
60-64 yrs.
65-69 yrs.
70-74 yrs.
75-79 yrs.
80-84 yrs.
85-89 yrs.
90-94 yrs.
95-99 yrs.
100+ yrs.
PERCENT
AGE
10 8 6 4 2 0 2 4 6 8 10
0-4 yrs.
5-9 yrs.
10-14 yrs.
15-19 yrs.
20-24 yrs
25-29 yrs
30-34 yrs.
35-39 yrs.
40-44 yrs.
45-49 yrs.
50-54 yrs.
55-59 yrs.
60-64 yrs.
65-69 yrs.
70-74 yrs.
75-79 yrs.
80-84 yrs.
85-89 yrs.
90-94 yrs.
95-99 yrs.
100+ yrs.
PERCENT
AGE
10 8 6 4 2 0 2 4 6 8 10
0-4 yrs.
5-9 yrs.
10-14 yrs.
15-19 yrs.
20-24 yrs
25-29 yrs
30-34 yrs.
35-39 yrs.
40-44 yrs.
45-49 yrs.
50-54 yrs.
55-59 yrs.
60-64 yrs.
65-69 yrs.
70-74 yrs.
75-79 yrs.
80-84 yrs.
85-89 yrs.
90-94 yrs.
95-99 yrs.
100+ yrs.
PERCENT
AGE
10 8 6 4 2 0 2 4 6 8 10
0-4 yrs.
5-9 yrs.
10-14 yrs.
15-19 yrs.
20-24 yrs
25-29 yrs
30-34 yrs.
35-39 yrs.
40-44 yrs.
45-49 yrs.
50-54 yrs.
55-59 yrs.
60-64 yrs.
65-69 yrs.
70-74 yrs.
75-79 yrs.
80-84 yrs.
85-89 yrs.
90-94 yrs.
95-99 yrs.
100+ yrs.
PERCENT
AGE

East African Regional Analysis of Youth Demographics 10
3.2. Pathways to a youth bulge
Except for Africa, the youth population in the rest of the regions of the
world will be declining by 2100, all things being equal (see Figure 4). In
fact, the youth population has started declining already in Europe and Latin
America and the Caribbean such that the populations of these regions are
ageing. The economic impact of an ageing population can potentially
be negative if there are insufficient investments and savings to support
pensions and other social safety nets for older people.
The transition to lower fertility in Africa is happening at a slower pace
than the experience of the other regions of the world. Only Mauritius,
Seychelles and Réunion in Africa have fertility below the world average of
2.6 children per woman.
Figure 5 summaries the pathways to a youth bulge focusing on
key determinants to fertility reduction. Low levels of socioeconomic
development, low female education and early marriage, high child
mortality and weak family planning programmes are the factors that have
traditionally kept fertility high in Africa7. Earlier studies and recent reviews
show that in general, fertility rate declines with the increased level of social
and economic development.8-10This is driven by changing norms and
perspective on the importance of many children. In agrarian societies,
many children are preferred as a source of labour, with minimal cost on
human development. However, as societies move away from agriculture
to industrialised societies due to economic improvement, the need for
large families dissipates, and the cost of investment in human capital
development (including education and skills development) increases,
thus changing the perspectives on family size norms. A growing stream
of evidence also shows that factors that improve the socio-economic
wellbeing of women, including education and labour force participation,
have been shown to contribute to lower child mortality and fertility rate.11-13
When child mortality is high, couples adopt “insurance” or “replacement”
strategies to compensate for child losses. When child mortality rates start
falling, couples adjust their fertility downwards.14,15
With increases in female education and mCPR, fertility has started falling in
Africa, but at the same time, couples are abandoning traditional practices
such as long periods of postpartum abstinence and breastfeeding which
have depressing effects on fertility.16-18
-
200,000
400,000
600,000
800,000
1,000,000
1,200,000
1,400,000
2017 2020 2023 2026 2029 2032 2035 2038 2041 2044 2047 2050
Popu
latio
n in
thou
sand
s
Africa Asia Latin America & the Caribbean Rest of the world
Figure 4: Growth of global youth population (15-24 years), by regions of the world. UN Medium Variant scenario, 2017 Revision
Indicator2015 (or latest available year )
Kenya Rwanda Tanzania Uganda Malaysia S. Korea
Per Capita GDP ($) 1350 721 872 674 10,829 27,108
Total Fertility Rate 3.9 4.2 5.4 5.4 1.98 1.3
Under five mortality (deaths/1000 births) 52 50 67 64 5 4
Net Secondary School Enrolment Rate (%) 44 23 (2013) 24.7 24 68.8 96.6
Gross Tertiary Enrolment Rate (%) 5 7.5 (2013) 5.2 5.4 37 93.2
Sources: World Bank WDI; UN World Population Prospects, The 2017 Revision; Demographic and Health Surveys/ Multiple Indicator Surveys.
Table 2: Comparison of select socio-economic and demographic indicators for EAC countries, Malaysia and South Korea

East African Regional Analysis of Youth Demographics 11
Figure 5: Pathways to the youth bulge in East Africa
The impact of urbanisation on changes in fertility is thought to operate
through changes in female education and empowerment, marriage
patterns and fertility desires, and uptake of contraceptive use. Rural-
urban differences in fertility rates exist in most African countries and
the challenges in tackling high rural fertility remain invariably the same
across Africa: poor access to family planning services; lack of progress
in educational attainment, lack of basic infrastructure and poor road
networks and transport systems, and the vicious cycle of poverty. The future
of fertility transition in most parts of Africa inevitably requires concerted
efforts and programme interventions to reduce fertility in rural and remote
regions.16 For instance, the use of the community-based distribution of
contraceptives in the difficult to reach areas in Ethiopia, Rwanda and
Malawi is credited for the observed rapid increase in contraceptive
uptake and subsequent fertility decline in these countries.19, 20
The role of female education in reducing fertility is thought to operate
through a number of pathways including, delayed entry into marriage,
participation in wage employment which lowers desired fertility size,
confidence to use modern health services and contraception, and
empowerment which increases women’s autonomy and decision-making
within a household or a community (see Figure 6).21 Evidence from 22
countries in Sub-Saharan Africa (SSA) shows that increasing women’s
education across different socio-economic groups is very effective in
reducing overall fertility levels.22
However, a few years of schooling are not sufficient for meaningful fertility
reduction. For the most recent Demographic and Health Surveys (DHS)
conducted in SSA between 2000 and 2016, the results show that primary
education is associated with only 7.3% lower fertility when compared with
women with no education. Secondary and tertiary education, on the other
hand, are associated with 35.3% and 54.2% lower fertility respectively
than that of women with no education. The variation in relative differences
in fertility rates by education for SSA as a whole and across different
countries is illustrated in Appendix 3 (authors own analyses). In Rwanda,
increase in educational attainment during the last decade explained much
of the fertility decline, along with significant increase in contraceptive use,
improvement in living conditions and progressive shifts towards non-
agricultural employment.23, 24
In summary, exposure to modern school-based education has overriding
strong independent effect on uptake of modern contraception and
reducing fertility when controlled for other factors such as residence,
income and religion.25
Wealth status has a similar effect on fertility to female education. Our
analyses using DHS data from SSA show that fertility among women in
the poorest wealth quintile is twice as high as women in the wealthiest
quintile (Appendix 3). A larger proportion of the poorest women do not
use contraception even when they want to avoid additional childbearing
because family planning services are too far, they are afraid of side effects
of contraceptives, or their preferred method is out-of-stock7. The benefits
of effective contraceptive use go beyond fertility reduction. Modern
contraception is estimated to successfully avert 33% of all maternal deaths
in Africa annually.26
The timing of when a country attains a youth bulge depends on the pace
of fertility decline and improvements in child survival. The conversion of a
youth bulge to a demographic dividend is not automatic since countries
can squander this opportunity if the youth are uneducated and do not
have equitable access to decent jobs.4 The creation of jobs to meet the
demands of large youth populations requires both local and foreign
domestic investment, enabling environments for entrepreneurship, and
good governance and accountability.27 Governance and accountability
are particularly important in ensuring that youth have equitable access to
available jobs, particularly in the formal sector.

East African Regional Analysis of Youth Demographics 12
Debates at many population conferences indicate that experts are divided
on the actual timing when countries begin to reap the demographic
dividend with some arguing that even small declines in fertility have a
positive benefit, while others are more pessimistic. However, all agree
that the support ratio, which is a ratio of effective producers (workers) to
consumers (young and old dependents), needs to increase to achieve
a sizeable benefit in economic growth. Furthermore, economists who
have used the National Transfer Accounts (NTA) demographic dividend
modelling approach suggested that a one percentage point increase
in the support ratio leads to a one percentage point increase in the
standard of living in the population, all other things being equal.28 The
first demographic dividend is thought to be positive when the ratio of
producers to consumers is rising; as this ratio peaks, the dividend equals
zero; and as it begins to decline, the dividend becomes negative, implying
that the demographic change acts as a brake on economic growth rather
than an impetus for economic growth.4 Figure 6 illustrates estimates of
Senegal’s support ratio and first demographic dividend between 1950
and 2050.
The support ratio (red series) significantly decreased in the 1980s and
1990s when the child dependency burden in Senegal was at its highest
as a result of past high fertility. However, as child dependency begins to
decline slowly after the turn of the century to coincide with the drops in
fertility and mortality, the support ratio begins to increase rapidly and is
projected to continue doing so for several decades even as the rate of
change slows down after 2030. As a result of the positive increase in the
support ratio from the 1990s, this analysis demonstrates that in fact Senegal
has been benefitting from the first demographic dividend (rate of change
of the support ratio in the blue series) over the last two decades and the
opportunity to maximise the demographic dividend will peak between
2020 and 2030 before the rate of change slows down as the growth
of those in the working ages slows down. However, first demographic
dividend will still be positive at the end of the projection period in 2050.
The conversion of a youth bulge to a demographic dividend is not automatic since countries can squander this opportunity if the youth are uneducated and do not have equitable access to decent jobs
Figure 6: Estimated changes in Senegal’s Support Ratio and First Demographic Dividend, 1950-2050 (CREFAT, 2015)
-0.60
-0.40
-0.20
0.00
0.20
0.40
0.60
0.80
0.40
0.45
0.50
0.55
0.60
0.65
0.70
0.75
1950 1960 1970 1980 1990 2000 2010 2020 2030 2040 2050
Gro
wth
rate
of t
he su
ppor
t rat
io (%
)
Supp
ort R
atio
Year
Support Ratio
Growth rates of support ratio (first dividend)

East African Regional Analysis of Youth Demographics 13
3.3. Priority Policy Areas Necessary to Harness a Sizeable Demographic Dividend
Countries in the EAC do not currently have a youth bulge but there is a
window of opportunity if the EAC invests in universal access to family
planning and human capital development. Thus, for the EAC countries
to reap the demographic dividend, pre-requisite policy changes and
programme actions leading to significant investments and therefore
improvements in the following areas are required:
• Health and family planning.
• Education and skills development for all.
• Women’s empowerment.
• Job creation and equitable access to available jobs (focusing on
the youth).
• Good governance.
These policy priority areas are aligned to the AU roadmap (2017) on
harnessing the demographic dividend through investments in youth. It is
notable that the AU roadmap subsumes family planning within the health
pillar. However, the importance of achieving rapid fertility decline should
merit greater emphasis on family planning and advocacy for universal
access to modern contraception as a pathway to faster demographic
transition in the EAC.

East African Regional Analysis of Youth Demographics 14
4

East African Regional Analysis of Youth Demographics 15
4.1 Health Challenges for Youth
Youth in Africa face many daunting challenges to their health and
wellbeing including the burden of infectious diseases such as HIV/AIDS
and malaria, and non-communicable conditions including the impact of
childhood malnutrition, depression and preventable injuries and accidents.
As a result, it is not surprising that the continent has the highest death rate
among adolescents and youth (10-24 years old) (see Figure 7 from Patton
et al. 2016).29 Among adolescents aged 10-19, the mortality has been
increasing instead of decreasing. During the period 2011-2015, there were
6.4 adolescent deaths per 100 population in Africa compared 6.1 and
5.4 per 100 for the periods 2005-2010 and 2000-2005 respectively.30
In the EAC, HIV/AIDS, diarrhoeal diseases, malaria, lower respiratory
tract infections and tuberculosis are the main causes of death.31 Factors
contributing to poor health outcomes for youth in the EAC include: the
high cost of health services, lack of youth-friendly services, lack of relevant
health information and harmful cultural practices such as female genital
mutilation (FGM) and early marriages.
Among women aged 15-24, HIV infection ranges from 1.3% in Rwanda to
4.9% in Uganda, while among older female youth, 25-34 years, 4.2% in
Rwanda are infected, compared with 10% in Kenya and Uganda. Among
men, HIV prevalence for 15-24-year-olds is between 0.6% and 2%, while
among men 25-34 years, the prevalence is between 2% and 7%.
Another major challenge is early childbearing which has implications for
total achieved fertility, maternal mortality and morbidity, child survival,
and women’s empowerment. The age-specific fertility rates for the four
countries (Figure 8 overleaf) show that Rwandese youth (15-24 years)
have a lower fertility compared to the other three countries, but older
Rwandese women have a higher fertility than their Kenyan counterparts
so that the total fertility for Rwanda is higher than Kenya’s. Child marriages
contribute significantly to the high adolescent childbearing in the EAC. The
most recent DHS in the four countries show that among females aged 20-
24, 40% in Uganda, 31% in Tanzania, 23% in Kenya and 7% in Rwanda
were married by their 18th birthday.
Poor access to sexual and reproductive health services is another factor
which contributes to high adolescent fertility in EAC. Young people,
especially those who are not married, have a high unmet need for
contraception (see Figure 9 overleaf). (Women with unmet need are those
who are want to stop or delay childbearing but are not using any method
of contraception.) Even though all the four countries acknowledge this to
be a problem in their family planning or SRH policies, actual provision of
contraception among unmarried youth has been relatively unsuccessful
because of cultural and religious sensitivities and objections.
Other health challenges for the youth in EAC are the rising prevalence
of people who are overweight or obese, which may lead to increases
in non-communicable diseases such as hypertension and diabetes.32 For
Youth Challenges in the EACYouth in Rwanda, Tanzania, Kenya and Uganda face similar social and economic challenges: high birth rates, poverty, unemployment and underemployment and health problems. However, the patterns and severity of these challenges vary by country and sub-country. This section focuses on health, education, employment, and migration and urbanisation challenges facing the youth. Efforts have been made to identify existing policies as well as the policy gaps in each of the sectors discussed.
Figure 7: Deaths per 10,000 youth population (10-24 years) (see Patton et al. 2016)
45
305
109
169
101
187
80
0 50 100 150 200 250 300 350
High income countries
Africa
Americas
Eastern Mediterranean
Europe
South East Asia
Western Pacific

East African Regional Analysis of Youth Demographics 16
example, a recent analysis of national data across Africa show that 9% of
females aged 15-19 in Kenya and Tanzania were overweight, as were
11% and 12% of their counterparts in Rwanda and Uganda respectively.33
Based on the EAC Social Development Policy, drug and substance abuse
is also a major problem confronting the youth in the EAC. Studies show
that most drug abusers are deprived and poor, in and out-of-school
adolescents, street children, unemployed, and those in unstable families.34
The use of and trafficking in illicit drugs not only affects the welfare and
health of the users, but is also considered a waste of their productivity and
potential.
Policy responses to the health challenges
The governments of Kenya, Rwanda, Tanzania and Uganda and the EAC have recognised youth as a key sub-group with needs that require to be addressed in order for these countries to achieve sustainable and inclusive socio-economic development. To this end, these countries have all developed national youth policies aimed at addressing the needs of the youth (Rwanda 2015, Uganda 2016, Tanzania 2007 and Kenya 2016). There is also a raft of other policies with specific outcomes targeting the youth. Table 3 highlights health-related policies targeting the youth in the EAC.
Figure 8: Age-specific fertility rates for four EAC countries, DHS/MIS 2014-2016
0
50
100
150
200
250
300
15-19 20-24 25-29 30-34 35-39 40-44
Birth
s per
100
0 w
omen
Kenya Rwanda Tanzania Uganda
Figure 9: Unmet need for contraception among sexually active 15-24 year old women by marital status, DHS 2014-16
10
7
14
17
31
61
31
35
0
10
20
30
40
50
60
70
Kenya Rwanda Tanzania Uganda
Unmet (all women) Unmet need (sexually active, unmarried)

East African Regional Analysis of Youth Demographics 17
Table 3: Health policies and their objectives targeting youth in the EAC
Kenya Rwanda Tanzania Uganda
Adol
esce
nt SR
H Po
licy
Increase access to ASRH and drug and substance abuse information; Promote HIV testing and counselling; Reduce early and unintended pregnancies.
Expand access and utilisation of SRH products among adolescents; Integrate adolescent health services into the existing health care delivery system.
National Adolescent Health Strategy 2011-2015 advocates for adolescent and youth friendly SRH services.
Enhance opportunities for adolescents to access health services; Promote the concept of adolescent health among policy makers and leaders so as to increase resource commitment.
Repr
oduc
tive
Hea
lth Po
licy
Ensure youth have full access to SRH information and services that are youth friendly; Ensure integration of HIV/AIDS information into RH services.
Increase access and utilisation of ASRH services and information; Encourage adolescents to adopt positive behaviours in RH.
Tanzania One Plan 2 (2016 - 2020) aims at increasing outlets offering comprehensive SRH, life skills, information, education and counselling services and youth friendly services.
National Policy Guidelines and Service Standards for SRHR (2006) identifies adolescents as priority group for the provision of access to contraceptives.
HIV
& A
IDS
Polic
y
The National AIDS Control Council 2015 -2019 Strategic Plan aims to facilitate development and implementation of an operational plan for HIV prevention among adolescents and young women.
Provide access towards VCT and PMTCT; Support the launch of prevention programmes for the most vulnerable groups by promoting the EABC approach (Education, Abstinence, Be Faithful, and Condom use).
Incorporate SRH in the school curricula; Strengthen counselling services for drug users; Ensure youth are given correct information including HIV prevention strategies.
Promote HIV counselling and Testing; Ensure access to services for unaccompanied youth between the ages of 12 and 18 who seek AIDS-related services and encouraged them to be accompanied in future.
Popu
latio
n Po
licy
Promote provision of quality integrated youth friendly population education and RH services and advocate for Family Life Education for both in and out of school youth.
No population policy Promote public awareness of SRHR for adolescents, men and women, and expand quality RH services and counselling for adolescents.
Advocate for affordability, availability and accessibility of quality health services; Promote the strengthening of youth-friendly SRH services; Advocate for linking of RH and HIV/AIDS programmes.
Yout
h Po
licy
Enhance provision of youth-friendly health services by removing all legal, regulatory, structural, medical and attitudinal barriers; Improve access to VCT services for all youth.
Advocate for the provision of youth-friendly health services; Strengthen national capacities to eradicate demand, supply and trafficking of drugs; Advocate for community-based care and positive living for the youth infected with HIV/AIDS.
Advocate for the provision of youth-friendly health services; Strengthen national capacities to eradicate demand, supply and trafficking in drugs.
Advocate for the provision of youth-friendly health services by removing all legal, regulatory, structural, medical and attitudinal barriers; Development of a strict drug control policy.
4.2 Education
Developing high-quality education and training, particularly at secondary and higher levels, in addition to building skills in technical and vocational institutions are a priority in developing globally competitive human capital and thus attracting foreign direct investments that contribute to job creation for the youth. Consequently, education features as one of the main drivers of the development agenda in these EAC countries. For example, Uganda’s 2nd National Development Plan (NDP II), Rwanda’s Vision 2020, Kenya’s Vision 2030 and Tanzania’s Vision 2025, all prioritise
education as a key pillar for socio-economic development. Primary school net enrolment rates in 2016 in the four countries is almost universal (see Table 4) and gender parity has also been achieved at the primary school level. However, the enrolment rates at secondary school and tertiary level are not as impressive. Generally, girls lag behind when it comes to access to secondary and tertiary level education, compared to their male counterparts.
Despite the observed improvements in enrolment rates, major challenges persist in the education system which curtail the countries’ capacity to

East African Regional Analysis of Youth Demographics 18
educate and train a skilled and competitive workforce. The quality of education in the region is very low, characterised by a mismatch between the skills that graduates have to offer and the needs of the labour market, exacerbating the unemployment rates among young people, especially young women.35-37 There are very low completion rates at primary level, with an even lower percentage transitioning to secondary level. For example, in Tanzania, only 47.3% of those enrolled in class one reached class 7 in 2016, and only 70% of these transitioned to Form 1.38 This implies that a high number of pupils are lost from the education system, and partly explains why just about one third are enrolled in secondary schools.
A good number of children complete primary school without acquiring basic reading and numeracy skills. For example in 2013, only 63%, 50% and 40% of school children aged 10 -16 had acquired basic literacy and numeracy skills at grade 2 in Kenya, Tanzania and Uganda, respectively.39
In 2016, only 68% of the children who sat the final year exam in Tanzania - for both primary and lower secondary school - passed, with pass rates being lowest in mathematics and science-related subjects.38
The education curricula are being revised to ensure that they are tailored to the needs of the job market, which consequently would improve the employability prospects of graduates. For example, in 2014, Rwanda reviewed its secondary school curriculum to promote and accommodate skills development. Similarly, Uganda’s Ministry of Education and Sports has approved a curriculum for ICT training for Secondary Schools, which has been adopted by a few schools. These schools are supported under various programmes, including the School Net and ConnectEd projects. In Kenya, the education sector is in the process of being over-hauled with a new competency-based curriculum focused on skills building being implemented progressively from 2018. It is expected that Kenya’s new curriculum will better prepare the students for the job market, equipping them with relevant skills that are in line with demand in the labour market,
including 21st century skills.
Policy and programme responses to education challenges
The policy and programmatic responses to the challenges of education
include programmes to ensure that more girls from rural areas access
quality and practical education. For example, vocational training is offered
in Youth Training Centres (YTCs) in Rwanda. These centres cater for about
2,000 young people out of a total target population of approximately
1 million. Given that formal education delivery channels are unable to
reach all school-age children, Kenya’s policy for alternative provision of
basic education provides guidance on how to enhance alternative basic
education provisions for the youth and older populations using flexible
approaches to attain education for all. The Undugu Basic Education
Programme (UBEP) in Kenya, offers alternative education by providing
literacy and vocational skills to youths from slums and low-income families
not enrolled in formal schools. In all four countries there are also efforts
by the governments to formulate and implement policies that support the
education of people with disabilities including the youth.
There are efforts in the four countries to expand access to tertiary and
secondary education, especially for girls, so as to increase educational
attainment for all, while eliminating the existing gender gap. Tanzania’s
National Higher Education Policy, Kenya’s Policy Framework for Education
and Uganda’s National Strategy for Girls’ Education support measures on
affirmative action to increase women’s access to university education.40-42
Since 2001, the Joint Admissions Board (JAB) (now Kenya University and
Colleges Central Placement Services), the body that manages student
admissions to Kenyan public universities, lowered the university entry mark
for girls by one point. Equally, in Uganda, female university entrants are
awarded a bonus of 1.5 points on top of their individual examination
scores. The University of Dar es Salaam in Tanzania admits female
entrants with lower cut-off points (at 1.0 or 1.5 points) thus increasing the
number of females being admitted into university. The Government of
Rwanda provides financial assistance to the majority of full-time students
attending public institutions through a means-tested loan scheme, while
there are opportunities for subsidised support or loans provided by public
institutions like the Higher Education Loans Board in Kenya.
Table 5 highlights the objectives of education and related policies that
have a bearing on education and skills development for youth in the four
countries.
Sources: Population Reference Bureau -World Population Data (2017); Ministry of Education, 2016. Education and Sports Sector Fact Sheet 2002 – 2016. Republic of Uganda, Education Management Information System (EMIS) 2002-2016Ministry of Education. (2016). 2016 Education Statistics Yearbook. Ministry of Education, Republic of Rwanda. Kigali, Rwanda.Kenya National Bureau of Statistics, 2017. Economic Survey 2017; KNBS Kenya Integrated Household Budget Survey 2015/18. United Republic of Tanzania. (2017)., Pre-primary and Secondary Education Statistics in Brief, 2016. Dar es Salaam, Tanzania
Primary School Net enrolment ratio (circa 2016)
Secondary School Net Enrolment ratio (circa 2016)
Tertiary Education Gross Enrolment ratio (circa/2016)
Males Females Males Females Males Females
Kenya 81.7 83.0 35.4 39.8 5 3
Rwanda 97.3 98.0 35 38 9 7
Tanzania 92.1 93.2 34 31 5 2
Uganda 89.6 94.6 24 22 5 4
Table 4: Enrolment rates in primary, secondary and tertiary institutions in the four countries (%)

East African Regional Analysis of Youth Demographics 19
Kenya Rwanda Tanzania Uganda
Educ
atio
n Po
licy
Ensure access to secondary education for all children; Revise the curriculum and make ICT central to it; Ensure the re-entry of girls who drop out of school due to pregnancy and early marriage; Sensitise parents, stakeholders and communities to discard socio-cultural practices that prohibit effective participation of girls and boys in secondary school education, and enforce legislation against the violation of the children’s rights; Provide school-feeding in distressed areas; Increase number of mobile schools linked to mother schools and other social services; Provide education to out-of-school youth and adults through non-formal approaches.
Encourage continuing education and distance learning in all types of training (formal, non-formal and informal); Encourage greater parental participation in the efforts to educate their children; Establish a technical school in each province; Offer pedagogical training to students; Emphasise development of skills such as entrepreneurial skills at all levels of education.
Provide quality education through curriculum review; Promote vocational training and education; Re-introduce trade schools in the education system; Introduce and formalise establishment of polytechnics in the education system; Strengthen non-formal education and integrate it with formal education; Establish girl's secondary schools.
Revised Education Sector Strategic Plan 2017-2020 aims at increasing and improving equitable access to quality and relevant education; and increasing effectiveness and efficiency in delivery of education.
TVET
Polic
y
Develop a TVET training curriculum; Establish and equip TVET centres of specialisation with state of the art training facilities; Expand geographical provision of TVET centres at all levels; Ensure that vocational education is offered in schools; Reform apprenticeship system to allow TVET graduates to work and study; Integrate informal economy workers and provide them with skills.
Enhance the status and attractiveness of TVET to young people; Promote a curriculum reflecting changes in technology and the workplace and developed in collaboration with industry; Ensure students develop employability skills including ICT skills; Encourage employers’ active involvement in TVET at different levels of the system.
Strengthen teaching of science and technology in technical secondary schools; Introduce an appropriate and cost effective vocational education package to replace the diversified course package; Impart technical skills to youth to enable them go into self-employment; Facilitate development of a culture of job creation and self-employment through TVET; Make available mentorship and entrepreneurship skills to persons involved in small businesses; Reserve specific vacancies for qualified women in technical training institutions.
BTVET Strategic Plan 2011-2020 “Skilling Uganda” aims to create employability skills and competencies relevant in the labour market for all including primary and secondary school leavers; Aims to strengthen the role of the business community and employers in BTVET planning and decision making and strengthen employer-based training; Establish Labour Market Information System.
Youth
Polic
y
Advocate for affordable and accessible quality primary, secondary and University education; promote non-formal education; promote skills development through vocational training; Enforce a re-admission policy for girls who drop out of school due to pregnancy
Tailor the formal education curriculum to the needs of the job market; Promote job oriented non-formal skills training for out of school youths; Collaborate with training institutions to match labour market, skills demand and skills formation.
Have a mechanism to provide a conducive environment for access to further studies; Strengthen vocational guidance and counselling; Introduce entrepreneurial education in higher learning institution.
Advocate for a national employment policy that addresses and responds to the concerns of the youth; Advocate for creation of a youth trust bank; Promote enterprise education; Offer loan schemes for youth in tertiary institutions; Support micro-credit financial institutions that extend credit facilities to the youth.
Table 5: Education policies and their objectives targeting youth in the EAC

East African Regional Analysis of Youth Demographics 20
4.3 Economy, Employment and Job Creation
The economies of the four EAC countries-- Kenya, Rwanda, Tanzania
and Uganda-- have registered fairly good growth rates since 2000.
The average growth rates for Kenya, Rwanda, Tanzania and Uganda
economies between 2006 and 2016 were 4.6%, 7.9%, 6.6%, and 6.4%,
respectively (Figure 10). The region was rated the fastest growing in
Africa in 2017, averaging at 5.6 % with North Africa coming a distant
second at 3.3%.43 This growth is driven by strong domestic demand
(private consumption) and high public infrastructure spending. The growth
is projected to increase to 5.9% in 2018. However it is notable that this
growth has not been accompanied by a significant improvement in the
living standards of East Africans.
ICT P
olicy
Integrate IT subjects at all education levels; Promote the development of integrated e-learning curriculum to support ICT in education; Promote distance education and virtual institutions, particularly in higher education and training; Create opportunities for providing assistance for the disadvantaged, people with special needs, women and the youth to acquire IT skills.
Integrate ICT subjects in curriculum and teaching methods at all levels of education; Promote use of Open Distance and e-Learning (ODeL); Ensuring the availability of infrastructure that is critical to successfully integrate ICTs at all levels of education.
Create supportive environment for collaboration with the private sector in development of ICT skills while encouraging lifelong learning through the use of ICT; Ensure effective use of ICT in teaching and learning throughout the formal and informal education system.
Encourage educational institutions to automate their management systems; Include computer literacy module in the curriculum at all levels of education; Establish an accreditation council to ensure quality IT education and training; Encourage IT companies to play a significant role in IT education through internship and Industrial training schemes.
Empl
oym
ent P
olic
y
The National Employment Authority Act 2016 provides a legal framework to establish an authority that will assume the functions of the National Employment Bureau, whose mandate is to maintain a database for all jobless youth to facilitate their employment.
Improve access, quality and relevance of education in all higher institutions; Develop education modules relevant to the labour market; Train and recruit highly qualified teachers; Encourage private investments in the education sector; Promote pre-employment internship courses; sensitise the population on the role and importance of TVET.
Facilitate and encourage more investments in quality and quantity in education and skills training programmes; Youth skills enhanced to participate in formulating, developing and implementing employment creation programmes.
Provide support to young people, especially women to make transition from informal to formal employment through improved access to training and business development services; Provides tax rebates to young entrepreneurs.
Figure 10: GDP growth rate trends for Kenya, Rwanda, Tanzania and Uganda
6.5
9.2
5.9
4.7
7.0
10.8
4.6
0.0
2.0
4.0
6.0
8.0
10.0
12.0
2006 2007 2008 2009 2010 2011 2012 2013 2014 2015 2016
GD
P gr
owth
rate
(Per
cent
)
Kenya Rwanda Tanzania Uganda
Data Source: World Bank (2016) World Bank national accounts data, and OECD National Accounts data files.

East African Regional Analysis of Youth Demographics 21
Source: KNBS Kenya Integrated Household Budget Survey, 2015/16; NISR Rwanda Labour Force Survey 2017; NBS Tanzania Integrated Labour Force Survey, 2014; UBOS Uganda National Household Survey, 2012/13 & UBOS 2016 Labour Market Transition of Young People in Uganda
Kenya Rwanda Tanzania Uganda
Total Population 7.4 17.8 10.3 9.4
Male 5.3 15.2 8.2 8.0
Female 9.6 21.0 12.3 11.0
Youth (Age15 -24) 22.7 23.0 13.7 6.5
Male 17.1 20.4 8.9 5.5
Female 20.9 26.0 14.5 7.4
Table 6: Youth (aged 15-24)v unemployment rates in the EAC (%)
Unemployment and underemployment in the EAC One of the transmission mechanisms that act as a link between economic
growth and poverty reduction is job creation and the equitable access
to available jobs. Economic growth measured by growth in GDP but not
accompanied by commensurate growth in decent work opportunities does
not have the desired impact on the reduction of poverty. Unemployment
(considered a form of labour underutilisation) is a serious problem in the
region, an indication that the economic growth in the region over the
past decade has not been accompanied by significant job opportunities
to match the rapidly rising young labour force. For instance, in Rwanda,
labour underutilisation was estimated at 58% (65% among women) in
the 2017 labour force survey.44 Youth unemployment rates are generally
higher than the national averages with the exception of Ugandaiii (Table
6). Youth unemployment ranges from 6.5% in Uganda to 23% in Kenya.
In comparison, the unemployment rate for the general public ranges from
7.4% in Kenya to17.8 in Rwandaiv. In addition, unemployment rates for
female youth and in in the general population exceed that of males in
all countries. The reasons for these differences include: unequal access
to education and training opportunities, which restricts women to sectors
with low productivity and low wages; unequal gender relations in the
households; and women’s reproductive and caregiver roles that are
perceived to affect their productivity and as a result, favouring men at the
workplace.
It is important to note that the unemployment rate is just one component
of the labour underutilisation measure. In fact, underemployment is a
major factor contributing to labour underutilisation in all the countries. For
instance, in Rwanda, the combined rate of unemployment and time-
related underemployment is 41% more than the unemployment rate. In
Kenya, while the unemployment rate for the general population is 7.4%,
underemployment is estimated at 20%, and in Uganda, unemployment
only accounts for 27% of the labour force underutilisation. 45-47
Policy and programme responses to youth employment challenges
To illustrate the seriousness of youth unemployment in the region, out of
over 750,000 youths who attempt to enter the job market annually in
Kenya, only 15% manage to get jobs in the formal sector.48 The inability
of the formal labour market to absorb most of the youth seeking jobs has
inadvertently led to the mushrooming of the informal sector where youth
try to eke out a living. Part of the problem faced by the young job seekers
is that many are not equipped with the requisite skills and competencies
as a result of dropping out of school and the poor quality of education
received. According to the preliminary Kenya National Adolescents and
Youth Survey (NAYS) report published in 2015, factors impeding access
of the youth to employment and income generation opportunities include
corruption, lack of capital, and lack of knowledge and relevant skills.
In Rwanda, the 2017 Labour Force Survey identified the lack of required
skills and competencies among the youth as the main factor contributing to
the high rate of youth unemployment.49 Tanzania’s Integrated Labour Force
(ILFS) (2014) on the other hand estimated that 11.8% of those employed
are underemployed and do not earn sufficient wages to meet basic
needs. Most of the underemployed are youths working in the subsistence
agriculture sector without social protection programmes.
Youth employment challenges in Uganda are similar to those of their peers
in the region. Labour underutilisation presents the biggest challenge to
young people, due to irregular employment (either in self-employment
or paid employment with contract duration less than12 months),
unemployment and the inactive non-students. Although only 27% of the
overall workforce is underutilised, the figure among young people is more
than double, at 67.9%, according to the 2015 School to Work Transition
Survey (SWTS). Labour underutilisation is rampant in the informal sector, in
which agriculture constitutes most of the informal jobs. In the 2015 SWTS,
57.2% of them were engaged in the agricultural sector. It is estimated
that about 71% of young men and women working in this sector are
‘vulnerable’. They are unpaid family helpers with inadequate earnings,
working under difficult conditions that undermine workers’ fundamental
rights.50
The endemic youth unemployment problem has in recent years prompted
governments in the region to implement a series of programmes and
develop policies to address the problem, like the revamped National
Youth Service (NYS) Programme in Kenya. In Tanzania the main policy
intervention to deal with unemployment among young people is the Youth
iiiFor Uganda, the data for the general unemployment and the youth unemployment come from two different surveys and may account for this anomaly.ivNote that countries in the EAC have adopted contextualised definitions to report their unemployment rates and hence these are not strictly comparable.
vYouth unemployment rate for Rwanda is in reference to age 16-24
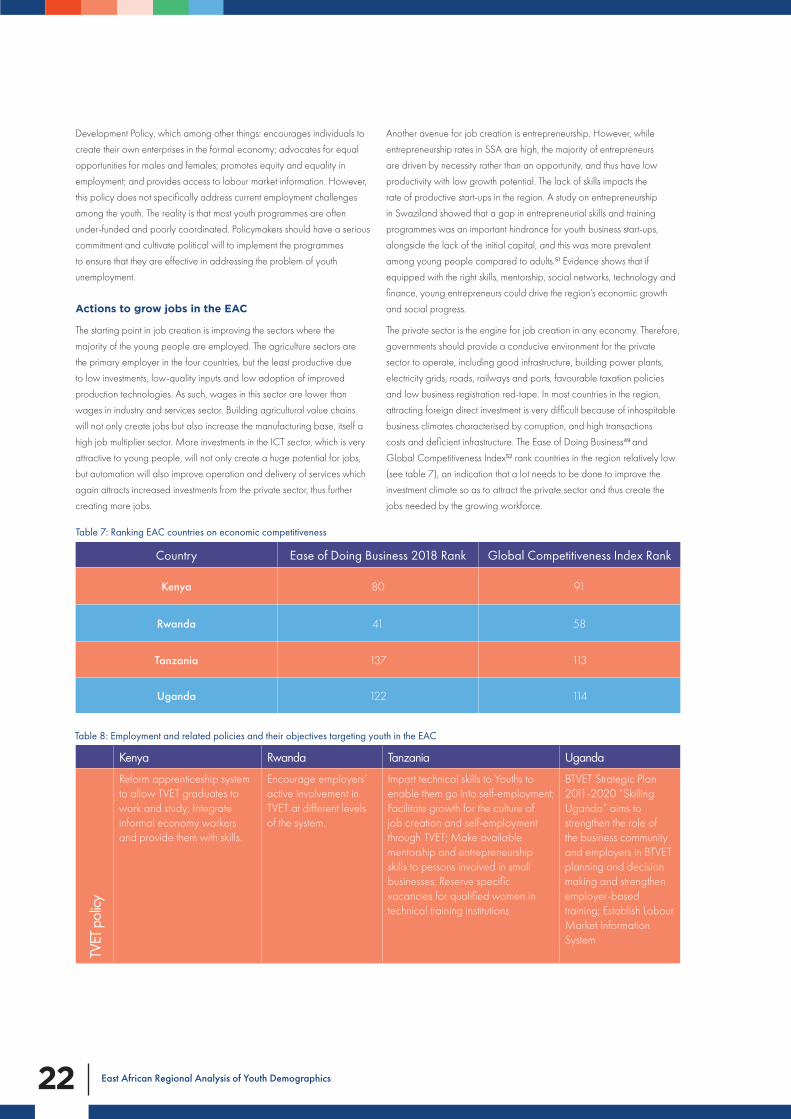
East African Regional Analysis of Youth Demographics 22
Table 8: Employment and related policies and their objectives targeting youth in the EAC
Kenya Rwanda Tanzania Uganda
TVET
pol
icy
Reform apprenticeship system to allow TVET graduates to work and study; Integrate informal economy workers and provide them with skills.
Encourage employers’ active involvement in TVET at different levels of the system.
Impart technical skills to Youths to enable them go into self-employment; Facilitate growth for the culture of job creation and self-employment through TVET; Make available mentorship and entrepreneurship skills to persons involved in small businesses; Reserve specific vacancies for qualified women in technical training institutions
BTVET Strategic Plan 2011-2020 “Skilling Uganda” aims to strengthen the role of the business community and employers in BTVET planning and decision making and strengthen employer-based training; Establish Labour Market Information System
Development Policy, which among other things: encourages individuals to
create their own enterprises in the formal economy; advocates for equal
opportunities for males and females; promotes equity and equality in
employment; and provides access to labour market information. However,
this policy does not specifically address current employment challenges
among the youth. The reality is that most youth programmes are often
under-funded and poorly coordinated. Policymakers should have a serious
commitment and cultivate political will to implement the programmes
to ensure that they are effective in addressing the problem of youth
unemployment.
Actions to grow jobs in the EAC
The starting point in job creation is improving the sectors where the
majority of the young people are employed. The agriculture sectors are
the primary employer in the four countries, but the least productive due
to low investments, low-quality inputs and low adoption of improved
production technologies. As such, wages in this sector are lower than
wages in industry and services sector. Building agricultural value chains
will not only create jobs but also increase the manufacturing base, itself a
high job multiplier sector. More investments in the ICT sector, which is very
attractive to young people, will not only create a huge potential for jobs,
but automation will also improve operation and delivery of services which
again attracts increased investments from the private sector, thus further
creating more jobs.
Another avenue for job creation is entrepreneurship. However, while
entrepreneurship rates in SSA are high, the majority of entrepreneurs
are driven by necessity rather than an opportunity, and thus have low
productivity with low growth potential. The lack of skills impacts the
rate of productive start-ups in the region. A study on entrepreneurship
in Swaziland showed that a gap in entrepreneurial skills and training
programmes was an important hindrance for youth business start-ups,
alongside the lack of the initial capital, and this was more prevalent
among young people compared to adults.51 Evidence shows that if
equipped with the right skills, mentorship, social networks, technology and
finance, young entrepreneurs could drive the region’s economic growth
and social progress.
The private sector is the engine for job creation in any economy. Therefore,
governments should provide a conducive environment for the private
sector to operate, including good infrastructure, building power plants,
electricity grids, roads, railways and ports, favourable taxation policies
and low business registration red-tape. In most countries in the region,
attracting foreign direct investment is very difficult because of inhospitable
business climates characterised by corruption, and high transactions
costs and deficient infrastructure. The Ease of Doing Business49 and
Global Competitiveness Index52 rank countries in the region relatively low
(see table 7), an indication that a lot needs to be done to improve the
investment climate so as to attract the private sector and thus create the
jobs needed by the growing workforce.
Country Ease of Doing Business 2018 Rank Global Competitiveness Index Rank
Kenya 80 91
Rwanda 41 58
Tanzania 137 113
Uganda 122 114
Table 7: Ranking EAC countries on economic competitiveness

East African Regional Analysis of Youth Demographics 23
Educ
atio
n Po
licy
Promote and sustain entrepreneurial and technological innovations amongst the youth; Unleash and re-direct the potential of the youth towards productive economic activities; Impart marketable skills and technical know-how that respond to contemporary labour market demands by the industry, informal sector and for self-employment.
Emphasise development skills such as entrepreneurial skills at all levels of education.
Facilitate the culture of education for-job-creation and self-employment through increased availability of opportunities for vocational training; Establish special educational financial support schemes for girls and women.
Revised Education Sector Strategic Plan 2017-2020 aims at Institutionalising internship and apprenticeship; Re-tooling unemployed graduates to fit into the existing job market; Talent identification and nurturing to prepare learners for early career development; Supporting research and technology incubation facilities at universities.
Youth
Polic
y
Create an environment that will lead the youth to pursue self-help initiatives for self-employment; Provide training in entrepreneurial skills; Establish micro-finance programmes to cater for the financial needs of the youth.
Training hands-on skills for youth to gain the labour market oriented skills; Support and encourage youth to acquire employable skills and change attitudes towards work; Ensure that youth have access to finance, entrepreneurship and business development through youth group saving.
Create an enabling environment for establishment of employment opportunities; Promote the culture of entrepreneurship by creating an enabling environment for youth enterprise development; Measures to promote the informal sector.
Advocate for a national employment policy that addresses and responds to the concerns of the youth; Advocate for creation of a youth trust bank; Enterprise education; Offer loan schemes for youth in tertiary Institutes; Support micro credit financial institutions that extend credit facilities to the youth.
Empl
oym
ent P
olicy
The National Employment Authority Act 2016 provides a legal framework for the state to take affirmative measures to ensure the youth and marginalised groups access opportunities for employment and economic empowerment. It establishes an authority that will assume the functions of the National Employment Bureau, whose mandate is to maintain a database for all jobless youth to facilitate their employment.
Foster integration of youth and other job seekers in the labour market; Encourage and provide opportunities to potential entrepreneurs especially the youth to develop and create their own enterprises; Evaluation of entrepreneurship or management capacities of project developers; Consultancy follow-ups during the first three years of activity; Provision of on the job training adapted to the needs of the labour market.
Identify and address youth specific needs to enhance employability and effective participation in the labour market; Create an enabling environment whereby inputs i.e. Skills training, infrastructure to enhance youth employment; Government to instil into youths the importance of work, conduct workshops on the role of self-employment, informal sector and entrepreneurship.
Provide support to young people, especially women to make transition from informal to formal employment through improved access to training, business development services; Provide tax rebates to young entrepreneurs.

East African Regional Analysis of Youth Demographics 24
4.4 Urbanisation
Urbanisation is increasingly being acknowledged as one of the defining
issues of the twenty-first century. According to the United Nations
Population Division, more than half of the world’s population now
lives in towns and cities and that figure is projected to rise to 75% by
205053, with most of this urban growth concentrated in Africa and Asia.
Although migration is a significant contributor to urban growth and to the
urbanisation process, as people move in search of social and economic
opportunities, the rapid increase in Africa’s urban population has largely
been driven by high natural increase (i.e. the difference between
births and deaths) within urban populations rather than by in-migration.
Natural increase accounts for about 75% of the urban growth in Africa,
compared to about 50% in Asia.54 As Table 9 shows, the four countries
are urbanising rapidly, with urban population growth rates ranging from
4.3% in Kenya to 6.4% in Rwanda.53 As such, the population living in urban
areas is projected to increase tremendously in the next three decades. For
example, the urban population will double in Uganda from 16% in 2015 to
32% in 2050, while it will increase from 29% in Rwanda to 53% over the
same period.
Despite the many benefits associated with urbanisation, which is seen as
an engine for economic development, the majority of urban residents in
the four countries live in abject poverty, do not have access to basic social
services, lack stable livelihoods and have high unemployment rates.55,56
The 2017 World Bank report on African cities describes them as crowded
and disconnected, with infrastructure development not able to keep pace
with the concentration of people, which happens in small and fragmented
neighbourhoods that lack proper transportation and offer limited job and
investment opportunities.55 According to the UN-Habitat, more than half
of the population in urban areas in EAC lives in slum conditions (see Table
3).57 While the population living in slum conditions declined between
2005 and 2014 in three EAC countries, in Kenya, this population has
remained relatively unchanged since the turn of the century and increased
between 2010 and 2014. In Rwanda, there are signs of a beneficial
urbanisation process. In its 2017 economic update for Rwanda, the World
Bank notes that urbanisation has been accompanied by poverty reduction,
particularly in high population density and well connected areas.58
Factors that pull youth to urban areas and cities include prospects of
employment, better healthcare, and the lure of urban lifestyles.59 Although
young people may flock into urban areas to escape real or perceived
worsening rural economic conditions, the youth in urban places face
unique challenges such as higher unemployment rates than their rural
counterparts and precarious living conditions as housing is a major
problem in African cities with the growth in decent housing fast outpaced
by rapid growth in urban populations.
Policy and programme responses to challenges of urbanisation
Several policy interventions have been instituted in various countries to
address the challenges of urbanisation and increase their economic
viability. Most of the long-term development visions identify urbanisation
as key to national development. For example, Rwanda’s vision 2020
identifies urbanisation in addition to off-farm job creation as drivers of
economic growth and national development. Uganda’s housing policy
(2016) highlights rapid urbanisation as one of the key challenges hence
management of urban development is a national priority. The policy
acknowledges that rapid and often unplanned urban growth creates
challenges related to congestion and poor housing conditions, where
basic utilities such as clean water and sanitation are insufficient, resulting in
environmental degradation. The Kenya housing policy promotes intensified
training of youth in requisite skills and construction technologies through
youth polytechnics and youth groups in order to increase the production
of housing units through the use of innovative but cheaper conventional
building materials and technology. Further, Rwanda’s human settlements
policy, Uganda’s land use policy and Kenya’s urban development policy
encourage participation of youth in land use decision making, facilitation
to access housing loans and inclusion in urban planning and development.
Despite young people being the drivers of urbanisation in all these
countries, urbanisation and housing policies do not explicitly mention
young people or their role as the mechanics of the urbanisation engine.
CountryProportion of population
Urban (%)Urban
population growth rate
Proportion of Urban population living in Slum Conditions (%)
2005 2010 20142015 2050
Kenya 25.6 43.9 4.3 54.8 54.7 56.0
Rwanda 28.8 52.6 6.4 71.6 65.1 53.4
Tanzania 31.6 53.0 5.4 66.4 63.5 50.7
Uganda 16.1 32.1 5.4 66.7 60.1 53.6
Table 9: Selected current and projected urbanisation indicators in the four countries (%)
Source: World Urbanization prospects, 2014 Prospects: UN Habitat, 2016

East African Regional Analysis of Youth Demographics 25
5
East African Regional Analysis of Youth Demographics 26
5.1 Population projections
The population projections using the UN Medium Variant and our
Accelerated Model are shown in Table 10. We have not shown the results
for the UN Low Variant Scenario because of similarity with the Accelerated
Model (but these are shown in Appendix 4). In all four countries, as
indeed is the case for most African countries, there will be a significant
increase in the population for the next 30-50 years, irrespective of what
population and social development policies the countries adopt. This
is because the decades of high fertility have created a high population
momentum, implying that even if total fertility reached replacement level
(2.1 children per woman) in the next few years, there will still be large
numbers of women added to the pool of women in reproductive ages
every year. Childbearing among these women will add to the population
size for several decades. However, the pace of growth and the level at
which the population will be stable can be influenced by policies that
countries make today. Figure 11 shows the projected population pyramids
to 2050 (see projections for 2065 in Appendix 2) for the four countries
according to the three scenarios. The pyramids show that only Kenya and
Rwanda are likely to see the start of a youth bulge under the Accelerated
Model by 2050 and that Rwanda may likely achieve the start of the youth
bulge even under the UN Medium Variant (Business-as-Usual) Model.
Future Scenarios
This section presents results from the population projections and highlights implications of these demographic changes on meeting key social and economic needs of youth in the EAC. The results show that the four EAC countries are decades away from transitioning to age structures with a youth bulge that will facilitate maximising the demographic dividend. Only Rwanda and Kenya may achieve such age structures by 2065.
The last part of this chapter demonstrates that meeting reproductive health needs, demand for secondary education and jobs by the youth will be a colossal task for the EAC as a result of the expected rapid rise in the youth population. The results demonstrate that continuing with business as usual will lead to significant increases in the unmet need for contraception, out of school and unemployed youth.

East African Regional Analysis of Youth Demographics 27
Table 10: Results - scenario modelling
Medium Variant Scenario Accelerated Model2015 2030 2065 2015 2030 2065
Kenya Total population ('000s) 47236 66960 114980 47236 66299 103359Total fertility rate 4.10 3.26 2.30 4.10 3.20 2.00Under-five mortality (per thousand live births) 55 37 21 56 27 4
Net number of migrants ('000s) - 50 - 50 - 42Youth population (15-24 years) 9509 13344 18202 9510 13346 14494Youth population (15-34 years) 17090 24035 35369 17091 24074 29867Total dependency ratio (ratio of population aged 0-14 and 65+ per 100 population 15-64)
78.3 62.9 53.7 78.3 61.0 49.1
Total dependency ratio (ratio of population aged 0-19 and 65+ per 100 population 20-64)
121.5 95.4 75.3 121.5 93 66
Rwanda Total population ('000s) 11630 16024 25257 11630 16032 24870Total fertility rate 4.20 3.20 2.00 4.20 3.20 2.00Under-five mortality (per thousand live births) 64 40 21 58 28 4
Net number of migrants ('000s) - 79 - 45 - 38Youth population (15-24 years) 2213 3254 3890 2213 3236 3522Youth population (15-34 years) 4188 5739 7691 4188 5718 7182Total dependency ratio (ratio of population aged 0-14 and 65+ per 100 population 15-64)
77.3 62.1 50.0 77.3 62.5 49.6
Total dependency ratio (ratio of population aged 0-19 and 65+ per 100 population 20-64)
117.4 95.5 69.5 117.4 95.8 66.8
Uganda Total population ('000s) 40145 63842 141153 40145 63245 130645Total fertility rate 5.91 4.62 2.80 5.91 4.50 2.80Under-five mortality (per thousand live births) 92 62 27 94 45 7
Net number of migrants ('000s) - 150 - 150 - 128Youth population (15-24 years) 13296 20934 25806 8187 13374 21742Youth population (15-34 years) 22668 37588 48111 13582 22774 42408Total dependency ratio (ratio of population aged 0-14 and 65+ per 100 population 15-64)
101.6 84.1 57.8 101.6 81.2 54.9
Total dependency ratio (ratio of population aged 0-19 and 65+ per 100 population 20-64)
160.3 131.9 85.3 160.3 128.3 77.6
Tanzania Total population ('000s) 53880 83702 186861 53880 80745 151383Total fertility rate 5.24 4.34 2.98 5.24 4.00 2.50Under-five mortality (per thousand live births) 63 43 22 63 30 4
Net number of migrants ('000s) - 200 - 200 - 170Youth population (15-24 years) 10444 17012 33714 10444 16986 24104Youth population (15-34 years) 17881 28936 62270 17881 28951 47737Total dependency ratio (ratio of population aged 0-14 and 65+ per 100 population 15-64)
93.4 80.5 61.5 93.4 75.2 52.1
Total dependency ratio (ratio of population aged 0-19 and 65+ per 100 population 20-64)
142.7 125.0 90.2 142.7 118.5 72.7
Medium variant assumptions:
Accelerated Model Assumption:
Accelerated model” scenario where we assumed that countries intensify efforts to lower fertility significantly by 2065. We assume reduction in youth childbearing (50% reduction to 2050, a further 50% to 2065 and 25% reduction thereafter). We also assume that couples who have unmet need for contraception for spacing and limiting births have access leading to 25% reduction in age-specific fertility rates among 25-34 and 20% among those 35+ to 2050, and further reductions at the same rate to 2065 ). We assume both male and female mortality in the age group 0-14 years to decline by 60% each by 2035, 2050 and 2065. We assume that decline in adult mortality would be slower for males but significantly faster for females (75% decline in mortality attributed to maternal related and other causes). The effect of migration at the population level is assumed to be small and we applied the East African age-specific migration schedule to UN net migration rates.
The UN Medium Variant scenario assumes that increases in contraceptive use and education will result in lower fertility in patterns similar to the experience of other countries that have gone through the demographic transition. The model appropriate for Sub-Saharan Africa is the Phase 2: where fertility has started going down, but not yet reached replacement level. This may be considered as a “Business as usual” scenario where fertility and population growth in the EAC continues to decline at paces that we have seen in the past few decades. Further details of the fertility and mortality assumptions can be obtained from : World Population Prospects, 2012 Revisions. Highlights and Advance Tables
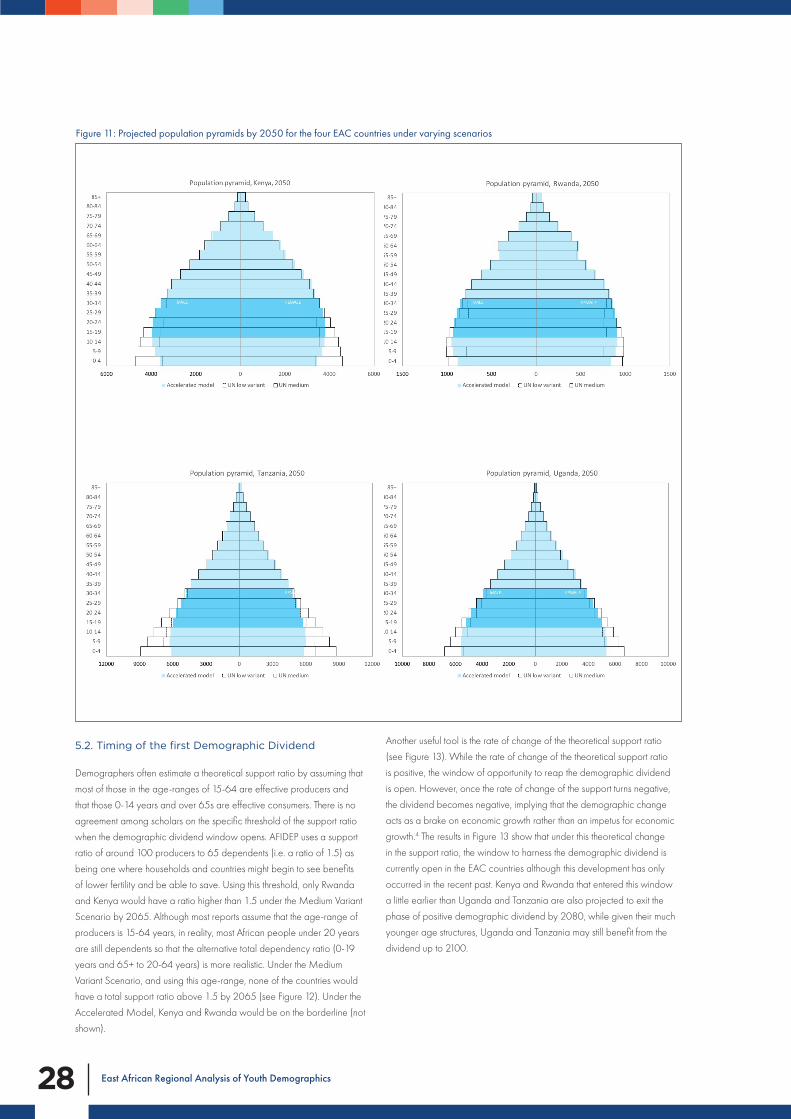
East African Regional Analysis of Youth Demographics 28
5.2. Timing of the first Demographic Dividend
Demographers often estimate a theoretical support ratio by assuming that
most of those in the age-ranges of 15-64 are effective producers and
that those 0-14 years and over 65s are effective consumers. There is no
agreement among scholars on the specific threshold of the support ratio
when the demographic dividend window opens. AFIDEP uses a support
ratio of around 100 producers to 65 dependents (i.e. a ratio of 1.5) as
being one where households and countries might begin to see benefits
of lower fertility and be able to save. Using this threshold, only Rwanda
and Kenya would have a ratio higher than 1.5 under the Medium Variant
Scenario by 2065. Although most reports assume that the age-range of
producers is 15-64 years, in reality, most African people under 20 years
are still dependents so that the alternative total dependency ratio (0-19
years and 65+ to 20-64 years) is more realistic. Under the Medium
Variant Scenario, and using this age-range, none of the countries would
have a total support ratio above 1.5 by 2065 (see Figure 12). Under the
Accelerated Model, Kenya and Rwanda would be on the borderline (not
shown).
Another useful tool is the rate of change of the theoretical support ratio
(see Figure 13). While the rate of change of the theoretical support ratio
is positive, the window of opportunity to reap the demographic dividend
is open. However, once the rate of change of the support turns negative,
the dividend becomes negative, implying that the demographic change
acts as a brake on economic growth rather than an impetus for economic
growth.4 The results in Figure 13 show that under this theoretical change
in the support ratio, the window to harness the demographic dividend is
currently open in the EAC countries although this development has only
occurred in the recent past. Kenya and Rwanda that entered this window
a little earlier than Uganda and Tanzania are also projected to exit the
phase of positive demographic dividend by 2080, while given their much
younger age structures, Uganda and Tanzania may still benefit from the
dividend up to 2100.
Figure 11: Projected population pyramids by 2050 for the four EAC countries under varying scenarios

East African Regional Analysis of Youth Demographics 29
Figure 12: Theoretical support ratio of producers (20-64 years) to young and old dependents (0-19 and 65+)
0.00
0.20
0.40
0.60
0.80
1.00
1.20
1.40
1.60
1995 2005 2015 2025 2035 2045 2055 2065 2075 2085 2095
Ratio
SS Africa Kenya Rwanda Uganda Tanzania
Hence Figure 13 shows that the window of opportunity for the EAC
countries is from now until 2100, when the number of effective producers
relative to consumers will be an unfavourable ratio. In comparison, Asian
countries such as South Korea, Malaysia and Vietnam that experienced
a much more rapid transition to low fertility are now at the stage where
their window for harnessing the first demographic dividend is closing. This
is also true for African countries such as Tunisia and South Africa, whose
window opened in the 1970s. Tunisia’s window will close by 2020 and
South Africa’s by 2050 when its support ratio gets unfavourable (See
Appendix 5). More important, however, is to note that unless countries
invest in programmes to improve the human capital and to create jobs for
the current youth, these windows of opportunity will remain aspirational.
Figure 13: Rate of change in the theoretical support ratio (producers 20-64 years to dependents 0-19 and 65+ years)
-0.150
-0.100
-0.050
0.000
0.050
0.100
0.150
2000 2010 2020 2030 2040 2050 2060 2070 2080 2090 2100
Kenya Rwanda Uganda Tanzania Sub-Saharan Africa

East African Regional Analysis of Youth Demographics 30

East African Regional Analysis of Youth Demographics 31
5.3. Future demands for services
The consequences of rapid population growth and a high dependency
ratio will be pressure on basic services such as primary and secondary
school places, health care, housing and infrastructure. Rapid population
growth also puts pressure on land, water, and other natural resources and
this contributes to Africa’s food insecurity and resource-based conflicts.60,
61 According to the World Bank, Rwanda and Uganda are among the top
ten most densely populated countries in Africa and the pressure on land
will increase with the projected population growth.
Demand for quality education and skills development
The population of secondary school pupils in the four countries is set to
increase significantly. In Tanzania and Uganda, the number of secondary
school children will more than double between 2015 and 2065 under
both scenarios (see Figure 14).
The net enrolment rate (NER) for secondary school education is generally
low. For example, in Tanzania NER for secondary schools was only 25%
in 2015 (74% for primary school). If the enrolment rates increased to the
current average levels of upper-middle-income countries, then the primary
school net enrolment rates would increase to 95% while the secondary
school net enrolment would increase to 79%. Such increases would
require an expansion of tertiary education and technical and vocational
training to absorb the young people who would graduate from the
expanded secondary school stream.
Since the beginning of the millennium, the four EAC countries have all
implemented some form of Free Primary Education that significantly
increased enrolments at a primary school level. All indications are that they
have now turned their focus to policy and programme actions to achieve
a universal secondary education. However it is critical that attention be
given to improving the quality of delivery and relevance of curricula to
impart 21st century skills and to provide learning opportunities for out-of-
school youth. This is in line with the objective of Sustainable Development
Goals (SDG) 4: “to ensure inclusive and equitable quality education
and promote lifelong learning opportunities for all”. Research by AFIDEP
and the MasterCard Foundation identified a number of challenges with
secondary school education in EAC including:
• Low quality of education delivery;
• Out-dated curricula that do not equip graduates with the necessary
skills required by the labour market; and
• Insufficient teaching of transferable skills (higher-order cognitive skills
and non-cognitive skills that individuals use to be successful across
different situations in work and life that employers find attractive). 62
Above all, significantly more resources will be required to implement the
education reforms to improve human capital and harness the demographic
dividend in the EAC.
Figure 14: Estimated number of secondary school places under two scenarios, 2015-2065 in thousands
KENYA: Secondary school (age 14-17)
TANZANIA: Secondary school (age 14-17)
RWANDA: Secondary school (age 13-18)
UGANDA: Secondary school (age 13-18)
,
,
,
,
, ,
,
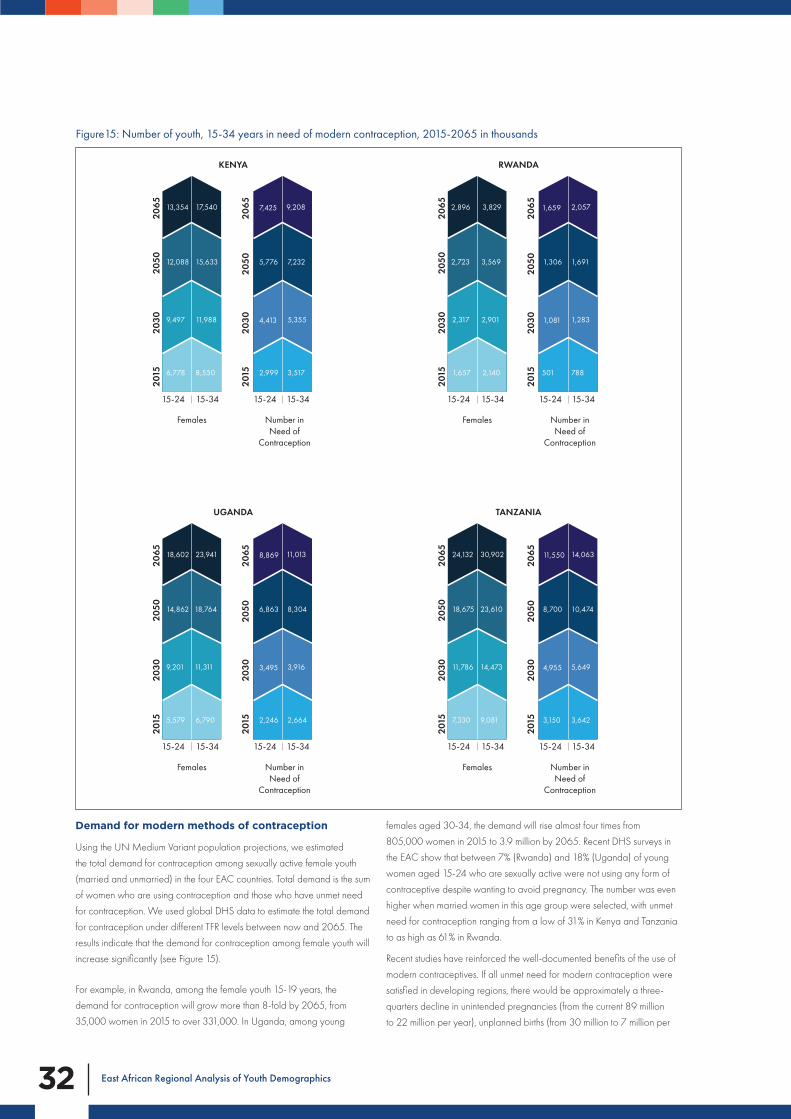
East African Regional Analysis of Youth Demographics 32
Figure15: Number of youth, 15-34 years in need of modern contraception, 2015-2065 in thousands
2015
2030
2050
2065
2015
2030
2050
2065
2,317
1,657 2,140
2,723
2,896
2,901
3,569
3,829
1,081
501 788
1,306
1,659
1,283
1,691
2,057
Females Number in Need of
Contraception
15-24 15-34 15-24 15-34
RWANDA20
1520
3020
5020
65
2015
2030
2050
2065
9,497
6,778 8,550
12,088
13,354
11,988
15,633
17,540
4,413
2,999 3,517
5,776
7,425
5,355
7,232
9,208
Females Number in Need of
Contraception
15-24 15-34 15-24 15-34
KENYA
2015
2030
2050
2065
2015
2030
2050
2065
11,786
7,330 9,081
18,675
24,132
14,473
23,610
30,902
4,955
3,150 3,642
8,700
11,550
5,649
10,474
14,063
Females Number in Need of
Contraception
15-24 15-34 15-24 15-34
TANZANIA
2015
2030
2050
2065
2015
2030
2050
2065
9,201
5,579 6,790
14,862
18,602
11,311
18,764
23,941
3,495
2,246 2,664
6,863
8,869
3,916
8,304
11,013
Females Number in Need of
Contraception
15-24 15-34 15-24 15-34
UGANDA
Demand for modern methods of contraception
Using the UN Medium Variant population projections, we estimated
the total demand for contraception among sexually active female youth
(married and unmarried) in the four EAC countries. Total demand is the sum
of women who are using contraception and those who have unmet need
for contraception. We used global DHS data to estimate the total demand
for contraception under different TFR levels between now and 2065. The
results indicate that the demand for contraception among female youth will
increase significantly (see Figure 15).
For example, in Rwanda, among the female youth 15-19 years, the
demand for contraception will grow more than 8-fold by 2065, from
35,000 women in 2015 to over 331,000. In Uganda, among young
females aged 30-34, the demand will rise almost four times from
805,000 women in 2015 to 3.9 million by 2065. Recent DHS surveys in
the EAC show that between 7% (Rwanda) and 18% (Uganda) of young
women aged 15-24 who are sexually active were not using any form of
contraceptive despite wanting to avoid pregnancy. The number was even
higher when married women in this age group were selected, with unmet
need for contraception ranging from a low of 31% in Kenya and Tanzania
to as high as 61% in Rwanda.
Recent studies have reinforced the well-documented benefits of the use of
modern contraceptives. If all unmet need for modern contraception were
satisfied in developing regions, there would be approximately a three-
quarters decline in unintended pregnancies (from the current 89 million
to 22 million per year), unplanned births (from 30 million to 7 million per

East African Regional Analysis of Youth Demographics 33
6,946 4,955 7,422 8,289
3,062 4,953 8,161 10,741
2,506 3,850 4,371
1,508 2,493 532 5,053
Figure 16: Projected numbers of youth Not in Education, Employment or Training [NEET] in thousands
6,946 6,958 9,702 8,632
4,939 6,946 9,091 10,222
416 535 545
310 417 532 579
KENYA TANZANIA
UGANDARWANDA
year) and induced abortions (from 48 million to 12 million per year). Fully
addressing the unmet need for modern contraception could also result in
76,000 fewer maternal deaths each year.63,64
The Guttmacher Institute estimates that in low-income countries, it costs
$10 to provide adequate contraception per woman per annum and that
each dollar invested reduces the costs of meeting healthcare as a result
of unintended pregnancies, unsafe abortion, HIV in pregnancy care, and
unplanned births by $1.47.65
Youth “Not in Education, Employment or Training”
Section 4.3 detailed the challenge of youth unemployment and
underemployment that is widespread within the EAC. For example, in
Uganda, youth unemployment is around 21% among women and 11%
among men, while in Tanzania, roughly 14% of those 15-24 years are
unemployed, with females having 1.5 times higher unemployment than
males. Even among those employed, underemployment is more common
among youth compared with older workers. Labour underemployment
refers to working part-time when people are available to work full-time,
implying that people are not earning sufficient wages and are thus likely to
be among the working poor. Most of the underemployed youths are in the
agricultural sector, often working for subsistence. Furthermore, many are in
vulnerable employment, thus they are unlikely to have access to benefits or
social protection programmes.
The share of young people who are not in education, employment or
training (NEET) provides a broad measure of the untapped potential
of young people who could contribute to national development. The
International Labour Organisation argues that young people in this group
deserve attention since they are neither improving their future employability
through investments in skills nor gaining experience through employment. If
the levels of employment, school enrolment, and training remain the same,
the projected number of youth NEET in the four East African countries will
increase from 9.8 million to nearly 23 million by 2050 (Kenya, from 4.9
to 9.1 million; Tanzania,3.1 to 9.2; Uganda, 1.5 to 4 million; and Rwanda
310,000 -532,000). Figure 16 provides more detail on these projections
by age.
Note: For these projections the youth ages for Kenya and Rwanda are 15-34, 15-35 for Tanzania, and 15-29 for Uganda.

East African Regional Analysis of Youth Demographics 34
6

East African Regional Analysis of Youth Demographics 35
To demonstrate the potential benefits of the demographic dividend and
identify the multi-sectoral policies and investments required to achieve
those benefits in the four EAC countries, we used the modelling tool
DemDiv. DemDiv was developed by the USAID-funded Health Policy
Project at the Futures Group (now Palladium).66 It is a scenario-based two-
part model that projects demographic and economic changes up to 40
years, to estimate employment and investment, along with an estimation
of gross domestic product (GDP) and GDP per capita as well as several
other indicators of human development (including Human Development
Index). In particular, the model allows the design of multiple scenarios
showing how the combined power of policy investments in family planning
(FP), education, and the economy can generate a demographic dividend.
The scenarios in this report are based on the aspirations to meeting
and surpassing benchmark countries, which include Malaysia, South
Korea, South Africa and Mauritius. Full explanations of the rationales
for these scenarios are reported in the countries’ Demographic Dividend
reports.67-70
Modelling the Potential Impact of the Demographic Dividend in East Africa
This section presents modelling results showing the potential impact of the demographic dividend for each of the four EAC countries over a period of four decades. Following interest by the respective governments, modelling using the DemDiv modelling tool has been conducted for each of the four countries over the last four years. The modelling results emphasise the need for concerted integrated investments and policy actions across sectors if at all the East African countries are to benefit from the demographic dividend.
If the countries continue on a Business - as - Usual pathway, then rapid population growth will continue to put serious pressure on development and a youth bulge will not be achieved over the next few decades. Under this scenario, human development will remain low, economic growth will stagnate and the countries will remain stuck at low-income levels. On the other hand, under a Combined Investment Scenario in which the countries significantly enhance access to modern contraception, universal secondary education is attained and economic competitiveness and governance are significantly enhanced, the four countries could quickly witness a change in their age structures to have a youth bulge and subsequent working-age bulge that would reduce young age dependency and allow them to maximise the benefits of the demographic dividend. This would facilitate their move from low-income status to upper-middle income or high-income status within four decades. The priority areas in which these countries must make strategic investments to earn the demographic dividend are:
• Comprehensive sexuality education and facilitating universal access to contraception and healthcare.
• Access to basic quality education for all and significantly improved access to tertiary training and skills development
• Economic reforms that spur entrepreneurship and job creation
• Strengthening the rule of law, good governance and accountability
• Female empowerment in all spheres
In the final part of this section, we highlight the possible outcome of failure to invest in the areas above.

East African Regional Analysis of Youth Demographics 36
The modelling policy scenarios and the input variables for the various policy interventions under each of the four scenarios for each country are
summarised in a table in Appendix 6 for reference.
Policy Scenario Key characteristics
“Business as Usual” Scenario
•Status quo, characterised by persistence of high child dependency burden-sluggish economic growth will continue.
•Countries will only manage to attain 20-30% of the progress they need in order to attain the current level of development indicators for the selected benchmarking countries which are Malaysia, South Korea, South Africa and Mauritiusvii.
Economic Emphasis Scenario
•This scenario represents the best economic outlook for the four EAC countries in terms of reforming their economies to enhance productive efficiency and accelerate economic growth, job creation, and poverty reduction.
•Emphasises enhancement of global economic competitivenessviii, and productive efficiency, and governance as outlined in their long-term visionsix.
•Majority of the target economic indicators for 2055 are based on economic indicators for benchmark countries.
•Education and family planning indicators held at the same level as the “Business as Usual” scenario.
Social Emphasis /Economic Emphasis
and Education Scenario
•In Kenya Economic indicators held to the same level as the Economic Emphasis scenario.
•Targets for Education indicators are set at the same level as Combined scenario.
•Family planning indicators are held at the “Business as Usual” levelx.
Combined Scenario.
•An integrated development scenario that concurrently emphasises investments in economic reforms as well as prioritisation of family planning to prevent unplanned births and education to build high quality human capital.
•Economic indicators held to the same level as the Economic Emphasis scenario.
•Expectedxi and meanxii years of schooling are set at the 2015 levels of the Asian countries (Malaysia, Indonesia and South Korea) – we assume universal access to secondary education and average of 2 years of post-secondary education.
•Contraceptive prevalence rate increases to at least 64% by 2055.
Table 11: Key Characteristics of the Policy Scenarios used in the modelling4
viThe assumptions for the DemDiv modelling in the four countries differ as these were being set through a participatory workshop process, with stakeholders in the workshop tweaking the basic assumptions to meet contextual interests. Nevertheless, the “Business as Usual”, Economic Emphasis and Combined Scenarios take on the same line of assumptions across the four countries while the differences are more pronounced for the Social Emphasis scenario.viiThese four benchmark countries were selected because they collectively present various qualities that EAC and other African countries would like to emulate. viiiGlobal Competitiveness Index, a cross-country database compiled by the World Economic Forum (WEF). Competitiveness is defined as the set of institutions, policies and factors that determine the level of
productivity of a country, and hence the level of prosperity that can be reached by the economy. There is general convergence between it and the World Bank’s Ease of Doing Business index.ixVision 2025 for Tanzania; Vision 2030 for Rwanda, Vision 2030 for Kenya and Vision 2040 for UgandaxAssumes CPR for Tanzania is 42%; For Kenya 39.4%; xiExpected Years of Education refers to the total number of years of schooling a child who is of primary school entry age today can expect to receive over their lifetime, assuming that the probability of her/him being enrolled in school at future ages is equal to the current enrolment rate at those ages.xiiAverage number of years of schooling for the adult population aged 25 and above.
6.1 DEMDIV results
The results show that the demographic indicators and emerging economic opportunities in the four countries can be turned into a huge impetus for the socio-
economic transformation envisaged in the long-term development
visions. The countries will achieve a favourable age structure change under the combined scenarios that lead to a working-age bulge and a sizeable reduction
in child dependency. However, the countries should prioritise investments aimed at simultaneously creating a globally competitive economy and accelerating
economic growth and job creation as well as accelerating the reduction in fertility through voluntary and rights-based interventions in education and family
planning.

East African Regional Analysis of Youth Demographics 37
Figure 17: Kenya - Projected Per capita GDP (in US$)
$896
$6,693
$8,748
$907
$11,288
$0
$2,000
$4,000
$6,000
$8,000
$10,000
$12,000
$14,000
2010 2015 2020 2025 2030 2035 2040 2045 2050
Business as Usual Econ Emphasis Econ & Educ Emphasis Combined Econ and FP/Educ Emphasis
Demographic Dividend Earned =$4,595
Figure 18: Kenya - Projected Human Development Index Score
0.434
0.563
0.697
0.435
0.755
0.30
0.40
0.50
0.60
0.70
0.80
0.90
1.00
2010 2015 2020 2025 2030 2035 2040 2045 2050
HD
I Sco
re
Business as Usual Econ Emphasis Econ & Educ Emphasis Combined Econ and FP/Educ Emphasis
KENYA
As Figure 17 shows, if Kenya follows the Combined Investment Scenario, its GDP per capita will increase to $11,288 by 2050, up from $ 907 in 2010,
having graduated into an upper middle-income country by around 2034. By following an integrated investment approach, the country will also earn
a demographic dividend of $4,595 by 2050, which is the additional per capita income earned in excess of the income earned if the country was to
focus on Economic Emphasis Scenario only. The living standards will also improve markedly under the Integrated Investment approach, with HDI score
increasing from 0.435 in 2010 to 0.7555, as shown in Figure 18.

East African Regional Analysis of Youth Demographics 38
RWANDA
In Rwanda, the level of economic growth that the Government envisages in Vision 2020 and initial discussions towards the formulation of Vision 2050 will
only be achieved under the Combined Scenario, which would generate a GDP per capita of US$ 4,015 by 2035 and US$ 12,555 by 2050. The GDP
per capita achieved under the Economic Scenario will be below target, at US$ 3,207 in 2035 and US$ 9,098 by 2050. The demographic dividend,
which is the additional GDP per capita the country would earn by 2050 by investing in its human development, in addition to its investments in the
economic sector, would amount to US$ 3,457 per capita (Figure 19). The Combined Scenario will result in an HDI score of 0.76 in 2050, with a ranking
of 38 globally based on 2011 rankings (Figure 20). This is because of the greater investments in the economic sector under the Combined Scenario than
under the Social Emphasis Scenario, with a higher economic output. Rwanda would thus graduate to being among the highly developed countries in the
world by 2050 under this scenario.
Figure 19: Rwanda - Projected Per capita GDP (in US$)
$2,764
$9,098
$3,784
$735
$12,555
$0
$2,000
$4,000
$6,000
$8,000
$10,000
$12,000
$14,000
2015 2020 2025 2030 2035 2040 2045 2050
Business as Usual Econ Emphasis FP & Educ Emphasis Combined Econ and FP/Educ Emphasis
Demographic Dividend Earned =$3,457
Figure 20: Rwanda - Projected Human Development Index
0.580
0.650
0.725
0.418
0.804
0.30
0.40
0.50
0.60
0.70
0.80
0.90
1.00
2015 2020 2025 2030 2035 2040 2045 2050 2055
HD
I Sco
re
Business as Usual Econ Emphasis FP & Educ Emphasis Combined Econ and FP/Educ Emphasis

East African Regional Analysis of Youth Demographics 39
TANZANIA
The Combined Scenario in Tanzania will produce similar results with a youth bulge expected by 2055, and a dependency burden of only 58
dependents for every 100 persons of working age. The population will be much smaller at 129 million than under the Business as Usual Scenario, and the
total fertility rate will be close to replacement level, at 2.4 births per woman. Per capita GDP will increase to USD 11,656.6. Thus, if Tanzania unleashes
its full potential and simultaneously prioritises reforms and investments in economic, demographic and human capital development and facilitates a rapid
fertility reduction, it will earn a much larger demographic dividend of USD 3,877.2 per person (Figure 21). Tanzanians will have high living standards with
an HDI of 0.775 (Figure 22), and this will lead to a long life expectancy of 74 years by 2055.
Figure 22: Tanzania- Projected Human Development Index
0.558
0.642
0.737
0.442
0.775
0.30
0.40
0.50
0.60
0.70
0.80
0.90
1.00
2015 2020 2025 2030 2035 2040 2045 2050 2055
HD
I Sco
re
Business as Usual Econ Emphasis Econ & Educ Emphasis Combined Econ and FP/Educ Emphasis
Figure 21: Tanzania- Projected Per capita GDP
$2,063
$7,779
$9,366
$967
$11,657
$0
$2,000
$4,000
$6,000
$8,000
$10,000
$12,000
$14,000
2015 2020 2025 2030 2035 2040 2045 2050 2055
Business as Usual Econ Emphasis Econ & Educ Emphasis Combined Econ and FP/Educ Emphasis
Demographic Dividend Earned =$3,878

East African Regional Analysis of Youth Demographics 40
UGANDA
Under the Combined Scenario, Uganda’s GDP per capita will increase to USD 9,567 by 2040, and the country will move into the upper middle-
income category, earning a demographic dividend of USD 3,483 (Figure 23). This will be due to simultaneous prioritisation of economic, social and
demographic factors to achieve the socioeconomic transformation envisaged in Vision 2040. By this time, the population will have a youth bulge, fertility
will have declined to 2.2 children per woman, and there will only be 58 dependents for every 100 persons of working age. As such the living standards
will be high, with an HDI of 0.74 by 2040 (Figure 24).
Figure 24: Uganda - Projected Human Development Index
0.422
0.604
0.658
0.361
0.740
0.30
0.40
0.50
0.60
0.70
0.80
0.90
1.00
2011 2016 2021 2026 2031 2036
HD
I Sco
re
Business as Usual Econ Emphasis Econ Emphasis & Moderate FP/Educ Combined Econ and FP/Educ Emphasis
Figure 23: Uganda - Projected Per capita GDP
$927
$6,084
$7,271
$506
$9,567
$0
$2,000
$4,000
$6,000
$8,000
$10,000
$12,000
$14,000
2011 2015 2019 2023 2027 2031 2035 2039
Business as Usual Econ Emphasis Econ Emphasis & Moderate FP/Educ Combined Econ and FP/Educ Emphasis
Demographic Dividend Earned =$3,483

East African Regional Analysis of Youth Demographics 41
6.2 Business-as-Usual Scenario: What are the risks of inaction?
The governments across Africa, including the EAC countries, are acutely
aware of the rapid increase in their populations. They are also aware that
changes in the population will have consequences for their development
trajectories. As demonstrated by the modelling, if strategic investments are
made in priority areas of social and economic development, then Kenya,
Rwanda, Tanzania and Uganda could all capitalise on their population
and development dynamics to graduate to prosperous upper-middle-
income countries. On the other hand, if the countries choose the path of
Business-as-Usual, the price to be paid for the cost of inaction could be
enormous and the countries will remain stuck at low-income levels, with
low human development.
Whichever scenario you look at, the youth population aged 15 to 34 is set
to almost double in Kenya and Rwanda and more than double in Uganda
and Tanzania by 2050. Under the UN Medium Variant Scenario, Kenya
and Rwanda’s populations for this age group are projected to increase
from 17 million and 4 million respectively in 2015 to 31 million and 7
million by 2050. In Uganda and Tanzania, youth aged 15 to 34 are
expected to increase from 14 million and 18 million respectively in 2015 to
38 million and 47 million by 2050. Investing in youth should not wait for
them to get to the defined youth ages but rather these investments should
take on a life course approach where investments in human capital start at
the earliest ages.
As a consequence of the rapid increase in the youth population, there
will be a significant increase in demand for schooling, jobs, healthcare
and other basic services. With the EAC countries basically reliant on
agriculture, the environmental stress as a result of rapid population growth
will also be a key variable to pay attention to. Despite existing policies
that have a focus on youth outcomes in the four countries, the situational
analysis for this study highlights key areas of concern that will continue to
lead to undesirable outcomes:
• Poor access to quality health services and in particular sexual and
reproductive information and services for the youth. Access to
modern contraception to fulfil the unmet need for family planning
for young people, a key ingredient to facilitating the demographic
transition, is also below optimal levels. Continued inadequate
resource allocation to turn these around will lead to a persistently
high burden of disease and high birth rates among the youth.
• Very low enrolment levels beyond primary school, low quality of
education that result in poorly educated youth without relevant skills
to make the countries globally competitive and reduce poverty
among young people.
• Lack of decent employment opportunities for youth who have to
subsist on meagre earnings from a mushrooming informal sector
that has low wages and little to no social protection. This increases
the youth dependency burden in addition to the already high child
dependency burden the countries have to grapple with.
• Poor governance and insufficient accountability and performance
management mechanisms that lead to the poor provision of basic
services and below optimal value for money for public investments.
• While all the countries acknowledge the need for gender
mainstreaming in programmes to ensure that historical and cultural
factors that resulted in women being left behind are addressed,
there are insufficient programmes for female empowerment. Hence
the gender gaps in critical spheres such as informal employment
and professional training remain wide.
As a result, the large pool of youth in East Africa is not the impetus for
productivity that they could be. Their productive potential is under-
exploited and though they form a large potential market, they have low
per capita purchasing power.
The long-term consequences of Business as Usual is continued sluggish
growth and the perpetuation of a cycle of poverty. Significantly, there is
the real danger that these large masses of youth, due to disenchantment
from failure to reach their aspirations and earn a decent living, could
turn to vices such as crime leading to insecurity and could also become
vulnerable to taking part in civil disobedience and creating political
instability. A recent study on SSA has shown that an increase of 1% in the
population of youth aged 15-19 increases the incidence of low-intensity
civil conflict by 2 percentage points.71

East African Regional Analysis of Youth Demographics 42
7

East African Regional Analysis of Youth Demographics 43
Africa’s population is projected to grow from the current 1.2 billion to over
3 billion by 2063 when nearly one in every three people in the world will
be African. Decades of very high fertility in Africa, coupled with rapidly
declining child mortality have created a youthful population age-structure.
Kenya, Rwanda, Tanzania, and Uganda, contribute about 10% of the
population in the continent. High fertility in the EAC is contributing to
significant population growth which may impede economic development
unless the countries address the rapid population growth and invest in the
human capital of the current youth cohorts.
The prospects of harnessing a sizeable demographic dividend in EAC
are low because the countries have high child dependency burden. But
the recent transition to lower fertility in the region, coupled with falling
childhood mortality rates, offer an opportunity for accelerated economic
growth in the region. This will be achieved if the countries increase
investment in i) sexual and reproductive health and family planning for all;
ii) better quality education, skills development and healthcare to improve
productivity; iii) creating an enabling economic environment for savings,
investments, and new jobs; iv) good governance and accountability for
equitable development and other areas which are captured in Figure 25.
The consequences of inaction or disinvestment are captured in Figure 26.
They include being ensnared in a poverty trap, disenchanted youth, weak
economic growth, weak GDP growth, and threats to the security of the
region and beyond. Moreover, emerging evidence shows that high youth
population growth and unemployment are associated with increased
insecurity, social unrest and disorder, especially in urban areas.72-74
Summary and Recommendations
Figure 25: Priority investment areas to harness the demographic dividend
Comprehensive sexuality
education;Universal access to contraception and healthcare
Access to basic quality education for boys & girls.
Access to tertiary training and skills
development
Female empowerment
and participation in all spheres
Programmes to create good
stewardship of natural
resources among youth
Economic reforms,
entrepreneurship, job creation for
male and female youth
Strengthening rule of law, good governance and accountability
Consequences Investment areas Short & medium term outcomes Long term outcomes
Second demographic
dividend
Large markets and high per capita purchasing
power
Healthy female & male youth;
Lower birth rates in future cohorts
Economically empowered and
productive male and female youth:
Job creators & savers
Well-educated, globally competitive male and
female youth.
Environment youth champions; sustainable
food production & consumption
Sustained and inclusive
economic growth
Temporary youth bulge
Incr
ease
d de
man
d fo
r sch
oolin
g, jo
bs, h
ealth
se
rvic
es, h
ousin
g, a
nd o
ther
bas
ic se
rvic
es.
Envi
ronm
enta
l str
ess
Rapid fall in fertility and child mortality
Figure 26: “Business-as-usual” or disinvestment in youth
Status quo or disinvestment
Poverty trapSluggish economic
growth
Continued expansion of
youthful population
Limited access to education, or poor quality of education;
Poor quality health and contraceptive services for youth. Poor sexuality & relationship education
Poor governance and lack of accountability leading to poor provision of basic
services
Lack of jobs for youth; limited options for decent earnings
No actions to promote good stewardship of the
environment among youth
Policy responses
Short & medium term outcomes
High burden of disease among youth;
Persistent high birth rates
Economically unproductive youth, dependent on
others
Poorly educated youth, unskilled youth,
globally uncompetitive
Environment decay; unsustainable food production systems
Status of programmes and actions Long term outcomes
Large potential markets but low per capita purchasing power
Increased demand for schooling, jobs,
health care, housing and other
basic services. Environmental
stress
Consequences
Disenchanted youth; insecurity; civil unrest,
political instability
Insufficient programmes for girls empowerment and gender mainstreaming
Cycle of poverty and poor outcomes

East African Regional Analysis of Youth Demographics 44
We make two sets of recommendations: to the governments of the EAC countries, and to DFID and other development partners.
Recommendations to EAC governments: Priority Areas for Investment
The African Union’s roadmap for harnessing the demographic divided has identified four pillars. These are: employment and entrepreneurship; education
and skills development; health and wellbeing; and rights, governance, and youth empowerment. Based on our analyses, including the scenario
modelling, and literature review, we make the recommendations below that align with the AU pillars.
Priority area Description of investment Examples of impact of investment or cost of inaction in priority area
Family planning and Health
Child survival to improve human capital and to accelerate fertility decline. Universal access to contraception to address the high unmet need especially among those living in rural areas, urban slums, and among youth.
Prevent new HIV infections among youth and treat those who are infected to improve human capital.
Healthy eating and life-style interventions to prevent overweight/obesity epidemic among youth.
It is estimated that if all unmet need for modern contraception were satisfied in developing regions, there would be approximately a three-quarters decline in unintended pregnancies (from the current 89 million to 22 million per year), unplanned births (from 30 million to 7 million per year) and induced abortions (from 48 million to 12 million per year). In Tanzania and Kenya for example, 3,000 and 5,000 maternal deaths respectively were averted in 2017 due to modern contraceptive use.63
Because of high fertility, about half of the total health expenditures are spent in most sub-Saharan Africa countries on caring for the large numbers of pregnant women and young children among the population.75
In 2005, the estimated loss in national income from heart disease, stroke and diabetes was $0.1 billion in Tanzania. These losses accumulate over time because each year, more people die. Estimates for 2015 are between 3 and 7 times those of 2005, and Tanzania was predicted to lose a cumulated $2.5 billion in national income between 2005 and 2015.76
Women and girls’ empowerment
Empower girls to participate in secondary and tertiary education and in science, technology, and mathematics.
Outlaw practices that affect women’s empowerment such as child marriages and gender-based violence.
A study of girls’ education in Kenya found that an adolescent girl’s chance of giving birth as a teenager dropped by 7.3 per cent if she had at least a primary education and by 5.6 per cent if she had at least a secondary education.82
There is evidence that shows that given similar financial resources, women spent more than men on child health, education, and nutrition.82,84
Education and skills
Invest in school-construction projects to match the growth in population.
Improve the quality of education. Increase female participation in secondary and tertiary education. Female education also lowers fertility.
Involve employers in curriculum reforms for tertiary and TVET colleges to ensure that appropriate transferrable skills form part of the training.
An additional year in the mean years of schooling attained for the 15-64 years age-group is associated with a 12% boost in manpower productivity.77
Evidence from 7 countries (Botswana, Cape Verde, Namibia, Mauritius, South Africa and Swaziland) in Africa where the average number of children per woman is 3.5 or less show a benefit in the increase in education spending per pupil of between $166 and $1,000 between 1980 and 2008.78
An additional year of schooling is associated with a 10 percent increase in wages.79
In 2010, manpower productivity levels in sub-Saharan Africa could have been 40% higher if the region had achieved the global average for years of schooling among its adult population.77

East African Regional Analysis of Youth Demographics 45
Economic reforms that promote job creation
Create an enabling environment for the creation of jobs, youth entrepreneurship, and encouraging savings for pensions; promoting innovation hubs and facilitating the financial inclusion of youth are among critical options to stem unemployment in the EAC.
Decent livelihood opportunities will also discourage the brain drain of young people moving to other countries in search of jobs. Crucially, a large pool of disaffected unemployed youth presents a significant security risk to individual countries and to the region. Crime, violence, and radicalisation are real possibilities when youth are marginalised. Develop agribusiness for youth.
If output per worker stays constant, a rise in the working-age share of the population from 1 worker per dependent to 2.5 workers per dependent would lead to a 43% percent rise in income per capita.80
Though more than two-thirds of young Africans who work in rural areas work in the agriculture sector, it is the least productive sector in African economies. Investments in the agriculture sector provide perhaps the best opportunity for Africa to harness the demographic dividend.81
Rapid growth in the youth population and high levels of unemployment are associated with increased insecurity, social unrest and disorder, especially in urban areas.74,73,72
Environment and climate
Work with youth to raising awareness of environmental issues and good stewardship of natural resource. Urban planning should take into consideration both natural growth and rural-to-urban migration; rural development schemes that offer attractive livelihood opportunities for youth can help to manage rapid urbanisation.
A study in Malawi estimating how rural population density impacts agricultural intensification and household wellbeing found that areas of higher population density are associated with smaller farm sizes, lower real agricultural wage rates, and higher real maize prices.85
A modelling study covering 44 African studies that aimed to estimate the impact of population growth and climate changes on food security in Africa to 2050 concluded that projected rapid population growth will be the leading cause of food insecurity and widespread undernourishment across Africa.86
Governance and accountability
Improve governance and accountability to improve security and shared prosperity. Include youth in decision-making spaces especially on matters that affect them.
African youth are less likely than their elders to participate in civic activities: Less than half (47%) of 18 to 35 year-olds say they attended community meetings at least once during the previous year, while 40% joined others to raise an issue (vs. 57% and 47% for older citizens). Young women’s participation also lags behind that of their male peers on these measures of civic activism (by 9 percentage points, on average), particularly in West Africa and North Africa (both by 14 percentage points).87
About 86 percent of all countries that experienced a new outbreak of civil conflict between 1970 and 2000 had age structures with 60% or more of the population younger than 30 years of age. Although country age structures in many regions matured between 1970 and 1999, this “outbreak benchmark” remained virtually constant.88
Recommendations to DFID and Development partners
The development challenges arising from rapid population growth that
have been identified by this study generally apply to SSA. The following
set of broad recommendations therefore apply beyond the EAC region. To
support countries in the region to benefit from the demographic dividend,
strategic technical and financial support from development partners should
focus on the following areas:
i. In-depth policy prioritisation analysis: African governments need
guidance in policy prioritisation to help them decide what they
can do immediately, in the medium, and long-term. Development
partners should provide the technical support for such in-depth
prioritisation analysis of population and development policies. In
particular, there is need to provide such guidance at sub-national
level as significant differences in population and development
outcomes exist across regions and within countries.
ii. Systems thinking and integrated planning capacity: Supporting
capacity development for planning officials and programme
designers on systems thinking and integrated planning. Systems
thinking is an approach to problem solving that views “problems” as
part of a wider dynamic system. It demands deeper understanding
of linkages, relationships, interactions and behaviours among the
elements that characterise the entire system.89 It has been commonly
used in sectors where interventions and systems are complex such
as health and environmental conservation. The intricate linkages
between population and development demands such an approach.

East African Regional Analysis of Youth Demographics 46
11http://wcaro.unfpa.org/sites/default/files/pub-pdf/SWEDD_ENG.pdf
iii. Cost-benefit analysis: Provide technical expertise and support
for cost-benefit analyses of interventions aimed at harnessing the
demographic dividend.
iv. Sustainable funding for demographic dividend interventions:
The Combined Emphasis Scenario, which provides the best
options for harnessing a sizeable demographic divided, can be
a daunting undertaking given the multiple linkages across social
and economic development sectors. Development partners should
support innovative funding aimed at providing sustainable funds for
interventions to harness the demographic dividend. An example of
this is the Sahel Women Empowerment and Demographic Dividend
project (SWEDD)xiii which is a partnership between the World
Bank, UNFPA and governments of six countries in the Sahel region
(Burkina Faso, Chad, Côte d’Ivoire, Mali, Mauritania and Niger).
The project seeks to accelerate demographic transition to spur the
demographic dividend and reduce gender inequality in the Sahel
region. As part of the project, the governments are to secure loans
from the World Bank which in turn are used to secure technical
support for implementation of interventions by UNFPA and other
partners.
v. Coordination and accountability systems: Provide support for
the development/enhancement and implementation of strong
coordination and accountability systems for population and
development. Examples include the creation of strong national
councils for population or councils for population and development
to coordinate the implementation of programmes on population and
development - including universal access to effective contraception.
vi. Role of the Private Sector and other stakeholders: Engage the
private sector, civil society and other critical ministries like education,
youth, labour, and industrial development to become more involved
in the agenda to harness the demographic dividend and integrate
population dynamics in their existing policies and planning. The
demographic dividend agenda has mostly been in the realm of
government officials working on population and health.

East African Regional Analysis of Youth Demographics 47

East African Regional Analysis of Youth Demographics 48
References1. United Nations Department of Economic and Social Affairs PD.
World Population Prospects: The 2017 Revision. Available at: https://esa.un.org/unpd/wpp/. Accessed 17 November, 2017.
2. Lee R, Mason A. Population Aging and the Generational Economy: A Global Perspective. Cheltenham, U.K: Edward Elgar Publishing; 2011.
3. Bloom D, Williamson J. Demographic transitions and economic miracles in emerging Asia. The World Bank Economic Review. 1998;12(3):419-455.
4. Oosthuizen MJ. Bonus or mirage? South Africa’s demographic dividend. The Journal of the Economics of Ageing. 2015/04/01/ 2015;5(Supplement C):14-22.
5. Tahar H, Driouchi A. Demographic Dividend & Economic Development in Arab Countries Ifrane, Morooco: IEAPS, Al Akhawayn University, Ifrane, Morooco; 2017.
6. Schaefer I. Political Revolt and Youth Unemployment in Tunisia: Exploring the Education-Employment Mismatch. . 1 ed: Palgrave Macmillan; 2018.
7. Bongaarts J, Casterline J. Fertility transition: is sub‐Saharan Africa different? . Population and Development Review. 2013;38(s1):153–168.
8. Madsen JB, Moslehi S, Wang C. What Has Driven the Great Fertility Decline in Developing Countries since 1960? The Journal of Development Studies. 2017:1-20.
9. Kaplan H, Bock J. Fertility Theory: Caldwell's Theory of Intergenerational Wealth Flows; 2001.
10. Caldwell JC. The Wealth Flows Theory of Fertility Decline: International Union for the Scientific Study of Population; 1980.
11. Upadhyay UD, Gipson JD, Withers M, et al. Women's empowerment and fertility: A review of the literature. Social Science & Medicine. 2014/08/01/ 2014;115:111-120.
12. Larsen U, Hollos M. Women's empowerment and fertility decline among the Pare of Kilimanjaro region, Northern Tanzania. Social Science & Medicine. 2003/09/01/ 2003;57(6):1099-1115.
13. Hossain B. Women empowerment and infant mortality in Bangladesh. Applied Economics. 2015/11/02 2015;47(51):5534-5547.
14. Nyarko P, Madise N, Diamond I. Infant mortality and the pace of childbearing in Ghana: some evidence of son preference. Paper presented at: Third African Population Conference; 6-10 September 1999, 1999; Durban.
15. Rutayisire P, Hooimeijer P, Broekhuis A. Changes in fertility decline in Rwanda: A decomposition analysis International Journal of Population Research. 2014:1-10.
16. Lesthaeghe R. The fertility transition in sub-Saharan Africa into the 21st century In: Research IoS, ed. Population Studies Centre, Research Reports. Michigan: University of Michigan; 2014.
17. Machiyama K. A re-examination of recent fertility declines in Sub-Saharan Africa. In: DHS, ed. Working Paper 68. Caverlton: ICF Macro.; 2010.
18. Schoumaker B, ed. African fertility changes: Springer; 2017. Groth H, May J, eds. Africa's Population: In Search of a Demographic Dividend.
19. USAID. Three Successful Sub-Saharan Africa Family Planning Programs: Lessons for Meeting the MDGs 2012.
20. Prata N, Weidert K, Fraser A, Gessessew A. Meeting Rural Demand: A Case for Combining Community-Based Distribution and
Social Marketing of Injectable Contraceptives in Tigray, Ethiopia. PLOS ONE. 2013;8(7):e68794.
21. Kravdal Ø. Education and fertility in sub-Saharan Africa: Individual and community effects. Demography. 2002;39(2):233-250.
22. Kravdal Ø, Rindfuss R. Changing relationships between education and fertility: A study of women and men born 1940 to 1964. American Sociological Review. 2008;73(5):854-873.
23. Bundervoet T. What explains Rwanda’s drop in fertility between 2005 and 2010? . Policy Research Working Paper No. 6741. Washington, DC: The World Bank; 2014.
24. National Institute of Statistics of Rwanda (NISR) [Rwanda] MoHMR, International I. Rwanda Demographic and Health Survey 2014-15. Rockville Maryland, USA: NISR, MOH, ICF International; 2015.
25. Potts D, Marks S. Fertility in Southern Africa: The quiet revolution Journal of Southern African Studies. 2001;27(2):189–205.
26. Ahmed S, Qingfeng L, Li L, Tsui A. Maternal deaths averted by contraceptive use: an analysis of 172 countries The Lancet. 2012;380:111–125.
27. UNFPA, AFIDEP. Synthesis Report on the Demographic Dividend in Africa In: Office UEaSAR, ed. Johannesburg, South Africa.: UNFPA, AFIDEP; 2015.
28. United Nations DoEaSA. National Transfer Accounts Manual: Measuring and Analysing the Generational Economy. New York: Population Division, United Nations; 2013.
29. Patton GCea. Our future: a Lancet commission on adolescent health and wellbeing. The Lancet. 2016;387(10036):2423 – 2478.
30. WHO. Atlas of the African Health Statistics 2017: World Health Organisation (WHO), Africa Regional Office; 2018.
31. Institute for Health Metrics and Evaluation UoW. University of Washington. Available at: http://www.healthdata.org/results/country-profiles. Accessed October, 2017.
32. Madise NJ, Letamo G. Complex association between rural/urban residence, household wealth and women’s overweight: evidence from 30 cross-sectional national household surveys in Africa. BMC Obesity. January 19 2017;4(1):5.
33. Bureau PR. Addressing Risk Factors for Noncommunicable Diseases Among Young People in Africa: Key to Prevention and Sustainable Development. Washington, DC 2015.
34. Chesang RK. Drug Abuse Among The Youth In Kenya. International Journal of Scientific & Technology Research. 2013;2(6):126-131.
35. National Institute of Statistics of Rwanda. EICV4 - Economic activity thematic Report. Republic of Rwanda. Kigali, Rwanda; 2016.
36. National Bureau of Statistics. Integrated Labour Force Survey 2014. Dar es Salaam, Tanzania; 2015.
37. Sumra, Katabaro. Education foundations of the development of skills and productive capabilities. THDR 2017: Background Paper No. 10 and ESRF Discussion Paper 71. Dar es Salaam, Tanzania: Economic and Social Research Foundation,; 2016.
38. United Republic of Tanzania. Pre-Primary, Primary and Secondary Education Statistics in Brief, 2016. In: Ministry of Education, ed. Dar es Salaam, Tanzania; 2017.
39. Hivos, Twaweza. Are Our Children Learning? Literacy and Numeracy Across East Africa 2013. Available at: http://www.uwezo.net/wp-content/uploads/2012/08/2013-Annual-Report-Final-Web-version.pdf. Accessed 17 August, 2017.

East African Regional Analysis of Youth Demographics 49
40. Kenya Ro. A Policy Framework for Education: Aligning Education and Training to the Constitution of Kenya (2010) and Kenya Vision 2030 and Beyond. Nairobi, Kenya 2010.
41. Tanzania Ro. National Higher Education Policy. Dar es Salaam: Ministry of Science, Technology, and Higher Education; 1999.
42. Uganda Ro. National Strategy for Girls Education (NSGE) in Uganda, 2014-2019. Kampala: Ministry of Education and Sport; 2014.
43. African Development Bank. African Economic Outlook 2018; 2018.
44. National Institute of Statistics of Rwanda (NISR). Labour Force Survey February 2017 report, September 2017. In: Institute N, Rwanda oSo, eds. Kigali, Rwanda; 2017.
45. (NISR) NIoSoR. Labour Force Survey , August 2017. Kigali, Rwanda 2018.
46. Statistics KNBo. Labour Force Basic Report of the 2015/16 Kenya Integrated Household Budget Survey (KIBHS) Nairobi, Kenya: KNBS; 2018.
47. (UBOS) UBoS. Uganda National Household Survey 2012/13. Kampala, Uganda: UBOS; 2014.
48. (KIPPRA) KIfPPRaA. Kenya Economic Report 2016. Nairobi: KIPPRA; 2016.
49. World Economic Forum, African Development Bank, World Bank. The Africa Competitiveness Report 2017: Addressing Africa’s Demographic Dividend. Geneva, Switzerland 2017.
50. UBOS. Labour market transition of young people in Uganda (Highlights of the school to work transition survey 2015. Republic of Uganda, Kampala; 2015.
51. Brixiová Z, Ncube M, Bicaba Z. Skills and youth entrepreneurship in Africa: Analysis with evidence from Swaziland Tunis, Tunisia: African Development Bank; 2014.
52. The World Bank. Doing Business 2018: Reforming to Create Jobs. Washington, DC: The World Bank; 2018.
53. UN Population Division. World Urbanization Prospects: The 2014 Revision, CD-ROM Edition. In: United Nations Department of Economic and Social Affairs PD, ed; 2014.
54. Chen N, Valente P, Zlotnik H, eds. What do we know about recent trends in urbanization? . Norwell MA: UNFPA–Kluwer Academic; 1998. Bilsborrow R, ed. Migration, Urbanization, and Development: New Directions and Issues.
55. Lall SV, J. Vernon Henderson, Anthony J. Venables. Africa’s Cities: Opening Doors to the World. World Bank. License: Creative Commons Attribution CC BY 3.0. Washington, DC: The World Bank; 2017.
56. Zulu EM, Beguy D, Ezeh AC, et al. Overview of migration, poverty and health dynamics in Nairobi City's slum settlements. J Urban Health. Jun 2011;88 Suppl 2:S185-199.
57. UN-HABITAT. Urbanization and development: Emerging Futures. World cities report, 2016. In: Programme UNHS, ed. Nairobi, Kenya; 2016.
58. World Bank. Rwanda economic update : rethinking urbanization in Rwanda - from demographic transition to economic transformation (English) Washington, D.C. http://documents.worldbank.org/curated/en/357911513632697178/Rwanda-economic-update-rethinking-urbanization-in-Rwanda-from-demographic-transition-to-economic-transformation: World Bank Group.; 2017.
59. Beguy D, Bocquier P, Zulu E. Circular migration patterns and determinants in Nairobi slum settlements. Demographic Research. 2011;23(20):549-586.
60. Le Meur P, Hochet P, Shem M, Touré O. Conflict over Access to Land & Water Resources within Sub-Saharan Dry Lands Underlying
factors, conflict dynamics and settlement processes,. In: LEAD, ed. GRET-FAO LEAD Report. Rome; 2006.
61. Poppy GM, Chiotha S, Eigenbrod F, et al. Food security in a perfect storm: using the ecosystem services framework to increase understanding. Philosophical Transactions of the Royal Society B: Biological Sciences. 2014;369(1639):20120288.
62. Mastercard Foundation. Skills at Scale: Transferable Skills in Secondary and Vocational Education in Africa. Toronto, Canada 2017.
63. 2020 FP. Core Indicator Estimates: FP2020 The Way Ahead 2016-2017 Progress Report 2017.
64. Darroch JE, Audam S, Biddlecom A, et al. Adding it up: investing in contraception and maternal and newborn health, 2017. New York: Guttmacher Institute; 2017.
65. Singh S, Darroch J, Ashford L. Adding It Up: The Costs and Benefits of Investing in Sexual and Reproductive Health 2014. New York: The Guttmacher Institute. 2014.
66. Moreland S, E. L. Madsen, B. Kuang, M. Hamilton, K. Jurczynska, P. Brodish. Modeling the Demographic Dividend: Technical Guide to the DemDiv Model. Washington, DC: Futures Group, Health Policy Project; 2014.
67. Pathfinder-Tanzania, UDSM, AFIDEP. Prospects and challenges of harnessing demographic dividend in Tanzania. . Dar es Salaam, Tanzania; 2017.
68. National Council for Population and Development, Health Policy Project. Demographic Dividend opportunities for Kenya. . Republic of Kenya, Nairobi; 2014.
69. National Institute for Statistics in Rwanda, UNFPA, AFIDEP. Unlocking Rwanda’s potential to reap the demographic dividend Kigali, Rwanda; 2017.
70. National Planning Authority. Harnessing the Demographic Dividend Accelerating Socioeconomic Transformation in Uganda. . Republic of Uganda, Kampala; 2014.
71. Flückiger M, Ludwig M. Youth Bulges and Civil Conflict:Causal Evidence from Sub-Saharan Africa. Journal of Conflict Resolution.0(0):0022002717707303.
72. Sommers M. Governance, Security and Culture: Assessing Africa's Youth Bulge. International Journal of Conflict and Violence. 2011;5(2):292.
73. Frederiksen BF. Mungiki, vernacular organization and political society in Kenya. Development and Change. 2010;41(6):1065-1089.
74. Urdal H, Hoelscher K. Urban youth bulges and social disorder: an empirical study of Asian and Sub-Saharan African cities. Policy Research working paper; no. WPS 5110. Washington, DC: World Bank 2009.
75. Guengant J. Africa’s population: history, current status, and projections. In: Groth H, May JF, eds. Africa’s population: In search of a Demographic Dividend: Springer International Publishing AG; 2017.
76. Abegunde D, Stanciole A. An estimation of the economic impact of chronic non-communicable diseases in selected countries: World Health Organization Department of Chronic Diseases and Health Promotion (CHP); 2006.
77. Eberstadt N. Manpower, education, skills and jobs in Sub-Saharan Africa: past trends and future outlook: Springer International Publishing AG; 2017.
78. Eloundou-Enyegue PM, Giroux S. The role of fertility in achieving Africa’s schooling MDGs: Early evidence for sub-Saharan Africa. Journal of Children and Poverty. 2013;19(1):21-44.

East African Regional Analysis of Youth Demographics 50
79. Psacharopoulos G. Returns to investment in education: A global update. World Development. 1994;22(9):1325-1343.
80. Canning D, Raja S, Yazbeck A. Africa’s demographic transition: dividend or disaster? African Development Forum,. Washington DC: The World Bank.; 2015.
81. Filmer D, Fox L, Brooks K, et al. Overview: Youth Employment in Sub-Saharan Africa. In: Filmer D, ed. Youth employment in sub-Saharan Africa: World Bank Publications; 2014.
82. Ferré C. Age at first child: does education delay fertility timing? The case of Kenya. World Bank Policy Research Working Paper, No. 4833. 2009.
83. Thomas D. Like father, like son; like mother, like daughter: Parental resources and child height. Journal of human resources. 1994:950 -988.
84. Thomas D. Intra-household resource allocation: An inferential approach. Journal of Human Resources. 1990:635-664.
85. Ricker-Gilbert J, Jumbe C, Chamberlin J. How does population density influence agricultural intensification and productivity? Evidence from Malawi. Food Policy. 2014; 48(114-128.).
86. Hall C, Dawson TP, Macdiarmid JI, Matthews RB, Smith P. The impact of population growth and climate change on food security in Africa: looking ahead to 2050. International Journal of Agricultural Sustainability. 2017;15(2):124-135.
87. Lekalake R, Gyimah-Boadi E. Does Less Engaged Mean Less Empowered? Political Participation Lags among African Youth, Especially Women: Afrobarometer; 2016.
88. Cincotta R, Leahy E. Population age structure and its relation to civil conflict: a graphic metric. Environmental Change and Security Program Report. 2006;12.
89. Savigny Dd, Adam T, eds. Systems Thinking for Health Systems Strengthening. Geneva: World Health Organization; 2009.
90. UK DFID. How to Note: Assessing the Strength of Evidence. DFID. Accessed February, 2017.
91. JHPIEGO. Gender Analysis Framework. JHPIEGO. Available at: https://gender.jhpiego.org/analysistoolkit/seven-steps-to-a-gender-analysis. Accessed February, 2017.

East African Regional Analysis of Youth Demographics 51

East African Regional Analysis of Youth Demographics 52
AppendicesAPPENDIX 1: MethodsWork Package 1: Literature and Policy Review
1.1. What evidence exists concerning the social and economic impacts, opportunities, and policy responses of the demographic transitions occurring in Kenya, Tanzania, Rwanda, and Uganda?
1.2. What are the gaps, strengths and weaknesses of existing policies and interventions aimed at youth demographic trends, mobility, and labour force participation for males and females in EAC countries?
1.4. What are some of the youth-sensitive and gendered approaches that could transform the ‘youth bulge’ in EAC countries to sustained, equitable economic growth?
Literature Review
We used systematic mapping to review grey and published literature
on the trends in demographic changes and their social and economic
impacts in the four countries and Africa more broadly. We identified
six main domains to guide our literature search: Demographic or
population change, health, education, employment, legal framework,
and urbanisation and mobility (see Figure 3). Youth and gender were
cross-cutting issues that we took into consideration in our analyses and
reviews. Furthermore, country-level analyses took into account contextual
influences such as socio-political, economy and culture. A description of
these domains for youth demographics is provided in Table I.
We searched in databases such as POPLINE, MEDLINE, PUBMED,
and SCOPUS and agreed on the list of keywords for the searches. The
main inclusion criterion was relevant literature on the four countries and
other low-income and middle-income countries. The exclusion criteria
were studies in the western world and studies too far back in time (i.e.
pre-1990), except those that were vital to describing the demographic
dividend. We also used a snowballing approach whereby literature was
identified from the biographies of articles that had been identified through
the search.
We used DFID’s guidelines to assess the quality of the evidence which
identified seven principles of assessing quality (conceptual framing,
transparency, appropriateness, cultural sensitivity, validity, reliability, and
cogency).90 One researcher conducted an initial scan of the abstracts
to determine if they should be reviewed or not, and following this
initial assessment, two researchers reviewed the literature and used a
spreadsheet to summarise the findings, the geographical location and
year of publication, the study design, and types of studies. Each reviewer
assessed the quality of the literature as “high” quality if it had four or
more of the qualities listed above, “medium” if an article had two or three
qualities; “low” if the literature had only one or no qualities listed above.
Those labelled as “low” were not used in the review. Where there was
disagreement on the quality threshold of a piece of literature, a third
reviewer acted as a tiebreaker.
The original and final numbers of articles identified in the searches are
shown in the figure below.

East African Regional Analysis of Youth Demographics 53
Policy Review
We used an Excel-based tool to organise our policy review which
focused on relevant policies on the extent to which they address youth
demographics, gender, youth employment, education, skills development,
youth health, and so on. In total, about 54 policies were reviewed; 11 in
Kenya, 9 in Uganda, 19 in Rwanda, 11 in Tanzania and 4 in EAC.
Developing a Conceptual Framework
We used a consultative process and the literature to develop a conceptual
framework for understanding the causes and consequences of youth
demographics. The research team met to develop a) pathways to a youth
bulge; b) short- and long-term consequences of a youthful population; and
c) policy responses. The conceptual framework was sent to four external
experts for peer review: three sent comments.
Table I:Domains of states and impacts of youth demographic change for the systematic mapping of literature and policies
Domain Description of indicators and impacts Policy Landscape
Demographic change Trends in infant mortality by sex, fertility, and adolescent fertility; Life expectancy, dependency ratio
Policies and programmes that address youth/adolescent sexual and reproductive health needs including access to contraception.
Human capital
Trends in secondary and tertiary education by sex, transferrable skills, ICT and mobile phone use among youth.
Health of youth (HIV/AIDS, abortion-related illnesses, suicides, substance abuse, and non-communicable diseases).
Policies and programmes to increase access to high-quality secondary and tertiary education. Policies and programmes to expand transferrable and ICT skills.
Health in youth policies.
Urbanisation
Focusing on patterns of internal migration of youth between rural and urban areas and mobility to mega and secondary cities. Explore literature on sex-disaggregated migration patterns.
Policies and programmes that address youth livelihoods in both rural and urban areas;
Planning for basic and critical social services such as housing, water, sewage disposal in cities and mega cities.
Labour forceYouth employment and underemployment, growth of informal sector, entrepreneurship, access to credit/financial inclusion
Policies and programmes that focus on job creation, underemployment, female participation in the labour force.
Interventions that workEffective projects, actions, and interventions for sustainable development that are youth-sensitive.
Barriers to youth development
For example, lack of investment in youth; gender and spatial inequity and other forms of vulnerability; lack of accountability and corruption.
Policies and programmes that tackle inequalities, youth poverty, corruption.
Knowledge gapsGaps in knowledge on impacts of youth demographic changes in EAC

East African Regional Analysis of Youth Demographics 54
Work Package 1: Literature and Policy Review
The key research questions for this work package are:
2.1.What are the short, medium, and long-term projected needs for basic and critical social services (housing, schooling, primary health care, water, and jobs) to cope with the future youth and working-age population trends in the four EAC countries?
2.2. What lessons can the EAC learn from countries that have reaped the demographic dividend such as those of South East Asia, and from African countries that have not earned a sizeable dividend?
2.3. What are the consequences of “business-as-usual”?
Data Review
We reviewed nationally-representative data sources in each of the four
countries to identify sources for descriptive analysis, exploring inter-
relations between demographic variables and social and economic
variables, and scenario modelling. The major data sources that were
identified include: national censuses, statistical yearbooks, United Nations
databases (such as UN population projections, Human Development
Index), the Demographic and Health Surveys (DHS), national economic
surveys, official administrative data, the World Bank Living Standards and
Measurement Survey (LSMS) programme, and the Multiple Indicator
Cluster Surveys (MICS).
These data were assessed for quality using the following criteria:
a) Clear description of the study design and sampling process;
b) Implemented by a credible organisation such as global data
survey implementers (for example ICF Macro who implement DHS
surveys), a statistics office/bureau, or collected by a government
department;
c) Quality of data – no obvious errors, consistent with previous data
trends, and consistency between indicators (for example fertility
rates and contraceptive use).
d) Cited in major global databases and reports (e.g. UN databases).
Scenario Modelling
We used the open cohort component (CC) projections, which considered
net-migration at the national level and between urban and rural areas
within each country. The target population was young males and females
aged 15-24 and country-specific age-ranges that define “youth”. The
projection period is 2015-2065, to include short (2020), medium (2030)
and long-term (2050) trends. Furthermore, 2063 was included to provide
information for the AU’s Agenda 2063. We derived a set of scenarios,
making assumptions based on comparative historical fertility and mortality
decline observed in South East Asian countries particularly South Korea,
Singapore, Taiwan, and Malaysia where the demographic dividend
has occurred. After a review of the results from different scenarios, we
developed an accelerated model scenario which we compared to the
UN Medium and Low Variant scenarios. The Accelerated Model assumes
that greater investment in education, family planning and health services
can shift the age-patterns of fertility which in turn accelerate overall
fertility decline towards replacement level and increases the survival of
the population across different age groups. For example, investment in
adolescent sexual and reproductive health and services to delay the
onset of childbearing and ensuring universal access to contraception for
all those who need it can significantly accelerate fertility decline (see
Appendix 2 for a fuller discussion). The UN Medium Variant Scenario
can be considered as “Business- as-Usual” where fertility and mortality
are assumed to keep on falling at rates that have been observed in other
countries that are further along in the demographic transition. The Low
Variant Scenario assumes that for most of the projection period, fertility is
about one-birth lower than the Medium Variant Model. In terms of outputs,
our Accelerated Model is very similar to the low variant scenario.
In addition to the open component cohort projections, we used the
DemDiv modelling tool to engage stakeholders in EAC. DemDiv is a
customisable projection model developed by the USAID-funded Health
Policy Project (http://www.healthpolicyplus.com/demdiv.cfm). It is
structured as a two-part model that projects and integrates demographic
and economic changes. The model is scenario and projection-based,
comparing several possibilities for future development against each
other to estimate the varying economic benefits of different combinations
of investments. In particular, the model allows for the design of multiple
scenarios to show how the combined power of policy investments in
family planning, health, education and the economy can generate a
demographic dividend. With its policy-oriented design, DemDiv can be a
powerful advocacy tool to garner support for investments in the youth and
family planning (see further details on DemDiv in Appendix 2). The DemDiv
workshops and reports for Kenya and Uganda predate this project, but
we used the DemDiv process for Tanzania and Rwanda, with additional
support from UNFPA and Pathfinder.
Gender
Throughout the project, we applied a gender lens and provided sex-
disaggregated findings where data exist. The Johns Hopkins’ Gender
Analysis Framework (GAF)91 helped us to apply the gender lens to our
literature and policy reviews. The framework suggests using four main
domains:
a) Access to assets – access to tangible (e.g. land, capital, tools) and
intangible resources (knowledge, education, information);
b) Practices and Participation – separate roles that males and females
have, differences in activities (e.g. economic, political, and social);
c) Beliefs and perceptions – belief systems that determine what

East African Regional Analysis of Youth Demographics 55
it means to be male or female and how this affects behaviour,
participation, and decision-making by males and females;
d) Institutions, laws and policies – formal and informal rights.
Work Package 3 - Recommendations
Recommendations are grouped by stakeholder beneficiaries including the
EAC governments and development partners. These are drawn from the
literature review, our scenario modelling, experiences of the South East
Asian countries and meetings with stakeholders in the four countries. A
Policy uptake report will document the actions and dialogue following our
dissemination activities.
Work Package 4 – Data Visualisation and Communications
Data visualisation products and a strategic communications policy uptake
plan are to be deployed to disseminate the findings and recommendations
of this project. The findings and recommendations are to be presented
using a range of communication methods including animated charts
or infographics which will target the youth in the region, photo-stories,
narrative reports, and policy briefs.
The policy uptake approach aims to increase awareness of and
commitment to multisectoral approaches in generating traction and action
for harnessing the demographic dividend. The communications content
emphasise and advance the dialogue about how the demographic
dividend can improve outcomes for women and youth, including greater
gender equality and youth empowerment, as a core component for
achieving EACs and Africa’s long-term socioeconomic transformation
aspirations.
Our key audience will include:
•DFID advisers and development partners
•Policymakers (government officers and parliamentarians)
•Media (journalists who write on population and development issues)
•Youth, NGOs, CSOs and the general public
Open Cohort Component (CC) Method
Input (base) data
The input data included national (country) and sub-national (urban and
rural) levels. The base year for projection was 2015. In addition, we
considered alternative (back) projections with 2000 as base year to
validate the trends in the last 15 years. The input parameters for the open
CC model include:
• Base year population disaggregated by age and sex
• Sex-specific life tables for the projection period (mortality)
• Age-specific fertility rates for the projection period
• Sex ratio at birth
• Age and sex specific net migration rates
Assumptions
We used the evidence from literature review (WP1) and relevant analysis
of survey data to derive plausible assumptions regarding future changes
in the components of population change. Fertility is the most sensitive
indicator to determine the size of the 15-24 population after 2030. We
considered the effect of female education and employment on actual and
desired fertility. The effect of mortality is likely to be trivial for males in the
youth ages, and of moderate effect for females due to pregnancy-related
mortality. We expect migration to exert some influence on young people
(15-24) at the national and sub-national level, depending on regional
and national economic trends (e.g. employment opportunities, education
attainment).
We explored the following DHS for making assumptions regarding future
changes in fertility and infant and child mortality:
• Kenya (2003; 2008-09; 2014)
• Rwanda (2000; 2005; 2010; 2014-15)
• Tanzania (2004-05; 2010; 2015-16)
• Uganda (2000-01; 2006; 2011)
Fertility
We examined future trends in the level of fertility and potential shifts in age
patterns of child bearing, considering the likely effect of changes in female
education attainment and labour force participation on union formation.
In addition, we examined fertility intentions among young people and the
likely influence of increases in contraceptive use in delaying, spacing and
limiting births.
• Variant scenario 1a: Assume slower shift in age-specific fertility rates
from 2020 onwards for the 10-14, 15-19 and 20-24 age groups
• Variant scenario 1b: Assume medium shift in age-specific fertility
rates from 2020 onwards for the 10-14, 15-19 and 20-24 age
groups
• Variant scenario 1c: Assume faster shift in age-specific fertility rates
from 2020 onwards for the 10-14, 15-19 and 20-24 age groups
Mortality
We considered the likely influence of malaria, maternal mortality, HIV
incidence (vertical transmission) and ARV coverage and potential mortality
attributed to emerging non-communicable and chronic conditions. We
assumed survival ratios across age groups to remain constant until 2030
and modest increase thereafter between 5-15% between 2030 and
2065.
Migration
We assumed constant age-specific net-migration rates at the national level
until 2030 and thereafter assumed gradual increase taking into account
of economic growth, improvement in secondary and tertiary education
attainment rates. We extrapolated the trends in the proportion of urban
population based on moving averages, also reflecting UN migration
assumptions for projecting the growth of cities and urban areas.
APPENDIX 2: Population Projections

East African Regional Analysis of Youth Demographics 56
DEMDIV ModellingIn addition to the open component cohort projections, we applied the
DemDiv modelling tool for our analyses.
DemDiv is a customisable projection model developed by the USAID
funded Health Policy Project (http://www.healthpolicyplus.com/demdiv.
cfm). It is structured as a two-part model that projects and integrates
demographic and economic changes. The model is scenario and
projection-based, comparing several possibilities for future development
against each other to estimate the varying economic benefits of different
combinations of investments. In particular, the model allows for the
design of multiple scenarios to show how the combined power of policy
investments in family planning, health, education and the economy can
generate a demographic dividend. With its policy-oriented design,
DemDiv can be a powerful advocacy tool to garner support for
investments in the youth to harness the full potential of the youth bulge since
it can demonstrate the potential outcomes of various policy decisions that
impact on socio-economic development.
The DemDiv demographic sub-model addresses the linkages between
the determinants of fertility (including contraceptive use, girls’ education
and marriage), fertility, and the impact of fertility on population size and
structure. The economic sub-model uses results from the demographic sub-
model and links these with factors that influence economic productivity to
get key estimates on potential income through GDP per capita, and also
examine the prospects of employment taking into account both population
growth and economic productivity.
DemDiv has been applied in Kenya (2014), Uganda (2014), Tanzania
(2014) and Rwanda (2017) but the assumptions used in the modelling
have been varied and therefore the conclusions are more country specific
and not directly comparative. We will apply the revised population
projections from the open component cohort projections on DemDiv
to derive multiple scenarios which highlight the potential trajectories
and impact of policy and programme investments in education, family
planning, health and economy on generating a demographic dividend.
For each country, we will use a projection period of forty years, with 2015
as our baseline.
Projected population pyramids by 2065 for the four EAC countries under varying scenarios

East African Regional Analysis of Youth Demographics 57
The data analysis was done using Demographic and Health Survey (DHS) data from sub-Saharan countries for surveys conducted between 2000and
2016.
APPENDIX 3: Summary Results on the Association between Fertility and Education, and Fertility and Household Wealth
5.4
3.9
2.72.5
3.5
4.6
5.4
6.0
6.6
0
1
2
3
4
5
6
7
None Primary Secondary Higher Highest Fourth Middle Second Lowest
Education Wealth quintile
Tota
l fer
tility
rate
Average TFR by education and wealth, SS Africa
-100
-80
-60
-40
-20
0
20
40
AN BN BF BU CA
CH
CO
M CO
DC
R CI
ER ET GA
GAM G
H
GU KE LE LI
MA
MW
MAL
MAU
MO
2
NA NI
NIG RW STP
SEG SL
SW TAZ
TOG
UG
A
ZA ZW
Rela
tive
diffe
renc
e (%
)
Relative differences in TFR by education (%), SS Africa
rel change(none-primary) rel change (none-sec) rel change (none-high) rel change (prim-sec) rel change (prim-high)

East African Regional Analysis of Youth Demographics 58
-100
-80
-60
-40
-20
0
20
40
AN BN BF BU CA
CH
CO
MC
OD
CR CI
ER ET GA
GA
MG
HG
U KE LE LIM
AM
WM
AL
MA
UM
O2
NA NI
NIG RW ST
PSE
G SLSW TA
ZTO
GU
GA
ZA
ZW
Rela
tive
diffe
renc
e (%
)
Relative differences in TFR by wealth quintiles (%), SS Africa
Lowest-Second Lowest-Middle Lowest-fourth Lowest-Highest
APPENDIX 4: Key Findings from Population Projections
KENYA 2015-65 Scenario outputs
Baseline UN 2015
UN medium variant UN low variant Accelerated model
2030 2050 2065 2030 2050 2065 2030 2050 2065
Total population ('000s) 47236 66960 95467 114980
64307 85288 95671 66299 89559 103359
Youth population, 15-24 years ('000s) 9509 13344 16730 18202 13344 14046 13781 13346 15511 14494
Youth population, 15-34 years ('000s) 17090 24035 31457 35369 24035 27425 27876 24074 30112 29867
% youth population, 15-24 years 20 20 18 16 21 16 14 20 17 14
% youth population, 15-34 years 36 36 33 31 37 32 29 36 34 29
Child population, 0-14 years ('000s) 19530 23440 27273 28192 20786 21126 18915 22720 22302 21957
Child population, 0-19 years ('000s) 24694 30288 35858 37396 27634 28278 25710 29565 30077 28993
Adult population, 15-64 years ('000s) 26488 41116 61420 74809 41116 57388 64777 41174 60449 69339
Adult population, 20-64 years ('000s) 21323 34268 52835 65605 34268 50237 57981 34329 52673 62303
Old-age population, 65+ years ('000s) 1219 2404 6774 11979 2404 6774 11979 2405 6808 12064
DR1: dependency ratio (per 100 population)
78 63 55 54 56 49 48 61 48 49
DR2: dependency ratio (per 100 population)
122 95 81 75 88 70 65 93 70 66
Total fertility rate (children per woman)
3.8 3.3 2.6 2.3 2.6 2.1 1.8 3.2 2.1 2.0
Under-five mortality rate (per 1000 live births)
51 39 27 22 na na na 33 10 4
Net number of migrants ('000s) -50 -50 -50 -43 na na na -33 -10 -6
Demographic scenarios of youth population comparing the accelerated model with the UN medium and low variant projections

East African Regional Analysis of Youth Demographics 59
TANZANIA 2015-65 Scenario outputs
Baseline UN 2015
UN medium variant UN low variant Accelerated model
2030 2050 2065 2030 2050 2065 2030 2050 2065
Total population ('000s) 53880 83702
138082
186861 80708
124629
158110 80745
120676
151383
Youth population, 15-24 years ('000s) 10444 17012 26439 33714 17012 23229 27245 16986 22898 24104 Youth population, 15-34 years ('000s) 17881 28936 47417 62270 28936 42727 51871 28951 42953 47737 % youth population, 15-24 years 19 20 19 18 21 19 17 21 19 16 % youth population, 15-34 years 33 35 34 33 36 34 33 36 36 32 Child population, 0-14 years ('000s) 24350 34568 49389 58941 31574 40627 43448 31931 36430 39782 Child population, 0-19 years ('000s) 30002 43734 63322 76396 40740 52799 57286 41065 48144 51680 Adult population, 15-64 years ('000s)
27854 46371 82047 11570
8 46371 77357 10245
0 46085 77719 99539 Adult population, 20-64 years ('000s) 22202 37205 68114 98253 37205 65185 88613 36951 66005 87641 Old-age population, 65+ years ('000s) 1676 2763 6646 12212 2763 6646 12212 2729 6526 12062 DR1: dependency ratio (per 100 population) 93 81 68 61 74 61 54 75 55 52 DR2: dependency ratio (per 100 population) 143 125 103 90 117 91 78 119 83 73 Total fertility rate (children per woman) 4.9 4.3 3.4 3.0 3.8 2.9 2.5 4.0 2.6 2.5 Under-five mortality rate (per 1000 live births) 58 45 29 23 na na na 38 11 4 Net number of migrants ('000s) -200 -200 -200 -170 na na na -133 -50 -25
RWANDA, 2015-2065 Scenario outputs
Baseline UN 2015
UN medium variant UN low variant Accelerated model
2030 2050 2065 2030 2050 2065 2030 2050 2065
Total population ('000s) 11630 16024 21886 25257 15403 19580 21025 16032 21516 24870 Youth population, 15-24 years ('000s) 2213 3254 3733 3890 3254 3110 2917 3236 3662 3522 Youth population, 15-34 years ('000s) 4188 5739 7139 7691 5739 6199 6014 5718 7142 7182 % youth population, 15-24 years 19 20 17 15 21 16 14 20 17 14 % youth population, 15-34 years 36 36 33 30 37 32 29 36 33 29 Child population, 0-14 years ('000s) 4745 5410 5933 5584 4789 4567 3623 5430 5408 5318 Child population, 0-19 years ('000s) 5952 7098 7852 7516 6477 6153 5030 7108 7251 7031 Adult population, 15-64 years ('000s) 6558 9883 14303 16835 9883 13364 14564 9865 14421 16619 Adult population, 20-64 years ('000s) 5351 8195 12385 14902 8195 11778 13158 8188 12579 14906 Old-age population, 65+ years ('000s) 327 731 1649 2838 731 1649 2838 736 1687 2932 DR1: dependency ratio (per 100 population) 77 62 53 50 56 47 44 63 49 50 DR2: dependency ratio (per 100 population) 117 96 77 69 88 66 60 96 71 67 Total fertility rate (children per woman) 3.8 3.2 2.4 2.0 2.7 1.9 1.5 3.2 2.1 2.0 Under-five mortality rate (per 1000 live births) 55 43 29 22 na na na 34 10 4 Net number of migrants ('000s) -45 -45 -45 -41 na na na -33 -13 -6

East African Regional Analysis of Youth Demographics 60
UGANDA 2015-65 Scenario outputs
Baseline UN 2015
UN medium variant UN low variant Accelerated model
2030 2050 2065 2030 2050 2065 2030 2050 2065
Total population ('000s) 40145
63842
105698
141153
61606
95574
119662
63245
99980
130645
Youth population, 15-24 years ('000s) 8187
13296 20934 25806
13296
18520 20911
13374
19778 21742
Youth population, 15-34 years ('000s) 13582
22668 37588 48111
22668
34098 40276
22774
36335 42408
% youth population, 15-24 years 20 21 20 18 22 19 17 21 20 17 % youth population, 15-34 years 34 36 36 34 37 36 34 36 36 32 Child population, 0-14 years ('000s)
19361 2772
9 38102 43647 2549
2 3146
8 32084 2688
7 3266
9 37681 Child population, 0-19 years ('000s)
23848 3486
8 49076 56947 3263
2 4111
7 42640 3407
4 4286
7 48505 Adult population, 15-64 years ('000s)
19911 3467
5 63643 89469 3467
5 6015
3 79541 3489
5 6315
9 84366 Adult population, 20-64 years ('000s)
15424 2753
6 52669 76168 2753
6 5050
4 68985 2770
7 5296
0 73542 Old-age population, 65+ years ('000s) 873 1439 3953 8037 1439 3953 8037 1464 4153 8598 DR1: dependency ratio (per 100 population) 102 84 66 58 78 59 50 81 58 55 DR2: dependency ratio (per 100 population) 160 132 101 85 124 89 73 128 89 78 Total fertility rate (children per woman) 5.5 4.6 3.4 2.8 4.1 2.9 2.3 4.5 2.9 2.8 Under-five mortality rate (per 1000 live births) 90 67 39 29 na na na 55 16 7 Net number of migrants ('000s) -150 -150 -150 -128 na na na -100 -38 -19
DR1: population aged 0-14 plus 65+ divided by population aged 15-64 DR2: population aged 0-19 plus 65+ divided by population aged 20-64na: not applicable
-0.2
-0.15
-0.1
-0.05
0
0.05
0.1
0.15
0.2
0.25
1970 1975 1980 1985 1990 1995 2000 2005 2010 2015 2020 2025 2030 2035 2040 2045 2050
Rate of change in the theoretical support ratio (Producers 20-64 years to Dependents 0-19 and 65+ years)
Tunisia South Africa China South Korea Malaysia Vietnam
APPENDIX 5: The Demographic Window of Opportunity for Developing Countries in Advanced Demographic Transition

East African Regional Analysis of Youth Demographics 61
APPENDIX 6: DemDiv Demographic Dividend Modelling Policy Scenarios and Variables for Kenya, Rwanda, Tanzania, and Uganda
Policy Scenario Kenya
Ref Year
INTERVENTION POLICY AREA
Education Family Planning Economic
Expected YearsMean Years of
SchoolingModern
ContraceptivePrevalence
Rate11
LabourMarket
Flexibility
ICTUse12
FinancialMarket
Efficiency
PublicInstitutions
Importsas % of
GDPFemale Male Female Male
KENYA
Baseline 2010 11.0 11.0 5.4 7.1 39.4 4.7 1.9 3.9 3.5 42.6
Business as Usual
2050 11.0 11.0 5.4 7.1 39.4 4.7 1.9 3.9 3.5 42.6
Economic Emphasis
2050 11.0 11.0 5.4 7.1 39.4 4.9 5.0 4.9 4.7 29.8
Economic & Education Emphasis
2050 16.0 16.0 11.0 11.3 39.4 4.9 5.0 4.9 4.7 29.8
Combined Economic & FP/Education Emphasis
2050 16.0 16.0 11.0 11.3 70.0 4.9 5.0 4.9 4.7 29
Baseline Data Source
UN Stats Division Table 4e, Dec 20X12 update. Data for 2009/ Barro and Lee
DHS 2008-09 World Economic Forum, Global Competitiveness Report 2013-2014
RWANDA
Baseline 2015 11.0 11.0 3.3 4.4 47.5 5.2 1.2 3.8 5.5 35.0
Business as Usual
2055 12.0 12.0 5.0 5.9 52.4 5.4 2.0 4.0 5.6 35.0
Economic Emphasis
2055 12.0 12.0 5.0 5.9 52.4 6.1 5.3 5.0 6.1 35.0
FP & Education Emphasis
2055 14.0 14.0 12.0 12.0 72.2 5.4 2.0 4.0 5.6 35.0
Combined Economic & FP/Education Emphasis
2055 14.0 14.0 12.0 12.0 72.2 5.4 2.0 4.0 5.6 35.0
Baseline Data Source
NISR Calculated from Census 2012 RwandaDemographicand HealthSurvey,2014/15
World Economic Forum, Global Competitiveness Report 2015–2016/ NISR GDP publications 2016

East African Regional Analysis of Youth Demographics 62
Policy Scenario
Ref Year
INTERVENTION POLICY AREA
EducationFamily Planning Economic
Expected YearsMean Years of
Schooling
Female Male Female MaleModern
Contraceptive rate
Labour Market
Flexibility
ICT Use
Financial Market
Efficiency
Public Institution
Imports as % of
GDP
TANZANIA
Baseline 2015 8.3 9.3 5.4 6.2 32.0 4.5 1.1 3.1 3.5 21.4
Business as Usual
2055 10.1 10.8 7.1 7.4 41.6 4.7 2.1 3.5 3.7 24.6
Economic Emphasis
2055 10.1 10.8 7.1 7.4 41.6 5.00 4.5 4.4 4.2 32.2
Economic & Education Emphasis
2055 14.3 14.4 10.9 10.1 41.6 5.00 4.5 4.4 4.2 32.2
Combined Economic & FP/Education Emphasis
2055 14.3 14.4 10.9 10.1 64.0 5.00 4.5 4.4 4.2 32.2
Baseline Data Source
UN Human Development Report, 2016
DHS 2014/15World Economic Forum, Global Competitiveness Report 2015-2016, 2015 Data
UGANDA
Baseline 2011 11.3 12.8 3.7 6.2 20.7 5.3 1.4 3.5 3.4 40.6
Business as Usual
2040 12.5 13.8 5.4 7.3 36.0 5.3 2.5 3.7 3.7 50.0
Economic Emphasis
2040 12.5 13.8 5.4 7.3 36.0 5.9 5.0 4.2 4.4 30.0
Economic Emphasis & Moderate FP/Education)
2040 13.3 14.4 6.5 8.0 45.0 5.9 5.0 4.2 4.4 30.0
Combined Economic & FP/Education Emphasis
2040 15.3 16.0 9.4 9.9 67.1 5.9 5.0 4.2 4.4 30.0
Baseline Data Source
Uganda National HH Survey 2009/10 UNDP-Human Development Report-2016
DHSs 2011- 2015/16
World Economic Forum, Global Competitiveness Report 2013-2016
11Married women only12ICT use constitutes the number of fixed broadband internet subscriptions per 100 people, internet bandwidth (kb/s per user) and the active mobile broadband subscriptions per 100 persons. It measures the agility with which an economy adopts existing technologies to enhance the productivity of its industries, with specific emphasis on its capacity to fully leverage information and communication technologies (ICTs) in daily activities and production processes for increased efficiency and enabling innovation for competitiveness.13The component measures effective functioning of public institutions.

Policy Scenario
Ref Year
INTERVENTION POLICY AREA
EducationFamily Planning Economic
Expected YearsMean Years of
Schooling
Female Male Female MaleModern
Contraceptive rate
Labour Market
Flexibility
ICT Use
Financial Market
Efficiency
Public Institution
Imports as % of
GDP
TANZANIA
Baseline 2015 8.3 9.3 5.4 6.2 32.0 4.5 1.1 3.1 3.5 21.4
Business as Usual
2055 10.1 10.8 7.1 7.4 41.6 4.7 2.1 3.5 3.7 24.6
Economic Emphasis
2055 10.1 10.8 7.1 7.4 41.6 5.00 4.5 4.4 4.2 32.2
Economic & Education Emphasis
2055 14.3 14.4 10.9 10.1 41.6 5.00 4.5 4.4 4.2 32.2
Combined Economic & FP/Education Emphasis
2055 14.3 14.4 10.9 10.1 64.0 5.00 4.5 4.4 4.2 32.2
Baseline Data Source
UN Human Development Report, 2016
DHS 2014/15World Economic Forum, Global Competitiveness Report 2015-2016, 2015 Data
UGANDA
Baseline 2011 11.3 12.8 3.7 6.2 20.7 5.3 1.4 3.5 3.4 40.6
Business as Usual
2040 12.5 13.8 5.4 7.3 36.0 5.3 2.5 3.7 3.7 50.0
Economic Emphasis
2040 12.5 13.8 5.4 7.3 36.0 5.9 5.0 4.2 4.4 30.0
Economic Emphasis & Moderate FP/Education)
2040 13.3 14.4 6.5 8.0 45.0 5.9 5.0 4.2 4.4 30.0
Combined Economic & FP/Education Emphasis
2040 15.3 16.0 9.4 9.9 67.1 5.9 5.0 4.2 4.4 30.0
Baseline Data Source
Uganda National HH Survey 2009/10 UNDP-Human Development Report-2016
DHSs 2011- 2015/16
World Economic Forum, Global Competitiveness Report 2013-2016