
Airwheel Intelligent twin-wheel scooter Eases Commuters on and off Duty
C H I N A
Environment and Social Development — East Asia and Pacific Region
D i s c u s s i o n P a p e r s
Water Quality Management—
Policy and Institutional
Considerations
September 2006
Environment and Social Development
East Asia and Pacific Region
THE WORLD BANK
1818 H Street, N.W.
Washington, D.C. 20433, USA
Telephone: 202 473 1000
Facsimile: 202 522 1666
Web Sites: worldbank.org/eapenvironment
worldbank.org/eapsocial


C H I N A W A T E R
Q U A L I T Y M A N A G E M E N T
Policy and Institutional Considerations
September 2006

Th is publication is available online at <<www.worldbank.org/eapenvironment>>.
Front cover photo, Bob Sacha Photography.
Environment and Social Development DepartmentEast Asia and Pacifi c RegionTh e World BankWashington, D.C.
September 2006
Th is volume is a product of the staff of Th e World Bank. Th e fi ndings, interpretations, and conclusions expressed in this paper do not necessarily refl ect the views of the Executive Directors of Th e World Bank or the governments they represent. Th e World Bank does not guarantee the accuracy of the data included in this work. Th e boundaries, colors, denominations, and other information shown on any map in this work do not imply any judgment on the part of Th e World Bank concerning the legal status of any territory or the endorsement or acceptance of such boundaries.
Th e material in this publication is copyrighted. Copying and/or transmitting portions or all of this work without permis-sion may be a violation of applicable law. Th e World Bank encourages dissemination of its work and will normally grant permission to reproduce portions of the work promptly.
For permission to photocopy or reprint any part of this work, please send a request with complete information to the Copyright Clearance Center, Inc., 222 Rosewood Drive, Danvers, MA 01923, USA, telephone 978-750-8400, fax 978-750-4470, www.copyright.com.
All other queries on rights and licenses, including subsidiary rights, should be addressed to the Offi ce of the Publisher, Th e World Bank, 1818 H Street NW, Washington, DC 20433, USA, fax 202-522-2422, e-mail [email protected].

– iii –
Contents
Foreword vii
Acknowledgments ix
Abbreviations and Acronyms xi
Executive Summary xiiiDrivers in the economy and China’s natural conditions impact water quality xiiiPolicy and institutional capacity: ensure the impact of an already expanded regulatory framework xivPast Government interventions lacked strong continuity xivPriorities for Focus: the need for increased cooperation between sectors xv
Introduction 1Context and Objectives of the Report 1Methodology 1Structure of the Report 2
Chapter . General Water Resource Situation 3Population, Urbanization, and Growth 3River Basins 4Water Availability 5Water Use 6Urban Water Supply 8Water Quality 8Emissions 12Summary of Findings 15
Chapter . Policy and Institutional Issues 19Legislation and Policy Instruments 19Institutional Framework 24

Financing Water Pollution Management 28Water Pollution Management Case Studies 29
Chapter . Toward a Future WPM Policy in China 33Introduction 33Basic Condition and Major Features of Water Management in China 33Focusing on Strategic Planning 35Adjusting Policy and Regulations 36Integrated Water Resources Management 36Strengthening Economic Instruments 37Strengthening Financing 37Urban Pollution Management 38Industrial Pollution 39Agricultural Pollution 40Improving Water Quality Monitoring 40Planning and Capacity Building 42Environmental Awareness and Public Participation 43
Annex . Trends in River Water Quality 45
Annex . Relevant World Bank Projects 49
References 53
Boxes
1.1. Drinking Water Trends in China 71.2. Water Transfer Projects 142.1. China Pollution Levy System Reform 20 3.1. Water Pollution Management in Transition Economies—Experiences from Central and Eastern Europe 343.2. Th e European Union—Water Framework Directive 353.3. Financing and Use of Economic Instruments in Central and Easter European Countries 383.4. Designing Water Quality Monitoring Systems 413.5. European Union—Water Framework Directive Monitoring Program 42
Figures
1.1. Total, Rural, and Urban Population, 1980–2020 (million) 41.2. National Distribution of Water in China’s River Systems 61.3. Trends in Water Consumption 1997–2005 (billion m3) 61.4. Urban and Rural Water Consumption Rates 71.5. Urban Water Supply Statistics (1978–2003) 81.6. Environmental Monitoring Stations in the Main River Systems 91.7. Surface Water Quality Levels 2004 101.8. General State of Water Quality in the Main River 10
Policy and Institutional Considerations
v
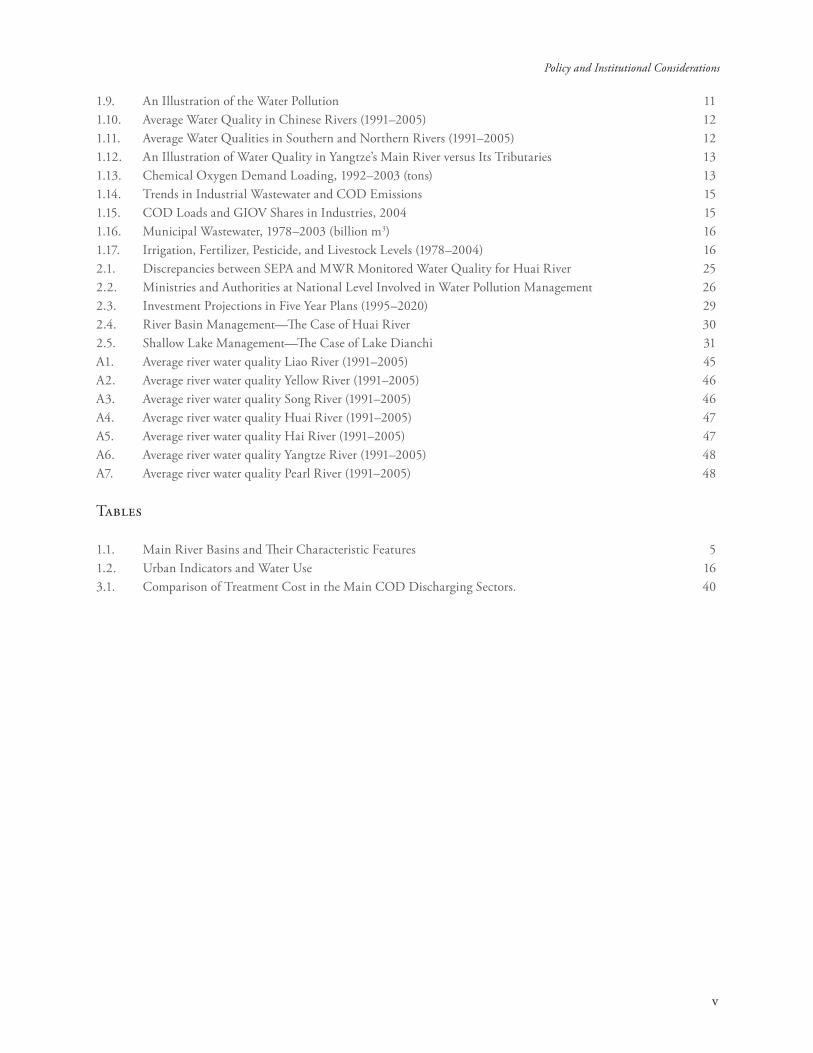
1.9. An Illustration of the Water Pollution 111.10. Average Water Quality in Chinese Rivers (1991–2005) 121.11. Average Water Qualities in Southern and Northern Rivers (1991–2005) 121.12. An Illustration of Water Quality in Yangtze’s Main River versus Its Tributaries 131.13. Chemical Oxygen Demand Loading, 1992–2003 (tons) 131.14. Trends in Industrial Wastewater and COD Emissions 151.15. COD Loads and GIOV Shares in Industries, 2004 151.16. Municipal Wastewater, 1978–2003 (billion m3) 161.17. Irrigation, Fertilizer, Pesticide, and Livestock Levels (1978–2004) 162.1. Discrepancies between SEPA and MWR Monitored Water Quality for Huai River 252.2. Ministries and Authorities at National Level Involved in Water Pollution Management 262.3. Investment Projections in Five Year Plans (1995–2020) 292.4. River Basin Management—Th e Case of Huai River 302.5. Shallow Lake Management—Th e Case of Lake Dianchi 31A1. Average river water quality Liao River (1991–2005) 45A2. Average river water quality Yellow River (1991–2005) 46A3. Average river water quality Song River (1991–2005) 46A4. Average river water quality Huai River (1991–2005) 47A5. Average river water quality Hai River (1991–2005) 47A6. Average river water quality Yangtze River (1991–2005) 48A7. Average river water quality Pearl River (1991–2005) 48
Tables
1.1. Main River Basins and Th eir Characteristic Features 51.2. Urban Indicators and Water Use 163.1. Comparison of Treatment Cost in the Main COD Discharging Sectors. 40


– vii –
Foreword
China’s economy has grown rapidly since the nation entered the reform path in 1979, and particularly since the industrial expansion started in the mid-1980s. Over
the last decades, China—which had been stricken with heavy poverty, severe production ineffi ciencies, and almost a standstill in economic development for over a generation prior to the reform—has become the forth largest economy in the world. Th is is an impressive achievement. Rapid growth, however, has been accompanied by considerable environmental side eff ects, one of the gravest of which is deteriorated water quality in large parts of the country’s extensive water systems.
In our dialogue, the Government of China (GoC) has frequently raised the important challenge of water pol-lution management (WPM). Discussions focused on
how China can expand WPM instruments, what kind of institutional systems need to be in place in order to ensure effi cient enforcement of new instruments, what investments are needed in order to eff ectively improve water quality, and how China can learn from relevant international experience.
Th is report refl ects some of the critical WPM challenges China is facing. It reviews recent trends, institutional arrangements, and some of the WPM instruments that have been applied over the last decade. Based upon international experiences, it points to factors China may take into account when revising her WPM policies. As part of a larger eff ort to work with key counterparts to address critical issues aff ecting water resource and environmental manage-ment, this report is aimed at generating constructive discussions among policy makers.
Magda LoveiSector Manager
Environment and Social Development UnitEast Asia and the Pacifi c


Acknowledgments
– ix –
This report is the result of work prepared by the World Bank and the Government of China, in particular the State Environ-mental Protection Administration (SEPA)
and the Ministry of Water Resources. Th e work was managed by Jostein Nygard, Senior Environmental Specialist, under the guidance of Magda Lovei, Sector Manager, Environment and Social Development Unit at the East Asia and Pacifi c Region (EASES) of the World Bank. Th e study team consisted of Erik Boerset, Water Resource Specialist, Multiconsult; Laszlo Somlyody, Professor, Budapest University of Technology and Economics; Ge Chazhong, Research Fellow, Th e Environmental Planning Institute (EPI) of the Chinese Academy for Environmental Planning (CAEP); He Liping, Engineer, Yunnan Institute of Environmental Science; and Wang Jinnan, Vice President, CAEP. Andrew Murray and Marija Kuzmanovic, Junior Professional Associates at EASES provided signifi cant contributions to the fi nalization of the paper. Th e team is grateful for the
support and encouragement by Liu Hongzhi, Director General, Department of Pollution Control, SEPA; Xie Yongming, Senior Engineer, Wang Xin, Senior Project Offi cer, and Yu Lan, Project Offi cer, all from Foreign Economic Cooperation Offi ce (FECO), SEPA. We also thank Tan Bingqing, Senior Engineer, Bureau of Water Resources, Bengbu City; and Zhang Yong, Researcher, Center for Environmental Sciences, Beijing University. Useful comments on the report were received from Greg Browder (EASUR), Doug Olson (EASRD) and David Hanrahan (peer review-ers) as well as from Hubert Jenny (EASUR), Steven Mink (EASRD), Andres Liebenthal and Jian Xie (EASES). Th e report was edited by Robert Livernash (consultant). Grammarians, Inc. did the design and managed the typesetting. Production was managed by Long Wen Graphic Design in Beijing. Bob Sacha Photography provided the cover photo and Erik Borset the photos within the report. Financial support was provided by the governments of Norway and Finland through the TFESSD Program.

– xi –
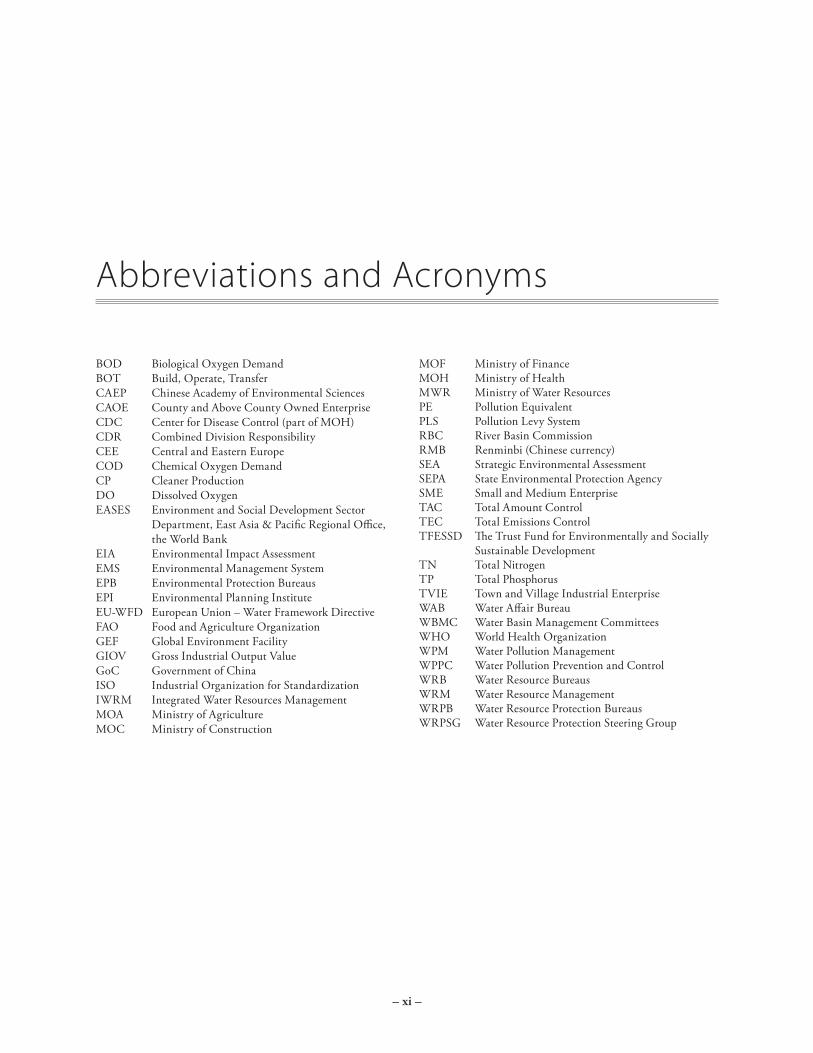
Abbreviations and Acronyms
BOD Biological Oxygen DemandBOT Build, Operate, TransferCAEP Chinese Academy of Environmental SciencesCAOE County and Above County Owned EnterpriseCDC Center for Disease Control (part of MOH)CDR Combined Division ResponsibilityCEE Central and Eastern EuropeCOD Chemical Oxygen DemandCP Cleaner ProductionDO Dissolved OxygenEASES Environment and Social Development Sector Department, East Asia & Pacifi c Regional Offi ce, the World Bank EIA Environmental Impact AssessmentEMS Environmental Management SystemEPB Environmental Protection BureausEPI Environmental Planning InstituteEU-WFD European Union – Water Framework DirectiveFAO Food and Agriculture OrganizationGEF Global Environment Facility GIOV Gross Industrial Output ValueGoC Government of ChinaISO Industrial Organization for Standardization IWRM Integrated Water Resources ManagementMOA Ministry of AgricultureMOC Ministry of Construction
MOF Ministry of FinanceMOH Ministry of HealthMWR Ministry of Water ResourcesPE Pollution EquivalentPLS Pollution Levy SystemRBC River Basin CommissionRMB Renminbi (Chinese currency)SEA Strategic Environmental AssessmentSEPA State Environmental Protection AgencySME Small and Medium EnterpriseTAC Total Amount ControlTEC Total Emissions ControlTFESSD Th e Trust Fund for Environmentally and Socially Sustainable DevelopmentTN Total NitrogenTP Total PhosphorusTVIE Town and Village Industrial EnterpriseWAB Water Aff air BureauWBMC Water Basin Management CommitteesWHO World Health Organization WPM Water Pollution ManagementWPPC Water Pollution Prevention and ControlWRB Water Resource BureausWRM Water Resource ManagementWRPB Water Resource Protection BureausWRPSG Water Resource Protection Steering Group


– xiii –
Executive Summary
Drivers in the economy and China’s natural
conditions impact water quality
Trends in water quality in China’s extensive water systems can to a large extent be explained by the drivers in the economy, the nation’s geological and hydrological
conditions, and by patterns of water use. Th ese factors include a slight reduction in rural population share—from 58 percent in 1978 to 57 percent in 2005—and a strong increase in the absolute urban population—from 172 in 1978 to 562 million in 2005. Th e most dynamic urbanization took place at the lower urban levels (small cities, town and townships), which had limited investment capacities compared to larger cities. Th ese trends resulted in continued high water demand from agriculture in absolute terms and expanded water demand from industry and residential users.
Th ere are striking diff erences in socioeconomic, climatic, morphological, and hydrological conditions between the South and the North. In the many water-scarce provinces in the North, average annual per capita water availability is less than one-tenth of the world average. Inter-annual and seasonal variations in rainfall exacerbate these diff erences, also resulting in droughts and fl ooding. Th ese factors have contributed to a serious degradation in China’s overall water quality. In the almost 500 sections of China’s main river systems that are monitored for water quality, about one-third have water quality with very limited or no functional use, and only 28 percent have water suitable for drinking. A thorough review of all monitoring data over a 15-year period (made available by
China’s National Monitoring Center) reveals that there are hardly any improvements, particularly in the most critical rivers in the North. Th e core fact is that in the North, 40 to 60 percent of the region’s water is continu-ously in the non-functional water classifi cation categories.
Historically, industrial pollution was the main contributor to the increased pollution load. Although these industrial pollution sources have to some extent stabilized or even been reduced, the study shows that urbanization has partially off set these improvements. For example, the 10th fi ve-year plan’s (2001-2005) review of water pollution control performance indi-cates that it is the residential water pollution control objectives that are most off target.
Water pollution patterns vary among China’s water systems. Most of the systems are characterized by a combination of organic concentrations (biological oxygen demand and chemical oxygen demand), nutrients (ammonium nitrate concentrations), and various forms of heavy metals (lead, mercury, cadmium, etc), particularly in the tributaries. While high organic concentrations, particularly high COD loads, are a critical factor in poor water quality, it also appears that increased agricultural activities and increased urbanization is resulting in signifi cantly higher ammonia nitrate concentrations. Today, with the exception of the Yangtze River, all major rivers have excessively high ammonia nitrate concentrations.
Patterns of water pollution are thus being driven by the development of several sectors, suggesting that

China Water Quality Management
xiv
China is up against a very complex challenge that needs multiple interventions.
Policy and institutional capacity:
ensure the impact of an already expanded
regulatory framework
Over the last 30 years or more, China has established a rather vigorous water pollution control system with an extensive set of institutions, a variety of legislation and policy instruments, and quite comprehensive investment plans that were largely shaped within the traditional fi ve-year plan preparation process. In the earlier phases, water pollution control was characterized mostly by command and control instruments (indus-trial permit systems, simultaneous control programs) and partly by economic instruments (like pollution levy fees and discharge permits). In recent years, there has been a gradual increase in voluntary approaches (such as environmental management systems like ISO 14,000 and cleaner production) and public disclosure.
Th is report shows, however, that these instruments have severe fl aws, even with the expansion in applying new policy instruments. Th e actual impacts appear to be limited, as shown by the fact that ambient water quality has stayed about the same or even worsened in some areas. For the eight instruments that were reviewed, the report identifi ed a set of barriers and challenges that need to be addressed.
At the institutional level, there is often a lack of horizontal and vertical coordination, and inter-agency communication is generally poor. Agencies often duplicate tasks and responsibilities, which is not only ineffi cient, but also results in inconsistencies. For example, there are discrepancies in water quality monitoring techniques and fi ndings between the State Environmental Protection Agency (SEPA) and the Ministry of Water Resources (MWR). Th e lack of clarity in the roles and responsibilities of diff erent agencies is particularly apparent in emerging fi elds, such as cross-boundary river basin management and urban and agricultural non-point source management.
Th e regulatory system is incomplete and complicated, which results in lack of integration and effi ciency in implementation and enforcement. Pollution manage-ment policies overemphasize the role of government
agencies at the expense of the private sector and civil society, and they do not take full advantage of market-based economic instruments. Further confl icts of interest and monitoring diffi culties have undermined the level of rigor with which existing regulations and policies are applied. A common issue, for example, is the inability of Environmental Protection Bureaus (EPBs) to enforce their mandate when it is in confl ict with local development plans, which has led to widespread noncompliance with Environmental Impact Assessment (EIA) regulations.
Past Government interventions lacked
strong continuity
Th e Government of China has taken several steps toward improving water resource management. Government interventions and investments in water pollution management (WPM) throughout the 9th (1996-2000) and 10th fi ve-year plan (2001-2005) periods have resulted in some gains, such as the declines in industrial COD loads and the apparent leveling off of wastewater emissions. Furthermore, up-to-date and market-oriented pollution management policies, such as initial water pricing systems and a more comprehensive pollution charge framework, are starting to emerge. However, much more needs to be done to meet the existing and new management chal-lenges. Achieving more eff ective regulations, policies, monitoring, and enforcement require strengthening institutional capacity, particularly the mandate of local environment bodies. In addition, inter-provincial pollution and complicated upstream/downstream interactions underline the need for eff ective river basin planning, an approach that was fully endorsed at the legislative level in the Water Law of 2002.
Signifi cant gains in water supply and eff ective pollu-tion management will also require substantial fi nancial investments. While investments in water resource management are currently on the rise in China, particularly in the larger municipal cities in the East, they are still small compared to the funding needed to eff ectively deal with water pollution problems. Moreover, the government remains the main source of funding, with little contribution from other sources. A major reason for the absence of private investment is the lack of adequate mechanisms and conditions for loan repayment. Th is means that a successful water

Policy and Institutional Considerations
xv
resource management plan must also incorporate strategies for increasing funding, diversifying funding sources, and prioritizing objectives.
Priorities for Focus: the need for increased
cooperation between sectors
Th e Government of China recognizes the need for more eff ective management of its water resources. Water resource management issues are given a high priority in the 2006-2010 fi ve-year plan. Among the many WRM issues that the government must address, priorities include (a) ensuring water availability in water-scarce areas; (b) providing a clean supply of water in order to reduce the heavy burden of water-related illness; (c) treating wastewater, with a focus on the impact on receiving water bodies; (d) rehabilitating the heavily polluted water bodies that are critical for local com-munities; and (e) protecting drinking water sources.
Th e unique nature of China’s water resource manage-ment issues means that there is no “model country” that can be used as a reference point for describing optimal water pollution management solutions. However, large federal countries such as the United States, and supra-national bodies such as the European Union, may provide useful lessons. Th e current analysis highlights the need for an overall strategic plan for water pollution management that establishes a long-term vision and realistic targets for fi ve-year plans over the next 20 to 30 years. Such a strategy would support the implementation of a phased development plan that systematically identifi es next steps through identifi cation of cost-eff ective priorities.
Improvements in the legal structure pertaining to water pollution management, particularly a reduction in the number of laws and the extent of overlap and contradiction, are needed to establish a comprehensive and simplifi ed system. Revised instruments should be established around long-term effl uent and ambient standards for industry and municipalities, as well as the gradual introduction of economic instruments, including fees and fi nes, and voluntary instruments.
While acknowledging the progress that China has made, particularly in tackling several forms of industrial pol-lution, there is a need to plan ahead for future develop-ments in urban and industrial emissions. Both sectors are
rapidly changing, and planners need to consider medium and long-term projections, as well as new technology, before deciding on investment plans. Additionally, chang-ing agricultural practices are having a big impact on water quality, as discharges of nutrients and organic material lead to eutrophication of water bodies.
International experience has shown that regulating emissions in agriculture is more diffi cult than in other sectors. Th e fi rst step is to establish reliable load estimates, which can be used as a basis for developing a strategy for agricultural pollution management. At-tractive options—which also benefi t farmers—include fertilizer planning and integrated pest management. Th e government should also consider adjusting the level of subsidies for fertilizers.
Establishing an eff ective framework for integrated water resources management should be a priority on the government’s water resource management agenda. Over the long term, the Government of China should prepare the legal framework—or umbrella legisla-tion—to accommodate the development of manage-ment plans at the river basin level. Such a measure would require a number of institutional changes and should include consideration of water re-use and cascade management approaches.
Th ere is also a need for improved monitoring of drinking water quality. Drinking water supply and monitoring is currently overseen by several diff erent agencies, including MWR, SEPA, the Chinese Center for Disease Control under the Ministry of Health, and the Ministry of Construction. Although there may be a need for splitting responsibilities between urban and rural areas, the current lack of coordination between the agencies has left signifi cant information gaps about the actual drinking water situation.
Other important areas for attention include the development of an eff ective monitoring system, which should be of a reliable standard and harmonized across relevant bodies. Finally, in order to eff ectively manage its water resources and reduce pollution levels, the Government of China must generate a greater level of environmental awareness and sense of responsibility among the general public. Th is will require environ-mental education initiatives and more transparent information on emissions and water quality.


– 1 –
Introduction
Context and Objectives of the Report
This work was initiated at the request of the Government of China (GoC) and fi ts into a broader package of analytical and invest-ment support that the Bank is providing for
China’s water resource management. Previous Bank-supported analytical work highlighting the urgency of water pollution issues includes China: Air, Land, and Water; Environmental Priorities for a New Millennium. In addition, the importance of this issue was confi rmed in the Bank’s China Country Assistance Strategy (2003–05 and 2006–10).
Th e World Bank and GoC are currently undertak-ing or planning numerous projects to address the management and pollution issues raised in this report. Annex 1 provides an outline of these ongoing World Bank projects. At the same time, GoC is including a major water resource management component in its 11th 5-year plan (2006–10). In this context, this report is aimed at (a) providing technical guidance for ongoing and future World Bank investment projects
that include water management and pollution control components; and (b) providing the international water resource management community with an accessible source of up-to-date information on the nature of China’s water pollution management challenges.
Th is study capitalizes on the long-term collaborative relationships between the World Bank and representatives from a number of diff erent institutes, including the State Environmen-tal Protection Agency (SEPA), the Ministry of Water Resources (MWR), the Ministry of Construction (MoC), and the Ministry of Agricul-ture (MoA). Th e fi nal report is the product of collaboration among international experts,
several Chinese researchers, and World Bank specialists.
Methodology
Th is report analyzes China’s water pollution situation in both inland rivers and lakes. It provides a detailed picture of the water pollution situation, as well as an assessment of current policy instruments, institutional,
Along Diance Lake
China Water Quality Management
2
and investment structures, of which these three components have formed the analytical framework for the report. It briefl y refers to the pollution and management situation, using examples such as the Huai River and Dianchi Lake. To add some inter-national perspective, it includes lessons learned and experience from water pollution management in other countries. Th e report also provides guidance to help prioritize initiatives in this sector.
Th e methodology used in this study included the collation of various sources of information to generate a detailed picture of pollution levels and the policy/institutional environment, and detailed analysis by international experts. To gather baseline information, we conducted an extensive literature review of previous studies and databases.
Th e Huai River Basin and Dianchi Lake catchments were used as case studies. Th e Huai River basin is one of the seven largest river basins in China and has been seri-ously polluted, particularly since the early 1990s. Th e river crosses several provinces and districts and can thus be classifi ed as a “transboundary” river. After laborious work for better pollution management, water quality in the Huai River improved for a period of time. Th e fi rst regulation for pollution management was enforced in
this river basin. Th e Huai case is used to demonstrate a number of Chinese river basin management options.
Dianchi Lake is situated to the south of Kunming City in Yunan Province. Th e major factors that contributed to the long-term pollution and eutrophication of the lake were rapidly increasing municipal sewage discharges and agricultural non-point sources. Th e lake exemplifi es one of the gravest examples of water pollution impacts on lakes in China and is highly prioritized by the GoC.
Structure of the Report
Th e paper is organized as follows. Chapter 1 describes the general water resource situation with reference to water availability, river systems, water quality, and emissions. Chapter 2 provides an assessment of water pollution management’ in terms of (a) legislation and policy instru-ments; (b) the institutional framework; and (c) fi nancing. Chapter 3 then provides a framework of priorities and recommendations for reforming water pollution manage-ment systems and improving water resource management in China, including references to international experience and lessons learned in other parts of the world.

– 3 –
Population, Urbanization, and Growth
Population Growth. China has the world’s largest population, 1.3 billion people, representing just over one-fi fth of the global total. Th e country’s demography has been heavily
infl uenced by govern-ment policies over the last 25 years, and the population growth rate is now only 0.6 percent. Th e leveling-off that is occurring in China’s population statistics is shown in Figure 1.1 below.
Urbanization. Th e fi gure above also shows the develop-ment of China’s rural and urban populations. Th e level of urbanization is striking. In 1980, the proportion of urban dwellers constituted less than 20 percent of the population, in 2000 it was 36 percent, and by 2020 it is projected to be 54 percent. Th e growing urban popula-tion has been accommodated through rapid expansion of existing cities and the emergence of new cities; the total number of cities in China increased from 190 in 1978 to 663 in 2000, and have leveled off since then (table 1.2).
1. General Water Resource Situation
A critical feature of China’s urbanization since the early 1980s has been the expansion at the sub-city level, particularly in categories such as “small cities,” “established towns,” and “township concentrations.” From 1985 to 2004, the number of established towns increased from less than 8,000 to almost 18,000,
accounting for a non-agricultural popula-tion of 63.5 million people. Between 1990 and 2004, the established towns category increased by about 14.5 million people, which represents almost a seven-fold increase. By 2004, China’s total non-agricultural population below the city level was about 100 million, and about 44 percent of
China’s total urban (non-agricultural) population was living in small cities, established towns, or township concentrations. In essence, these statistics indicate that the strongest drive for China’s rapid urbanization comes primarily from the lower levels below the cities. Th e increase in urbanization results in a rising demand for water from the established water supply system and an increase in water pollu-tion in the short run.
Lighters on the Huai River

China Water Quality Management
4
Economic Development. China is experiencing rapid economic development. GDP grew by 9.4 percent in 2004. Initial information indicates it was 8.3 percent in 2005 and will be about 7.5 percent in 2006. Rapid economic growth has brought about signifi cant improvements in the standard of living for many Chinese, but it is generating increasing levels of demand for water. By relating water demand projections to expected sector growth, projections indicate that this growth will lead to an increase in water demand of 6.5, 32, and 35 percent (2003–2020) from agriculture, industry, and residential users respectively (Chinese Academy for Environmental Planning, 2004). Th ese fi gures imply that a total increase in demand for water of 83 billion m3 will be essential if China is to maintain its current pattern of economic growth. However, with a relatively constant water supply, the increased water demand will have to be met mainly through water savings and improved water quality.
River Basins
China has nine main river basins.
i) Song-Liao River Basin (91 billion m3/yr)ii) Hai-Luan River (22.8 billion m3/yr)iii) Huang River Basin (Yellow River) (66.1 billion
m3/yr)iv) Huai River Basin (62.2 billion m3/yr)
v) Changjiang River (Yangtze River) Basin (951.3 billion m3/yr)
vi) Zhujiang River (Pearl River) Basin (333.8 billion m3/yr)
vii) Southwest River Basinsviii) Southeast River Basinsix) Interior river basins (rivers not discharging into
the sea).
Each river basin presents a specifi c management challenge because of its socioeconomic, climatic, morphological, and hydrological conditions. Th e most important feature is the abundance of water relative to population, arable land, and local GDP. Table 1.1. provides a summary of water availability, population, and arable land area.
Th e table shows the relative water availability in diff er-ent river basins, of which the northern rivers account for less than 20 percent. It also shows water availability per capita and per hectare, which is as low as 343 and 6,000 m3 in the north, and as high as 29,427 and 346, 350 m3 in the south. In 2001, the water development ratio (the ratio between water supply and water avail-ability) was 0.2, but the north has a much higher value, up to 0.93 in the Hai River basin. Th e northern rivers are therefore characterized by high use/availability ratio, water scarcity, and serious pollution problems.
Inter-annual and seasonal variations in precipitation are quite large across most of China, but are most
Figure 1.1. Total, Rural, and Urban Population, 1980–2020 (million)
0
200
400
600
800
1,000
1,200
1,400
1,600
1990 1992 1994 1996 1998 2000 2002 2004 2006 2008 2010 2012 2014 2016 2018 2020
Total population Urban population Rural population Established towns
Source: Chinese Academy for Environmental Planning, 2004. Study on integrated environmental and economic modeling.

Policy and Institutional Considerations
5
Table 1.1. Main River Basins and Their Characteristic Features
Water National Percentage Water Availability WaterRiver availability % Arable per capita (to m3) availabilityBasin (1000 m3) Pop. Land 1997 2010 2050 per ha (m3)
Northern Rivers
Interior R. 4.6 (130.4) 2.1 5.7 4,876 4,140 3,331 23,835
Song-liao 6.9 (192.2) 9.6 20.2 1,646 1,501 1,287 9,900
Hai 1.5 (42.2) 10 11.3 343 311 273 3,885
Huai 3.4 (96.1) 16.2 15.2 487 440 383 6,555
Huang 2.7 (74.4) 8.5 12.9 707 621 526 6,000
North Total 19.1 (535.3) 46.4 65.3 8,059 7,013 5,800
Southern Rivers
Yangtze 34.2 (961.3) 34.3 23.7 2,289 2,042 1,748 41,745
Pearl 16.7 (470.8) 12.1 6.7 3,228 2,813 2,377 67,515
Southeast 9.2 (259.2) 5.6 2.5 2,285 2,613 2,231 80,160
Southwest 20.8 (585.3) 1.6 1.8 29,427 25,056 20,726 346,350
South Total 80.9 (2277) 53.6 34.7 34,001 32,524 27,082
Source: Shen (2004).
pronounced in the water-scarce north. For instance, the diff erence between minimum and maximum precipitation is generally 3 to 6 times in the northern regions, while in the south it is only 2 to 4 times.1 In the Hai Luan and Huai rivers, the fl ow is less than 70 percent of the average once in four years and less than 50 percent once in 20 years. However, the northern rivers are also highly regulated: the annual storage capacity in the 3-H basins is about 90 percent of the average annual runoff (the country wide average is about 20 percent.
Water Availability
China’s total annual renewable water resources amount to between 2,400 and 2,800 billion m3/year (6th in the world). However, annual per capita water availability was only 1,856 m3 in 2004 (average 2,100 m3 2000–2004), which is about a quarter of the world average (8,513 m3/year). Th e south is relatively water-abundant. Water scarcity is very severe in northern areas, where average annual per capita availability is only about 725 m3. However, population growth will continue to undermine per capita water availability. When China’s (projected)
1. Ministry of Water Resources, Department of Hydrology. 1992. Water Resources Assessment of China. China Water and Power Press.
population peak occurs, at around 1.6 billion in 2030, annual per capita water availability will be only 1,750 m3. Given that China cannot increase its water resource base, future demand can only be met by increasing water effi ciency in municipal, industrial, and/or agricultural sectors, promoting water re-use, or by cleaning up water that is currently unfi t for consumption.
Precipitation patterns across the country show that the rainy season is as long as six to seven months in some southern areas and as short as two or three months in more arid northern regions. In general, annual precipitation decreases from the southeast to the northwest. In eastern areas around the Changbai Mountains, annual precipitation may reach 800 to 1,000 mm—about 800 to 900 mm in the area from Qinling Mountains to the Huaihe River (Anhui province), above 1,000 mm south of the middle and lower reaches of the Yangtze River, and more than 2,000 mm in some coastal mountainous and hilly areas in the southeast and parts of the southwest. In the western regions (except for the Altay and Tian-shan Mountains), most areas are dry. In the Tarim and Qaidam basins, annual precipitation is less than 25 mm; mean annual precipitation at some stations in the Turpan basin is less than 10 mm.
China Water Quality Management
6
Water Use
Th e countrywide average use/availability ratio is about 20 percent, which, seen in isolation, is not an alarming value, but at local levels there are many areas where water systems are stretched beyond their capacity. In many areas, the cost of water shortages from pollution appears severe. According to 1997 statistics for the Yellow, Huai, and Hai Luan river basins, exploitation rates reached 67, 59, and 90 percent respectively (as compared to use rates of below 20 percent in the south). With about 40 percent utilization rate, all of these northern rivers exceed international recommendations for water use. Moreover, usage in the Hai-Luan basin exceeds the sustainable yield, resulting in groundwater depletion. Th e net eff ect is that the bulk of river fl ows in the north comprise wastewater, and the dilution and absorptive capacity of the rivers is severely compromised.
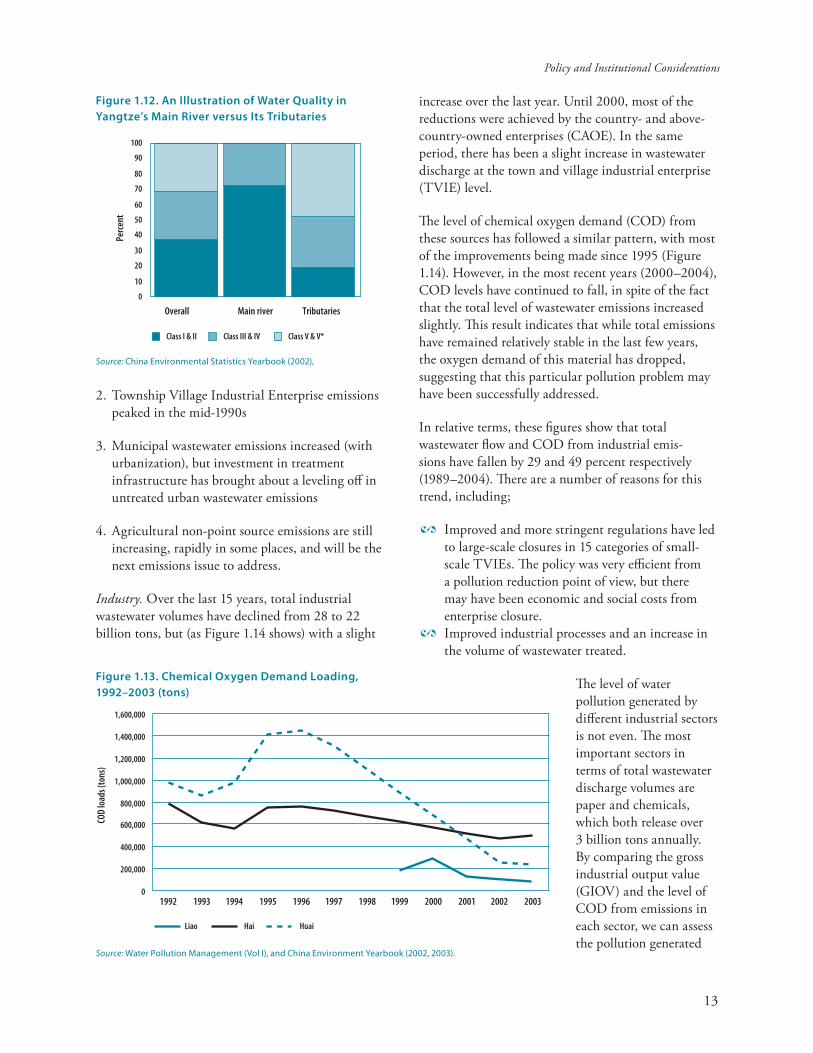
Th e total amounts of water use and wastewater generation have actually declined in recent years (World Bank, 2005; China Statistical Yearbook, various years). Th is trend is depicted in Figure 1.3, which shows that total water consumption declined by 4.5 percent between 1997 and 2005. Th e fi gure also shows the relative importance of agricultural, industrial, and consumption categories, which
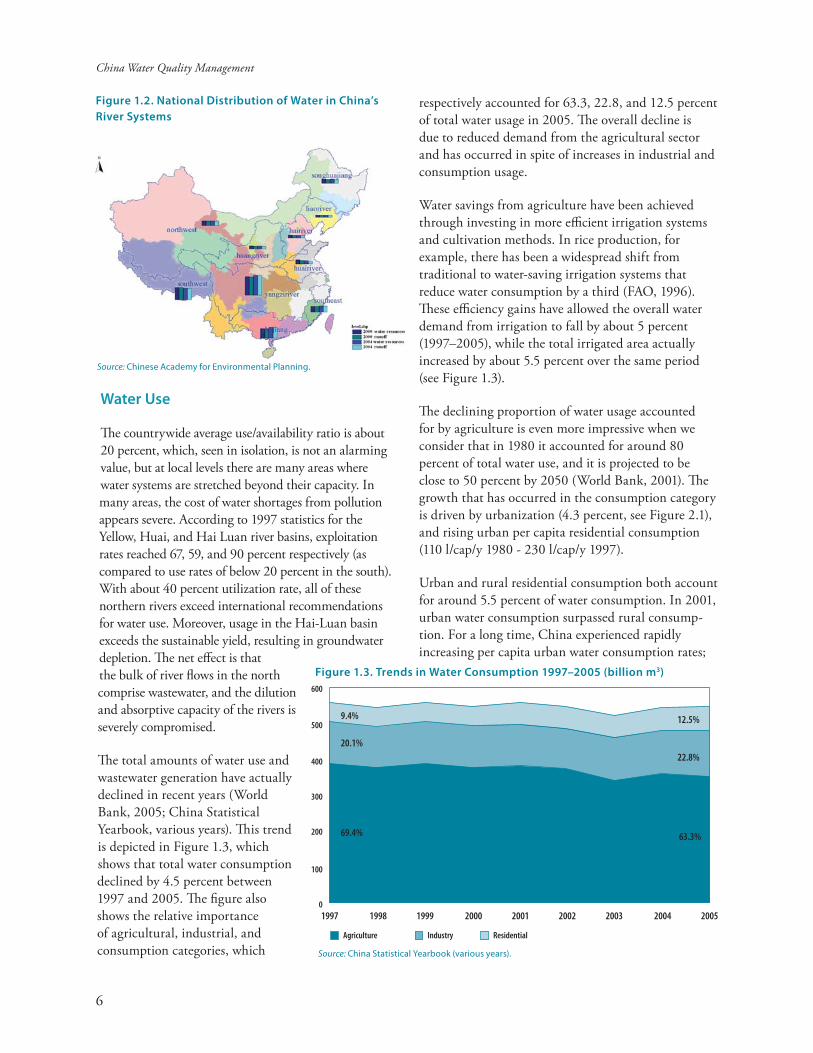
Figure 1.2. National Distribution of Water in China’s
River Systems
Source: Chinese Academy for Environmental Planning.
respectively accounted for 63.3, 22.8, and 12.5 percent of total water usage in 2005. Th e overall decline is due to reduced demand from the agricultural sector and has occurred in spite of increases in industrial and consumption usage.
Water savings from agriculture have been achieved through investing in more effi cient irrigation systems and cultivation methods. In rice production, for example, there has been a widespread shift from traditional to water-saving irrigation systems that reduce water consumption by a third (FAO, 1996). Th ese effi ciency gains have allowed the overall water demand from irrigation to fall by about 5 percent (1997–2005), while the total irrigated area actually increased by about 5.5 percent over the same period (see Figure 1.3).
Th e declining proportion of water usage accounted for by agriculture is even more impressive when we consider that in 1980 it accounted for around 80 percent of total water use, and it is projected to be close to 50 percent by 2050 (World Bank, 2001). Th e growth that has occurred in the consumption category is driven by urbanization (4.3 percent, see Figure 2.1), and rising urban per capita residential consumption (110 l/cap/y 1980 - 230 l/cap/y 1997).
Urban and rural residential consumption both account for around 5.5 percent of water consumption. In 2001, urban water consumption surpassed rural consump-tion. For a long time, China experienced rapidly increasing per capita urban water consumption rates;
Figure 1.3. Trends in Water Consumption 1997–2005 (billion m3)
Source: China Statistical Yearbook (various years).
63.3%69.4%
22.8%20.1%
12.5%9.4%
0
100
200
300
400
500
600
1997 1998 1999 2000 2001 2002 2003 2004 2005
Agriculture Industry Residential

Policy and Institutional Considerations
7
in recent years, this trend seems to have leveled off . Figure 1.4 shows the trend in urban daily water consumption levels.
Th e proportion of people with access to an improved water source (i.e. household connection or public standpipe) in rural and urban areas is 66 and 94 percent respectively in 2002 (WHO, 2004). However, other estimates are less optimistic and indicate that as much as half of the population does not have access to clean water (see Box 1.1). Of particular concern are the communities at the town and township level (i.e. below city level), which may not be captured in typical
0
0.05
0.1
0.15
0.2
0.25
1997 1998 1999 2000 2001 20020
5
10
15
20
25
30
35
Total urban (bill m3) Total rural (bill m3) Urban (m3/day/capita) Rural (m3/day/capita)
Daily
cons
umpt
ion (
m3/
day/
capi
ta)
Annu
al co
nsum
ptio
n (bi
ll m3/
year
)
Figure 1.4. Urban and Rural Water Consumption Rates
Source: China Statistical Yearbook (2003, 2004) and China Urban Construction Statistics Yearbook (various years).
Water supply in China has increased signifi cantly in both urban and rural areas in the past fi fteen years. According to the Chinese Ministry of Health (MoH) statistics, the per-
centage of rural population with some kind of access to a drinking water supply rose from 75.5 percent in 1990 to about 93.8 percent in 2004, an increase of about 220 million benefi ciaries. In urban areas, access to tapped water rose from 48 percent in 1990 to 88.9 percent in 2004. While these increases in the supply of drinking water represent a major achievement, trends in the quality of wa-ter supply are less encouraging.
According to a Ministry of Water Resources (MWR) survey, more than 300 million rural residents throughout the country consume unsafe drinking water. In Chongqing municipality, where the World Bank is conducting a study at both town/township and pure rural areas to examine the correlation between access to clean water and public health, 39.8 percent of the population have no access to a safe water supply.
The health risks associated with both, biological or microbial pol-lutants (e.g. large intestine bacilli, hepatitis B virus, cholera virus, typhoid, E-coli etc.) and chemical pollutants (e.g. heavy metals, fl uorine, arsenic, benzene, oil, etc) are widespread. According to MWR, an estimated 63 million rural people in the northern, north-western and north-eastern provinces and across the Huang-Huai-Hai (3-H) plains are exposed to drinking water with high fl uorine content. In the coastal areas of North and East China, salinization of drinking water sources is aff ecting about 38 million people, and some 2 million people in parts of Inner Mongolia, Shanxi, Xinjiang, Ningxia and Jilin drink water with high arsenic content, which has been linked to several types of cancers.
Disease incidence and mortality rates due to microbial pollut-ants remain relatively low on national level. For example, ac-cording to the China National Health Survey, in 2003, infectious diarrhea (ex. bacterial and amoebic dysentery) and typhoid in-cidence were 35 and 4.17 cases per 10,000 persons respectively. However, the incidence rates in towns, townships and villages, particularly in heavily polluted areas, are suspected to be sig-nifi cantly higher.
Increasing the supply of clean drinking water, especially in rural areas, has become one of the major objectives of the Chinese gov-ernment. The GoC began addressing the issue through an ambi-tious $2.1-billion rural drinking water supply project, completed during the10th Five-Year Plan (2001–2005). The project included the installation of 800,000 new water processing facilities, which provided access to clean drinking water to 14 million rural house-holds. According to the MWR, the overall project is estimated to have relieved water shortages for more than 57 million rural residents.
The continued problems associated with the lack of access to clean water, have prompted the Chinese government to continue with its aggressive measures to tackle the issue. In urban areas, stricter standards for piped water quality have taken eff ect since June 1, 2005. In rural areas, according to MWR, China plans to cut down the number of residents without access to clean drinking water by one third by 2010 and to provide safe drinking water to all rural residents by 2020.
Box 1.1. Drinking Water Trends in China

China Water Quality Management
8
urban-rural statistics. China has 18,000–20,000 town and township centers, often with very poor access to clean water, but because of their hybrid (urban–rural) status, the Chinese institutions that would normally be responsible for infrastructure development have no clear mandate.
Urban Water Supply
Th e rapid growth of China’s urban centers has neces-sitated increased level of water infrastructure. In 2003 China’s national urban water supply capacity was 87.5billion m3/year. Th is represents a vast increase in water capacity in China over the last 25 years. Figure 1.5 shows the rapid increase in urban population sup-plied with water services, which grew from 62 million in 1978 to 291 million in 2003. Th e urban water supply capacity increased at a similar rate, by almost an order of magnitude in the same 25-year period. In order to achieve this capacity increase there has been a nine-fold increase in the length of China’s water supply pipelines, from 35,986 Km in 1978 to 333,289 Km in 2003. However, since the late 1980s total urban supply capacity has greatly exceeded the water actually supplied to the consumers. In 2003, daily capacity was 239 million m3, but only 54 percent (130 million m3) was supplied.
An important element to note in the fi gure 1.5 is the leveling-off that has occurred in total water supply since 1994, in-spite of continued increase in residential use. Th is pattern is thought to be related to reductions
Figure 1.5. Urban Water Supply Statistics (1978–2003)
0
50
100
150
200
250
300
1978 1980 1982 1984 1986 1988 1990 1992 1994 1996 1998 2000 2002 2003
Production capacity (mill m3/day) Water supplied (mill m3/day)
Residential use (mill m3/day) Population supplied (million)
Source: China Urban Construction Statistics Yearbook (various years).
in industrial water demand connected to government initiatives to address water use and pollution from this sector. However, it also shows how urbanization is quickly negating the gains made in mitigating industrial water use.
Water Quality
China has established a water quality classifi cation system based on purpose of use and protection target, following Environmental Quality Standard GB3838-2002;
Grade I – Mainly applicable to the source of water bodies and national nature preserves. Grade II – Mainly applicable to class A water source protection area for centralized drinking water supply, sanctuaries for rare species of fi sh, and spawning grounds for fi sh and shrimps.Grade III – Mainly applicable to class B water source protection area for centralized drinking water supply, sanctuaries for common species of fi sh, and swimming zones.Grade IV – Mainly applicable to water bodies for general industrial water supply and recreational waters in which there is not direct human contact with the water.Grade V – Mainly applicable to water bodies for agricultural water supply and for general landscape requirements. Grade V+ - Essentially useless.
Based upon this classifi cation, water quality is being monitored on regu-larly basis in almost 500 monitored stations within China’s referred nine main rivers basins through national and provincial-run water monitoring centers (fi gure 1.6).2 Th e number of monitored sections within each river basins varies from for example 104 in the Yangze basin to only 17 in the South West rivers. As outlined in fi gure 1.7, the most polluted water sections are largely in Northern China and particularly in the most populous
2. Th e Ministry of Water Resources has also a monitoring system in place coverin about 2000 monitoring sections.
"
"
"
"
"
"

Policy and Institutional Considerations
9
provinces of Henan, Anhui, Jiangsu, Hebei, Beijing and Tianjin. Other water pollution hotspot areas includes North East provinces and in high population concentration in Sichuan and Chongqing.
Results from ongoing water quality monitoring show overall water quality in China to be poor. In 2004, only 28 percent of monitored river water was in categories I to III, while as much as 31 percent was in the worst two categories.
As outlined in fi gure 1.8, the situation does not appear to have improved, where it is shown that larger shares of the water quality appears to have increased between 2000 and 2004 in particularly the northern regions.
Among the about 30 pollutants included in the overall water quality monitoring schemes, usually about 14 are selected in comprehensive water pollution indexing. Th e worst individual monitored pollutant establishes the water quality grade for the section. Th e most important
indicator for triggering water quality levels was nitrogen (in the form of ammonia), followed by organic materi-als (BOD and COD). Figure 1.9 shows the relative importance of diff erent indicators in terms of the frequency with which they ‘trigger’ a lower water quality category in China’s main rivers. Many rivers have a similar pollution structure, but the Huai is heavily dominated by nitrogen (as ammonia), whereas in the Yangtze, nitrogen is never the most important pollutant.
China’s large lakes are also experiencing declining water quality caused by both point and non-point source emissions. Lake Dianchi is a good example of this trend, as water quality declined from Class II in the 1960s, to class V and IV in the 1990s. Th e lake has also undergone signifi cant eutrophication during this period with a massive shift from a high biodiversity low productivity system to a low biodiversity high productivity state. Concentrations of organic matter and nutrients, such as phosphorus and nitrogen, show high levels, and the latter are still increasing. Organic
Figure 1.6. Environmental Monitoring Stations in the Main River Systems
0 500250 Kilometers
0 250 500125 Miles
Main River Systems in China:Inward flowing systems-WestSonghua R.Fujian/ZhejiangHai R.Huai R.Pearl R.
Nu/ Yarlung Zangbo R., in the SouthwestLiao R.Yangze R.Yellow R.
Xinjiang
Xizang
Neimeng
Qinghai
Gansu
Sichuan
Jilin
Heilongjiang
Hebei
Hubei
Shaanxi Henan
Shanxi
Liaoning
Yunnan
Hunan
Guangxi
Anhui
JiangxiGuizhou Fujian
Shandong
Guangdong
Jiangsu
ZhejiangChongqing
Ningxia
Taiwan
Hainan
BeijingTianjin
Shanghai
Hong KongMacao
Source: China National Monitoring Centre (Presented in World Bank 2006).

China Water Quality Management
10
Figure 1.7. Surface Water Quality Levels 2004
Xinjiang
Xizang
Neimeng
Qinghai
Gansu
Sichuan
Jilin
Yunnan
Heilongjiang
Hebei
Hubei
Hunan
Shaanxi
Guangxi
Henan
Shanxi
Anhui
JiangxiGuizhou
Liaoning
Fujian
Shandong
Guangdong
Jiangsu
ZhejiangChongqing
Ningxia
Taiwan
Hainan
BeijingTianjin
Shanghai
Hong KongMacao
0 500250 Kilometers
0 250 500125 Miles
WQ 2004I-III (n=2 43)IV (n= 92 )V (n=34 )VI (n=115 )
Source: China National Monitoring Centre (Presented in World Bank 2006).
Figure 1.8. General State of Water Quality in the Main River
Source: Chinese Academy for Environmental Planning.
Point source pollution is made up of industrial and municipal emissions. Recent measures to encourage industries to meet wastewater regulation standards led to a 25 percent reduction in emissions (28 to 21 billion tons) between 1990 and 2004. In 2000, industrial sources accounted for 11 percent of BOD, 4 percent of Total Nitrogen (TN), and 2 percent of Total Phosphorus (TP) discharges. Municipal sources are increasing, as population and economic growth leads to more wastewater, important elements include growth in fl ushing toilets and washing machines. Municipal sources accounted for 52 percent of BOD, 69 percent of TN, and 53 percent of TP in 2000. Non-point sources are primarily related to agricultural activities, including fertilizer and pesticide run-off from farmland, and infi ltration of livestock waste. In 2000, non-point sources accounted for 37 percent of BOD, 27 percent of TN and 45 percent of TP. Th e excessive loads of nutrients, and
"
"
material contributes to decreased oxygen levels and bacterial growth and nutrients cause eutrophication.
Pollution sources are often grouped in two classes:

Policy and Institutional Considerations
11
in particular Phosphorus, leads to eutrophication, excessive algae growth, reduced biodiversity levels, and poor quality water.
Despite considerable eff orts to clean up China’s major river basins the situation remains generally poor. Th ere have been some improvements in the Yangtze and Pearl River basins where a reasonable proportion of the water is now classifi ed at grade I or II (but all still contain areas of very poor water quality, particularly in the tributaries). However, many of China’s rivers, such as Hai, Liao, Yellow and Songhua, are still dominated by water of the worst categories (V and V+). Th e problem is typically most prominent when rivers fl ow through large cities, where discharges of organic materials have caused increased concentrations levels of various pollutants.
Th e clean-up challenge is huge and is especially important given the water shortage problem. Accord-ing to WB estimates, the cost of water shortages from pollution ranges from 1 to 3 percent of local GDP in water scarce areas (World Bank 2006). In order to address this problem, the Chinese government has already started work on a number of water transfer projects (south to north), but poor water quality in intervening rivers is a major constraint (box 1.2).
Addressing water pollution in China is also signifi cant given its particularly high health cost and to some
Figure 1.9. An Illustration of the Water Pollution
Structure in Major Rivers
0
20
40
60
80
100
Huai Hai Liao Yellow Song Pearl Yangtze
Ammonium Nitrate BOD CODOils Volitile Phenolic ArsenicMercury Nitrite Nitrate
Cadmium Lead
Perce
nt
Source: China Environmental Yearbook 2002.
extent agricultural costs. Th e estimated cost in 2003 for the whole of China for water-related damages of four major types of crops (wheat, corn, rice and vegetable) was about 0.05 percent of GDP. Establishing the true extent of public health impacts from water pollution is challenging, because it is hard to isolate specifi c dose response functions given the wide range of factors, including food chain eff ects. Initial World Bank analysis on the environmental health impact of water pollution in China found signifi cantly higher disease rates, e.g. cancers and spontaneous abortions, among fi shing and farming com-munities living near polluted water sources (World Bank, 1997).
Ongoing work has indicated that improved water quality could signifi cantly reduce the
spread of the hepatitis A virus (70 to 90 percent of hepatitis A cases in China are transmitted by water). Waterborne diseases, such as diarrhea, cholera, and typhoid, which are entirely related to impure water, could be reduced by almost 50 percent by moving from heavily to moderately polluted water (World Bank, 2006). Th e ongoing study also estimates 9 million cases of diarrhea due to water pollution based upon the national health survey from 2003. Excessive application of fertilizers can also have health consequences; under aerobic conditions, NO3 can be formed, which is absorbed into the body and interferes with the blood’s oxygen carrying capacity.
Trends. Average water quality for China as a whole shows a steady increase in the relative abundance of the worst and best water quality categories. Figure 1.10 shows that between 1991 and 2005 the number of monitoring stations recording the worst categories (V and V+) stayed the same at about to 30 to 35 percent (but with high fl uctuations), while the percent of best categories (I and II) increased from 3 to 20 percent. Th is pattern may refl ect two main processes: (a) the dif-ference in water quality patterns in the north and south of the country; and (b) water quality improvements in the main course versus deterioration in tributary waters.
Th e diff erence between recent water quality trends in southern rivers (Yangtze, Pearl) and northern rivers (Hai, Huai, Yellow, Liao, and Song) is shown in Figure 1.11. In the southern rivers, the proportion of water rated in

China Water Quality Management
12
the best categories has increased from 2 to almost 60 percent, while in the northern rivers the change is much smaller (4 to < 10 percent). However, water in the worst categories has increased in northern rivers, from 40 to 45 percent (but with fl uctuations up to > 60 percent), as a result of the pollution sources outlined above and the very low levels of water available to absorb it. Th e deterioration of water quality is particularly severe in the Hai and Huai river basins. Annex 1 gives these trends for each river separately.
Another important reason for the simultaneous increase in abundance of best and worst categories is the fact that much of the attention in cleaning up
Figure 1.10. Average Water Quality in Chinese Rivers (1991–2005)
All China I – II
All China III – IV
All China V – V*
0
10
20
30
40
50
60
70
80
90
100
1991 1992 1993 1994 1995 1996 1997 1998 1999 2000 2001 2002 2003 2004 2005
All China I – II All China III – IV All China V – V*
Source: China Environmental Statistics Yearbooks (various years), World Bank (2001).Note: Figures 1.10 and 1.11 haven’t been corrected for inter-annual or inter-region fl ow variations that might aff ect dilution capacity and classifi cation.
operations has been focused on the main river course, with less eff ort on the tributaries. For example, in the Yangtze River, which has experienced signifi cant water quality improve-ments in recent years, there is a stark diff erence in the relative abundance of best and worst water qualities between main river and tributaries. Figure 1.12 shows that, in 2001, the main river had no cases of class V or V+, while this accounted for 48 percent of the water in its tributaries.
An important indicator of the pol-lution management eff orts that have been made over the last decade is the decline in chemical oxygen demand (COD) from industrial sources in many rivers. Improvements are shown in Figure 1.13 for the Liao,
Hai, and Huai rivers.
Emissions
Th ere are three main categories of water pollution emissions: (1) industrial, (2) municipal, and (3) agricultural non-point sources. Over the last 20 years, there has been a sequential development of these sources, with the following chronology;
1. Country and Above Owned Enterprises dominated until the end of the 1980s
Figure 1.11. Average Water Qualities in Southern and Northern Rivers (1991–2005)
South China I – II
South China III – IV
South China V – V*
010
2030
4050
6070
8090
100
1991 1992 1993 1994 1995 1996 1997 1998 1999 2000 2001 2002 2003 2004 2005
South China I – II South China III – IV South China V – V*
North China I – II
North China III – IV
North China V – V*
0
10
20
30
40
50
60
70
80
90
100
1991 1992 1993 1994 1995 1996 1997 1998 1999 2000 2001 2002 2003 2004 2005
North China I – II North China III – IV North China V – V*
Source: China Environmental Statistics Yearbooks (various years).
Policy and Institutional Considerations
13
2. Township Village Industrial Enterprise emissions peaked in the mid-1990s
3. Municipal wastewater emissions increased (with urbanization), but investment in treatment infrastructure has brought about a leveling off in untreated urban wastewater emissions
4. Agricultural non-point source emissions are still increasing, rapidly in some places, and will be the next emissions issue to address.
Industry. Over the last 15 years, total industrial wastewater volumes have declined from 28 to 22 billion tons, but (as Figure 1.14 shows) with a slight
Figure 1.12. An Illustration of Water Quality in
Yangtze’s Main River versus Its Tributaries
0
10
20
30
40
50
60
70
80
90
100
Overall Main river Tributaries
Class I & II Class III & IV Class V & V*
Perce
nt
Source: China Environmental Statistics Yearbook (2002),
Figure 1.13. Chemical Oxygen Demand Loading,
1992–2003 (tons)
0
200,000
400,000
600,000
800,000
1,000,000
1,200,000
1,400,000
1,600,000
1992 1993 1994 1995 1996 1997 1998 1999 2000 2001 2002 2003
COD
load
s (to
ns)
Liao Hai Huai
Source: Water Pollution Management (Vol I), and China Environment Yearbook (2002, 2003).
increase over the last year. Until 2000, most of the reductions were achieved by the country- and above-country-owned enterprises (CAOE). In the same period, there has been a slight increase in wastewater discharge at the town and village industrial enterprise (TVIE) level.
Th e level of chemical oxygen demand (COD) from these sources has followed a similar pattern, with most of the improvements being made since 1995 (Figure 1.14). However, in the most recent years (2000–2004), COD levels have continued to fall, in spite of the fact that the total level of wastewater emissions increased slightly. Th is result indicates that while total emissions have remained relatively stable in the last few years, the oxygen demand of this material has dropped, suggesting that this particular pollution problem may have been successfully addressed.
In relative terms, these fi gures show that total wastewater fl ow and COD from industrial emis-sions have fallen by 29 and 49 percent respectively (1989–2004). Th ere are a number of reasons for this trend, including;
Improved and more stringent regulations have led to large-scale closures in 15 categories of small-scale TVIEs. Th e policy was very effi cient from a pollution reduction point of view, but there may have been economic and social costs from enterprise closure. Improved industrial processes and an increase in the volume of wastewater treated.
Th e level of water pollution generated by diff erent industrial sectors is not even. Th e most important sectors in terms of total wastewater discharge volumes are paper and chemicals, which both release over 3 billion tons annually. By comparing the gross industrial output value (GIOV) and the level of COD from emissions in each sector, we can assess the pollution generated
"
"

China Water Quality Management
14
Box 1.2. Water Transfer Projects
The uneven distribution of China’s water resources between the water-scarce north and water abundant south is forcing the Chinese government to seek measures to ensure suffi cient water availability for people living in northern
regions. One such measure is the ‘South to North Water Transfer Project’ (other proj-ects include the World Bank-funded Wanjiazhai project). The project is designed to divert 13.4 billion m3/yr of water from the Yangtze to Beijing, and the project will supply many other cities along the route. The plan foresees a total water transfer capacity of 44.8 billion m3 by 20501. Work began in 2002, the fi rst supplies are to reach Shandong and Beijing in 2007 and 2010 respectively. Total project expenses, which were initially projected at $60 billion, have been increasing.
The project faces a number of logistical challenges, including the need to clean up water bodies at intersections that the canals will pass through. The 1,154 km eastern route of the project, largely following the Grand Canal route from the Yangze River through Jiangsu and Shandong provinces to Hebei and Tianjin, crosses through 53 rivers sections in China’s most heavily water-polluted area. In most cases, these sections have water quality of category V+. Cleanup operations will account for 37 percent of the total investment. If completed on schedule it will represent one of the most comprehensive water cleanup operations in the world. The water improvement objective is to reach category III throughout the transfer scheme, requiring an average water improvement (for critical water qual-ity and pollution parameters) of between 82 and 99 percent for pollutants such as nitrogen, BOD, COD and oils. However, at present, China has no track record in cleaning up polluted rivers at this level. Challenges include implementation and eff ectiveness of wastewater treatment plants, ensuring inter-provincial dialogue, and agreement on project components.
The vast cost of the projects may mean that water pricing will be a problem for some consumers (between 3.2 and 4.8 Yuan/m3 in many cities and as high as 7 Yuan/m3 in Beijing2). Also, stricter enforcement of pollution regulations and con-tinued closedown policies may have a signifi cant impact on industries in some locations along the transfer route.
1. http://www.nsbd.mwr.gov.cn/nsbd/intro.2. See http://www.people.com/cn/GB/14576/28320/31049/31054/2266569.html
by sector in relation to its economic importance (see Figure 1.15). Th e pulp-and-paper and food industries generate the most COD in relation to their contribu-tion to the economy (GIOV). Th is result suggests that the paper and food industries represent a good target for reform initiatives. However, the other sectors (chemicals, textiles, tanning, and mining) all have the potential to discharge pollutants with more serious human and environmental impacts than COD.
Municipalities.Th e demand for water in China’s cities has increased dramatically over the past few decades. Between 1990 and 2004, urban water consumption increased by about 6.3 percent annually, to 23.4
billion tons. At the start of the 1990s, municipal wastewater treatment capacity was only able to handle a fraction of the consumption levels (4 and 10 percent in 1991 and 1998 respectively). Increases in water consumption levels meant that even greater rates of expansion in wastewater treatment capacity and sewage facilities would be required in order to increase the coverage. However, construction of treat-ment facilities has now, in many places, out-paced the development of an eff ective sewer network. As a result, a signifi cant part of the capacity at the treatment works is underutilized, and a signifi cant part of the wastewater generated is still discharged without any treatment. Furthermore, investments in wastewater treatment capacity have been disproportionately concentrated in larger urban centers. In 2003, centralized wastewater treatment rates of super, mega, high, medium, and small cities are 43, 42, 20, 18, and 16 percent respectively in northern regions (World Bank, 2005).
Th e continued growth in municipal wastewater discharges (Figure 1.16) has eff ectively off set the gains made in industrial pollution management (Figure 1.14). In 2003, the total amount of municipal wastewater was 24.1 billion m³ and industrial wastewater 21.2 billion m³.
Agriculture. Fertilizer application, which is often excessive and ineffi cient, is a major cause of the growing agricultural non-point source pollution problem. Fig 1.17 shows the increase in fertilizer use over the period 1978–2004. Average levels of fertilizer application increased fi ve-fold over the period; in 1999, the average level was about 320 kg/ha/y (though maximum values may be 4 to 5 times higher). Nutri-ent pass-through from fertilizer overapplication, which is increased through ineffi cient forms of irrigation, is one of the main driving forces behind increasing levels of eutrophication in Chinese lakes and near-shore marine waters. For instance, it is estimated that 70 percent of the nutrient load of Lake Dianchi comes from agricultural diff use pollution; the picture is similar in Lakes Chao and Tai.

Policy and Institutional Considerations
15
Figure 1.14. Trends in Industrial Wastewater and COD Emissions
0
200
400
600
800
1,000
1,200
1,400
1,600
1989 1990 1991 1992 1993 1994 1995 1996 1997 1998 1999 2000 2001 2002 2003 2004
COD
(ten t
hous
and t
ons)
0
5
10
15
20
25
30
Was
tewa
ter (
bilio
n ton
s)
COD CAOEs COD TVIEs Total CODWastewater CAOEs Wastewater TVIEs Total wastewater
Source: China Statistical Yearbooks, data for 1990 – 1994 and 1996-1997 are extrapolated from 1989, 1995 and 1998 data points. Note: Country and Above Country Owned Enterprise (CAOE), Town and Village Industrial Enterprise (TVIE).
Figure 1.15. COD Loads and GIOV Shares in Industries, 2004
0 10 20 30 40 50
Pulp/paper
Food
Chemicals
Textiles
Tanning
Mining
PercentGIOV COD
Source: China Environment Yearbook (2005).
Compared with the industrial and municipal sectors, initiatives to address agricultural emissions have been very limited. Th is sector is especially challenging, because there are a growing number of small-scale farm units that are diffi cult to supervise, and, as the economy continues to open, the government’s infl u-ence over farming practice is diminishing.
Th ere is a high likelihood that the use of, and pollution associated with, pesticides is also increas-ing; however, data on this issue is missing. Th e lack of appropriate monitor-ing and data collection systems is indicative of the problems that the government is facing in the management of pesticide use. Given the impact that pesticides can have on water qual-ity, the issue is assumed to be a serious problem.
Finally, China’s economic growth and the increasing affl uence of the population are
resulting in a changing diet and consequently a major increase in livestock production. Figure 1.17 shows that total weight of pig, sheep, and other (cattle, horse, donkey and camel) increased 54, 86, and 62 percent respectively between 1978 and 2004. Th is presents a new water pol-lution problem because the potential of growth and the diffi culties in regulating this industry mean that manure generation could have serious consequences on water quality.
Summary of Findings
A combination of unprecedented economic growth and urbanization is putting signifi cant strain on China’s
water resources. Water shortages are increasingly a reality, particularly in the northern part of the country, and the declining quality of the existing water resources only exacerbates the country’s problems in the water sector.
Water consumption is increasing in spite of effi ciency gains in agriculture and industrial water use. Th e

China Water Quality Management
16
Table 1.2. Urban Indicators and Water Use
Annual Growth 1990 1995 2000 2003 2004 (percent)
Water consumption residential (billion m3 ) 10 15.8 20 22.5 23.4 6.3
Per capita water consumption residential urban (ton) 69.7 71.3 95.5 77.1 76.9 0.7
Municipal wastewater treatment capacity (mill m3/yr) 2.77 7.14 21.58 42.54 49.12 23.4
Length of sewer pipelines (10,000 km) 5.8 11 14.2 19.9 21.9 10
Municipal Wastewater treatment rate (percent) 13 19.7 34.25 42.39 45 9.3
Offi cial urban population (million) 301 351 459 523 543 4.3
Number of designated cities 467 640 663 660 661 2.5
Built-up city areas (km2) 12,856 19,264 22,439 28,308 30,406 6.3
Source: China Statistical Yearbook (1992, 2000, 2004, 2005) and China Urban Construction Statistics Yearbook (various years).
Figure 1.16. Municipal Wastewater, 1978–2003 (billion m3)
10
15
20
25
30
35
40
1978 1980 1982 1984 1986 1988 1990 1992 1994 1996 1998 2000 2002
Disc
harg
e (B
m3)
0
5
10
15
20
25
30
35
40
45
Was
tewa
ter t
reat
men
t (%
)WW treatment (%) WW discharged (B m3)
sewer length (Mill 10m) WW treatment cap (100M m3/day)
Source: China Urban Construction Statistics Yearbook 2003.
Figure 1.17. Irrigation, Fertilizer, Pesticide, and Livestock Levels (1978–2004)
0
10
20
30
40
50
60
19781980
19821984
19861988
19901992
19941996
19982000
20022004
19781980
19821984
19861988
19901992
19941996
19982000
20022004
Irrig
ated
area
, Che
mica
l fer
tilize
r
00.20.40.60.8
11.21.4
1.61.8
Pesti
cides
Irrigation (M hec.) Chemical fertilizer (MT) Pesticide (MT)
0
10,000
20,000
30,000
40,000
50,000
60,000
Pig Sheep, goats Cattle, horse, donkey, camel
Source: China Statistical Yearbook (various years).

Policy and Institutional Considerations
17
primary culprit for this trend is the rapid growth in urban populations and simultaneous increase in urban per capita water consumption. Th e growing demand for water in northern cities has resulted in major water transfer projects. Having resulted in increased govern-ment attention to water quality, these projects have generally had positive ecological impact. However, the resulting increase in water prices will be a problem for many consumers.
Overall water quality in China is poor. In 2004, only a quarter of China’s rivers were classifi ed as category I and II (highest water quality), while about 40 percent were in the most polluted categories. Most of the pollution in China’s rivers is caused by the discharge of nitrogen (in the form of ammonia) and organic materials, such as BOD and COD. Much of this discharge originates from non-point
sources, primarily agricultural runoff , which is diffi cult to regulate.
Industrial pollution has decreased substantially since 1989. More stringent regulations have led to the closure of many highly polluting small-scale TVIEs. Improved industrial processes and higher volumes of treated water can also account for the pollution reduction.
In recent years, water quality in China has improved in the rivers classifi ed in the best water quality catego-ries, but it has worsened for the worst categories. Th ese trends refl ect the diff erence in water quality patters in the northern and southern parts of the country, as well as concentrated eff orts on improving quality in the main river courses, with less eff ort in the tributary waters.


– 19 –
2. Policy and Institutional Issues
Legislation and Policy Instruments
At the time of the fi rst Chinese water pollution policy, which was formulated in 1972, the focus was on abatement of point-source pollution. Since then, the approach has undergone a number of profound changes, including a shift toward pollution prevention, the use of integrated management approaches, multi-source fi nancing schemes (replacing government budget allocations), and policy instruments integrated with com-mand and control measures. New policy instruments include effl uent standards, EIA requirements, discharge permits, fee and levy systems, ISO 14000, and Total Load Control.
Th e current policy structure has had some success in reducing water pollution from the industrial sector. Between 1995 and 2004, the absolute discharge of wastewater decreased from 28 billion m3 tons to 22 billion m3, though the situation deteriorated somewhat in the last few years. Between 1999 and 2004, the percentage of industrial wastewater meeting discharge standards increased from 67 to 91 percent. Target levels for the reduction
of industrial discharges of eight of the main water pol-lutants (mercury, cadmium, hexavalent chrome, lead, arsenic, cyanides, oil, and COD) were achieved over the period 1990–2000, but more recently some of the critical water pollution reduction targets have not been achieved in the 2001–05 period (World Bank, 2006). In particular, less progress has been made in address-ing COD loads and concentrations, and the modest
gains that have been achieved have been off set by increases in COD from mu-nicipal sources (Statistical Yearbook, 1990–2005; China Environmental Statistical Yearbooks, 1990–2005).
Th is situation refl ects the fact that the legal system has been focused on industrial sources and has been unable to account for
“new” water pollution problems, such as agricultural non-point and municipal sources. Th e approach is entirely dependent on government agencies and does not take advantage of the potential for participation from the private sector and civil society. Furthermore, the system is heavily reliant on protection and com-mand-and-control tools, as opposed to economic and voluntary instruments.
A sluice along the Huai River

China Water Quality Management
20
A major problem with respect to water pollution management (WPM) in China, as in many parts of the world, is that well-designed policies are often poorly enforced. Further complications exist in areas where rivers cross administrative boundaries, between municipalities or provinces, because agencies pay more attention to protection of water resources that aff ect their clients than to discharges transported out of their area of responsibility. Th is behavior causes confl icts between upstream and downstream administrative units.
Th e following WRM policy instruments are currently employed in China:
Pollution Charges. Th e pollution levy system (PLS), initially established in 1982 and revised in 2003 (see Box 2.1), has become the most important economic instru-ment for environmental protection. Th e PLS not only serves as an incentive to change polluters’ behavior, but
it is also a source of funding for investment in pollution management and capacity building for environmental protection agencies. In 1999, total water pollution charges amounted to about 0.3 billion Yuan, about 5 percent of total environmental charges. Under the old system, charges would only be levied against the most signifi cant element of pollution in excess of the effl uent standard. With the 2003 revision, however, there are charges for all elements, e.g. COD is charged at 1.2 Yuan per Kg. An example of the charge system is given in Box 2.1.
Th e initial problems associated with the pollution levy system included:
Polluters limited ability to pay resulted in a system where charges did not refl ect environmental costs; Charges were collected against the pollutant with the highest concentration, which implies that other pollutants were not penalized;
Th e system was based on concentrations rather than on loads.
Th e above-mentioned problems appear to have been solved with the referred new pollution charge regulation, but further detailed reviews should perhaps also be undertaken.
Industry Permit Systems. Acceptable total discharge loads are set in each region according to the local recipient carrying capacity. Based on these limits, polluters are allocated discharge licenses with a specifi ed maximum volume, and permis-sion is granted through permit decrees. In 1989, the State Council approved implementation regulations for the Law of Water Pollution Prevention and Treat-ment, stating that the discharge permit certifi cate is a management measure for reporting and registration of pollution. Initially, implementation was carried out on a test basis. Th e water pollution permit system involves reporting and registration of pollutant discharges, allocation and issuance of pollution permits, supervision, and management. After piloting the system in several provinces, including Shanxi and Jiangsu, SEPA announced the end of the trial
"
"
"
Box 2.1. China Pollution Levy System Reform
The new pollution levy system was initiated in July 2003, and includes new regulations on principles, charge basis, charge rate schedule, revenue, and use policies. The main change is the shift from a concentration-based to a
total load charge system, i.e. charges are levied against discharges regardless of whether the concentration is above the discharge standards or not. The charge basis covers more than 100 pollutants, aff ecting water, air, solid waste, noise, and radioactive pollution.
Pollution charges are calculated using a pollution equivalent (PE) system, which represents the aggregate volume of pollution from each source. Each constituent pollutant has a specifi c PE coeffi cient, and the total charge is calculated as the sum of PEs multiplied by the local charge rate. For example, a fi rm is in compliance with the relevant effl uent standards, discharging 50kg COD, 8kg SS, and 1kg oil per month. Under the previous system, there would have been no charge for these emissions, as the effl uent standards have not been exceeded. However, under the new system, each PE is charged at a set rate. If we assume the rate is 0.7 Yuan/PE, then the total charge will be 43.4 Yuan/month [((50/1)+(8/4)+(1/0.1)) x 0.7].
The pollution levy is collected by local EPBs (at city and county levels) and the revenue is distributed to respective fi nance bureaus. Revenues from pollution lev-ies are allocated through budgetary management, that is, fi nancial bureaus and respective EPBs are responsible for allocating fi nes and selecting projects based on the criteria given in the regulation. In order to strengthen the eff ective utiliza-tion of pollution levy revenues, 20 percent of the total revenue is allocated to the central fi nancial body, the Ministry of Finance (MOF), where it is managed by MOF and SEPA to fund projects of national signifi cance. MOF has the fi nal say in terms of budget allocation, while SEPA decides on selection. Provincial governments might also set aside a portion of the pollution levy revenue to fund projects of provincial signifi cance. It appears, however, that the principle of setting aside revenue for national and provincial projects and strengthening of budgetary management has discouraged the local EPBs in pollution levy collection.
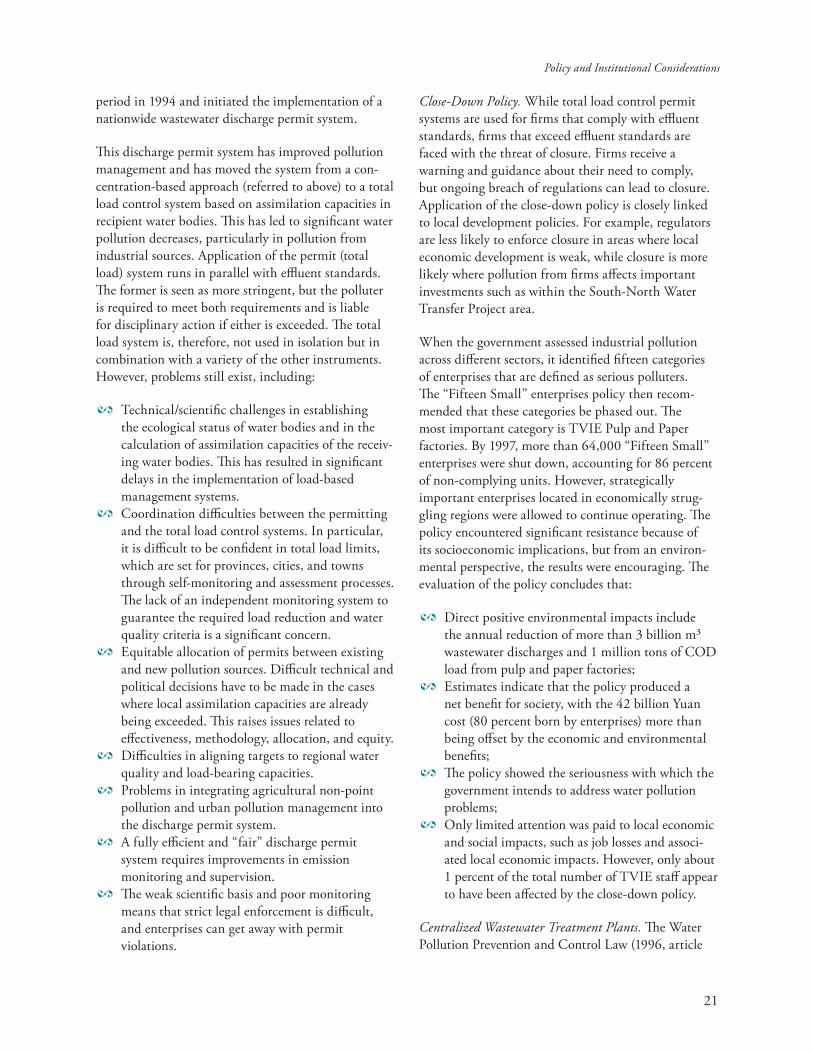
Policy and Institutional Considerations
21
period in 1994 and initiated the implementation of a nationwide wastewater discharge permit system.
Th is discharge permit system has improved pollution management and has moved the system from a con-centration-based approach (referred to above) to a total load control system based on assimilation capacities in recipient water bodies. Th is has led to signifi cant water pollution decreases, particularly in pollution from industrial sources. Application of the permit (total load) system runs in parallel with effl uent standards. Th e former is seen as more stringent, but the polluter is required to meet both requirements and is liable for disciplinary action if either is exceeded. Th e total load system is, therefore, not used in isolation but in combination with a variety of the other instruments. However, problems still exist, including:
Technical/scientifi c challenges in establishing the ecological status of water bodies and in the calculation of assimilation capacities of the receiv-ing water bodies. Th is has resulted in signifi cant delays in the implementation of load-based management systems. Coordination diffi culties between the permitting and the total load control systems. In particular, it is diffi cult to be confi dent in total load limits, which are set for provinces, cities, and towns through self-monitoring and assessment processes. Th e lack of an independent monitoring system to guarantee the required load reduction and water quality criteria is a signifi cant concern. Equitable allocation of permits between existing and new pollution sources. Diffi cult technical and political decisions have to be made in the cases where local assimilation capacities are already being exceeded. Th is raises issues related to eff ectiveness, methodology, allocation, and equity.Diffi culties in aligning targets to regional water quality and load-bearing capacities. Problems in integrating agricultural non-point pollution and urban pollution management into the discharge permit system.A fully effi cient and “fair” discharge permit system requires improvements in emission monitoring and supervision. Th e weak scientifi c basis and poor monitoring means that strict legal enforcement is diffi cult, and enterprises can get away with permit violations.
"
"
"
"
"
"
"
Close-Down Policy. While total load control permit systems are used for fi rms that comply with effl uent standards, fi rms that exceed effl uent standards are faced with the threat of closure. Firms receive a warning and guidance about their need to comply, but ongoing breach of regulations can lead to closure. Application of the close-down policy is closely linked to local development policies. For example, regulators are less likely to enforce closure in areas where local economic development is weak, while closure is more likely where pollution from fi rms aff ects important investments such as within the South-North Water Transfer Project area.
When the government assessed industrial pollution across diff erent sectors, it identifi ed fi fteen categories of enterprises that are defi ned as serious polluters. Th e “Fifteen Small” enterprises policy then recom-mended that these categories be phased out. Th e most important category is TVIE Pulp and Paper factories. By 1997, more than 64,000 “Fifteen Small” enterprises were shut down, accounting for 86 percent of non-complying units. However, strategically important enterprises located in economically strug-gling regions were allowed to continue operating. Th e policy encountered signifi cant resistance because of its socioeconomic implications, but from an environ-mental perspective, the results were encouraging. Th e evaluation of the policy concludes that:
Direct positive environmental impacts include the annual reduction of more than 3 billion m³ wastewater discharges and 1 million tons of COD load from pulp and paper factories;Estimates indicate that the policy produced a net benefi t for society, with the 42 billion Yuan cost (80 percent born by enterprises) more than being off set by the economic and environmental benefi ts; Th e policy showed the seriousness with which the government intends to address water pollution problems; Only limited attention was paid to local economic and social impacts, such as job losses and associ-ated local economic impacts. However, only about 1 percent of the total number of TVIE staff appear to have been aff ected by the close-down policy.
Centralized Wastewater Treatment Plants. Th e Water Pollution Prevention and Control Law (1996, article
"
"
"
"

China Water Quality Management
22
19) requires centralized treatment of municipal sew-age, and prescribes that relevant government bodies should incorporate water protection and treatment infrastructure into urban planning.1 A centralized system refers to an urban wastewater treatment plant and its pipeline sewerage network, as opposed to treat-ment infrastructure for specifi c fi rms. Th e revised law also indicates that users will be charged a wastewater discharge fee for sewage treatment services, and those who pay should be exempt from separate pollution discharge fees. Revenue from these fees is used exclusively for construction and operation of facilities for central treatment of urban sewage. However, many cities are still quite far from the situation envisioned in this municipal wastewater management policy, which includes the development of sewerage systems and large treatment plants. In many places sewerage and treatment facilities are either absent or very partial, and industrial enterprises have to treat their own emissions.
Th e development of the required sewage and wastewater treatment facilities is a diffi cult process, and planning, coordination, and timing have all been stumbling blocks. A crucial element determining the capacity and technology of these plants is the projected quantity and composition of wastewater generated. Another problem is the appropriate pricing of water, as underpricing leads to overconsumption and increasing levels of wastewater generation. In Beijing, which has the second highest average per capita consumption rate2 (248 l/day), water prices have been increasing over the last few years. Th e latest increase, in May 2005, was from 3.7 Yuan to 4.5 Yuan (0.55 USD) per M3 for residential consumers. Th is rate is one of the highest in China (Kunming is 1.8 Yuan/m3) and compares to urban disposable income levels of 15,637 Yuan/year (Beijing Municipal Statistical Bureau, 2005). About three-quarters of this price is used to cover water supply, and one-quarter is assigned to cover sewage disposal costs.
Th e implementation of centralized wastewater treat-ment policies has raised a number of issues:
1. Reform of Environmental and Land Legislation in the People’s Republic of China. Asian Development Bank, 20002. After Shanghai (330.6 L/day) but water availability is much lower in Beijing.
Cost: Construction and maintenance costs are high, and the onus is on local users to pay for these facilities. However, full cost recovery may not be realistic in smaller cities that cannot take full advantage of effi ciencies of scale. Financing: Various sources of funding can be explored including government budgets, private partnerships, and foreign investments.Pre-treatment: Criteria for the pre-treatment of some industrial discharges, prior to entering the central system, may need to be developed. Incentives: Positive incentives or stricter enforce-ment may be required to make enterprises move from existing systems to centralized treatment facilities.Fees: Eff ective cost recovery systems, such as user fees, need to be established. Technology: Identifi cation of the most appropri-ate technical approach for wastewater treatment is diffi cult. For example, the socioeconomic conditions in many municipalities indicate that state- of-the-art technology may not necessarily be the best option and that low-cost, labor-intensive solutions are more appropriate, even if treatment capacity remains sub-optimal in the short run. Integrated approaches: New wastewater facilities should be integrated with existing water supply, sewerage, wastewater treatment, and sludge handling systems. Furthermore, facilities for peri-urban areas might be linked into the urban systems.
Environmental Impact Assessment (EIA). Th e Envi-ronmental Impact Assessment (EIA) and approval system has become an important element of pollution management in China. Th e EIA system is used to establish critical conditions for pollution prevention in new developments. In 2002, the Environmental Impact Assessment Law was issued, requiring not only EIAs for specifi c projects but also for overall plans. Some of the problems faced in implementing the EIA requirements are:
EIA enforcement can be diffi cult, especially when projects have strong political backing. However, SEPA has recently taken a much tougher stance with respect to EIA enforcement and has released information on projects that are breaking the rules;
"
"
"
"
"
"
"
"

Policy and Institutional Considerations
23
Th e timing of EIAs often lags behind the feasibility study of construction projects. Th is has reduced the potential positive impact that the assessment can have as important design and location decisions may already have been taken; Public participation in the processes remains low, reducing the validity and acceptance of the EIA results, even though the current law has provi-sions to encourage public participation.
River Basin Water Pollution Management Planning and Implementation. China has a long history of river basin management in various forms, including the establish-ment of river basin commissions (RBC) for the seven main river basins in the early 1950s. However, an approach refl ecting needed diff erences between the basins was undermined by the 1998 Water Law, which stressed that “the State shall exercise a system of unifi ed administration on water resources in association with administration at various levels.” Moreover, the 1998 law undermined the powers of river basin management organizations (e.g. enforcement), left them with ambiguous legal status, and limited their infl uence in many WRM areas. Th e 2002 Water Law (re-draft) addressed river basin management directly, specifying that “the state shall adopt a ‘combined division responsibility’ (CDR) system of river basin management in conjunction with jurisdictional man-agement.” It indicated that river basin management shall be set up by the water administration department under the State Council, and set out the following river basin management functions: (a) planning; (b) protection of water resources water areas and projects (including pollutant discharge loading and sewage facilities); (c) water resource allocation and saving; and (d) water dispute resolution.
Voluntary Approaches for Pollution Management. Compared with mandatory approaches, voluntary approaches are more fl exible and easier to introduce. In developed countries, voluntary approaches have become more and more important elements of environmental management. Th ose approaches can be applied both to polluting enterprises and to the general public. Preventive approaches, such as ISO14000, environmental labeling, and cleaner production (CP) principles, can be adopted by polluting enterprises. Th e general public can have an infl uence through involvement in decision making and applying environ-mentally conscious consumption principles.
"
"
Cleaner Production. China’s Cleaner Production Promotion Act was enacted in 2002 to promote CP, reduce pollution, and improve the environment. It requires the continuous application of measures for design improvement. Th e law sets out responsibilities for the State Council and other administrative departments to ensure more sustainable resource use, including the establishment of product labeling systems, “naming and shaming” heavy polluters, and compulsory recycling lists. Th e measures are designed to enhance energy and water conservation, and to increase the level of water reuse and recycling. Th ey are seen as the fi rst step in developing a more ecologically based economy. Th e relevant government departments have started to implement an industrial policy based on cleaner production and given guideline standards for cleaner production in their respective sectors. In order to strengthen implementation of the CP Promo-tion Act, CP standards for several industries were promulgated in 2004 (e.g. for petroleum refi neries and coking and tanning industries).
Environmental Management System (ISO14000). Since the late 1990s, PRC started environmental management system (EMS) auditing and ISO14000. In several years, SEPA successively issued management documents and established a set of eff ective manage-ment measures. SEPA initiated pilot certifi cation of EMS in 1996 and identifi ed 55 pilot enterprises for the certifi cation of ISO14001. In 1997, SEPA approved 13 pilot cities (areas) for implementing ISO14000 series. By the end of 1999, 263 enterprises had obtained ISO14001certifi cates.3
From the demonstration experience, there are three main barriers or problems for implementing ISO14000 in China:
1. Both enterprise management and environmental management awareness levels are low. It is diffi cult for enterprises that do not focus on product quality management to pay attention to EMS auditing.
2. Th e enterprises’ technological capacity is low and means of production are not highly developed. Most enterprises are oriented toward the domestic market and have limited understanding of the requirements needed by international markets.
3. http://www.zhb.gov.cn/iso
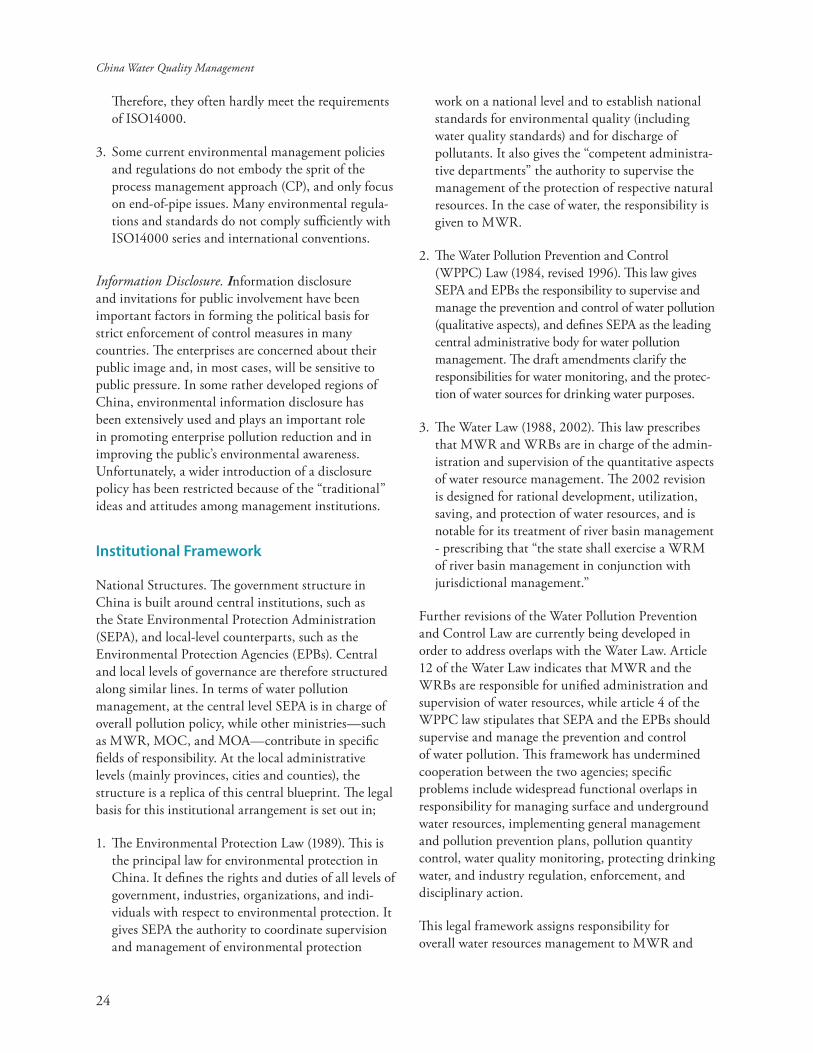
China Water Quality Management
24
Th erefore, they often hardly meet the requirements of ISO14000.
3. Some current environmental management policies and regulations do not embody the sprit of the process management approach (CP), and only focus on end-of-pipe issues. Many environmental regula-tions and standards do not comply suffi ciently with ISO14000 series and international conventions.
Information Disclosure. Information disclosure and invitations for public involvement have been important factors in forming the political basis for strict enforcement of control measures in many countries. Th e enterprises are concerned about their public image and, in most cases, will be sensitive to public pressure. In some rather developed regions of China, environmental information disclosure has been extensively used and plays an important role in promoting enterprise pollution reduction and in improving the public’s environmental awareness. Unfortunately, a wider introduction of a disclosure policy has been restricted because of the “traditional” ideas and attitudes among management institutions.
Institutional Framework
National Structures. Th e government structure in China is built around central institutions, such as the State Environmental Protection Administration (SEPA), and local-level counterparts, such as the Environmental Protection Agencies (EPBs). Central and local levels of governance are therefore structured along similar lines. In terms of water pollution management, at the central level SEPA is in charge of overall pollution policy, while other ministries—such as MWR, MOC, and MOA—contribute in specifi c fi elds of responsibility. At the local administrative levels (mainly provinces, cities and counties), the structure is a replica of this central blueprint. Th e legal basis for this institutional arrangement is set out in;
1. Th e Environmental Protection Law (1989). Th is is the principal law for environmental protection in China. It defi nes the rights and duties of all levels of government, industries, organizations, and indi-viduals with respect to environmental protection. It gives SEPA the authority to coordinate supervision and management of environmental protection
work on a national level and to establish national standards for environmental quality (including water quality standards) and for discharge of pollutants. It also gives the “competent administra-tive departments” the authority to supervise the management of the protection of respective natural resources. In the case of water, the responsibility is given to MWR.
2. Th e Water Pollution Prevention and Control (WPPC) Law (1984, revised 1996). Th is law gives SEPA and EPBs the responsibility to supervise and manage the prevention and control of water pollution (qualitative aspects), and defi nes SEPA as the leading central administrative body for water pollution management. Th e draft amendments clarify the responsibilities for water monitoring, and the protec-tion of water sources for drinking water purposes.
3. Th e Water Law (1988, 2002). Th is law prescribes that MWR and WRBs are in charge of the admin-istration and supervision of the quantitative aspects of water resource management. Th e 2002 revision is designed for rational development, utilization, saving, and protection of water resources, and is notable for its treatment of river basin management - prescribing that “the state shall exercise a WRM of river basin management in conjunction with jurisdictional management.”
Further revisions of the Water Pollution Prevention and Control Law are currently being developed in order to address overlaps with the Water Law. Article 12 of the Water Law indicates that MWR and the WRBs are responsible for unifi ed administration and supervision of water resources, while article 4 of the WPPC law stipulates that SEPA and the EPBs should supervise and manage the prevention and control of water pollution. Th is framework has undermined cooperation between the two agencies; specifi c problems include widespread functional overlaps in responsibility for managing surface and underground water resources, implementing general management and pollution prevention plans, pollution quantity control, water quality monitoring, protecting drinking water, and industry regulation, enforcement, and disciplinary action.
Th is legal framework assigns responsibility for overall water resources management to MWR and
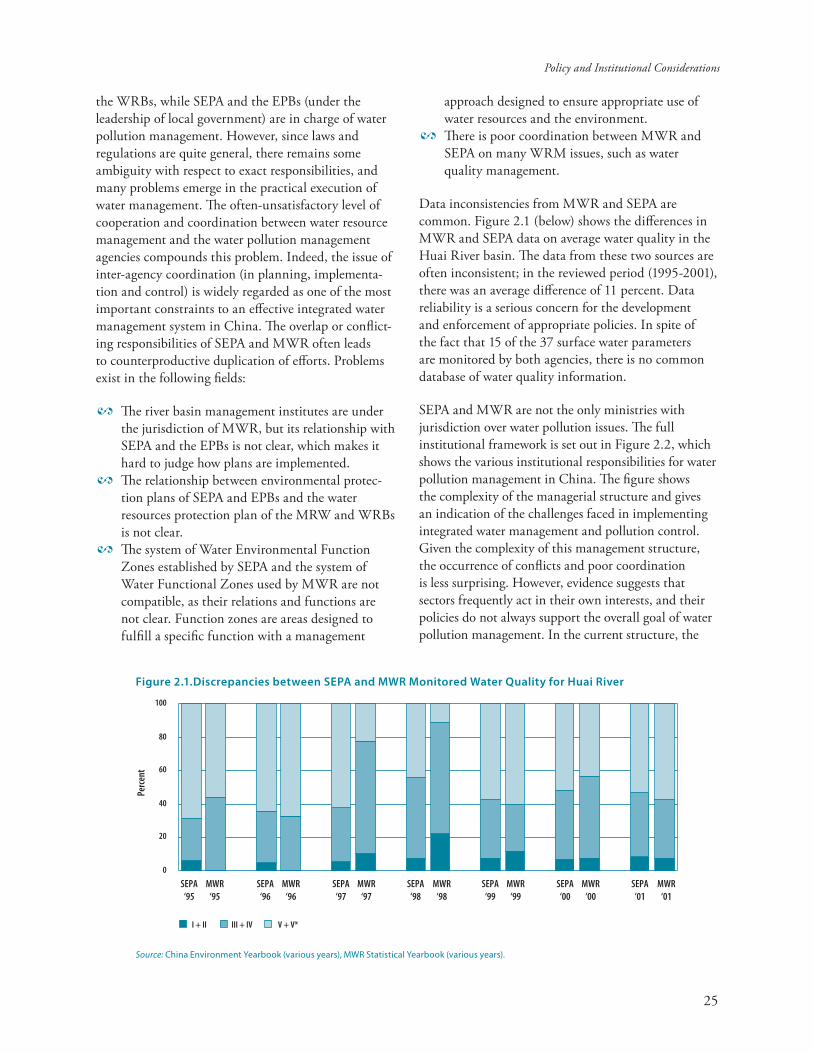
Policy and Institutional Considerations
25
the WRBs, while SEPA and the EPBs (under the leadership of local government) are in charge of water pollution management. However, since laws and regulations are quite general, there remains some ambiguity with respect to exact responsibilities, and many problems emerge in the practical execution of water management. Th e often-unsatisfactory level of cooperation and coordination between water resource management and the water pollution management agencies compounds this problem. Indeed, the issue of inter-agency coordination (in planning, implementa-tion and control) is widely regarded as one of the most important constraints to an eff ective integrated water management system in China. Th e overlap or confl ict-ing responsibilities of SEPA and MWR often leads to counterproductive duplication of eff orts. Problems exist in the following fi elds:
Th e river basin management institutes are under the jurisdiction of MWR, but its relationship with SEPA and the EPBs is not clear, which makes it hard to judge how plans are implemented.Th e relationship between environmental protec-tion plans of SEPA and EPBs and the water resources protection plan of the MRW and WRBs is not clear.Th e system of Water Environmental Function Zones established by SEPA and the system of Water Functional Zones used by MWR are not compatible, as their relations and functions are not clear. Function zones are areas designed to fulfi ll a specifi c function with a management
"
"
"
approach designed to ensure appropriate use of water resources and the environment.Th ere is poor coordination between MWR and SEPA on many WRM issues, such as water quality management.
Data inconsistencies from MWR and SEPA are common. Figure 2.1 (below) shows the diff erences in MWR and SEPA data on average water quality in the Huai River basin. Th e data from these two sources are often inconsistent; in the reviewed period (1995-2001), there was an average diff erence of 11 percent. Data reliability is a serious concern for the development and enforcement of appropriate policies. In spite of the fact that 15 of the 37 surface water parameters are monitored by both agencies, there is no common database of water quality information.
SEPA and MWR are not the only ministries with jurisdiction over water pollution issues. Th e full institutional framework is set out in Figure 2.2, which shows the various institutional responsibilities for water pollution management in China. Th e fi gure shows the complexity of the managerial structure and gives an indication of the challenges faced in implementing integrated water management and pollution control. Given the complexity of this management structure, the occurrence of confl icts and poor coordination is less surprising. However, evidence suggests that sectors frequently act in their own interests, and their policies do not always support the overall goal of water pollution management. In the current structure, the
"
Figure 2.1.Discrepancies between SEPA and MWR Monitored Water Quality for Huai River
0
20
40
60
80
100
SEPA‘95
MWR‘95
SEPA‘96
MWR‘96
SEPA‘97
MWR‘97
SEPA‘98
MWR‘98
SEPA‘99
MWR‘99
SEPA‘00
MWR‘00
SEPA‘01
MWR‘01
I + II III + IV V + V*
Perce
nt
Source: China Environment Yearbook (various years), MWR Statistical Yearbook (various years).
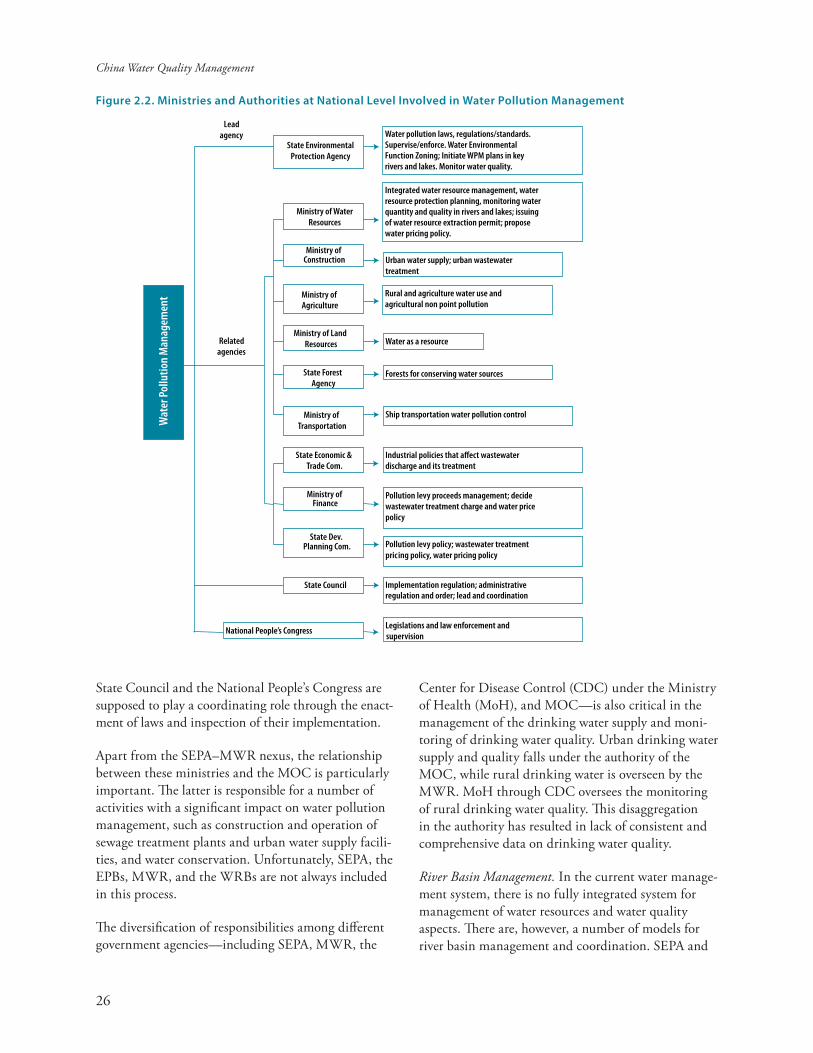
China Water Quality Management
26
State Council and the National People’s Congress are supposed to play a coordinating role through the enact-ment of laws and inspection of their implementation.
Apart from the SEPA–MWR nexus, the relationship between these ministries and the MOC is particularly important. Th e latter is responsible for a number of activities with a signifi cant impact on water pollution management, such as construction and operation of sewage treatment plants and urban water supply facili-ties, and water conservation. Unfortunately, SEPA, the EPBs, MWR, and the WRBs are not always included in this process.
Th e diversifi cation of responsibilities among diff erent government agencies—including SEPA, MWR, the
Center for Disease Control (CDC) under the Ministry of Health (MoH), and MOC—is also critical in the management of the drinking water supply and moni-toring of drinking water quality. Urban drinking water supply and quality falls under the authority of the MOC, while rural drinking water is overseen by the MWR. MoH through CDC oversees the monitoring of rural drinking water quality. Th is disaggregation in the authority has resulted in lack of consistent and comprehensive data on drinking water quality.
River Basin Management. In the current water manage-ment system, there is no fully integrated system for management of water resources and water quality aspects. Th ere are, however, a number of models for river basin management and coordination. SEPA and
Figure 2.2. Ministries and Authorities at National Level Involved in Water Pollution Management
Leadagency
State EnvironmentalProtection Agency
Related agencies
Wat
er P
ollu
tion
Man
agem
ent
Ministry of WaterResources
Ministry of Construction
Ministry of Agriculture
Ministry of Land Resources
State Forest Agency
Ministry of Transportation
State Economic & Trade Com.
Integrated water resource management, water resource protection planning, monitoring waterquantity and quality in rivers and lakes; issuing of water resource extraction permit; proposewater pricing policy.
Urban water supply; urban wastewater treatment
Rural and agriculture water use and agricultural non point pollution
Water as a resource
Forests for conserving water sources
Ship transportation water pollution control
Ministry of Finance
State Dev. Planning Com.
National People’s Congress
State Council
Industrial policies that affect wastewater discharge and its treatment
Pollution levy proceeds management; decidewastewater treatment charge and water pricepolicy
Pollution levy policy; wastewater treatment pricing policy, water pricing policy
Implementation regulation; administrative regulation and order; lead and coordination
Legislations and law enforcement and supervision
Water pollution laws, regulations/standards.Supervise/enforce. Water Environmental Function Zoning; Initiate WPM plans in keyrivers and lakes. Monitor water quality.

Policy and Institutional Considerations
27
MWR will typically advocate for the use of a specifi c approach, but the fi nal decision on which model to use is made by the State Council. Models include;
1. Water Basin Management Committees (WBMC): As referred, these were set up for many of the main rivers after the foundation of the People’s Republic and were responsible for fl ood control, river transportation, hy-draulic engineering, and construction and operation of water services facilities. Increasing pollution levels led to the establishment of Water Resource Protec-tion Bureaus (WRPB), which were under the dual supervision of MWR and SEPA. Th e latter provides technical guidance and covers relevant operational expenses. According to China’s institutional classifi ca-tion, these bureaus were public technical institutions with limited administrative power. Th e WBMCs were, therefore, not able to act as strong coordinators for water pollution management.
2. Water Resource Protection Steering Group (WRPSG): Th ese groups are co-chaired by SEPA and MWR and include deputy governors of river basin provinces as members. Meetings are used to express interests and coordinate activities, which require approval. Th is loose organizational structure brings together the relevant bodies, and facilitates coordination and implementation. Th is approach is used in the Huai River basin.
3. Joint Meeting for Pollution Management System: Th is State Council-endorsed model, which has been used in the Tai Lake basin, diff ers from the above in that SEPA plays a leading role, with the participation of local EPBs and other cooperating departments. Th e main limitation is that the system is only operating on an ad-hoc basis.
In practice, the management of shared river basins includes a combination of horizontal and vertical processes. Th e former operates within current boundaries (i.e. kuai kuai guan li) and has more administrative power, while the latter operates through MWR (i.e. tiao tiao guan li) and has more technical authority. River basin organizations provide technical directions and guidelines to local governments within the basin, while the local governments are responsible for implementation.
Th e models all provide a forum for consultative infor-mation sharing and joint planning that can be used for
proposing actions and policies. However, in spite of the participatory and inclusive approach, there have been confl icts between the two main parties. As a result of the increased authority of the MWR, SEPA decided in 2002 to distance itself from participation in the WRPB within the WBMCs and rather to exercise its increased authority through a direct SEPA–local government alliance and the application of a “joint meeting system” (see below). Th erefore, although the planning process for water quality management is basin-wide (SEPA formulates specifi c pollution management programs such as Liao, Hai and Huai), the actual implementa-tion is conducted through local governments. A more decentralized approach, with river basin authorities holding executive power for water-related activities in river basins, has not been implemented in China.
Urban Pollution Management. At the local level, decentralization has led to the creation of urban Water Aff air Bureaus (WABs) that are responsible for planning and operating water utilities. Th is structure means that there are two parallel management systems (EPBs and WABs) responsible for pollution manage-ment in the urban water sub-sector.
Environment Protection Bureaus (EPBs): EPBs are responsible for zoning of water bodies, issuing pollution permits, protecting drinking water and controlling pollution sources, while monitoring and management is often delegated to Environmental Monitoring Stations. Financing for these activities is subsidized with income from wastewater pollution charges and fi nes. However, in cases where local economic development plans are in confl ict with the EPB mandate, their authority to enforce environmental regulations and collect fees is often constrained (though this will vary between areas).
Water Aff air Bureaus (WABs): Th e urban WABs are subordinated to the Water Resource Department of the Ministry of Water Resources. Th e WABs provide an integrated management for city and county water services and are designed to establish an integrated wa-ter resource management strategy at the local level by breaking down the segmentation that exists between administrative regions and diff erent departments.
With the development of institutional reform of the counties, more and more cites and counties have established WABs. By the end of 2001, 633 WABs had been established, comprising;

China Water Quality Management
28
1 provincial WAB (Shanghai)4 sub-province WABs (Shenzhen, Wuhan, Haerbin and Dalian) 59 city WABs 569 county WABs
One of the specifi c tasks of the WABs includes reforming the water aff air and utility management systems. For example, Heilongjiang Province was the fi rst to introduce a water utility management system at the province level, but Heibei, Inner-Mongolia, and Shandong provinces have set them up in 50 percent of their counties and cities. A number of southern provinces with abundant water resources—such as Jiangsu, Guangdong, and Yunnan—have also actively carried out water aff air management system reforms. Th ese reforms, which have been promoted by MWR in order to unify water management, are rarely integrated with wider river basin management and are typically applied within the administrative boundaries of specifi c cities, countries, or provinces.
In spite of the apparent success of the “WAB” model and new management systems, a number of institu-tional issues remain. For example, it is unclear if the WABs should operate as governmental departments or as public cooperatives, of if they have a cocoordinating or a supervisory function. Similarly, the relationship between the City Bureaus and the River Basin Water Resources Bureaus is not well defi ned. Th ese issues can lead to confl icts and undermine the eff ectiveness of the river basin institutions.
Financing Water Pollution Management
Between 1995 and 2000, China invested more than 360 billion yuan in environmental protection, which was only 80 percent of the budget set out in the 9th Five Year plan (’95 – ’00) and about 0.87 percent of the country’s GDP. However, actual investment in environmental protection has increased yearly in the 10th Five Year Plan period from 1.13 percent of GDP in 2000 to 1.40 percent in 2004 (China Statistical Yearbook, 2005). In the most developed regions (Peking, Shanghai and the Pearl River Delta), the share of GDP spent on environmental protection exceeded 3 percent, two-fi fths of which was used for water pollution management, e.g. industrial control and urban wastewater treatment. Th e allocation for
""
""
environmental protection is projected to increase signifi cantly in the 11th (2006–2010) and 12th (2011–2015) plans, and by the 13th Five Year Plan (2016–’20) it is projected to reach 524 billion yuan (Figure 2.3)
Infrastructure-related investment is steadily growing and amounted to more than 15 billion yuan in 1998, which is ten times higher than the corresponding investment in 1991. Investment in technology in-novation and cleaning up “old industries” is still high and accounts for about half of the industry-related control costs. If we consider the 14 provinces and cities in Northern China, investments in municipal and industrial wastewater treatment plants and sewerage systems in the period 1998 to 2004 amounted to around 49 billion yuan, and had been steadily increas-ing over the period (World Bank, 2005; Statistical Yearbook, 2005). Th e urgent need to develop sewerage systems appropriate for local treatment capacity has, to some extent, been recognized; between 1998 and 2003, annual investment in sewers (in northern regions) increased 272 percent.
Establishment of sewers and treatment facilities has not been even across the country, with more developed areas receiving greater investments (perhaps refl ecting their ability to pay for these facilities). Th is pattern is refl ected in the level of centralized wastewater treat-ment, which was 30 percent on average (2003), but up to 50 percent in Beijing, and as low as 15 percent in north Hubei.
In order to achieve a centralized wastewater treatment rate of 60 percent, it is estimated that a total invest-ment of around 14 million RMB will be required between 2003 and 2010 (World Bank, 2005). Invest-ments of 5.6, 7.6, and 0.65 million RMB are required for wastewater treatment plants, sewer networks, and sludge handling facilities respectively (World Bank, 2005).
Funding sources. Sources of funding for water pollution management in China include central government, fi nancial institutions, and the private sector. Funds planned under the fi ve-year plans represent central and local budget commitments to water pollution management, and foreign sources would represent additional streams of investment. Th e dominant source of investment in pollution management is still public

Policy and Institutional Considerations
29
cost-benefi t-based prioritiza-tion. Th is approach has a number of shortcomings:
It is based on a single investment channel, which lacks economic driving mechanisms and inhibits the use of private fi nanc-ing. Consequently there are insuffi cient funds for investments in pollution management. To compensate for the lack of governmental funding, several projects have been fi nanced through interna-tional loans. Th is approach has favored use of foreign
technology and has therefore constrained the development of domestic technology. Th e existing investment system does not include a market mechanism, so input-output and cost accounting systems have not been established.
Water Pollution Management Case Studies
General. While every water body in China presents a diff erent set of physical and socioeconomic challenges, many features are common across similar rivers and lakes, and water pollution management lessons can be gained by looking at certain case studies. Th e Huai River and Lake Dianchi cases are particularly interest-ing for a number of reasons. Both represent water bodies that have been the focus of considerable national and international attention, with many projects and initiatives yielding a mixed set of results. As typical for a northern river, per capita water availability in the Huai River basin is low (~ 450 m3/capita/year) and industrial pollution has been a major problem. Th e case of Lake Dianchi is typical of many shallow lakes in China, as it is experiencing increasing levels of eutrophication from growing municipal and non-point pollution sources. Th e sections below highlight a few general features of the water pollution experiences from these locations.
Conditions. Over the last 15 years, water quality in the Huai River basin has declined signifi cantly, and quality in tributaries is a particular concern (see Figure 4A, Annex 1). Initiatives over the last decade, targeting
"
"
"
money, provided as allocations from national or regional budgets, including revenues collected from environ-mental fees and fi nes. However, with increasing trust in China’s market mechanism and economy, fi nancial institutions and the private sector have shown increasing interest in investing in environmental protection. As a consequence, there is an increasingly diverse range of fi nancing sources for pollution management.
In the 10th fi ve-year plan (2001–2005), the govern-ment set out to restructure these fi nancing mechanisms by integrating regulation with market-based ap-proaches. Measures have been taken to develop private and public fi nancing, to subsidize key infrastructure construction, to increase loans to enterprises, to focus more on pollution abatement and clean production, and to upgrade the pollution charge system.
Th e next step in setting up fi nancing options will be to open investment in pollution management to private capital markets. In addition, or in combination with this, it is envisaged that wastewater facilities will come under private management, which will require the setting up and collection of sewage disposal fees that meet investor’s expectations.
Th e existing investment system has evolved under a regime of strict central planning dominated by government investments. However, the government is also responsible for defi ning environmental and social goals, and the current set-up has no mechanism for
Figure 2.3. Investment Projections in Five Year Plans (1995–2020)
0
100
200
300
400
500
600
9 5YP 10 5YP 11 5YP 12 5YP 13 5YP
Yuan
(bill
ion)
Water Pollution Control Air Pollution Control Solid Waste ManagementPollution Control
Source: World Bank 2002, Chinese Academy for Environmental Planning (2004).

China Water Quality Management
30
industrial pollution, have led to some improvements, and some sections of the river now have relatively clean water. Signifi cant reductions in COD loads from industry and urban residential discharges following completion of urban wastewater treatment plants have alleviated the problem of organic pollution. Th e main problem now is non-point sources such as fertilizer runoff . Now nitrate and nitrogen (in the form of am-monium nitrate) are dominant in the river’s pollution structure. Both pollutants are primarily associated with agricultural runoff .
Institutional Framework. Th e Huai River passes through diff erent administrative regions so authority for water pollution management in the basin is divided among four provincial EPBs. Technical supervision and inter-provincial coordination is undertaken by SEPA, which also heads up WRPSG (along with MWR). Other relevant institutional bodies include the Huai River Water Resource Protection Bureau, which is responsible for water supply and protection; and the WRPSG, which coordinates water resource management and pollution control (including dispute resolution).
Legislation and policy tools. A range of legislation and policy tools has been applied in the Huai River basin. Total Amount Control (TAC) targets—for counties, cities, and enterprises—provided a positive stimulus for various pollution management initiatives. Imple-mentation of the “Fifteen Small Shutdown Policy” has successfully eliminated a large amount of pollution
Figure 2.4. River Basin Management—The Case of Huai River
Source: Chinese Academy for Environmental Planning.
from the dirtiest industrial sectors, with 3,860 fi rms closed as of 2002. However, social equity implications have made it hard to sustain this initiative, and many enterprises have re-opened and continue to pollute.
Prices for water supply and treatment and pollution levies are generally considered to be too low, but reforms for price increases are being implemented. Th e pollution levies and wastewater treatment charges are levied in all provinces of the basin, and proceeds are used to raise funds for construction and operation of treatment plants. Local offi cials consider pollution levies to be one of the most eff ective tools available. However,
monitoring of progress has been diffi cult and has tended to focus excessively on COD loads.
Investment in Water Pollution Management. Th e 9th fi ve-year plan (1995–2000) required 52 wastewater treat-ment plants to be established, 30 of which are complete or under construction. Progress, however, has been much slower than planned, and established units cannot run at full capacity due to a lack of complementary sewer networks. As a result, targets for COD pollution were exceeded by 8 percent by 2000. During the 10th fi ve-year plan (2000–2005), COD loads were restricted to 1.3 million tons/year. Th e target for the 11th fi ve-year plan is a fi ve percent reduction of this quantity.
A major obstacle for investment in water pollution management infrastructure is the low level of recogni-tion it receives among local authorities. A fundamental element in this problem is the inter-disciplinary nature of river basin management and the incentive problems this creates; for example, the benefi ts from expensive abatement in one province will be felt further down-stream. However, the majority of funding for pollution management investments must come from local budgets (user fees or loans), with only minor central commitments. Th is represents a major challenge for SEPA and the WRPSG.
General situation. Economic growth, increasing local urban population, and changing agricultural practices around the Lake Dianchi basin have increased water shortage problems and the pollution loads entering the

Policy and Institutional Considerations
31
lake. Nitrogenous, phosphoric, and organic pollution of the lake is so heavy that the water body is highly eutrophic, causing incidents of severe algae blooms. Total levels of N, P, and COD discharges into the lake in 2004 were 14,446, 1,312, and 71,891 tons respectively. Targets for reductions by 2010 are 8,829, 766, and 34,228 tons respectively. Blue-green algae concentrations are high (thousands or ten thousands mg/m3). In the summer months, sections of the lake experience oxygen defi cit (anoxic conditions). Under these conditions, water turns black and has a very unpleasant odor.
Th e status of the lake’s two sub-sections can be summarized as follows:
“Caohai”: Over the last decade COD has been eff ectively controlled, but total concentration of
"
P (TP) and N (TN) increased two- to three-fold. Th is part of the lake suff ers severe eutrophication and oxygen depletion. “Waihai”: COD, TN, and TP pollution is less severe.
Institutions. Th e Kunming Environmental Protection Bureau, which is the city-level EPB reporting to the Kunming city government, and its subsidiary bodies are responsible for water pollution and quality man-agement, project implementation, and application of environmental law around Lake Dianchi. Th e Dianchi Protection Committee was initially established as a watershed management authority to enforce the Dianchi Protection Ordinance, but has since been strengthened and is now the lead agency for decision making on major issues concerning lake protection and treatment. Th e Dianchi Administration Bureau and the Kunming Dianchi Management Offi ce both sit on the committee. Th e former is responsible for law formulation, promulgation, and enforcement, as well as monitoring impacts and managing funds. Th e latter consolidates and organizes management activities for the lake, but this process overlaps somewhat with the EPB’s role.
Legislation and policy tools. The requirement for EIAs has generally been well-enforced in the area and implementation of the emission permits system has now reached 780 enterprises. A system for the collection of fees for wastewater drainage and emissions has been established for large-scale factories, but the inclusion of small-scale operators has been more problematic. Supply of water in Kunming is currently charged at 1.8 Y/M3 (includes a sewerage fee of 0.56 Y/M3), which is very low compared to other areas (4.5 Y/M3 in Beijing). Incentives for water conservation or re-use are therefore limited and scarce water resources are signifi cantly overused. Th e charge for sewage costs is also considered low and has led to underfunding and closure of wastewater collection and treatment facilities.
Other local initiatives to support lake water quality have included the banning of phosphorus in detergents in order to reduce the infl ux of this pollution into the lake (phosphorus loads are a key element in the eutrophication process). Th e local government has also been actively trying to raise public awareness about the vulnerability of the lake and the need for envi-ronmental protection through media and propaganda
"
Figure 2.5. Shallow Lake Management—The Case of
Lake Dianchi
Source: Yunnan Institute of Environmental Science.

events. Finally, there has been extensive engagement with local industry, with clean production audits in 71 polluting fi rms, and the provision of clean production training to 242 key enterprises, with more planned in the future. Th e clean production message seems to be getting through, as some of the larger fi rms are now becoming interested in ISO 14000.
Investments. During the 9th fi ve-year plan period (1995–2000), 65 treatment projects were completed, including the establishment of four sewerage treatment facilities with a combined capacity of 365,000 tons/day (65 percent of wastewater production in Kunming). However, similar investments were not made in the sewage pipe network. Collection rates are only around 33 percent, which means that many of the treatment facilities are either closed or only partially operational. Delayed implementation meant that much of the planned work (12 projects, 1.29 bill RMB) could not be completed before the 2000–2010 period, and lake water quality targets were not met (in fact, lake water quality deteriorated).
Pollution management was a major feature of the 10th fi ve-year plan, including 4.2 billion RMB allocated for 10 pollution man-agement projects, and 3 billion RMB for investments in municipal pollution management. However, less than half of the projects were completed within the fi ve-year period, and many have only just started. Th e lack of preparatory research and poor evaluations of completed works have been sighted as signifi cant shortcomings in the approach.
Initial indications are that the 11th fi ve-year plan (2005–2010) will include funding for (a) pollution management, (b) supervision, (c) administration, and (d) science/technology demonstration. Investments in municipal pollution management will account for the largest fraction of the budget. Financing for these activities has largely been through government budgets, but increasing attention is now being paid to options such as build-operate-transfer (BOT) schemes. However, charges for tap water, drainage, sewerage, and treatment are universally low and this is potentially an important area of fi nance.
During the 10th fi ve-year plan period, the central government outlined its objective that provincial capitals, including Kunming, should reach a 100 percent wastewater collection rate (sewage) by 2010, which would ensure full utilization of installed
urban wastewater treatment capacity. However, following strong interventions from local govern-ments, including Kunming city, the plans had to be extended to about 2020. Th e extension of collection systems into old city areas and certain outskirts has a particularly high investment cost. Th is means that the installed
wastewater treatment capacity may hardly be fully utilized, and by the time a collection system is com-pleted, certain wastewater treatment plants may have become outdated. In certain cases, it may have been more feasible to establish wastewater treatment plants closer to the users.
Eutrophication in Dianche Lake

– 33 –
3. Toward a Future WPM Policy in China
Introduction
This chapter provides recommendations for further improvements in water pollution management in China based on, (a) analysis set out in the preceding chapters,
(b) dialogue with Chinese counterparts during the preparation of the study, and (c) experiences from the complex history of evolution of pollution management and integrated water resources manage-ment in other parts of the world. Th e recommendations that we provide are described at a rela-tively generic level. For more details on some of the issues, we refer to the main (2003) report.
Basic Condition
and Major
Features of Water Management in China
Th ere is no country in the world with the same institutional structure, the same water-related problems, or the same economic development pattern as China. Th us, there is no “model country” to use as a reference point in establishing an effi cient water pollution management system. Valuable lessons can
be learned, however, from several countries or regions where the development of pollution management has similarities to development in China.
To fi nd potential “model” cases, we noted the follow-ing major features of water pollution management in China:
Th e country is the size of a continent.Th e economy of the country is developing very rapidly, resulting in urbanization and changed industrial structure. Huge regional variability exists in the economic structure.Huge regional variability exists in the availability of water resources.In many regions, serious water
scarcity and water quality issues appear both in surface water and groundwater.Coexistence of many pollution problems is typical for many regions.Controlling industrial emissions and toxic materi-als was initiated relatively early and successfully; however, industrial pre-treatment is often missing.
""
"
"
"
"
"
Water treatment in Kunming City

China Water Quality Management
34
Water- and environment-related laws and decrees are not properly harmonized and often overlap. Th e institutional system is complicated with many levels and administrative units, both vertically and horizontally. Th ere is a tendency to decentralize, but the state still plays a strong role in pollution management, particularly through its role in fi nancing and defi ning economic principles.Today, major concerns include (a) urban pollution management due to rapid urbanization and the low level of infrastructure, and (b) the growing need for emerging agricul-tural non-point source pollution management.Water quality legislation still focuses primarily on protective measures, incorporating tools such as standards, ambient water quality criteria, fees and fi nes, total load control etc. However, there is a lack of integration between these approaches. Further-more, the target for each of these is often not set properly and thus they have little or no impact in practice. Water monitoring and legal enforce-ment is weak or lacking.Huge investments are needed in water pollution management.
Th e most useful analogy can probably be found between China and two large, multi-state or multi-country entities, the United States and the European Union. Like China, both are characterized by the fact that administrative borders do not coincide with river basin geography, which implies the need to address shared water resource issues. Additional experi-ences may stem from Central and Eastern Europe (CEE), which has been going through tremendous economic transition during the past fi fteen years (see Box 3.1).
"
"
"
"
"
"
Box 3.1. Water Pollution Management in Transition
Economies—Experiences from Central and Eastern Europe
CEE countries have gone through unprecedented political, social, economic and institutional transition during the past fi fteen years. This process en-abled some of them to join the European Union (EU) in 2004. From a water
quality management perspective, this transition was associated with the need to simultaneously address many diff erent coexisting problems, e.g. point and non-point sources, traditional and toxic contamination, surface and subsurface waters, and local and regional problems. Most fully developed countries managed these issues in a step-by-step manner over several decades.
The transition resulted in many changes in the management of water pollution, particularly:
Market-based pricing led to a drastic reduction in fertilizer application and dif-fuse pollution;
Abolishing outdated technologies in industry and introduction of clean tech-nologies has signifi cantly reduced emissions;
Increased tariff s for water use and wastewater handling have reduced water consumption.
The combination of these factors has led to remarkable improvements in surface water quality, highlighting the linkages that exist between economic restructur-ing and environmental management.
Municipal emissions largely remained untouched during the transition. However, increased tariff s for water use led to reductions in public water consumption by 40 to 50 percent. As a consequence, many of the previous hydraulically overloaded mu-nicipal wastewater treatment plants ended up with excess capacity. The changed (denser) composition of the raw sewage caused serious operational problems.
Lack of industrial pre-treatment was found to be a serious issue. Residence time in water distribution networks increased signifi cantly, which also resulted in water quality problems.
During this period, the central issue was how CEE countries could achieve the larg-est improvement in the short run, using the scarce fi nancial resources available, and how they could design a process to ensure further improvements in order to meet EU requirements and standards. A number of detailed studies led to the proposal for “step-wise” development with a time horizon of two to three decades. Within this development process, the fi rst few years should be devoted to identifying and dealing with priority “hot spot” issues, and applying least-cost water quality management policies on the river basin scale. The second phase should focus more on sewer renovation, wastewater treatment plant upgrading, and other develop-ments to meet EU criteria.
In order to implement the above ideas, it was recommended that policy makers initially defi ne phased effl uent and ambient standards in harmony with multistage upgrading and development of wastewater treatment plants, accompanied by tightening requirements and promoting best management practices in industry and agriculture.
"
"
"

Policy and Institutional Considerations
35
Focusing on Strategic Planning
In spite of the extensive eff ort that has gone into pollution management in the last decades, China still has a long way to go to handle existing water pollution problems and to keep pace with new and emerging issues. Th ere is a clear need for an overall strategic plan for the coming two to three decades. Th is plan should be developed with the following elements:
Defi nition of a long term vision for water quality, including specifi c targets (see Box 3.2);Identifi cation of sub-periods within the total time frame, with realistic targets set for each of these periods. Th e “5-Year Plan” periods may be considered as suitable “sub-periods.”
"
"
A strategic approach should recognize the need for a long-term perspective in pollution management. Realistic targets and time schedules should be set for pollution reduction and water quality improvement. Achievable targets are needed, because many of the required measures will not have a measurable impact for some time, and institutional actions and legal and economic changes may take several years to implement. Ideally, targets—such as percentage of infrastructure development for urban and rural areas; level of meeting drinking water quality standards; municipal, industrial and agricultural emission reductions; water quality improvements in terms of quality classes; fees collected; level of cost recovery; and budget for planned invest-ments—should be quantifi ed.
A change in strategic focus is also envisaged. In previ-ous periods, the focus has been on industrial pollution
and treatment of municipal wastewater, particularly aimed at controlling COD and heavy metals. In the future, water pollution prevention in China should pay more attention to nutrients (N and P) and persistent organic pollutants. More eff orts will be needed to address emerging water pollution issues, such as agricultural pollution and surface runoff . Th ese new problems will also require new or modifi ed means and strategies for policy implementation and enforcement.
With growing levels of urbanization (see section in chapter 1), there is an increasing need for municipal wastewater collection and treatment facilities. In this develop-ment process, all related forms of infra-structure, e.g. water supply, wastewater, water and sewer networks, treatment and reuse facilities, should be seen in connec-tion. By considering the broader picture, it is easier to spot and assess imbalances between the coverage and capacity of collection and treatment systems.
Phased development is also an important concept to follow. Th is approach can be applied on the basis of comprehensive
Box 3.2. The European Union—Water Framework Directive
Since 1975 nearly thirty so-called “daughter directives” have been created by the European Commission. They defi ne water quality standards for various substances and uses and cover topics such as drinking water quality, bathing
waters, dangerous substances, municipal wastewater treatment, and integrated pollution prevention and control. In the 1990s it became apparent that directives alone would not lead to an integrated water management strategy. Thus the unifi ed water policy of the EU, the Water Framework Directive (EU-WFD), was ap-proved in 2000 and is now under implementation in 25 countries.
The EU-WFD establishes a framework for the protection of waters regardless of national borders with a long-term approach to management. The basic unit for management is the river basin, which is defi ned as an area of land from which all surface runoff fl ows into the sea at a single river mouth, estuary, or delta.
The principal concept of the EU-WFD is to ensure the “good” status of waters. The purpose is to protect and, where possible, to enhance the state of water eco-systems, the aquatic environment, water quality, and groundwater by a variety of measures. It is also used to promote sustainable water use and to mitigate the eff ects of fl oods and droughts.
Cost recovery is one of the main pillars of the EU-WFD. A crucial element in this approach is to develop plans based on aff ordability that can be implemented. However, it is not yet clear how this approach will perform in cases where user groups and benefi ciaries are not well-defi ned (e.g. fl ood control).
A crucial element for implementation of the EU-WFD is the river basin management plan. This plan addresses major characteristics of a river basin, the various human activities, monitoring, objectives, and a program of measures. The deadline for the program is 2015, with reviews and updates every six years thereafter.
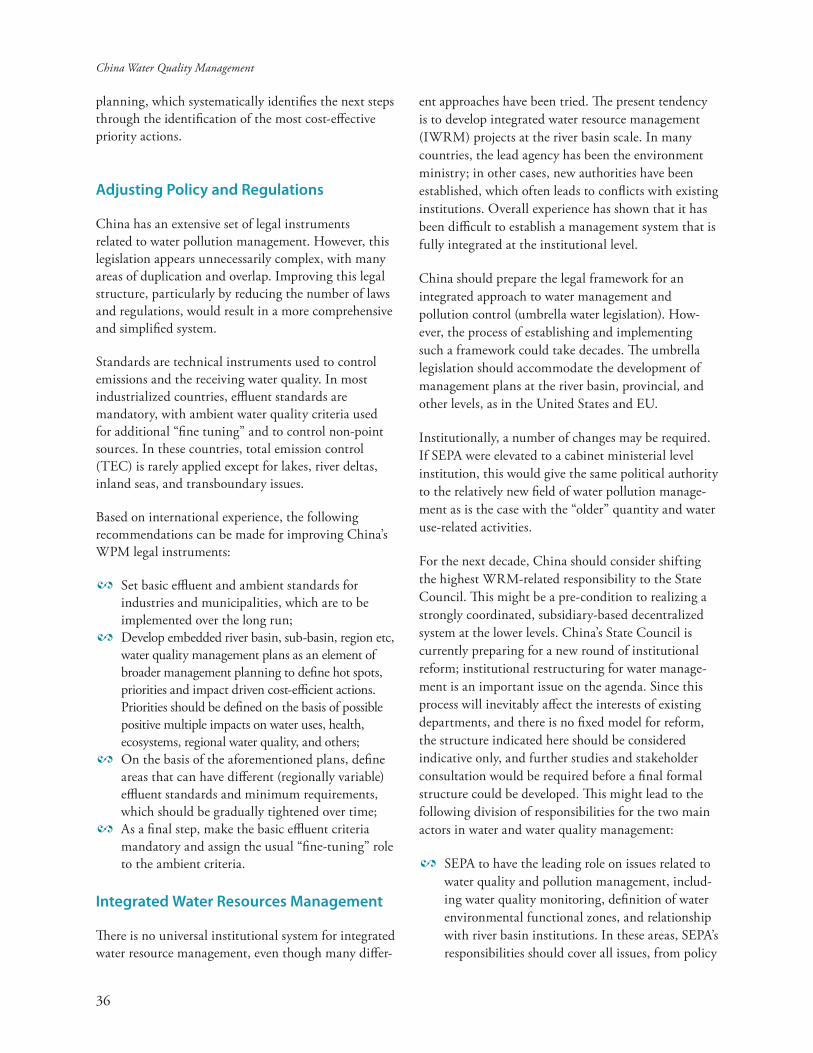
China Water Quality Management
36
planning, which systematically identifi es the next steps through the identifi cation of the most cost-eff ective priority actions.
Adjusting Policy and Regulations
China has an extensive set of legal instruments related to water pollution management. However, this legislation appears unnecessarily complex, with many areas of duplication and overlap. Improving this legal structure, particularly by reducing the number of laws and regulations, would result in a more comprehensive and simplifi ed system.
Standards are technical instruments used to control emissions and the receiving water quality. In most industrialized countries, effl uent standards are mandatory, with ambient water quality criteria used for additional “fi ne tuning” and to control non-point sources. In these countries, total emission control (TEC) is rarely applied except for lakes, river deltas, inland seas, and transboundary issues.
Based on international experience, the following recommendations can be made for improving China’s WPM legal instruments:
Set basic effl uent and ambient standards for industries and municipalities, which are to be implemented over the long run;Develop embedded river basin, sub-basin, region etc, water quality management plans as an element of broader management planning to defi ne hot spots, priorities and impact driven cost-effi cient actions. Priorities should be defi ned on the basis of possible positive multiple impacts on water uses, health, ecosystems, regional water quality, and others;On the basis of the aforementioned plans, defi ne areas that can have diff erent (regionally variable) effl uent standards and minimum requirements, which should be gradually tightened over time;As a fi nal step, make the basic effl uent criteria mandatory and assign the usual “fi ne-tuning” role to the ambient criteria.
Integrated Water Resources Management
Th ere is no universal institutional system for integrated water resource management, even though many diff er-
"
"
"
"
ent approaches have been tried. Th e present tendency is to develop integrated water resource management (IWRM) projects at the river basin scale. In many countries, the lead agency has been the environment ministry; in other cases, new authorities have been established, which often leads to confl icts with existing institutions. Overall experience has shown that it has been diffi cult to establish a management system that is fully integrated at the institutional level.
China should prepare the legal framework for an integrated approach to water management and pollution control (umbrella water legislation). How-ever, the process of establishing and implementing such a framework could take decades. Th e umbrella legislation should accommodate the development of management plans at the river basin, provincial, and other levels, as in the United States and EU.
Institutionally, a number of changes may be required. If SEPA were elevated to a cabinet ministerial level institution, this would give the same political authority to the relatively new fi eld of water pollution manage-ment as is the case with the “older” quantity and water use-related activities.
For the next decade, China should consider shifting the highest WRM-related responsibility to the State Council. Th is might be a pre-condition to realizing a strongly coordinated, subsidiary-based decentralized system at the lower levels. China’s State Council is currently preparing for a new round of institutional reform; institutional restructuring for water manage-ment is an important issue on the agenda. Since this process will inevitably aff ect the interests of existing departments, and there is no fi xed model for reform, the structure indicated here should be considered indicative only, and further studies and stakeholder consultation would be required before a fi nal formal structure could be developed. Th is might lead to the following division of responsibilities for the two main actors in water and water quality management:
SEPA to have the leading role on issues related to water quality and pollution management, includ-ing water quality monitoring, defi nition of water environmental functional zones, and relationship with river basin institutions. In these areas, SEPA’s responsibilities should cover all issues, from policy
"

Policy and Institutional Considerations
37
formulation and program implementation to law enforcement.MWR to have the overall responsibility for the quantitative aspects of water resource manage-ment, including hydrological monitoring, water planning, management of distribution, and conservation of water. Close cooperation with SEPA will be needed to fi nd optimal solutions for water management issues, especially for developing the river basin perspective in planning.
An important feature of water resource manage-ment in industrialized countries, independent of institutional structure or location, is that the authority for management of utilities is kept separate from, and has no institutional linkages to, the authority for control and regulatory functions (be it water pollution management, quality control, tax control, etc.). Th is approach is also recommended to be followed in China. As part of the ongoing reform of water man-agement and the implementation of the new Water Act, the roles of respective agencies (SEPA and MWR) and the departments in charge of construction and operation of water utilities should be clarifi ed.
Part of the rationale for IWRM is the fact that many aspects of pollution control cannot be separated from water resource management, particularly not in countries, such as China, where scarcity is a problem. Under such conditions, it is essential to look for ways to close water and material cycles and increase re-use and recycling. China has many such opportunities, primarily in rural areas. Th e “cascade management” approach should also be considered. Th is implies that water is used several times and is transferred among diff erent sectors and use categories (municipal, indus-trial, agricultural, etc.), where treatment is performed only at the level prescribed by the subsequent use. Th e application of this kind of an approach obviously infl uences standard setting.
Strengthening Economic Instruments
Fees and fi nes are important instruments in pollution management. Fines are supposed to penalize emitters for discharging wastewater of a volume or concentra-tion violating effl uent standards. Fees are taxes based on well-defi ned economic principles, normally set
"
"
equal to or just above the marginal cost of wastewater treatment, so that treatment becomes more economical than pollution. Th e reasons for both measures are to avoid social damage and excess profi ts for polluting entities at the expense of society.
If a system for Total Load Control is used together with trading of discharge permits (e.g. for managing a lake eutrophication problem), fees should not be applied, since they would contradict the principle of trading.
In the development of a future Chinese fee and fi ne system, the following principles should be considered:
Fees and fi nes should be introduced gradually in parallel with the development of the water quality standards and ambient criteria;Fines should be highest for discharges of toxic materials; Aff ordability constraints may mean that it is impractical to apply realistic fi nes above phased effl uent standards for municipal wastewater discharges. Under such conditions, it is probably more realistic to declare a lower level of fi nes, specifi ed for instance on the basis of discharges measured in population equivalent (standard discharge generated per person per day); Money collected from fees and fi nes should be invested in water pollution management systems, e.g. for water treatment, monitoring, or dispersed trough an environmental fund.
Strengthening Financing
Th ere is a wide range of potential sources for fi nanc-ing. Options include cash fl ow from user fees, charges and penalties, international aid, concessions from multilateral and bilateral agencies, national subsidies, grants and soft loans (from central government), subsi-dies from local and central government budgets, debt cancellations, commercial loans from local bodies, and loans from international banks at market rates. A lot of emphasis has been placed on private investment as a source of new fi nance for water utilities, and China has piloted new project fi nance schemes (including various BOT forms) from the early 1990s, including in the water sector.
"
"
"
"

China Water Quality Management
38
When privatization occurs, most cases involve foreign participation in operating companies, with asset ownership remaining in public hands and the public sector responsible for raising fi nance for new invest-ment. Th e present situation is that many governments are resistant to further private involvement in the water sector, and the leading multinational private water companies have an increasingly selective attitude toward overseas exposure. Instead of being a major source of fi nancing, it is more realistic to regard multinational private companies as catalysts that can unlock previously inaccessible sources of funds
through their know-how, benefi cial impact on projects and institutions, and through the goodwill that comes with their involvement.
An appropriate government strategy to raise initial investment capital would therefore be to maximize uptake of grants and soft loans available from interna-tional agencies. Th e government will have to decide how much of a public subsidy should be extended to the water sector to fund “public goods,” and phase out remaining subsidies as quickly as possible. Th e government should also decide how much privatization is desirable / feasible, where, and of what type, and seek to attract private partners and organize long-term international and commercial loans to cover remaining needs.
Over the long run, the principle of cost recovery should be one of the basic pillars of water pollution management in China. Th is will have a major impact on tariff s, which in the future might have to cover the full cost of new investments. Th is would require the gradual phasing out of subsidies. Experiences from other countries in the same situation show that with increasing tariff s, household consumption in urban areas is likely to settle in the range of 120-140 m3 per capita/day.
Urban Pollution Management
Under conditions of transition from a planned to a market economy, it is important to avoid the establishment of unnecessary future excess capacity. Th e volume of wastewater produced and the chemical composition of the water might be changed as a result of increased water tariff s and structural changes in industry. Future design conditions of various facilities must not be extrapolated from past data and needs. Incentives should be used to ensure that water supply, sewerage, wastewater treatment, and sludge management are constructed simultaneously and in an integrated way.
Box 3.3. Financing and Use of Economic Instruments in
Central and Easter European Countries
Central and Eastern European Countries have gone through dramatic eco-nomic transition with fundamental changes in the management of water pollution (see Box 3.1). Their experiences with respect to economic instru-
ments and fi nancing are briefl y described here.
Market-based economic instruments have not yet been fully implemented. While charges and fi nes have been implemented and have increased over time, fees are generally not high enough to cover the marginal cost of water and wastewater service provision. The fees have been gradually increased to change the behavior of users and to improve service performance. Collected fees are often channeled into environmental funds to be re-distributed for environmental projects by the state and not used exclusively to support water facilities, though there are also examples of a combination of the two allocations.
Investments in the water sector are increasing, but more eff ort is needed to achieve compliance with EU standards and directives. In the more developed CEE coun-tries, it is estimated that, assuming 15-year implementation plans, water-related expenditures will be about 1 percent of the GDP. Assuming the principle of cost recovery is applied for water services, inhabitants should pay about 4-5 percent of their net income for water supply and treatment. Thus aff ordability is a crucial issue, and in less-developed CEE countries, the realization of plans will need much more than the 15 years indicated for richer countries.
Sources of fi nance for investments include national funds, grants, soft loans, EU aids (often ineffi cient), subsidies, loans from national and international banks, etc. In many cases the fi nancial plans are weak and the state budget remains impor-tant. The involvement of private investors and operators has not materialized as expected, and better mechanisms for sound private-public partnership have to be found.
Pre-conditions for accessing the international sources of fi nancing include:
a) Stable national economies.
b) Well-developed plans, including cost-benefi t calculations and feasibil-ity studies to justify the investment.
While the region is on the brink of achieving the fi rst condition, many shortcom-ings remain in the plans and studies developed for the required investments.
"
"

Policy and Institutional Considerations
39
In large cities and towns, appropriate or alternative technologies are often not feasible. In these cases, the only alternative is to consider the phased, step-by-step development of traditional technologies from me-chanical treatment. Development into more advanced treatment can then be gradually investigated if neces-sary, e.g. chemically enhanced mechanical treatment, high- and low-load biological treatment, bio-fi lm, advanced treatment with nutrient removal, etc. Design of treatment facilities should ensure a certain degree of fl exibility, so that appropriate technologies can be incorporated in the future.
Industrial pre-treatment is crucial to avoid problems with operation and sludge disposal at municipal plants.
In peri-urban and rural areas, options other than traditional sanitation should be considered due to the high costs of installing sewerage networks.
In urban pollution management, the roles and tasks of the Municipal Environment Protection Bureaus and Municipal Water Boards need to be clarifi ed.
Th e Municipal Environment Protection Departments should be in charge of the following tasks:
Drafting water pollution management policies, laws, regulations and standards, and supervising and enforcing their implementation. Organizing the target-setting process; determin-ing total load control targets; preparing water pollution management and ecological protection plans for the main rivers, and supervising their implementation. Carrying out monitoring of water quality and pol-lution sources, resolving disputes on trans-county pollution, and compiling/distributing information from the monitoring activities. Determining conditions and organizing measures for protection of drinking water sources against pollution.
Th e following recommendations are made for the functions of the Municipal Water Boards:
Administrative, regulatory, and business operation functions of Municipal Water Boards should be separated.
"
"
"
"
"
All water enterprises under Municipal Water Board jurisdiction should be established as independent economic units.
Industrial Pollution
China has made signifi cant progress in managing industrial pollution. With the development of new production technologies, pollution mitigation op-portunities are constantly changing.
In principle, the available funds for pollution treat-ment should be allocated to sectors where the greatest impact can be achieved. It is important to select the preferred investment sector to gain the socially optimal eff ect of investments in pollution management. For in-stance, the main COD discharge sectors are pulp and paper production, food processing, chemicals, phar-maceuticals, breweries, textiles, and the metal smelting and processing industries. If the average treatment cost for one ton of COD is compared across sectors (Table 3.1), it is evident that the food processing industry and the breweries have the lowest cost and thus will be the sectors where the highest environmental benefi t per unit investment can be attained.
Wastewater recycling technologies can reduce urban natural water demand, mitigate water pollution, and reduce the impact of wastewater on water quality. In appropriate cases, full treatment of wastewater can be introduced with the recycled water used in agriculture, industry, and municipal facilities. In water-defi cient areas, the water recycling processes should be inte-grated into wastewater treatment works.
Legislation should focus on supporting the transfer of clean technologies, and eff orts should be made to introduce environmental management systems at the company level. Cleaner and more effi cient industrial production should also be a priority for policy makers. Th e main aim would be to reduce water use, and thus the level of wastewater discharge per unit product. Technological innovation with a focus on increasing water effi ciency should be encouraged. Given the relatively high levels of COD load compared with GIOV shares observed in the pulp/paper and food industries, these sectors would seem like an ideal starting point. Closed-circuit technologies for water treatment should be promoted in the iron and steel, electric power, chemical, and coal industries.
"
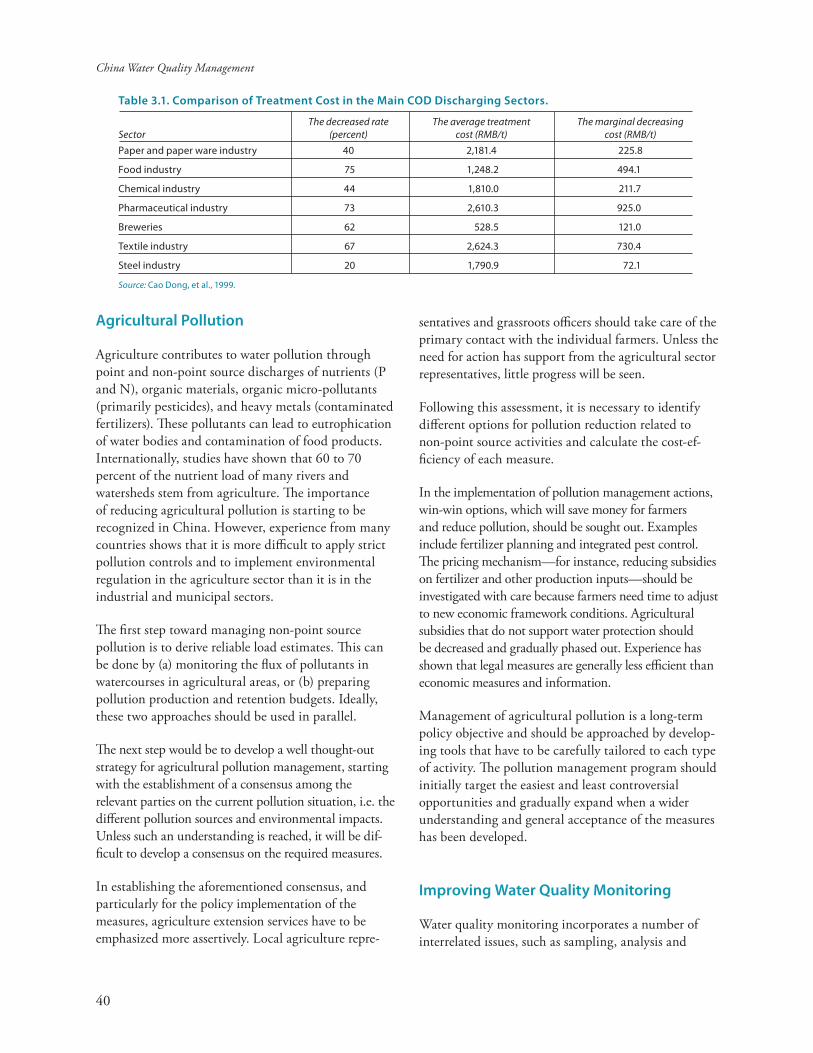
China Water Quality Management
40
Table 3.1. Comparison of Treatment Cost in the Main COD Discharging Sectors.
The decreased rate The average treatment The marginal decreasingSector (percent) cost (RMB/t) cost (RMB/t)Paper and paper ware industry 40 2,181.4 225.8
Food industry 75 1,248.2 494.1
Chemical industry 44 1,810.0 211.7
Pharmaceutical industry 73 2,610.3 925.0
Breweries 62 528.5 121.0
Textile industry 67 2,624.3 730.4
Steel industry 20 1,790.9 72.1
Source: Cao Dong, et al., 1999.
Agricultural Pollution
Agriculture contributes to water pollution through point and non-point source discharges of nutrients (P and N), organic materials, organic micro-pollutants (primarily pesticides), and heavy metals (contaminated fertilizers). Th ese pollutants can lead to eutrophication of water bodies and contamination of food products. Internationally, studies have shown that 60 to 70 percent of the nutrient load of many rivers and watersheds stem from agriculture. Th e importance of reducing agricultural pollution is starting to be recognized in China. However, experience from many countries shows that it is more diffi cult to apply strict pollution controls and to implement environmental regulation in the agriculture sector than it is in the industrial and municipal sectors.
Th e fi rst step toward managing non-point source pollution is to derive reliable load estimates. Th is can be done by (a) monitoring the fl ux of pollutants in watercourses in agricultural areas, or (b) preparing pollution production and retention budgets. Ideally, these two approaches should be used in parallel.
Th e next step would be to develop a well thought-out strategy for agricultural pollution management, starting with the establishment of a consensus among the relevant parties on the current pollution situation, i.e. the diff erent pollution sources and environmental impacts. Unless such an understanding is reached, it will be dif-fi cult to develop a consensus on the required measures.
In establishing the aforementioned consensus, and particularly for the policy implementation of the measures, agriculture extension services have to be emphasized more assertively. Local agriculture repre-
sentatives and grassroots offi cers should take care of the primary contact with the individual farmers. Unless the need for action has support from the agricultural sector representatives, little progress will be seen.
Following this assessment, it is necessary to identify diff erent options for pollution reduction related to non-point source activities and calculate the cost-ef-fi ciency of each measure.
In the implementation of pollution management actions, win-win options, which will save money for farmers and reduce pollution, should be sought out. Examples include fertilizer planning and integrated pest control. Th e pricing mechanism—for instance, reducing subsidies on fertilizer and other production inputs—should be investigated with care because farmers need time to adjust to new economic framework conditions. Agricultural subsidies that do not support water protection should be decreased and gradually phased out. Experience has shown that legal measures are generally less effi cient than economic measures and information.
Management of agricultural pollution is a long-term policy objective and should be approached by develop-ing tools that have to be carefully tailored to each type of activity. Th e pollution management program should initially target the easiest and least controversial opportunities and gradually expand when a wider understanding and general acceptance of the measures has been developed.
Improving Water Quality Monitoring
Water quality monitoring incorporates a number of interrelated issues, such as sampling, analysis and

Policy and Institutional Considerations
41
inter-calibration, water information systems, evaluation of data by statistical and other methods. Incorporation of these elements depends on the objectives of the monitoring system, which often diff ers between diff erent users of data. Th ese objectives will determine sampling sites, sampling frequency, and duration of monitoring.
If design is inadequate, then signifi cant resources can be spent without obtaining information on the desired confi dence level.
One of the problems of the existing monitoring system in China is the lack of harmonization and quality control to secure that the data from diff erent sources can be compared (similar sampling techniques, analytic techniques, etc.). A functioning monitoring system would require constant updating and maintenance of the system for data storage, distribution, and presentation.
In recent years, the development of data management software has created an opportunity for large integrated water data management and decision support systems. However, experience has shown that in many countries the ambition for such systems has been too high. For example, when trying to satisfy too many purposes in the same system, the eventual outputs may not manage to do anything properly.
Water quality monitoring should be supervised by SEPA, while hydrological monitoring (quantity monitoring con-ducted for water management purposes) should be managed by MWR. However, uniform standards should be applied, and a coordinated organization for water monitoring should be established. By coordination of the existing monitoring organization, the quality of data and information can be improved and duplication can be avoided.
Box 3.4. Designing Water Quality Monitoring Systems
Awater quality monitoring system has to be designed for the specifi c pur-poses it is supposed to serve. The monitoring data can, for instance, be used for:
Determining baseline environmental conditions;
Making quality classifi cation and thematic of maps;
Detecting trends;
Determining annual or monthly averages of certain parameters;
Monitoring critical conditions (annual maximum or minimum values of certain water quality parameters);
Monitoring violation of standards;
Studying cause-eff ect relations between discharges and water quality impacts;
Provide input to water quality planning models;
Giving an early warning of accidental spills (primarily for micro-pollutants and oil products);
Studying watershed transmission and retention processes for nutrient load estimates;
EIA purposes (see also Box 3.2 for objectives related to the EU-WFD).
Not all of these objectives can be met with the same sampling methods or ana-lytic approach. The purposes will determine sampling sites, frequency, duration of monitoring, and the need for more specifi c and detailed recipient studies.
Design of the monitoring system should also consider the fastest and slowest changes in concentration and the behavior of the pollutants in the water body. Simple water sampling and analysis of a few chemical parameters will only give “snapshots” of the water quality situation. The present tendency in Europe is to monitor a limited number of sites at higher frequency. Increased sampling fre-quency enables the collection of information with a higher statistical reliability and makes it possible, for instance, to analyze trends. In some cases it might be more effi cient to monitor indicators (concentration in plant material, concentra-tion in sediments, survival of certain organisms etc) rather than to try to monitor the chemical parameter in the water itself. This is particularly true for toxic micro-pollutants that are found in very small concentrations in the water or where the discharge is a result of accidental release.
One important bottleneck in monitoring is quality control. A system of quality control has to include, (a) technical manuals describing in detail the procedures of water sampling, sample transport and storage, analytical methods, “meta-data” requirements etc, and (b) an inter-calibration procedure for laboratories involved in the monitoring activities.
"
"
"
"
"
"
"
"
"
"
"

China Water Quality Management
42
Before launching an integrated water data monitoring and management system, careful analysis of the needs and costs are needed. Th e system might be more eff ective and cost-effi cient without some of the many possible aspects outlined above. However, cost-cutting should not be allowed to undermine or compromise the eff ectiveness of the system, so that it cannot satisfy the real information needs of the potential users.
In light of the above, it is often found appropriate to distinguish between three separate water quality monitoring and data management systems:
Box 3.5. European Union—Water Framework Directive
Monitoring Program
The EU Water Framework Directive prescribes a system for water quality moni-toring consisting of three elements. These are:
Surveillance monitoring to provide information for:
Supplementing and validating the impact assessment procedure;
Effi cient and eff ective design of future monitoring programs;
Assessment of long-term changes in natural conditions;
Assessment of long-term changes resulting from widespread human activity.
The results of such monitoring are reviewed and used, in combination with the im-pact assessment procedure, to determine requirements for monitoring programs in the current and subsequent river basin management plans.
Operational monitoring in order to:
Establish the status of those bodies identifi ed as being at risk of failing to meet their environmental objectives;
Assess any changes in the status of such bodies resulting from the measures taken.
The program may be amended during the period of the river basin management plan in light of information obtained. Such amendments may include a reduction in sample frequency where an impact is found not to be signifi cant or the cause of pollution or stress is removed.
Investigative monitoring shall be carried out:
Where the reason for any pollution levels above the standards is unknown;
Where surveillance monitoring indicates that the objectives for a body of wa-ter are not likely to be achieved and operational monitoring has not already been established;
To ascertain the magnitude and impacts of accidental pollution.
The monitoring shall also inform the establishment of a program of measures for the achievement of the environmental objectives and specifi c measures necessary to remedy the eff ects of accidental pollution.
"
"
"
"
"
"
"
"
"
Internal control of water facilities operation and industrial process control. Th is will also provide data for reporting, if the principle of self-auditing is applied. Th e monitor-ing program has to be tailored and operated by the facilities themselves.Monitoring of facilities’ and enterprises’ compliance with pollution standards or discharge concessions by the relevant authorities. Parameter and sampling frequency will have to be decided for each individual case, and the analytic and sampling quality control will have to be strict, since the results might be used to apply fees and fi nes and could be challenged in court.Monitoring to establish the state of water resource quality. Th e objective here is to follow the trends in water quality and to present this informa-tion to the general public and decision makers. Th is type of monitoring should concentrate on a few general parameters that are held constant over longer time periods, so that diff erent water bodies can be compared on an equal basis, and so that time series can be produced.
Planning and Capacity
Building
Many advanced computer tools are marketed for water-related planning. Th e key to practical planning is not the presence or absence of such tools, but the overall understanding, level of participation in the planning
processes, and the commitment of the key parties to implement the plans. Nowadays, the focus is on an “open” planning procedure where the essence is the involvement of the public from the very beginning of the project in question. Experiences from CEE countries, for instance, show that this new approach for planners and the public alike requires a long-term eff ort to create a culture of public participation.
A critical mass of expertise is required in order to develop new legislation, harmonize laws, modify the
"
"
"

Policy and Institutional Considerations
43
institutional system, and prepare strategies/plans for implementation. Experts are needed to transfer knowl-edge from other countries to interpret “local” conditions to which innovative applications should be performed. Th us, exchange programs, training, and capacity building in a broad sense are inevitably important.
Environmental Awareness and Public
Participation
Th e support and pressure from the general public is an important factor in enforcing stricter water pollution management and improved environmental standards and the quality of products. Th e basic condition for such involvement is a certain level of knowledge about the situation and a general awareness of the need for changes and the risk faced when doing nothing.
Th e disclosure of information about pollution loads and environmental risks is an important element in
building this level of interest and awareness. Th is is particularly relevant for results of environmental monitoring. Th e data from such monitoring should be processed and made public in a form that makes it understandable to the general public.
In the processes of preparation and approval of EIAs, the concerned parties should have a clear role. Th e rights and duties of the public should be clearly spelled out in the EIA regulations and guidelines.
Th e public might also infl uence the productive sectors as consumers of goods and services. Again, information is needed for the public to make a qualifi ed choice. Based on the international envi-ronmental labeling standard and China’s technology level, a system of environmental labeling for food products should be established. Sector management authorities and sector experts should be involved in developing environmental labeling standards and classifi cation.


– 45 –
Annex 1
Trends in River Water Quality
Th e following fi gures have been generated by summarizing all available water quality information form the China National Monitoring Center for each of the rivers for the 1991–2005 period. (For the location of the monitoring stations in each of the river basins, refer to Figure 1.6 in Chapter 1).
In spite of massive investment in the past 15 years, water quality in China’s main rivers is showing few
signs of improvement. In fact, there are a number of cases where average water quality is declining. In four out of the seven rivers presented below, between one-third and one-half of the monitored water quality is in the worst two categories, i.e. no longer fi shable and of questionable agricultural value.
Figure A1. Average river water quality Liao River (1991–2005)
LiaoI – II
LiaoIII – IV
Liao V – V*
0
10
20
30
40
50
60
70
80
90
100
1991 1992 1993 1994 1995 1996 1997 1998 1999 2000 2001 2002 2003 2004 2005
Liao I – II Liao III – IV Liao V – V*

China Water Quality Management
46
Figure A2. Average river water quality Yellow River (1991–2005)
YellowI – II
YellowIII – IV
Yellow V – V*
0
10
20
30
40
50
60
70
80
90
100
1991 1992 1993 1994 1995 1996 1997 1998 1999 2000 2001 2002 2003 2004 2005
Yellow I – II Yellow III – IV Yellow V – V*
Figure A3. Average river water quality Song River (1991–2005)
Song I – II
SongIII – IV
Song V – V*
0
10
20
30
40
50
60
70
80
90
100
1991 1992 1993 1994 1995 1996 1997 1998 1999 2000 2001 2002 2003 2004 2005
Song I – II Song III – IV Song V – V*

Policy and Institutional Considerations
47
Figure A4. Average river water quality Huai River (1991–2005)
HuaiI – II
HuaiIII – IV
HuaiV – V*
0
10
20
30
40
50
60
70
80
90
100
1991 1992 1993 1994 1995 1996 1997 1998 1999 2000 2001 2002 2003 2004 2005
Huai I – II Huai III – IV Huai V – V*
Figure A5. Average river water quality Hai River (1991–2005)
1991 1992 1993 1994 1995 1996 1997 1998 1999 2000 2001 2002 2003 2004 2005
HaiI – II
HaiIII – IV
Hai V – V*
0
10
20
30
40
50
60
70
80
90
100
Hai I – II Hai III – IV Hai V – V*

China Water Quality Management
48
Figure A7. Average river water quality Pearl River (1991–2005)
Figure A6. Average river water quality Yangtze River (1991–2005)
Yangtze I – II
Yangtze III – IV
YangtzeV – V*
0
10
20
30
40
50
60
70
80
90
100
1991 1992 1993 1994 1995 1996 1997 1998 1999 2000 2001 2002 2003 2004 2005
Yangtze I – II Yangtze III – IV Yangtze V – V*
PearlI – II
PearlIII – IV
PearlV – V*
0
10
20
30
40
50
60
70
80
90
100
1991 1992 1993 1994 1995 1996 1997 1998 1999 2000 2001 2002 2003 2004 2005
Pearl I – II Pearl III – IV Pearl V – V*
– 49 –
The World Bank is closely engaged in China’s Water Resource Management sector, with many ongoing, recently completed, or pipeline projects that address
water pollution-related issues. Th e depth of this engagement testifi es to the seriousness with which the World Bank regards the issue in China. Th is work ranges from rural to urban environments and includes dedicated investment projects and analytical and capacity building initiatives. Relevant examples are given below.
China Water Resource Assistance Strategy
Th e China Water Resource Assistance Strategy (2002) was developed as a joint Bank-client venture to set out a framework for future World Bank assistance. Th e strategy highlights the key unresolved problems for WRM in China (water shortages, fl ooding, and pollu-tion) and stresses that the ineff ective and fragmented water management systems are a critical unresolved problem. Th e focus is, therefore, on improved water resources management and the need for coordinated and integrated approaches.
In order to capture all the dimensions of the water resource management challenges in China, the report breaks the subject down by key themes and issues. Th emes include environmental preservation and fi nancial and political support; key issues include institutional development (data, rights, pricing), water scarcity (transfer projects), and pollution
Annex 2
Relevant World Bank Projects
control (wastewater management, environmental fl ows). However, the strategy also notes the lack of a strategic relationship on water issues in China. Th e Chinese government has typically developed project ideas from the conceptual to implementation stage and only enlisted Bank support when fi nancing was required. Th e strategy sets out proposals for a closer relationship, where the client can take advantage of more upstream dialogue and AAA assistance from the Bank. For example, there should be increased emphasis on parallel World Bank analytical and capacity building in addition to the loans for physical infrastructure.
Hai River Basin Integrated Water Resources
Management Project (GEF)
Th e Hai River is one of the most polluted bodies of water in the country. It is a major source of pollution in the “stressed” Bohai Sea. So far, the government’s eff orts to manage pollution in this area have been focused on large municipal and industrial sources. However, despite considerable reductions in these sources of pollution, water quality has continued to decline. Reducing pollution from secondary cities as well as town and suburban industries is required in order to make an impact on overall water quality in the area.
Th e overall objective of this project is to catalyze an integrated approach to water resource management and pollution control in the Hai basin. Th e project

China Water Quality Management
50
activities are designed to meet this objective by promoting a more integrated approach to water resource management, providing technical and fi nancial assistance for wastewater management and canal clean-up in small cities, and funding pre-invest-ment studies for innovative projects. Th e project is developing top-down and bottom-up mechanisms for integrated water and environment management. In order for this management approach to be successful, great emphasis is being placed on coordination among relevant ministries/bureaus and the central and local levels of governance, such as SEPA, MWR, EPBs, and WABs. If successful, the benefi ts should include improved public health, healthier ecosystems, and various water- and agriculture-related economic benefi ts.
Huai River Pollution Control Project
Th e development objectives for this project focus on supporting the government’s work to improve the environmental quality of the Huai River and its tributaries through improved collection and treatment of wastewater. Th e project is providing facilities for collection and treatment of wastewater and establishing competent municipal wastewater utilities responsible for managing facilities. It is also bringing new and innovative approaches to WPM in China, such as the integration of septic tank management into the wastewater program. Th is includes investments in sewerage and associated infrastructure, wastewater treatment plants, and logistical facilities (such as laboratories and technical equipment) in the Anhui and Shandong provinces.
In order to ensure the sustainability of these undertakings, the project is taking advantage of the recently enacted Tariff Regulation 1192, which sets a framework for tariff policy geared toward sustaining wastewater operations. Th e creation of autonomous utility companies with proper management and direct use of their collected revenues should foster the development of wastewater companies as business undertakings that would apply modern management principles. Furthermore, comprehensive training combined with a focused technical assistance program would build up the competence and motivation for implementing, operating, and maintaining the wastewater treatment plants.
Lake Dianchi Freshwater Biodiversity
Restoration Project
Environmental improvement in Lake Dianchi and its watershed is a major national priority. Th e basin is a hotspot of freshwater biodiversity and endemism. Th e objective of the project is to restore and manage habitats around the lake in order to secure the conservation of the remaining endemic species of Lake Dianchi and its immediate tributaries. Th is water resource management project links with the World Bank’s Yunnan Environment Project (see below) by applying a biodiversity overlay to the ongoing infra-structure, policy, and regulatory measures. In order to achieve its objective, the project is establishing stable breeding habitats, providing biological survey data, monitoring lake quality, and raising public awareness of the region’s unique biological environment.
Expected project outcomes are categorized into four areas: (1) wetland management and restoration; (2) improved monitoring and species conservation; (3) capacity building and training; and (4) public awareness. Th e fi rst component seeks to restore natural habitats to some semblance of their natural state, with interventions integrated into broader local government plans that will build capacity and can be scaled up. Th e other components have been designed to provide the required data, capacity, and public support to ensure the sustainability of these environmental benefi ts.
Yunnan Environment Project
Th is recently closed project was part of a phased development program to improve environmental conditions and sustain urban services in Yunnan Province. Th e project’s principal objective was to provide a sustainable environmental framework for the long-term economic and social development of the province. It had specifi c objectives to (a) strengthen policies, regulations and institutional arrangements for pollution management; (b) improve lake water quality; (c) facilitate pollution management investments; and (d) introduce a comprehensive approach to urban environmental infrastructure investment planning. Components included establishment of physical works such as water supply, wastewater treatment plants, and solid waste landfi lls, and an improved institutional

Policy and Institutional Considerations
51
setting with an increased role for private enterprises in water supply and wastewater management.
Guangdong Pearl River Delta Urban Envi-
ronment Project
Th e fragile environment of the Pearl River Delta and South China Sea region has deteriorated as a result of the region’s rapid economic growth. Between 1990 and 2000, average regional GDP growth was 14.7 percent. However, this growth has led to regional immigration (Guangzhou had a migrant population of over 4 mil-lion in 2000) and increasing levels of waste generation (wastewater: 11.5 m m3/dy in 2000, 12.3 m m3/dy in 2010). Th e region lacks appropriate environmental management capacity and is experiencing severe deterioration in local water quality. Th is deterioration is attributed to factors such as poor regional planning, lack of treatment facilities for domestic and industrial wastewater and solid waste, inadequate water quality monitoring, and inappropriate pricing systems.
In order to address this decline and improve water quality in the Pearl River Delta and the South China Sea, this project will support Guangdong Province in addressing environmental service delivery and associated investment in an integrated manner. It will support an environmentally sustainable development process by improving the management of water resources and hazardous waste management through interventions in the following areas: (a) comprehensive and regional planning; (b) jointly managed environ-mental infrastructure; (c) wastewater management; (d) hazardous waste management; (e) improved water
quality monitoring and industrial pollution manage-ment. Th ese activities are being complemented by policy and institutional reforms, such as the promo-tion of regional planning approaches, adoption of demand management to conserve water, the formation of a fi nancially autonomous water company, and improved water quality monitoring and management regulations.
Related Watershed Management Projects
Th e World Bank has been involved in numerous projects designed to protect the watersheds of China’s river basins. Two good examples of this work are the long-term forest management program and the Tarim Basin projects. Over the last 20 years, the Chinese government and the World Bank have made tremendous eff orts in the forestry sector. One of the major results has been the reversal of the trends in deforestation, but another major objective in most of these projects is improved watershed management. Th e maintenance of an appropriate surrounding environment is essential for China’s river systems to supply and dispose of water in the required manner. For example, the current China Sustainable Forestry Project includes specifi c objectives for protecting watersheds in order to maintain river structure and reduce fl ooding. Th e Tarim Basin I and II projects supported rehabilitation and improved irrigation, drainage systems, and agricultural services in the Tarim Basin in northwestern China. Th e projects have improved water resource management in the basin, dramatically reduced sedimentation levels, and strengthened local water management bodies.


– 53 –
Asian Development Bank. 2000. Reform of Environ-mental and Land Legislation in the People’s Republic of China.
Beijing Municipal Statistical Bureau. 2005. Economic and Social Development of Beijing City 2004.
Cao Dong and Wang Jinnan. 1999. Economics for China’s Industry Pollution Control. Beijing: China Environmental Science Press.
Chinese Academy for Environmental Planning. 2004. Study on Integrated Environmental and Economic Modeling. Also published as Cao Dong et al. 2005. Economy and Environment: China 2020. Beijing: China Environmental Science Press.
Editorial Committee of China Environment Yearbook. 1997-2001. China Environment Yearbook 1997-2001. Beijing: China Environment Yearbook Press.
FAO. 1996. “Irrigation Scheduling: From Th eory to Practice.” Proceedings from International Com-mission on Irrigation and Drainage (1995). Rome: FAO.
Ministry of Construction, Department of Finance. 1990–2004. China Urban Construction Statistics Yearbook. Beijing: China Architecture & Building Press.
Ministry of Construction. 1998–2004. Statistical Reference Material for Town and Township Construc-tion. Beijing: Ministry of Construction.
Ministry of Water Resources. 1992. Water Resource Assessment for China. Beijing: China Water and Power Press.
National Bureau of Statistics China. 1990–1995. China Statistical Yearbook. Beijing: China Statistics Press.
References
Shen D. 2004. “Th e 2002 Water Law: its impacts on river basin management in China.” Water Policy 6: 345–364.
State Environmental Protection Administration. 1990–1995. China Environmental Statistical Yearbook. Beijing: China Environmental Yearbook Publishing House.
World Bank and Ministry of Water Resources. 1999. Water Pollution Management (Volume I). Wash-ington, DC: World Bank. (Background paper for World Bank. 2002. Agenda for Water Sector Strategy for North China. Washington, DC: World Bank.)
World Bank. 1997. Clear Water, Blue Skies; China’s Environment in the New Century. Washingon, DC: World Bank.
World Bank. 2001, China: Air, Land and Water-Environmental Priorities for a New Millennium. Washington DC: World Bank.
World Bank. 2002. Water Pollution in China, Institu-tion and Policy. Washington DC: World Bank,.
World Bank. 2005. North China Water Quality Study. Summary Report. Washington, DC: World Bank. Beijing: Ministry of Construction.
World Bank. 2006. Physical and Economic Burdens from Air and Water Pollution in China. Washing-ton, DC: World Bank.
World Health Organization. 2004. World Health Report 2004: Changing History (statistical annex table 7). Geneva: WHO.
Web Sites:
www.nsbd.mwr.gov.cn/nsbd/intro/www.people.com.cn/GB/14576/28320/31049/31054/22
66569.html


C H I N A
Environment and Social Development — East Asia and Pacific Region
D i s c u s s i o n P a p e r s
Water Quality Management—
Policy and Institutional
Considerations
September 2006
Environment and Social Development
East Asia and Pacific Region
THE WORLD BANK
1818 H Street, N.W.
Washington, D.C. 20433, USA
Telephone: 202 473 1000
Facsimile: 202 522 1666
Web Sites: worldbank.org/eapenvironment
worldbank.org/eapsocial


![ParticulateMatterfromBothHeavyFuelOil ... · premature death [1,2]. ChronicPMexposurecaninduce short-term (e.g., cardiovascular dis-eases orasthma)and long-term healtheffects,mostnotably](https://static.fdocuments.in/doc/165x107/5f7c68574f8fd1691a6196a4/particulatematterfrombothheavyfueloil-premature-death-12-chronicpmexposurecaninduce.jpg)
