
Earth_Science_&_Climate_Change_Somenath_Ganguly
6
Volume 6 • Issue 1 • 1000245 J Earth Sci Clim Change ISSN:2157-7617 JESCC, an open access journal Research Article Open Access Ganguly et al., J Earth Sci Clim Change 2015, 6:1 http://dx.doi.org/10.4172/2157-7617.1000245 Review Article Open Access Earth Science & Climatic Change *Corresponding author: Ganguly S, Petroleum Engineering Department, University of Technology & Management, Meghalaya, India, Tel: +91-9089688013; E-mail: [email protected] Received November 17, 2014; Accepted December 22, 2014; Published January 01, 2015 Citation: Ganguly S, Tiwari S, Bhan U, Mittal S, Rai S, et al. (2015) Melting of Sea Ice Inexplicable for Recent Global Eustatic Sea Level Rise. J Earth Sci Clim Change 6: 245. doi:10.4172/2157-7617.1000245 Copyright: © 2015 Ganguly S, et al. This is an open-access article distributed under the terms of the Creative Commons Attribution License, which permits unrestricted use, distribution, and reproduction in any medium, provided the original author and source are credited. Melting of Sea Ice Inexplicable for Recent Global Eustatic Sea Level Rise Ganguly S 1 *, Tiwari S 2 , Bhan U 3 , Mittal S 3 , Rai S 2 and Osta EF 4 1 Petroleum Engineering Department, University of Technology & Management, Meghalaya, India 2 Wadia, Institute of Himalayan Geology, Uttarakhand, India 3 Department of Petroleum Engineering & Earth Sciences, University of Petroleum & Energy Studies, Uttarakhand, India 4 Petroleum Engineering Department, University of Technology & Management, Meghalaya, India Keywords: Global warming; Greenhouse effect; Accommodation space; Eustacy; Sea ice Introduction Global warming is one of the very serious issues that earth is facing at present time. Global Mean Surface Temperature (GMST), ocean temperature and atmospheric temperature are increasing. Main cause of this environmental issue is identified as the emission of anthropogenic greenhouse gases, particularly carbon dioxide, due to fossil fuel burning. Other important greenhouse gases that are contributing towards this process are Methane, Nitrous oxide, Volatile Organic Compounds (VOC), particulate matter and ground level Ozone. For the purpose of discussion we need to remember that water vapor is also a greenhouse gas. However, total water vapor contribution to the atmosphere and its contribution towards global warming are dictated by the global hydrologic cycle and not by anthropogenic activity. Due to change in global surface and atmospheric temperature global climatic pattern is also changing, resulting in unusual heavy rainfall at some places and drought in the other places. Most alarming consequence of this increasing global temperature trend is melting of ice which includes both, sea ice as well as continental ice sheets and glaciers. Melting of ice is generally thought to be the outcome of global sea level rise but the effect of melting on global sea level rise is not uniform. is study is an attempt to summarize a conceptual model about how melting of continental ice sheets and glaciers along with convoluted effect of thermal expansion of ocean water due to increasing heat budget of global ocean differentially influence the process of global eustatic sea level rise. e Pleistocene Ice Age Earth has gone through several ice ages since last 1 billion years. Ice age can be defined as widespread continental glaciation over land in high latitudes. e most recent ice age took place during the Pleistocene Epoch and is called the Pleistocene Ice Age which began about 2.6 million years ago. Earth was not glaciated throughout the Pleistocene period. Cycle of freezing and thawing of continental glacier took place several times due to temperature fluctuation in Pleistocene age. Widely accepted hypothesis for climate fluctuation during Pleistocene Ice Age is due to periodic variations in the Earth’s orbit and spin axis. ere are certain three types of variations have been reported for Earth’s orbit and spin axis which are known as Milankovitch oscillations. ey are described here aſter; I. Elliptical orbit of Earth keeping Sun on its focus is known as eccentricity. Eccentricity is not constant through time. It varies in cyclic manner in about 100,000 years. II. Spinning axis of Earth is not vertical. It is tilted about 23.5 ° with respect to a line perpendicular to the plane of its orbit around the Sun. is tilt varies from 21.5 ° to 24.5 ° in around 41,000- year cycle. is is known as obliquity. III. Orientation of rotation axis of Earth is also not constant. It rotates around in a cyclic manner through time. is is known as precession. is process completes a full cycle of every 23,000 years [1]. ese changes have no effect on total solar radiation received by Earth from Sun, but it significantly affects the distribution of solar energy on the globe in terms of latitude and temporal variation of seasons. In the higher latitudes due to reduction of energy budget, summer will become cooler and shorter in duration resulting in widespread continental glaciation [2]. Keeping this in mind, Milankovitch calculated the temporal variation of climate in mid and higher latitudes in terms of warm and cold cycles. His calculation remarkably coincides with glacial cycles of Pleistocene Ice Age recorded in Geological history [3]. Corresponding Abstract Global warming and associated sea level rise due to melting of major ice reserves is one of the most important and debated issues of present time. It has unequivocally been proved that mean global surface and ocean temperature is increasing due to anthropogenic input of greenhouse gases like carbon dioxide which has reached its maximum concentration up to 399.35 ppm since last 650,000 years. Due to greenhouse effect global ice caps, sheets and sea ice are melting. But there is an ambiguity of rate of melting of ice and rate of global sea level rise. This can be best exemplified by melting rate of Arctic sea ice with nonequivalent response to the rate of global sea level rise. Conceptual model proposed in this paper differentiates the role of continental glacier, ice sheets and sea ice in the process of global or eustatic sea level rise. It shows that melting of sea ice is not responsible for global or eustatic sea level change. However convoluted effect of melting of continental glaciers and ice sheets and thermal expansion of ocean water due to increasing ocean heat budget is responsible for recent eustatic sea level rise.
-
Upload
somenath-ganguly -
Category
Documents
-
view
50 -
download
1
Transcript of Earth_Science_&_Climate_Change_Somenath_Ganguly

Volume 6 • Issue 1 • 1000245J Earth Sci Clim ChangeISSN:2157-7617 JESCC, an open access journal
Research Article Open Access
Ganguly et al., J Earth Sci Clim Change 2015, 6:1http://dx.doi.org/10.4172/2157-7617.1000245
Review Article Open Access
Earth Science & Climatic Change
*Corresponding author: Ganguly S, Petroleum Engineering Department, University of Technology & Management, Meghalaya, India, Tel: +91-9089688013; E-mail: [email protected]
Received November 17, 2014; Accepted December 22, 2014; Published January 01, 2015
Citation: Ganguly S, Tiwari S, Bhan U, Mittal S, Rai S, et al. (2015) Melting of Sea Ice Inexplicable for Recent Global Eustatic Sea Level Rise. J Earth Sci Clim Change 6: 245. doi:10.4172/2157-7617.1000245
Copyright: © 2015 Ganguly S, et al. This is an open-access article distributed under the terms of the Creative Commons Attribution License, which permits unrestricted use, distribution, and reproduction in any medium, provided the original author and source are credited.
Melting of Sea Ice Inexplicable for Recent Global Eustatic Sea Level RiseGanguly S1*, Tiwari S2, Bhan U3, Mittal S3, Rai S2 and Osta EF4
1Petroleum Engineering Department, University of Technology & Management, Meghalaya, India 2Wadia, Institute of Himalayan Geology, Uttarakhand, India 3Department of Petroleum Engineering & Earth Sciences, University of Petroleum & Energy Studies, Uttarakhand, India 4Petroleum Engineering Department, University of Technology & Management, Meghalaya, India
Keywords: Global warming; Greenhouse effect; Accommodation space; Eustacy; Sea ice
IntroductionGlobal warming is one of the very serious issues that earth is facing
at present time. Global Mean Surface Temperature (GMST), ocean temperature and atmospheric temperature are increasing. Main cause of this environmental issue is identified as the emission of anthropogenic greenhouse gases, particularly carbon dioxide, due to fossil fuel burning. Other important greenhouse gases that are contributing towards this process are Methane, Nitrous oxide, Volatile Organic Compounds (VOC), particulate matter and ground level Ozone. For the purpose of discussion we need to remember that water vapor is also a greenhouse gas. However, total water vapor contribution to the atmosphere and its contribution towards global warming are dictated by the global hydrologic cycle and not by anthropogenic activity. Due to change in global surface and atmospheric temperature global climatic pattern is also changing, resulting in unusual heavy rainfall at some places and drought in the other places. Most alarming consequence of this increasing global temperature trend is melting of ice which includes both, sea ice as well as continental ice sheets and glaciers. Melting of ice is generally thought to be the outcome of global sea level rise but the effect of melting on global sea level rise is not uniform. This study is an attempt to summarize a conceptual model about how melting of continental ice sheets and glaciers along with convoluted effect of thermal expansion of ocean water due to increasing heat budget of global ocean differentially influence the process of global eustatic sea level rise.
The Pleistocene Ice AgeEarth has gone through several ice ages since last 1 billion years.
Ice age can be defined as widespread continental glaciation over land in high latitudes. The most recent ice age took place during the Pleistocene Epoch and is called the Pleistocene Ice Age which began about 2.6 million years ago. Earth was not glaciated throughout the Pleistocene period. Cycle of freezing and thawing of continental glacier took place several times due to temperature fluctuation in Pleistocene age.
Widely accepted hypothesis for climate fluctuation during Pleistocene Ice Age is due to periodic variations in the Earth’s orbit and
spin axis. There are certain three types of variations have been reported for Earth’s orbit and spin axis which are known as Milankovitch oscillations. They are described here after;
I. Elliptical orbit of Earth keeping Sun on its focus is known as eccentricity. Eccentricity is not constant through time. It varies in cyclic manner in about 100,000 years.
II. Spinning axis of Earth is not vertical. It is tilted about 23.5° with respect to a line perpendicular to the plane of its orbit around the Sun. This tilt varies from 21.5° to 24.5° in around 41,000-year cycle. This is known as obliquity.
III. Orientation of rotation axis of Earth is also not constant. It rotates around in a cyclic manner through time. This is known as precession. This process completes a full cycle of every 23,000 years [1].
These changes have no effect on total solar radiation received by Earth from Sun, but it significantly affects the distribution of solar energy on the globe in terms of latitude and temporal variation of seasons. In the higher latitudes due to reduction of energy budget, summer will become cooler and shorter in duration resulting in widespread continental glaciation [2].
Keeping this in mind, Milankovitch calculated the temporal variation of climate in mid and higher latitudes in terms of warm and cold cycles. His calculation remarkably coincides with glacial cycles of Pleistocene Ice Age recorded in Geological history [3]. Corresponding
AbstractGlobal warming and associated sea level rise due to melting of major ice reserves is one of the most important and
debated issues of present time. It has unequivocally been proved that mean global surface and ocean temperature is increasing due to anthropogenic input of greenhouse gases like carbon dioxide which has reached its maximum concentration up to 399.35 ppm since last 650,000 years. Due to greenhouse effect global ice caps, sheets and sea ice are melting. But there is an ambiguity of rate of melting of ice and rate of global sea level rise. This can be best exemplified by melting rate of Arctic sea ice with nonequivalent response to the rate of global sea level rise. Conceptual model proposed in this paper differentiates the role of continental glacier, ice sheets and sea ice in the process of global or eustatic sea level rise. It shows that melting of sea ice is not responsible for global or eustatic sea level change. However convoluted effect of melting of continental glaciers and ice sheets and thermal expansion of ocean water due to increasing ocean heat budget is responsible for recent eustatic sea level rise.
Citation: Ganguly S, Tiwari S, Bhan U, Mittal S, Rai S, et al. (2015) Melting of Sea Ice Inexplicable for Recent Global Eustatic Sea Level Rise. J Earth Sci Clim Change 6: 245. doi:10.4172/2157-7617.1000245
Page 2 of 6
Volume 6 • Issue 1 • 1000245J Earth Sci Clim Change ISSN:2157-7617 JESCC, an open access journal
to periodic episode of glacial and interglacial period of Pleistocene age global sea level has changes accordingly. An interglacial period is marked by rise in global sea level whereas glacial periods are marked by fall in global sea level [4].
Global Distribution of Mid Oceanic Ridges in Mesozoic and Associated Global Sea Level Rise
Change in global sea level has also been marked in Mesozoic Era. Mesozoic Era is marked by global sea level rise resulting in marine transgression. The Mesozoic Era started around 230 million years ago and ended around 65 million years ago. Pangaea, the supercontinent of Paleozoic Era, started breaking during Mesozoic leading to the onset of proto-Atlantic and proto-Indian Ocean [5]. Sea floor age data indicate that in Jurassic Period (~200 million years ago) the rate of sea floor spreading increased rapidly ranging from 2 to 16 centimeter per year. The generation of Mid Oceanic Ridge reached its maxima in Cretaceous Period around 110 to 85 million years ago. Generation of new Mid Oceanic Ridge with relatively higher spreading rates in Cretaceous period made global sea level rise and resulted in flooding of low lying areas of the continents. This phenomenon is recorded in Geologic history by huge accumulation of sedimentary rocks on almost all the continents of Cretaceous age. Since no oceanic crust is older than 200 million years old, this global sea level rise due to rapid generation and spreading of Mid Oceanic Ridge cannot be tested for time period older than 200 million years [6].
Mid Oceanic Ridge is one of the tectonically active margins where new crust is formed. It is a submarine mountain chain spread globally having length exceeds 40,000 kilometers. Average elevation of ridge is 2.5 kilometers from abyssal plane. Mid Oceanic Ridge gets its highest elevation near spreading center where it is hot and buoyant. It extends to widths from 1000 to 3000 kilometers [7].
Another phenomenon which must happen with rapid spreading of Mid Oceanic Ridge at Mesozoic was thermal expansion of global sea water due to increased heat flux from Mid Oceanic Spreading Centre. It is not possible to quantify exactly how much thermal expansion of global sea water in Mesozoic was responsible for global sea level rise but it was one of the factors that influenced the phenomenon.
The Concept of Accommodation Space and Eustatic & Relative Sea Level
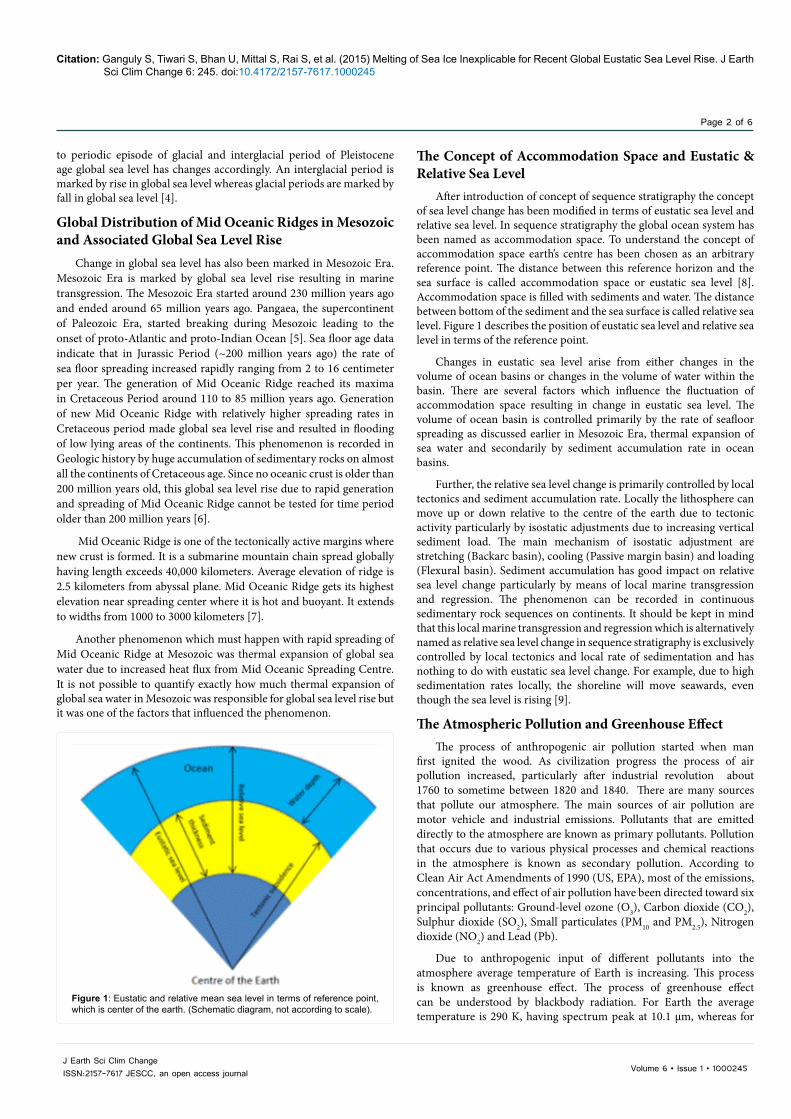
After introduction of concept of sequence stratigraphy the concept of sea level change has been modified in terms of eustatic sea level and relative sea level. In sequence stratigraphy the global ocean system has been named as accommodation space. To understand the concept of accommodation space earth’s centre has been chosen as an arbitrary reference point. The distance between this reference horizon and the sea surface is called accommodation space or eustatic sea level [8]. Accommodation space is filled with sediments and water. The distance between bottom of the sediment and the sea surface is called relative sea level. Figure 1 describes the position of eustatic sea level and relative sea level in terms of the reference point.
Changes in eustatic sea level arise from either changes in the volume of ocean basins or changes in the volume of water within the basin. There are several factors which influence the fluctuation of accommodation space resulting in change in eustatic sea level. The volume of ocean basin is controlled primarily by the rate of seafloor spreading as discussed earlier in Mesozoic Era, thermal expansion of sea water and secondarily by sediment accumulation rate in ocean basins.
Further, the relative sea level change is primarily controlled by local tectonics and sediment accumulation rate. Locally the lithosphere can move up or down relative to the centre of the earth due to tectonic activity particularly by isostatic adjustments due to increasing vertical sediment load. The main mechanism of isostatic adjustment are stretching (Backarc basin), cooling (Passive margin basin) and loading (Flexural basin). Sediment accumulation has good impact on relative sea level change particularly by means of local marine transgression and regression. The phenomenon can be recorded in continuous sedimentary rock sequences on continents. It should be kept in mind that this local marine transgression and regression which is alternatively named as relative sea level change in sequence stratigraphy is exclusively controlled by local tectonics and local rate of sedimentation and has nothing to do with eustatic sea level change. For example, due to high sedimentation rates locally, the shoreline will move seawards, even though the sea level is rising [9].
The Atmospheric Pollution and Greenhouse Effect The process of anthropogenic air pollution started when man
first ignited the wood. As civilization progress the process of air pollution increased, particularly after industrial revolution about 1760 to sometime between 1820 and 1840. There are many sources that pollute our atmosphere. The main sources of air pollution are motor vehicle and industrial emissions. Pollutants that are emitted directly to the atmosphere are known as primary pollutants. Pollution that occurs due to various physical processes and chemical reactions in the atmosphere is known as secondary pollution. According to Clean Air Act Amendments of 1990 (US, EPA), most of the emissions, concentrations, and effect of air pollution have been directed toward six principal pollutants: Ground-level ozone (O3), Carbon dioxide (CO2), Sulphur dioxide (SO2), Small particulates (PM10 and PM2.5), Nitrogen dioxide (NO2) and Lead (Pb).
Due to anthropogenic input of different pollutants into the atmosphere average temperature of Earth is increasing. This process is known as greenhouse effect. The process of greenhouse effect can be understood by blackbody radiation. For Earth the average temperature is 290 K, having spectrum peak at 10.1 µm, whereas for
Figure 1: Eustatic and relative mean sea level in terms of reference point, which is center of the earth. (Schematic diagram, not according to scale).

Citation: Ganguly S, Tiwari S, Bhan U, Mittal S, Rai S, et al. (2015) Melting of Sea Ice Inexplicable for Recent Global Eustatic Sea Level Rise. J Earth Sci Clim Change 6: 245. doi:10.4172/2157-7617.1000245
Page 3 of 6
Volume 6 • Issue 1 • 1000245J Earth Sci Clim Change ISSN:2157-7617 JESCC, an open access journal
Sun the temperature is 6000 K and spectrum peak is at 0.5 µm [10,11]. Considering the total solar radiant flux (which is 1,367 W/m2) all the incoming solar energy just outside the atmosphere has wavelengths less than 3 µm, but for the Earth all the outgoing radiant energy has wavelength greater than 3 µm. Infrared (IR) portion of spectrum starts about 0.7 µm and extends up to 100 µm. Therefore, for the Earth all the outgoing radiation is of thermal IR type. The radiant energy while passing through atmosphere interacts with atmospheric constituents in terms of scattering and absorption. Earth’s radiant energy absorbed by atmospheric gases of wavelengths longer than 4 µm is called greenhouse gases. The process of absorption heats the atmosphere and part of the heat radiates back to Earth and part to the space. This self-heating process which is responsible for increasing temperature of Earth is known as greenhouse effect [12].
Part of the incoming solar radiation is reflected back to the space due to back scattering of atmosphere and reflection from cloud not contributing any change in Earth’s total energy budget. Average incoming solar radiation that penetrates through the atmosphere to Earth is equal to 342 W/m2. Since the albedo is 31%, the amount of incoming radiation reflected back into space per square meter of the Earth’s surface is 107 W/m2. The solar radiation that is not reflected is absorbed by the Earth and its atmosphere. The amount of absorbed energy is 235 W/m2 of which 67 W/m2 is absorbed by atmosphere and remaining 168 W/m2 is absorbed by the surface of the Earth [12].
Among all the greenhouse gases water vapor is most important. Table 1 describes the absorption wavelength of different greenhouse gases [1].
Greenhouse Effect and Global WarmingDue to greenhouse effect average temperature of earth is increasing.
This increasing trend of temperature has been observed as increase of ocean and land temperature. Figure 2 illustrates increase of global land ocean temperature index from 1880 to recent by means of temperature
anomaly from surface air measurements at meteorological stations, ship and satellite Sea Surface Temperature (SST) measurements. This value has been calculated from mean global annual temperature anomaly referenced to the 14ºC which is estimated average of 1951-1980 [13]. Hansen et al. [14] observed an increase in Earth’s temperature by about 0.4°C between 1880s and 1970s.
Global temperature fluctuation due to variable concentration of greenhouse gases has been observed in the geologic past. Temperature fluctuation in geologic past has been estimated by means of stable isotope fluctuation, particularly of oxygen and hydrogen. Stable isotope fractionation of oxygen (δ18O‰) and hydrogen (δD‰) is temperature dependent [15]. Paleoclimate study based on δ18O in benthic carbonates calibrated in terms of Vostok ice core data from Antarctica for past 5 million years indicate cyclic temperature fluctuation in geologic past. Warmer temperature is determined by decrease in 18O in oceans and sediments and increase of 18O in glacial ice [16]. Temperature fluctuation recorded from Vostok ice core data in terms of δD‰ indicates cyclic fluctuation of temperature for last 420,000 years around 100,000 years cycle [17]. This 100,000 year cycle of global temperature fluctuation remarkably coincides with change in Earth’s eccentricity of 100,000 years cycle.
Air bubble data of Vostok ice core of Antarctica indicates strong correlation of atmospheric carbon dioxide and methane content with cyclic change of temperature through last 420,000 years of 100,000 year cycle. Glacial periods are marked by low concentration of greenhouse gases like carbon- dioxide and methane. Warmer interglacial periods are marked by high concentration of atmospheric methane and carbon dioxide. Surprisingly the current carbon- dioxide concentration which is 390 ppm (2007) is highest in past 650,000 years record [18,19]. The scenario becomes worst at 16th December, 2014 when Scripps global atmospheric carbon-dioxide measurement program reported carbon-dioxide concentration at Mauna Loa Observatory is 399.35 ppm.
Global Warming and Rising Sea LevelDue to greenhouse effect average temperature of Earth is increasing
resulting in melting of ice sheet, ice caps and sea ice. Another important factor is thermal expansion of global ocean water due to increase in ocean water temperature. Thermal expansion of ocean water has been attributed as one of the important factors of recent global sea level rise of 3.1 millimeter/year [20]. Most of the global non-oceanic fresh water has been reserved as ice caps and glaciers. Among them the most important are Antarctic ice sheet and Greenland ice sheet. It is being estimated that due to global warming these ice sheets will melt resulting in global sea level rise. International Panel of Climate Change [21], estimated the rise of sea level due to melting of ice caps and ice sheets which has been summarized in Table 2.
However, recent studies revealed that Antarctic ice sheet is projected to grow slightly in the future due to increased precipitation along with extremely cold climate. Therefore it is assumed that Antarctic ice sheet will not contribute towards global sea level rise [1]. For Greenland ice sheet, it has also been projected that it will increase
Greenhouse Gases Absorption spectraWater vapor Less than 8 µm and greater than 18 µm
Carbon dioxide 2.7 µm, 4.3 µm and 15 µmMethane 7.7 µm
Nitrous oxide 7.8 µm and 8.6 µmOzone 9.5 µm and 10.6 µm
Table 1: Absorption spectra associated with different greenhouse gases.
Figure 2: Global land ocean temperature index from 1880 to recent. This value has been calculated from mean global annual temperature anomaly referenced to the 14ºC which is estimated average of 1951-1980. (Data Hansen et al. 2006; From http://data.giss.nasa.gov/gistemp/).
Ice Reservoir Area (106 km2)
Volume(106 km3)
Sea Level Equivalent(m)
Antarctic ice sheet 12.1 29 73Greenland ice sheet 1.71 2.95 7.4
Glaciers and ice caps 0.64 0.1 ± 0.02 0.3 ± 0.05
Table 2: Projected global sea level rise due to melting of ice caps and ice sheets. (IPCC 1995).

Citation: Ganguly S, Tiwari S, Bhan U, Mittal S, Rai S, et al. (2015) Melting of Sea Ice Inexplicable for Recent Global Eustatic Sea Level Rise. J Earth Sci Clim Change 6: 245. doi:10.4172/2157-7617.1000245
Page 4 of 6
Volume 6 • Issue 1 • 1000245J Earth Sci Clim Change ISSN:2157-7617 JESCC, an open access journal
in volume slightly but there will be significant melting along the margin [1]. IPCC has created different projection models for different Special Report on Emissions Scenarios (SRES) in terms of Sea-level rise and carbon dioxide concentrations. But all the projection models involve several uncertainties to be encountered. Therefore none of them can be considered as accurate estimate.
Role of Melting of Continental Glacier and Sea Ice in Recent Global Sea Level Rise
From remote sensing data it has unequivocally been proved that global ice caps and sheets are melting. For example, Arctic sea ice is melting rapidly due to increasing global ocean temperature. Figure 3 illustrates the change in sea ice concentration of Arctic for September 2012 and March 2013 (A) and Antarctic for September 2012 and February 2013 (B). Continental glaciers are also melting. If we take into account a very simple analogy of melting ice will directly contribute to global sea level rise it is not happening in terms of rate of melting of ice and rate of rise of global sea level. From sequence stratigraphy point of view change in global sea level means change in eustatic sea level. For eustatic sea level change in accommodation space needs to be modified or volume of ocean water needs to be increased. As discussed earlier accommodation space can be modified either by tectonic activity like rapid growth of mid oceanic ridge and high spreading rate or very high rate of accumulation of sediments in ocean basin.
If we consider Holocene Period (10,000 years) global mid oceanic ridge system has been stabilized and continents got there recent position. Though tectonic activity is still going on in dynamic earth but not intense enough to change accommodation space like that happened in Mesozoic. Exogenic forces like erosion, deposition is going on in nearly constant intensity. Therefore we can consider sediment
accumulation rate in ocean basin has almost stabilized in terms of isostatic adjustment for vertical accommodation of pile of sediments. Above mentioned governing factors for alteration of accommodation space is almost stabilized and in equilibrium for Holocene Period.
Considering melting of sea ice; it has nothing to do with eustatic sea level change. The principal is very simple. Global Ocean is a single water body. Sea ice that is floating on global ocean is in equilibrium with modern day cost line by means of Archimedes principle. Therefore melting of sea ice will not contribute towards global or eustatic sea level rise. The phenomenon can be understood by means of very simple real life analogy. Considering a glass of water with floating ice cube, water in the glass is in equilibrium with ice cube floating on it in terms of Archimedes principle. Therefore complete melting of floating ice cube will not change the water level in the glass. Very same principal is applicable for global ocean and sea ice floating on it. Therefore complete melting of sea ice will not make any change in global ocean level.
But melting of continental ice sheets has different impact on global or eustatic sea level rise. Continental ice sheets contain approximately 32.05 ± 0.02×10⁶ km3 of ice by volume. The equivalent amount of water that are locked as continental ice sheets is kind of reserve volume of hydrologic cycle which is not part of global ocean water. Due to global warming if these ice sheets start melting then the water locked in them will release. Melt water will contribute towards regional ground water recharge and evapotranspiration. Some part will be locked as inland surface water body. Excess will be drained to ocean water. Excluding the melt water part that will contribute towards ground water recharge and locked as surface water rest of it will contribute towards global hydrologic cycle in terms of liquid water which will ultimately end up in global ocean. Therefore melting of continental ice sheets will contribute towards global or eustatic sea level rise by means of increasing volume of global ocean water. As discussed earlier Antarctic and Greenland continental ice sheets are projected to increase in future therefore recent 3.1 mm/year of global sea level rise can be assumed to be contribution of melting of alpine glaciers of equatorial or near equatorial region contributing 75%-85% of this trend [20].
Thermal Expansion of Ocean Water due to Increasing Sea Surface Temperature and Recent Global Eustatic Sea Level Change
It has unequivocally been proved that ice sheets, ice caps and sea ice are melting due to increasing temperature of earth. The process of increasing temperature of earth has been exclusively attributed to the greenhouse effect. As discussed earlier continental ice sheets and ice caps are responsible for global or eustatic sea level rise fulfilling other reservation criteria such as groundwater recharge, locked as surface water in land, evapotranspiration etc. Sea ice has no effect on global or eustatic sea level rise since it is already in equilibrium with modern day coast line configuration due to Archimedes principal.
Recent satellite gravimetric analysis has proved that global or eustatic sea level is rising. But there is an ambiguity of rate of change of sea level. For example Lemke et al., [22] reported rate of global sea level rise is approximately 1 mm/year due to melting of glacier and ice caps. Meier et al., [23] reported little high value of rise of global sea level for the time span of 2003-2008 which is approximately 1.3 mm/year. Recently from Gravity Recovery and Climate Experiment (GRACE) data it has been estimated that rate of global sea level rise is approximately 3.1 mm/year in which thermal expansion of global ocean water contributes approximately 15%-25% of this trend. It has also been reported that rate of change of sea level from 2003-2008 which is approximately 3.1 mm/
Figure 3: Change in sea ice concentration of Arctic, September 2012 and March 2013 (A) and Antarctic of September 2012 and February 2013 (B). (From http://earthobservatory.nasa.gov/).

Citation: Ganguly S, Tiwari S, Bhan U, Mittal S, Rai S, et al. (2015) Melting of Sea Ice Inexplicable for Recent Global Eustatic Sea Level Rise. J Earth Sci Clim Change 6: 245. doi:10.4172/2157-7617.1000245
Page 5 of 6
Volume 6 • Issue 1 • 1000245J Earth Sci Clim Change ISSN:2157-7617 JESCC, an open access journal
year has been reduced in comparison with rate of change of sea level from 1993-2003 which is approximately 3.5mm/year [20].
The phenomenon can be understood by visualizing the temperature anomaly of global ocean. Figure 4 illustrates temperature anomaly of global ocean from 2000-2014 for the month of February. The map has been constructed for global ocean temperature trend from NCDC/ER_v3 data source of Goddard Institute for Space Studies (GISS) of NASA [24]. Surface temperature data has been excluded and marked by gray color. The projection method followed was of Robinson [25] with 1200 km smoothing radius. Base period of mean global annual temperature has been referenced to the 14ºC estimated average of 1951-1980 [13].
Temperature distribution of global ocean is not homogeneous. There is latitudinal temperature variation due to differential incoming solar radiation along with vertical temperature zonation. For example ocean temperature can be as high as 30ºC in photic zone of equatorial region to freezing cold at polar zone. Also vertical zonation of temperature is there. Vertically ocean water can be divided into three zones namely; upper layer or photic zone, thermocline and deep ocean layer. In thermocline, temperature decreases with depth [26-28]. Therefore thermal expansion of ocean water due to increasing ocean water temperature is mainly restricted to the photic zone or upper layer of ocean water.
If we consider the temperature anomaly of global ocean as shown in Figure 4 it shows that temperature of ocean has increased significantly
in the equatorial zone in the time span of 2000-2014. Considering 14ºC of average of time period of 1951-1980 average temperature anomaly for the time period of 2000-2014 is approximately 0.32ºC as shown in Figure 5. Considering thermal expansion coefficient of water at 14ºC which is 1.3890×10-04 due to increasing temperature of the observation period of 2000-2014 volume of ocean water increased with increasing temperature initially. However it became equilibrated in terms of thermal stability and then the thermal expansion is not happening according to expectation [20].
ConclusionsIt is established fact that due to greenhouse effect, Mean Ocean
and land temperature are increasing. One of the most important greenhouse gases carbon dioxide reached its maximum concentration of 399.35 ppm in 2014. Earth has wormed about 0.4°C between the 1880s and 1970 which has caused melting of the ice caps and ice sheets. Global or eustatic sea level is rising and estimated as ~3.1 millimeter/year. Different models have been proposed to account this natural phenomenon and have their own uncertainty and ambiguity in estimating the global sea level rise projection (IPCC). The role of melting of continental glaciers, ice sheets and sea ice has not been clearly understood in terms of their role in global sea level rise. Sea ice, being limited to small thickness and areal coverage, may not be responsible for global or eustatic sea level rise. Melting of continental glaciers and ice sheets will contribute towards global sea level rise keeping all constrains in mind like regional groundwater recharge, locked as inland surface water and evapotranspiration. Recent global sea level change of approximately 3.1 mm/year is contributed towards convoluted effect of thermal expansion of ocean water due to increase in mean global ocean temperature (contributing approximately 15%-25% of the increasing trend) and melting of alpine glaciers of equatorial and near equatorial region (contributing approximately 75%-85% of the increasing trend). Rate of sea level rise for the time period of 1993-2003 which is 3.5 mm/year has been reduced to 3.1 mm/year for the time period of 2003-2008. Average temperature anomaly of global ocean for the time period of 2000-2014 is 0.32ºC with reference to 14ºC of average temperature of time period of 1951-1980. The phenomenon of reduction of rate of global sea level rise can be understood by initial thermal expansion of ocean water happened with increasing temperature trend. Afterwards thermal expansion has been stabilized in terms of temperature increment and thermal expansion of ocean water is not happening according to expectation.
Acknowledgement
We would like to thank Professor Avinash Singh, Pro Vice Chancellor, University of Technology and Management, Shillong, Meghalaya, India for his moral support throughout. We would also like to pay our gratitude to Dr Debmalya Bhattacharya, Assistant Dean of College of Technology, University of Technology & Management, Shillong, Meghalaya, India for his critical feedbacks for improvement of the manuscript.
References1. Masters GM, Ela WP (2008) Environmental Engineering and Science. (3rdedn)
Prentice Hall, India 704.
2. Kukla G, Gavin J (2004) Milankovitch climate reinforcements. Global Planet Change 40: 27-48.
3. Huybers P, Curry W (2006) Links between annual, Milankovitch and continuum temperature variability. Nature 442: 329-332.
4. Compton JS (2011) Pleistocene sea-level fluctuations and human evolution on the southern coastal plain of South Africa. Quatern Sci Rev 30: 506-527.
5. Kumar RK (1998) Fundamentals of Historical Geology and Stratigraphy of India. New age international publishers. India 254.
Figure 4: Temperature anomaly of global ocean water for the time period of 2000-2014. (Taken from Hansen et. al., 2010; Source http://data.giss.nasa.gov/gistemp/maps/).
Figure 5: Latitudinal zonal mean of ocean surface temperature anomaly of 2000-2014. (Hansen et. al., 2010; Source http://data.giss.nasa.gov/gistemp/maps/).

Citation: Ganguly S, Tiwari S, Bhan U, Mittal S, Rai S, et al. (2015) Melting of Sea Ice Inexplicable for Recent Global Eustatic Sea Level Rise. J Earth Sci Clim Change 6: 245. doi:10.4172/2157-7617.1000245
Page 6 of 6
Volume 6 • Issue 1 • 1000245J Earth Sci Clim Change ISSN:2157-7617 JESCC, an open access journal
6. Larson RL, Pitman WC (1972) Worldwide correlation of Mesozoic magnetic anomalies and its implications. Geol Soc Am Bull 83: 3645.
7. Moores EM, Twiss R (1995) Tectonics. W.H. Freeman and Company. New York 415.
8. Sloss LL (1988) Forty years of sequence stratigraphy. Geol Soc Am Bull 100: 1661-1665.
9. Catuneanu O (2006) “Principles of Sequence Stratigraphy”. Developments in sedimentology. Elsevier, Amsterdam 58: 386.
10. Barry RG, Chorley RJ (1982) Atmosphere, Weather and Climate. New York (NY) Methuen & Co. 460.
11. Miller A, Thompson JC, Peterson RE, Haragan DR (1983) Elements of Meteorology. Columbus, OH: C. E. Merrill Publishing Co. 448.
12. Piexoto JP, Oort AH (1992) Physics of Climate. New York, NY: American Institute of Physics 520.
13. Hansen J, Sato M, Ruedy R, Lo K, Lea DW, et al. (2006) Global temperature change. Proc Natl Acad Sci 103: 14288-14293.
14. Hansen J, Johnson D, Lacis A, Lebedeff S, Lee P, et al. (1981) Climate impact of increasing atmospheric carbon dioxide. Sci 213: 957-966.
15. McGuffie K, Henderson-Sellers A (2005) A Climate Modeling Primer. [3rd edn] John Wiley & Sons, West Sussex, England 253.
16. Lisiecki LE, Raymo ME (2005) A Pliocene-Pleistocene stack of fifty seven globally distributed benthic δ18O records. Paleoceanography 20.
17. Mudelsee M (2001) The phase relations among atmospheric CO2 content, temperature and global ice volume over the past 420 ka. Quatern Sci Rev 20: 583-589.
18. Siegenthaler U, Stocker TF, Monnin E, Luthi D, Schwander J, et al. (2005) Stable carbon cycle-climate relationship during the late Pleistocene. Sci 25 310: 1313-1317.
19. Spahni R, Chappellaz J, Stocker TK, Loulergue L, Hausammann G, et al. (2005) Atmospheric methane and nitrous oxide of the late Pleistocene from Antarctic ice cores. Sci 310: 1317-1321.
20. Cazenave A, Dominh K, Guinehut S, Berthier E, Llovel W, et al. (2009) Sea level budget over 2003-2008: A reevaluation from GRACE space gravimetry, satellite altimetry and Argo. Global Planet Change 65: 83-88.
21. Intergovernmental Panel on Climate Change (IPCC), Climate Change (1995): Radiative Forcing of Climate Change, Cambridge University Press, Cambridge, UK.
22. Lemke P, Ren J, Alley RB, Allison I, Carrasco J, et al. (2007) Observations: Changes in Snow, Ice and Frozen Ground. In: Climate Change (2007): The Physical Science Basis. Contribution of Working Group I to the Fourth Assessment Report of the Intergovernmental Panel on Climate Change. Solomon S, Qin D, Manning M, Chen Z, Marquis M, et al. (edn)] Cambridge University Press, Cambridge, United Kingdom and New York, NY, USA.
23. Meier MF, Dyurgerov MB, Risk UK, O’Neel S, Pfeffer WT, et al. (2007) Glaciers dominate eustatic sea level rise in the 21st century. Sci 317: 1064-1067.
24. Hansen J, Ruedy R, Sato M, Lo K (2010) Global surface temperature change. American Geophysical Union. Rev Geophys 48: 1-29.
25. Robinson AH (1974) A New Map Projection: Its Development and Characteristics. Int Yearbook Cartography 14: 145-155.
26. Nichols G (2009) Sedimentology and Stratigraphy. John Wiley & Sons, Ltd. 432.
27. Armstrong BK (1993) Implications of increased solar UVB for cancer incidents. The Role of the Stratosphere in Global Change. Chanin M (edn) Springer-Verlag, Berlin 423.
28. Dingman SL (2002) Physical Hydrology. (2ndedn) Prentice Hall. Upper Saddle River, NJ 646.
Citation: Ganguly S, Tiwari S, Bhan U, Mittal S, Rai S, et al. (2015) Melting of Sea Ice Inexplicable for Recent Global Eustatic Sea Level Rise. J Earth Sci Clim Change 6: 245. doi:10.4172/2157-7617.1000245
Submit your next manuscript and get advantages of OMICS Group submissionsUnique features:
• User friendly/feasible website-translation of your paper to 50 world’s leading languages• Audio Version of published paper• Digital articles to share and explore
Special features:
• 400 Open Access Journals• 30,000 editorial team• 21 days rapid review process• Quality and quick editorial, review and publication processing• Indexing at PubMed (partial), Scopus, EBSCO, Index Copernicus and Google Scholar etc• Sharing Option: Social Networking Enabled• Authors, Reviewers and Editors rewarded with online Scientific Credits• Better discount for your subsequent articles
Submit your manuscript at: www.omicsonline.org/submission


