Earthquake Catastrophe Models in Disaster Response ... · Earthquake Catastrophe Models in Disaster...
20
Earthquake Catastrophe Models in Disaster Response Planning, Risk Mitigation and Financing in Developing Countries in Asia Winspear, Musulin & Sharma 31 January 2012
-
Upload
truonglien -
Category
Documents
-
view
219 -
download
0
Transcript of Earthquake Catastrophe Models in Disaster Response ... · Earthquake Catastrophe Models in Disaster...

Earthquake Catastrophe Models in Disaster Response Planning, Risk Mitigation and Financing in Developing Countries in Asia
Winspear, Musulin & Sharma
31 January 2012

Executive Summary Earthquake catastrophe models combine simulated earthquake hazard intensity parameters, such as ground shaking intensity and liquefaction potential, with spatial data layers describing the geography and vulnerability of exposed assets at risk (property, populations and infrastructure) to calculate the probability of loss. There is significant scope for applying catastrophe models to disaster relief planning, risk mitigation and financing, especially for earthquake-prone developing economies in Asia. Potential uses of earthquake catastrophe models in these areas include:
(1) Estimating probable levels of damage across an area resulting from a range of possible earthquake events. These estimates are useful in assessing the scale of the response required when an earthquake event actually occurs and for devising a realistic plan for the disaster response effort.
(2) Quantifying the humanitarian and economic benefit of introducing or upgrading existing risk mitigation measures in advance of their introduction; and assessing the loss potential of possible sites for future infrastructure and/ or industrial facilities.
(3) Quantifying risk metrics fundamental to the pricing of financial risk transfer solutions that enable the transfer of the cost of relief and reconstruction away from the damaged national economy, thereby cushioning it from financial shock caused by major earthquake damage.
It is anticipated that this paper will stimulate the application of catastrophe models in all three of these areas.
Published in ‘SP361 Natural Hazards in the Asia-Pacific Region: Recent Advances and Emerging Concepts’ and reproduced with kind permission of The Geological Society of London. http://www.geolsoc.org.uk/page10523.html
1

Introduction Catastrophe models have been widely used in the insurance and reinsurance industries for nearly twenty years for calculating the amount of insured loss expected from natural catastrophes (such as earthquakes or typhoons) at an annual probability of exceedance (e.g. such as 1/250, see Figure 1). Prior to the advent of catastrophe models, the insurance industry’s usual approach was to estimate the maximum percentage of total insured value in an area that might suffer loss from a realistic earthquake event. This estimation was either based on experiential knowledge or in many cases where such knowledge was inadequate the estimation was based on the subjective judgment of industry experts, e.g. seismologists from leading reinsurers typically defined earthquake scenarios that were followed by the rest of the industry. Unfortunately however using this method there was no way to estimate the actual probability of each loss scenario. The introduction of fully probabilistic cat models in the late 1980s represented a major step forward by providing a scientific basis for assessing both the frequency and severity of earthquake catastrophe risk. Catastrophe models gained rapid acceptance in the insurance and reinsurance industries after Hurricane Andrew devastated parts of Miami in 1992, causing the largest insured loss experienced worldwide at that time (estimated at about USD 15.5 billion in 1992 prices, AIR Worldwide, 2005).
Figure 1. Loss Exceedance Probability Curve produced by an earthquake catastrophe model for a portfolio of property exposure in South-east Asia. This curve gives the annual probability of loss exceeding particular thresholds (e.g. a loss of 400 is expected to be exceeded at an annual probability of 1 in 250, also known as the ‘1 in 250 year return period’). The area under the curve, when annualised, gives the annual loss cost. Both the loss exceedance thresholds and the annual loss cost are essential to the pricing of catastrophe insurance.
1

Earthquake catastrophe models are created by combining four separate modules: exposure, hazard, vulnerability and financial. The exposure module is set up to capture the attributes of the exposed assets primarily in terms of location, sum insured, occupancy type (residential, commercial office, etc.), coverage type (buildings, contents), construction type (e.g. timber frame, brick, masonry, reinforced concrete frame, steel frame) and policy terms (size of deductible and limit). The earthquake hazard module typically comprises a probabilistic event catalogue containing tens of thousands of physically realisable earthquake scenarios, each of which is assigned an annual probability of occurrence or allocated to a specific simulation year (out of tens or hundreds of thousands). The vulnerability module contains a set of mathematical relationships describing the damageability of the exposed assets to earthquake ground shaking of varying severities, and is usually sensitive at a minimum to differences in occupancy and construction type. The financial module calculates the monetary value of the physical damage and insured loss expected from each stochastic earthquake event to the portfolio as a whole and calculates the probability of exceedance of a range of loss thresholds (Figure 1) from different financial perspectives (the insured, the insurer, the reinsurer, etc.).
One of the main advantages of probabilistic catastrophe models is that they simulate loss from earthquake events with recurrence intervals that are much too long to be present in the historical record. As such they consider the loss potential from a much wider range of possible earthquake events than would be the case if only the historical record were available. However, models are imperfect representations of reality, being limited by (a) typically sparse sampling in the instrumental and historical record of large magnitude earthquakes which usually occur on a much longer timescale (making it difficult to accurately constrain the activity rate and maximum credible earthquake magnitude on a particular fault); (b) where faults are either thought to be inactive or are not previously known (either due to lack of geological mapping or because the faults involved are blind, i.e. without surface expression, as caused the January 1994 Northridge earthquake in California and the September 2010 and February 2011 Christchurch earthquakes in New Zealand); (c) where the location of seismic activity is time dependent (i.e. where the main geographic loci of earthquake productivity and earthquake event parameters develop in a non-random manner over time); (d) where there are no locally applicable seismic attenuation relationships available (as is the case throughout much of Asia); (e) where local site soil conditions are poorly represented (these can have a very strong influence on landslide, liquefaction and seismic amplification potential); and (f) where exposed assets (i.e. property, infrastructure or populations) are difficult to define in terms of location, value and vulnerability to earthquake damage.
The objective of this paper is to outline the potential application of earthquake catastrophe models to (1) disaster response planning; (2) mitigation of loss; and (3) disaster risk financing, as a means for cushioning the national economy from the adverse financial consequences of a seriously damaging earthquake. It is anticipated that this paper will stimulate the application of catastrophe models in all three of these areas.
1

Earthquake Cat Models in Disaster Response Planning Catastrophe models can produce outputs that are useful for planning of disaster response and mitigation. This is achieved by combining earthquake intensity parameters (such as maps of ground shaking intensity) with data layers describing the location, value and vulnerability of the exposed assets at risk (i.e. property, populations and infrastructure) to produce estimates of physical damage. This can be undertaken (a) for an actual earthquake event to indicate what emergency response teams can expect; (b) for a number of postulated scenario earthquakes used for emergency service training purposes; or (c) for thousands of postulated scenario earthquakes from the probabilistic event set, in order to estimate probabilities of damaging effects on the asset portfolio (e.g. annual probability of casualties exceeding a threshold value).
Systems for real-time earthquake loss estimation and response are already in existence in a small number of developed countries, principally the USA (e.g. Eguchi et al. 1994; FEMA, 2010), Japan (e.g. Nakamura, 1996; Yamazaki et al., 1998; Hosokawa et al., 2008) and Taiwan (e.g. Yeh et al., 2006) and a small number of other territories including Central America (e.g. CAPRA, 2008) and Colombia (Yamin et al. 2004). The authors are not aware of any such systems that have been created to date specifically for developing countries in Asia, noting that certain territories such as Indonesia and the Philippines are particularly at risk of damaging earthquake and hence in need of such systems. Whilst both of these territories are already covered by earthquake loss estimation systems with worldwide scope (e.g. WAPMERR and USGS PAGER systems; see WAPMERR, 2010 and USGS, 2010b), there is significant potential for locally developed, locally focused systems to be created that will (a) provide considerably greater spatial resolution of the modelled earthquake hazard; (b) utilise locally applicable data for earthquake hazard modelling (e.g. attenuation relationships and high resolution soil mapping); (c) employ local experience in developing asset vulnerability relationships; (d) generate additional bespoke, customisable model outputs of use in disaster planning; and (e) allow direct integration of these outputs with decision support systems used to train and guide emergency response units. These models will also differ from existing catastrophe models available for these territories from established commercial model vendor companies because they will (a) reflect the vulnerability of the entire building stock (rather than just the insured building stock; the two can be quite different in developing economies), populations and infrastructure; and (b) produce outputs that are of use in disaster response planning (such as those outlined below).
To ensure consistently high quality of the underlying earthquake hazard model, it is recommended that any such model spanning multiple territories utilises a globally standardised earthquake hazard model which has benefited from significant local input during development, such as the Global Earthquake Model (GEM, 2010) or the USGS SHAKEMAP model (USGS, 2010a) (Figure 2). Equally important is a finely resolved definition of the exposed assets at risk, ideally with these data defined at a horizontal resolution of one kilometre or less to allow relatively fine scale variation in ground shaking intensity to be represented.
2

Commercial earthquake catastrophe models currently in use for most Asian territories currently simulate only ground shaking damage and do not explicitly consider major secondary perils, particularly fire following the earthquake and tsunami inundation. At present the only exception to this is in Japan where commercial catastrophe models have the capability to estimate losses arising from fire following the earthquake (but not tsunami). Both of these are important secondary perils that need to be considered in a full catastrophe risk assessment, noting that in some instances such as the M9.0 11 March 2011 Tohoku earthquake the tsunami impact was much larger impact than that of ground shaking.
Figure 2. USGS SHAKEMAP (©USGS, 2011) for the M9.0 Tohoku earthquake epicentred offshore from northeastern Japan on 11 March 2011. The box shows the approximate area of rupture of the subduction zone that began with this earthquake. As an indication of the likelihood of damage, MMI VI intensity shaking is expected to cause damage to poorly constructed masonry buildings.
Fire following the earthquake is a possibility whenever and wherever a major earthquake strikes (a) where there are available ignition sources, such as lit cooking fires (in Asia today these are often fed by bottled kerosene) or where LPG tanks are damaged and their contents ignite in (b) areas dominated by high density wooden housing with few fire barriers (such as in older parts of some major Asian cities and in many informal housing areas) where (c) the fire fighting service is either overwhelmed by the sheer scale of the disaster or
3

is unable to reach areas affected by fire because of the damage sustained. Major fire does not accompany every major earthquake, however. The few large fires that do occur tend to affect high value industrial facilities storing flammable petrochemicals (e.g. Izmit, Turkey in 1999 and Hokkaido, Japan in 2003). Fortunately, no widespread earthquake-triggered conflagration scenario affecting tens of thousands of residential properties has occurred anywhere in the world since the 1923 Great Kanto earthquake and conflagration devastated the Tokyo-Yokohama area of Japan, killing more than 100,000 people. Smaller scale fires have however occurred more recently as a result of earthquakes, including fires that consumed thousands of homes in an 82 ha area of Kobe, Japan after the 17 January 1995 Great Hanshin earthquake (RMS, 2005); the 30 to 50 significant fires following the 17 January 1994 Northridge earthquake in California (Evans et al., 1997); and the 12 fires in Kaohsiung City and Pingtung County, southern Taiwan, in the aftermath of two major earthquakes on 26 December 2006 (Wen et al., 2008). When modelling the effect of fire following the earthquake, catastrophe models must probabilistically simulate multiple different outcomes for each ground shaking event, taking into account the number of initial locations in which fire starts and the subsequent development of each fire either as it burns out or as it merges with other fires to form a larger fire. This is clearly a very complex modelling problem requiring detailed understanding not only of the local built environment but also of the dynamics of fires in these environments; and is tackled at only a cursory level by the few commercial earthquake catastrophe models available that consider this secondary peril.
Tsunami is also a known peril in Japan and the Indonesian and Philippine archipelagos. Earthquake-triggered tsunamis most recently affected Japan in 2011, Indonesia in 2004, 2006 and 2010; and in the Philippines local earthquake-triggered tsunamis were generated in 1976 and 1994. However other territories bordering the South China Sea are also at risk from tsunami caused by failure of the subduction zone located offshore from Manila (Megawati et al., 2009; Lau et al. 2010). Sieh (2009) predicted that another extremely large (M8.8) subduction-related earthquake is likely to occur in the next few decades on the subduction zone west of Sumatra, Indonesia, which could result in a tsunami that devastates the south-central part of western Sumatra. In both of these cases it is possible that damage from tsunami may outweigh that from ground shaking, particularly where the area affected by tsunami is a long distance from the earthquake epicentre. For this reason, any earthquake catastrophe model developed for disaster response planning for these territories needs to be capable of simulating damage from either or both of ground shaking and tsunami inundation. It is worth noting that no commercial catastrophe model developed for the insurance industry currently available takes tsunami into account in its damage calculations for any Asian territory.
A number of catastrophe model outputs useful for disaster planning are listed below. It is envisaged that these would be implemented as spatial data layers in a Geographic Information System (GIS), to enable:
(a) Visualisation of the spatial data by disaster relief coordinators at control locations and by emergency response units in the field.
4

(b) GIS analysis and ad hoc querying of spatial relationships in the modelled output data (e.g. in order to identify population centres that can be accessed by road with modelled ground shaking intensity of MMI VI or more with at least 500 predicted casualties).
(c) Integration with other related resources, such as satellite and aerial photographic imagery and third party data products providing an alternative independent view on the risk, such as WAPMERR, USGS SHAKEMAP and PAGER estimates of ground shaking intensity, number of fatalities and populations affected by severe ground shaking.
(d) Assessment of uncertainty surrounding modelled parameters by comparing with actual measured parameter values, such as ground motion observations from seismic accelerometers, changes in land surface elevation, tilt and shift in horizontal location recorded by ground-based GPS stations and airborne/ satellite-based SAR Radar and LIDAR surveys. Once differences have been quantified it is then possible to adjust the modelled values to take account of measured parameter values via a statistical routine such as kriging. Maps of modelled, measured and adjusted values and the differences between them can then be displayed and queried in the GIS.
The GIS and its accompanying data would form part of a decision support system designed to guide the disaster response services in making more effective use of resources available by providing forewarning of what to expect in the aftermath of a major earthquake. Useful data layers, including outputs from catastrophe models, which should be implemented in the GIS as spatial data layers include:
1) Hazard maps: Base maps describing the modelled magnitude of the earthquake or earthquake-induced hazard, including (a) ground shaking intensity (e.g. peak ground acceleration or displacement, MMI intensity); (b) average or peak tsunami inundation velocity and depth; and (c) estimates of ground deformation (i.e. areas likely to have undergone uplift or subsidence, liquefaction, lateral spreading of gently sloping ground, settlement or landslide). These maps can potentially be generated in real time following an actual earthquake scenario, or in advance to represent one or more events carefully chosen from the event set of a probabilistic catastrophe model, as would be useful for emergency service training. As noted above, for an actual event it is important to also overlay measured values onto the modelled hazard base maps, where available, to provide a means by which the accuracy of the modelled estimates can be assessed and if necessary improved. A catalogue of previous earthquake events would also be very useful.
2) Assets: Maps and lists of the exposed known assets at risk. These include population and housing density by administrative zone; digitised outlines of buildings and/ or registered land allotments; and location of utility lifelines (e.g. water mains, piped gas, electrical systems and telephone trunk lines). Asset schedules should also be updated at periodic intervals to reflect population growth and changes in the built environment. Note that there may be a mismatch between the coarser spatial resolution of asset inventory data (which may be available by administrative zone) and the underlying hazard mapping; in such cases possible resolutions include disaggregating the asset data to
5
match the finer hazard resolution or aggregating the hazard data to match the resolution of the assets.
3) Estimates of property damage: Maps and lists of modelled likelihood and severity of damage to property (e.g. residential, commercial and industrial property), infrastructure (e.g. schools, health clinics, roads, bridges, tunnels, water and sewerage infrastructure, pumping stations, etc) and utility lifelines. These outputs may be generated either for scenario earthquakes or using the entire probabilistic event set, allowing estimation of the probability that damage will exceed a threshold value(s) over a year or several consecutive decades chosen at random. Maps of field observations concerning damage to infrastructure (such as ruptured gas or water mains, fallen lengths of high tension power lines or damage to telephone and electrical substations) should also be overlain onto these modelled damage maps to provide a means by which the accuracy of the modelled estimates can be assessed and if necessary improved.
4) Estimates of casualties: Maps and lists of estimated populations and population centres exposed to hazard of varying levels of intensity, together with estimates of resulting casualties and fatalities. For example, the USGS’s PAGER product (USGS, 2010b) provides estimates of populations and settlements affected by ground shaking of various intensities together with estimated number of fatalities from previous earthquakes in the area. These products do not consider temporal variation in the human populations of affected areas, which can sometimes be significant, and there is therefore scope for improving such estimates by considering temporal variation not only in the gross population of an area but also how it splits into populations housed within buildings and those located without. Again, these outputs could be generated either for scenario earthquakes or using the entire probabilistic event set, as noted in 3) above.
5) Key location estimates: Values for the parameters listed in (1) to (4) above for key predefined static locations (such as major towns or cities) and for locations dynamically chosen defined by the user.
6) Locations identified as being safer (for pre-evacuation assembly) and land-based evacuation routes to be used by disaster response teams in the aftermath of a damaging earthquake.
7) Data enabling logistical support for the ensuing disaster relief effort, e.g. identifying areas likely to require some or all of:
a. Immediate emergency food and medical assistance (via land, sea, air including air drop).
b. Estimates of displaced households and associated shelter requirements.
c. Dispatch of military troops to re-establish law and order and assist in search for survivors.
d. Dispatch of rescue assistance and fire-fighting teams.
6

e. Land-based routing to overcome impassable bridges, tunnels or roads.
8) Backdrop maps including topography; vegetation cover; land use; hydrology; soil type; precipitation isohyets; satellite and/ or aerial photographic imagery.
These outputs would be very useful both for (a) disaster response planning (both in the immediate aftermath of an event and for training the emergency response services prior to an event) and (b) guiding longer term efforts to mitigate the effects of damaging earthquakes (e.g. when evaluating and prioritising options for future extension of utility lifeline systems to minimise exposure to potential liquefaction). In the event of a damaging earthquake, it is envisaged that a catastrophe model would be employed to estimate the damage resulting from an event with the parameters specified (e.g. magnitude, location, depth, focal plane solution), producing outputs consistent with the data resources listed above. These could be used to create a damage assessment report which in turn would be used to assess the scale of the disaster response required and as the basis for manually creating an initial plan for the actual response effort. In this way the emergency response coordinator would have access to a working response plan up to several days in advance of disaster relief teams reaching a remote affected area. It took several days for example before ground-based response teams could reach the Indonesian Mentawai islands affected by the recent 25 October 2010 Mw7.7 earthquake and tsunami because of seasonally rough seas.
It is important to note that differences are always expected between the modelled and actual damage situation on the ground because of uncertainty in the form of: (a) incomplete representation in the catastrophe model of a more complex and detailed reality, since the real world is far more complicated in detail than is possible to represent in models; (b) ground shaking intensity at the location of each exposed asset (reflecting uncertainty in the detailed characterisation of the earthquake hazard); (c) the damage response of each individual asset to this ground shaking (reflecting the ability of the model to accurately simulate damage to the asset); (d) estimation of damage caused by secondary perils such as fire following the earthquake, tsunami and flood caused by failure of natural or man-made river dams); and (e) lack of detailed accurate descriptions of the exposed assets at risk (e.g. the location of an asset may be specified by street address or postal code rather than by actual coordinate location; its replacement value may only be estimated; and its construction may be incompletely or incorrectly listed). These sources of uncertainty cause deviation of modelled hazard and damage from actual values experienced. As a way of improving confidence in the model predictions it is essential to quantify differences between original modelled and actual parameters (making them available for display and query within the GIS system). Actual measured values can also be used to improve the accuracy of the modelled predictions by adjusting the modelled values, as already noted.
Training exercises based on a handful of realistic earthquake scenarios are also essential for preparing the emergency response services and testing existing disaster response plans. Due to the physical effort involved in each training exercise, including coordinating numerous different disaster response agencies, it is essential to limit these to a handful of realistic earthquake disaster scenarios representing a small number of both relatively extreme hypothetical scenarios and/ or actual historical events. Hypothetical scenarios would be defined as (a) specific individual events, defined by expert judgment and/ or by identifying the maximum credible event likely to
7

affect an area using a probabilistic earthquake hazard model; and/ or (b) in terms of maximum ground shaking intensity expected to be exceeded with a fixed probability in a given period (e.g. 10% chance of exceedance in 50 years).
Earthquake Cat Models in Disaster Risk Mitigation One way for a country damaged by earthquake to enhance its ability to recover from major earthquake damage is to purchase catastrophe insurance to provide guaranteed financing for relief and reconstruction; another alternative is to make far-sighted investments in disaster risk mitigation that will progressively lessen the effect of damaging earthquake when it occurs, thereby reducing the loss (both humanitarian and economic) experienced by the economy and eventually the amount of catastrophe insurance required (because economic loss expectations will become lower with time). Examples of earthquake disaster mitigation measures potentially include (1) upgrading the existing minimum seismic design code for engineered buildings; (2) making engineered design of buildings compulsory (together with adequate enforcement) throughout the economy as a whole (noting that this is not currently the case with the majority of single family housing in Asia); (3) retrofitting major buildings with lateral structural bracing and lifeline infrastructure systems (water, gas, electricity) with automated tremor-induced shutoffs (this step may exceed minimum design code specifications); (4) choosing routes for new lifelines and infrastructure that are less likely to experience severe ground shaking, ground deformation or tsunami inundation (e.g. routing of lifelines away from areas which may liquefy during shaking or amplify the ground motions, such as reclaimed land or soft alluvial soils); (5) identifying zones in which to build that are likely to be safe from tsunami inundation (and conversely, zones that are not safe to build in and in which future major developments that would give rise to serious consequences should they fail, such as nuclear power plants, should be reconsidered); and (6) enforcing the use of steel framed construction (rather than timber frame, which is easily demolished by tsunami) in areas at risk of tsunami inundation. Bespoke catastrophe models can be used to estimate the benefit gained from such improvements in advance of their implementation, as outlined below.
Investments in loss mitigation ultimately enhance the ability of the economy to recover from unexpected major earthquake damage. Of these it is the extent to which suitable engineered design is required and enforced in the economy as a whole that is perhaps the single most important from an overall economic perspective since this directly affects not only the level of property damage incurred but also humanitarian and consequential (loss of family members, medical expenses for casualties, loss of livelihood, loss of breadwinner, etc.) losses. This is of significance to the economy as a whole because major earthquakes can kill and injure tens or hundreds of thousands of people and can damage hundreds of thousands of properties. This level of damage cannot be easily absorbed into the normal building capacity of an economy because the diversion of material and labour to post-event reconstruction from other activities would cause severe stress and disruption (Musulin et al., 2009). Note that the provisions made when designing a seismic code governing lateral building strength depend upon accurate assessment of the ground shaking intensity likely to be encountered. This is often expressed as the shaking intensity likely to be exceeded only once in a fixed period of time (such as a 10% chance of exceedance in a 50 year period which corresponds to a return period of 475 years) at a specific location. Earthquake catastrophe models can be
8

used for this purpose because by default they already perform similar calculations, i.e. they calculate the probability of exceedance of loss to a combined portfolio of locations. All that is needed is an adjustment to allow them to calculate the probability of exceedance of ground shaking intensity at each location in turn. Since private commercial catastrophe models do not currently allow adjustment in this way, it is anticipated that public open-source models will be developed that are not so constrained in the adjustments that can be made. Catastrophe models will also be developed specifically for the purpose of disaster relief planning and risk mitigation in Asia in the future.
Catastrophe models also have a key role to play in quantifying the financial benefit of introducing disaster risk mitigation measures. For example, Kunreuther & Michel-Kerjan (2009) used a catastrophe model to determine the economic benefit of mandating the use of residential loss mitigation measures for insured household property in several hurricane-exposed US States. The analysis suggested that this could reduce damage by up to 61% in Florida at a return period of 100 years, equivalent to about USD 51 billion in losses. Earthquake catastrophe models can and should be used in a similar way to evaluate the financial benefit of proposed disaster risk mitigation measures (examples of which are listed above) in advance of their introduction; and also for assessing (in order to minimise) the loss potential of possible sites for future infrastructure and/ or industrial facilities. Perhaps the most significant advance developing economies in Asia can make is to take measures to strengthen existing non-engineered buildings to prevent (or at least significantly delay) their collapse in order to purchase time to allow their inhabitants to escape. Since there are literally millions of non-engineered buildings requiring reinforcement in Asia, a multi-stage process is suggested below which when coupled with active enforcement of the seismic building design code would assist greatly in reducing the vulnerability of the building stock in coming decades:
(1) Focus initially on retrofitting public buildings such as Government buildings, public hospitals and large schools to help to ensure that core public services remain operational in the aftermath of a major earthquake (noting that Government effectively ceased to function in the immediate aftermath of the 2010 Haiti earthquake in part because of widespread collapse of Government buildings). Large school buildings are included here because of the number of casualties that could potentially result should they collapse.
(2) Dramatically increase enforcement of compliance to the seismic design code for new building construction. Obviously there are corruption issues to first overcome in certain developing countries in Asia that prevent this from happening; however enforcing this step would mean that the problem of lack of earthquake resistance of buildings would gradually diminish as the building stock is gradually renewed on a timescale spanning multiple decades.
(3) Identify areas known to be dominated by non-engineered buildings that are unlikely to comply with existing seismic design regulations and focus on developing low cost simple solutions for reinforcing these buildings to allow their occupants to escape. Since this describes the majority of buildings in most developing Asian countries, some form of prioritisation will be necessary, such as focussing initially on the most vulnerable
9
buildings, e.g. adobe and poorly constructed masonry buildings located in areas with soft soils that may enhance ground shaking intensity or liquefy.
Earthquake catastrophe models can be used to estimate in advance the considerable long term financial benefit to the economy of such improvements.
Earthquake Cat Models in Disaster Risk Financing The financial consequences of a damaging earthquake can be mitigated in multiple ways, both before the event (ex ante) and after the event (ex post) (Table 1). A consistent shortcoming in the disaster risk management strategies of developing economies in Asia is their reliance on ex post disaster financing solutions, preferring for various reasons (such lack of affordability of alternative ex ante solutions) to rely on their own often limited financial resources to cover as best they can the majority of disaster losses (e.g. by emergency reallocation of budget), and on international assistance for major disasters. This contrasts with developed countries, where ex ante disaster financing solutions are instead the norm (ADB, 2008).
Ex ante disaster risk financing solutions are generally preferable because the guarantee of payment of a pre-agreed amount (which in some instances can be rapid) reduces dependence on ad hoc sources of post-disaster funding. Catastrophe insurance is often a key component of ex ante disaster risk financing solutions, providing the buyer with the significant advantage of leverage in which a smaller insurance premium can result in a much larger payout. Catastrophe models enable quantification of risk metrics that are fundamental to the pricing of catastrophe insurance and reinsurance and other forms of alternative risk transfer which seek to transfer financial risk to non-traditional risk carriers such as the capital markets (e.g. via catastrophe bonds). Risk metrics include estimates of the limit of catastrophe insurance coverage needed, the technical price (i.e. the annual loss cost) of the insurance and the probabilities of the insurance cover being activated and exhausted at which point the spillover in excess of the insurance limit falls back to the government or public.
The leverage provided by catastrophe insurance provides the policyholder (in this case, the national or local Government) with greater ability to meet heavy unexpected disaster relief and reconstruction obligations than might otherwise be the case. Figure 3 shows considerable volatility in calculated payout for an earthquake disaster relief risk financing scheme in a South-east Asian country over the past six years. Disaster funding in this territory at present consists of simply a budgetary allocation that does not accumulate year to year. In years with major earthquake-triggered catastrophes there may be a significant disaster funding shortfall, requiring emergency reallocation of budget that was previously allocated to other longer-term development objectives. Catastrophe insurance provides a means of meeting these enhanced obligations, in a way that can be allowed for in advance in the annual budget, thereby significantly reducing the need for emergency budgetary reallocation after the event. In this way the economy can be protected to some degree from unexpected fiscal shocks caused by earthquake that could interrupt, delay or even halt its development.
10

Table 1. Summary of the main disaster risk financing options available at Governmental level. Ex post = arranged after the event; Ex ante = arranged before the event. Ex ante solutions are preferred because the amounts involved are arranged in advance and can in some instances be paid rapidly. # Type Option Remarks
1 Ex post Donor assistance (for relief / reconstruction)
Often too little, too late; not guaranteed; not timeous; may be given instead in form of debt cancellation; donor fatigue if several major events worldwide in same year.
2 Ex post Emergency reallocation of budget to provide funds for disaster relief and reconstruction.
Budgetary reallocations will divert funds from other longer term development objectives. However the margin available for reallocation is often limited.
3 Ex post Increased Governmental borrowing (domestic and international).
Sovereign national rating may suffer downgrade if an earthquake damages the capital city or an area of major industrial infrastructure on which the economy is dependent. Ability to borrow will consequently be reduced at a time of need.
4 Ex post Tax increases or new taxes. On the taxable population and commercial economy. 5 Ex ante Contingencies in budget – enabling
retention of relatively small amounts of fiscal risk.
Draw down from pre-allocated national reserves to finance small but recurrent disasters. Contingencies are unlikely to be enough to cover damage from major earthquakes.
6 Ex ante Contingent credit (either on its own or together with other forms of ex ante funding) from international or domestic sources. Also known as Catastrophe Deferred Drawdown Option (Cat DDO).
Long term deferred credit facility to cover relief, recovery and reconstruction demands and/ or to provide funding whilst a catastrophe fund begins to accumulate. Arranged in advance but loan is drawn down only after a qualifying loss event.
7 Ex ante National catastrophe reserves fund. Accumulating reserves fund set aside specifically for disaster relief and reconstruction purposes.
8 Ex ante Catastrophe insurance (either on its own or together with other forms of ex ante funding).
Benefit of insurance leverage provides ability to meet volatile and occasionally very heavy demands for relief and reconstruction funds. Indemnity or parametric trigger basis.
9 Ex ante Catastrophe reserves fund + catastrophe insurance + contingent credit.
As the catastrophe reserves fund accumulates the need for catastrophe insurance decreases. The contingent loan facility provides bridging finance whilst the catastrophe fund is accumulating.
10 Ex ante Catastrophe bond(s)/Insurance Linked Securities
Investment-grade bond issued to secure the issuer by accessing guaranteed disaster finance from the international capital markets. Payout trigger usually has a parametric basis, although indemnity bonds do exist.
11
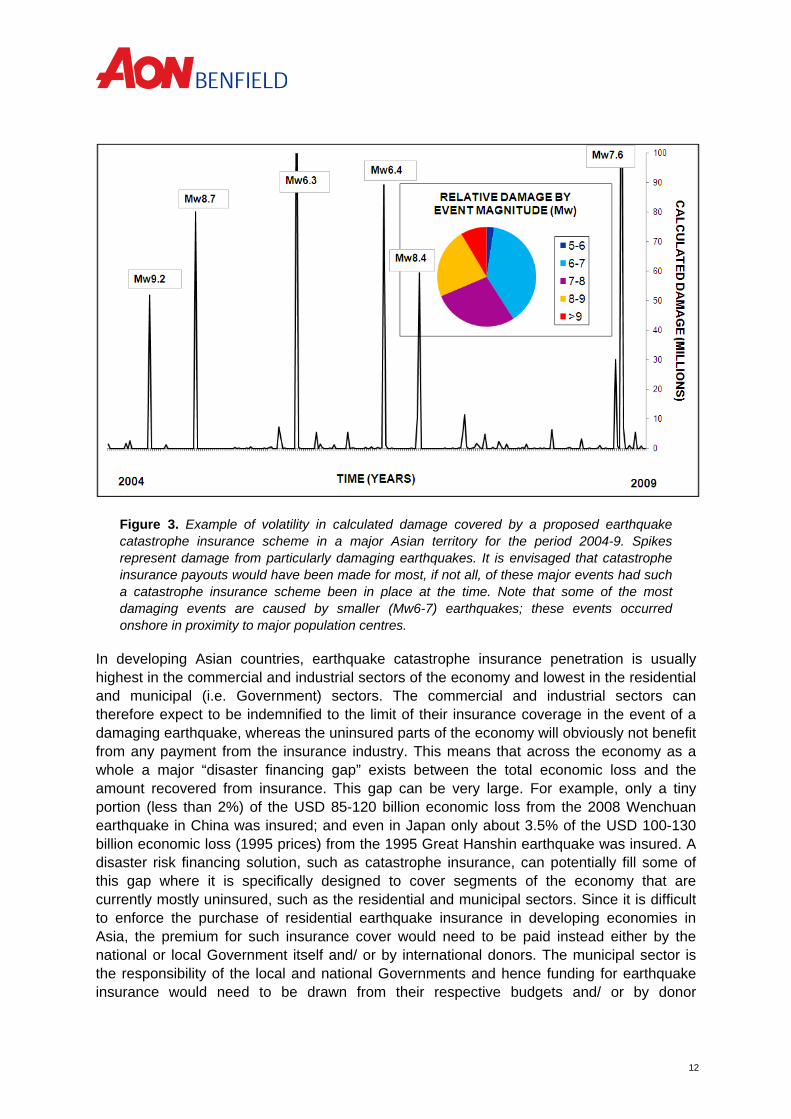
Figure 3. Example of volatility in calculated damage covered by a proposed earthquake catastrophe insurance scheme in a major Asian territory for the period 2004-9. Spikes represent damage from particularly damaging earthquakes. It is envisaged that catastrophe insurance payouts would have been made for most, if not all, of these major events had such a catastrophe insurance scheme been in place at the time. Note that some of the most damaging events are caused by smaller (Mw6-7) earthquakes; these events occurred onshore in proximity to major population centres.
In developing Asian countries, earthquake catastrophe insurance penetration is usually highest in the commercial and industrial sectors of the economy and lowest in the residential and municipal (i.e. Government) sectors. The commercial and industrial sectors can therefore expect to be indemnified to the limit of their insurance coverage in the event of a damaging earthquake, whereas the uninsured parts of the economy will obviously not benefit from any payment from the insurance industry. This means that across the economy as a whole a major “disaster financing gap” exists between the total economic loss and the amount recovered from insurance. This gap can be very large. For example, only a tiny portion (less than 2%) of the USD 85-120 billion economic loss from the 2008 Wenchuan earthquake in China was insured; and even in Japan only about 3.5% of the USD 100-130 billion economic loss (1995 prices) from the 1995 Great Hanshin earthquake was insured. A disaster risk financing solution, such as catastrophe insurance, can potentially fill some of this gap where it is specifically designed to cover segments of the economy that are currently mostly uninsured, such as the residential and municipal sectors. Since it is difficult to enforce the purchase of residential earthquake insurance in developing economies in Asia, the premium for such insurance cover would need to be paid instead either by the national or local Government itself and/ or by international donors. The municipal sector is the responsibility of the local and national Governments and hence funding for earthquake insurance would need to be drawn from their respective budgets and/ or by donor
12

assistance. In both cases it is envisaged that a single earthquake catastrophe insurance policy could be issued to the national Government on behalf of a particular economic sector as a whole. Payouts from the insurance policy would subsequently be disbursed by the Government at its discretion to assist in disaster relief and/ or reconstruction. It is worth noting here that there are currently only a few examples worldwide of catastrophe insurance being used to provide funds directly to Government or Government agencies (rather than directly to individuals such as homeowners) because of earthquake damage, all of which employ catastrophe models as the basis for loss estimation. In both cases outlined below the amount of insurance coverage and hence the payout is calibrated to a proportion of the total economic loss and is not tied to a specific economic sector:
1) Caribbean - The Caribbean Catastrophe Risk Insurance Fund (CCRIF) covers sixteen island nations in the Caribbean for earthquake and hurricane windstorm peril up to the limit of each island’s catastrophe insurance policy. The original CCRIF scheme used a parametric index (i.e. an index constructed from modelled event characteristics, such as ground shaking intensity, across an array of island locations) to calculate the insurance payout. An upgraded loss estimation methodology is now being adopted involving modelling of actual event damage using a bespoke catastrophe model. The CCRIF scheme has made payout to policyholders several times since its inception, most recently to the Government of Haiti within three weeks of the devastating 12 January 2010 earthquake. Note that the payout received was about 20 times the premium paid by the Haitian Government to CCRIF.
2) Mexico – The Mexican Government’s disaster agency FONDEN has issued multiple Catastrophe Bonds to institutional investors to enhance its ability to meet relief obligations arising from an earthquake similar to the 19 September 1985 magnitude 8.1 “Mexico City” earthquake. In each case a fixed payout is made to FONDEN if a qualifying earthquake (i.e. one which exceeds a threshold magnitude within predefined areas during the fixed lifetime of the bond). No payouts to FONDEN have yet been made because, fortunately, no major earthquakes have yet occurred in the areas specified.
An important consideration when designing a disaster risk financing scheme is that developing countries are naturally keen to maximise retention of funds within their national economies, e.g. by minimising payments made internationally to third parties such as reinsurers. This can be accommodated by combining selected risk financing options (outlined in Table 1) in such a way as to retain more risk (and hence premium) within the national economy by only transferring exceptionally large losses to international reinsurers. For example, smaller more frequent losses might be tackled using domestic catastrophe reserves and/ or budget contingencies set aside specifically for this purpose. Larger less frequent losses could be handled using funds drawn only when required from a guaranteed contingent credit facility from an international agency. Infrequent exceptionally large losses could be covered by catastrophe insurance (backed by international reinsurance) with a deductible set at a level to ensure that only losses exceeding a certain size are covered by the insurance. By covering only very large losses, catastrophe insurance would be considerably less expensive than if it were to also cover smaller, higher frequency losses as well. This means that less premium would be paid onwards to international reinsurers, helping to maximise the domestic retention of premium within the territory.
13

14
A call is made here for disaster risk financing schemes covering vulnerable economic sectors that are currently mostly uninsured (such as the residential and municipal sectors) to be set up in collaboration with the Governments of highly earthquake-prone developing countries in Asia, such as Indonesia and the Philippines. This would help to significantly cushion these economies from the fiscal risk arising from unexpected major earthquake disasters. Catastrophe models enable the pricing of catastrophe insurance, which provides the capability to cover occasional extreme loss events; and as such underpin the development of such schemes.
Conclusions There is significant scope for applying earthquake catastrophe models to disaster relief planning, risk mitigation and disaster financing operations in earthquake-prone developing territories in Asia, and a call is therefore made here for the development and application of bespoke catastrophe models to support these purposes. Catastrophe model outputs can be deployed within decision support systems designed specifically to enable disaster relief planning, for use in training the emergency services on scenario earthquakes and to give advance warning of what to expect in the aftermath of an actual earthquake. Catastrophe models can also be used to quantify the financial benefit of proposed risk mitigation measures prior to their introduction as part of a wider cost-benefit analysis. Finally, catastrophe models have more traditional application in loss estimation and pricing for insurance and reinsurance, including enabling the development of disaster risk financing schemes for developing countries that are prone to damaging earthquakes.

References ADB (2008) Natural Catastrophe Risk Insurance Mechanisms for the Asia and Pacific Region. Asian Development Bank Regional Technical Assistance Report, August 2008, 14p. Project Number 42103. Available at: http://www.adb.org/Documents/TARs/REG/42103-REG-TAR.pdf. Checked 08/11/2010.
AIR Worldwide (2005) 1992 Hurricane Andrew Anniversary. Available at: http://www.air-worldwide.com/PublicationsItem.aspx?id=14642. Checked 24/03/2011.
CAPRA (2008) GFDRR Case Study: Central American Probabilistic Risk Assessment (CAPRA). Available at: http://www.gfdrr.org/docs/Snapshot_CAPRA.pdf. Checked 04/04/2011.
Eguchi, R., Goltz, J.D., Seligson, H and Heaton, T.H. (1994) Real-time earthquake hazard assessment in California: the early post-earthquake damage assessment tool and the Caltech-USGS broadcast of earthquakes. Proceedings of the 5th U.S. National Conference on Earthquake Engineering, II, 55-63.
Evans, D.D, Walton, W.D. & Mowrer, F.W. (1997) Progress report on fires following the Northridge earthquake. Thirteenth Meeting of the UJNR Panel on Fire Research and Safety, March 13-20, 1996, Volume 2 (Ed. by Beall, K. A.). Building and Fire Research Laboratory, National Institute of Standards and Technology, Gaithersburg, MD 20899. Available at: http://www.fire.nist.gov/bfrlpubs/fire97/PDF/f97088.pdf. Checked 14/04/2011.
FEMA (2010) HAZUS: FEMA’s Methodology for Estimating Potential Losses from Disasters. Available at: http://www.fema.gov/plan/prevent/hazus/. Checked 08/11/2010.
GEM (2010) Global Earthquake Model. Available at: http://www.globalquakemodel.org. Checked 01/11/2010.
Hosokawa, M., Jeong, B., Takizawa,O., Matsuoka, M. (2008) Disaster risk evaluation and damage detection using remote sensing data for global rescue operations. In: Proceedings of Commission VIII ISPRS Congress, Beijing, China, July 2008. Available at: http://www.isprs.org/proceedings/XXXVII/congress/8_pdf/2_WG-VIII-2/06.pdf. Checked 04/04/2011.
Kunreuther, H. & Michel-Kerjan, E. (2009) At War with the Weather: Managing Large-scale Risks in a New Era of Catastrophes. MIT Press, Cambridge, MA.
Lau, A.Y.A., Switzer, A.D., Dominey-Howes, D., Aitchison, J.C. & Zong, Y. (2010) Written records of historical tsunamis in the northeastern South China Sea – challenges associated with developing a new integrated database. Natural Hazards and Earth Systems Science, 10, 1793-1806.
1

Megawati, K., Shaw, F., Sieh, K., Huang, Z., Wu, T-R., Lin, Y., Tan, S.K. & Pan, T-C. (2009) Tsunami hazard from the subduction megathrust of the South China Sea: Part 1. Source characterization and the resulting tsunami. Journal of Asian Earth Sciences, 36, 13-20.
Musulin, R., Lin, R. & Frank, S. (2009) Dealing with the axis of financial destruction: demographics, development and disasters. Proceedings of Conference sponsored by Aon Benfield Australia Limited, 43-58.
Nakamura, Y. (1996) Research and development of intelligent earthquake disaster prevention systems UrEDAS and HERAS. Journal of Structural Mechanics and Earthquake Engineering, JSCE, 537, 1-33 (in Japanese).
RMS (2005) 1995 Kobe Earthquake 10-Year Retrospective. Available at: http://www.rms.com/Reports/KobeRetro.pdf. Checked 14/04/2011.
Sieh, K. (2009) Next Big One Will Strike Sumatra Within Decades. Available at: http://www.earthobservatory.sg/index.php?option=com_content&view=article&id=213&Itemid=105. Checked 28/03/2011.
USGS (2010a) SHAKEMAPS. Available at: http://earthquake.usgs.gov/earthquakes/shakemap. Checked 01/11/2010.
USGS (2010b) PAGER - Prompt Assessment of Global Earthquakes for Response. Available at: http://earthquake.usgs.gov/earthquakes/pager. Checked 01/11/2010.
WAPMERR (2010) World Agency of Planetary Monitoring and Earthquake Risk Reduction. Real-time Loss Estimates after Earthquakes. Available at: http://www.wapmerr.org/realtime.asp. Checked 30/03/2011.
Wen, K-L., Chang, Y-W., Lin, C-M., Chiang, H-J. & Huang, M-W. (2008) Damage and ground motion of the 26 December 2006 Pingtung earthquakes, Taiwan. Terrestrial Atmospheric and Oceanic Sciences, 19(6), 641-651.
Yamazaki, F., Meguro, K. & Noda, S. (1998) Developments of early earthquake damage assessment systems in Japan. Structural Safety and Reliability (Ed. by Shiraishi, Shinozuka & Wen), Balkema, Rotterdam, 1573-1580.
Yamin, L.E., Arámbula, S., Reyes, J.C., Belage, S., Vega, A. & Gil, W. (2004) Earthquake loss estimation for a gas lifeline transportation system in Colombia. 13th World Conference on Earthquake Engineering, Vancouver, B.C., Canada, August 1-6, 2004, Paper No. 2941. Available at: http://www.iitk.ac.in/nicee/wcee/article/13_2941.pdf. Checked 03/04/2011.
Yeh, C-H, Loh, C-H and Tsai, K-C. (2006) Overview of Taiwan Earthquake Loss Estimation System. Natural Hazards, 37, 23-37.
2

3
Contacts Dr. Nigel Winspear Head of Catastrophe Management, Aon Benfield Asia t: +65 6512 0214 e: [email protected] Mr. Rade Musulin Chief Operating Officer, Aon Benfield Analytics Asia Pacific t: +61 2965 00428 e: [email protected]
About Aon Benfield Aon Benfield, a division of Aon Corporation (NYSE: AON), is the world’s leading reinsurance intermediary and full-service capital advisor. We empower our clients to better understand, manage and transfer risk through innovative solutions and personalized access to all forms of global reinsurance capital across treaty, facultative and capital markets. As a trusted advocate, we deliver local reach to the world’s markets, an unparalleled investment in innovative analytics, including catastrophe management, actuarial and rating agency advisory. Through our professionals’ expertise and experience, we advise clients in making optimal capital choices that will empower results and improve operational effectiveness for their business. With more than 80 offices in 50 countries, our worldwide client base has access to the broadest portfolio of integrated capital solutions and services. To learn how Aon Benfield helps empower results, please visit aonbenfield.com.
This document is intended for general information purposes only and should not be construed as advice or opinions on any specific facts or circumstances. The comments in this summary are based upon Aon Benfield's preliminary analysis of publicly available information. The content of this document is made available on an “as is” basis, without warranty of any kind. Aon Benfield disclaims any legal liability to any person or organization for loss or damage caused by or resulting from any reliance placed on that content. Aon Benfield reserves all rights to the content of this document. © 2012 Aon Benfield Inc.