EARTH RESOURCES REGULATION€¦ · 2013/14 STATISTICAL REPORT 2 Executive Summary In the 2013/14...
25
EARTH RESOURCES REGULATION 2013–2014 STATISTICAL REPORT
Transcript of EARTH RESOURCES REGULATION€¦ · 2013/14 STATISTICAL REPORT 2 Executive Summary In the 2013/14...

EARTH RESOURCES REGULATION 2013–2014 STATISTICAL REPORT

2013/14 STATISTICAL REPORT
2
Executive Summary In the 2013/14 financial year, activity and investment in the earth resources industries was generally subdued, continuing the trend observed in the previous financial year. The petroleum and geothermal sector again witnessed limited activity, and mineral exploration expenditure continued to fall. Brown coal production remained relatively stable, despite the production interruptions. In the petroleum sector, production remained limited to production and injection at the Iona gas storage facility and carbon dioxide production at Boggy Creek, both of which are located in the onshore Otway Basin area. No hydrocarbon discoveries were reported. Investment in geothermal energy resource exploration was low, totalling $908,000, thus below the exploration expenditure reported in 2012/13 ($1.1 million). No wells were drilled during the year, as a result of the moratorium on fracking and onshore natural gas exploration. There was no geothermal energy production. Petroleum and geothermal licensing activity was minimal, with just two onshore petroleum exploration permits granted in the course of 2013/14, though three applications were received (two for offshore petroleum exploration permits and one for an offshore petroleum production licence). Minerals licensing activity in 2013/14 remained somewhat subdued compared to previous years, with a continued fall in the total number of applications received, though the number of grants was up in relation to 2012/13, and the first retention licence grant was issued in 2013/14. The total number of licences at the end of June 2014, however, was down by 43 to 494, on account of expirations and surrenders. In the minerals sector, the general production trend over the past three to five years has reflected fluctuating demand. Production of brown coal in the Latrobe Valley fell to its lowest level since 1995/96, partly due to changing energy demand and sources. Gold production also fell, though only slightly, with volumes down to 225,148 ounces (from 225,776 in 2012/13). Gold production values, however, experienced a sharper decline, falling to 303.4 million from 333.1 million. Production of heavy minerals sands, on the other hand, recovered significantly, reflecting higher overseas demand. Mineral exploration and mining expenditures both fell, reflecting the subdued industry conditions. The largest falls in exploration expenditure were in the gold and brown coal sectors, with increases in the base metals and antimony. Volume sales of extractive industry (quarry) products in 2013/14 fell by around 7.1 million tonnes, or 18% on a year-on-year (y-o-y) basis, reflecting fluctuating domestic demand from the building and construction sector. Value sales experienced a smaller y-o-y decrease (falling by 9% to $677 million). In 2013/14, state revenue (rent, royalty and administrative charges) derived from the earth resources sector totalled $50.1 million, down from $57.2 million collected in 2012/13. The fall was primarily due to lower royalties resulting from the slowing down of the mining and extractive industry production, while petroleum royalties remained unchanged.

2013/14 STATISTICAL REPORT
3
1. Introduction The Statistical Report is a compilation of data as reported by Victoria’s earth resources industry. The report includes data on production, exploration, expenditure, licensing, revenues and regulatory actions. Victoria’s earth resource industry production includes:
gas and carbon dioxide – from onshore;
brown coal – used almost exclusively for power generation;
gold;
antimony;
industrial minerals – including gypsum, feldspar, rutile, zircon, ilmenite and kaolin; and
rock, sand and clay – used mainly for building and road construction. Earth Resources Regulation Branch in the Department of Economic Development, Jobs, Transport and Resources (DEDJTR) - previously known as the Department of Primary Industries (DPI) and the Department of State Development, Business and Innovation (DSDBI) - is responsible for the Regulation of the minerals, extractives, petroleum, pipelines, geothermal and carbon storage industries in Victoria and offshore (Victorian) waters. The Branch provides a consistent and transparent tenement management regime, together with monitoring and enforcement that ensure these industries comply with their obligations and meet community expectations. The responsibility for the petroleum, pipelines and carbon storage industries in offshore (Commonwealth) waters was transferred to the National Offshore Petroleum Title Administrator (NOPTA) on 1 January 2012, and these are no longer reported on in this publication. Historical information on petroleum industry activities and production in offshore (Commonwealth) waters is available in earlier editions of the Statistical Report or from the National Offshore Petroleum Titles Administrator (more information can be found at www.nopta.gov.au). Earth Resources Regulation Branch administers the following Acts:
Mineral Resources (Sustainable Development) Act 1990 (MRSDA) (mineral exploration, mining and quarrying);
Offshore Petroleum and Greenhouse Gas Storage Act 2010 (OPGGSA) (petroleum exploration and development, greenhouse gas storage and pipelines in the Victorian offshore waters);
Petroleum Act 1998 (petroleum exploration and development onshore);
Pipelines Act 2005 (licensing and regulation of high pressure pipelines onshore);
Geothermal Energy Resources Act 2005 (geothermal energy exploration and development); and
Greenhouse Gas Geological Sequestration Act 2008 (greenhouse gas storage onshore).

2013/14 STATISTICAL REPORT
4
2. Petroleum, Geothermal and Pipelines
2.1. Petroleum Victoria’s petroleum exploration and production is concentrated in the Otway and Gippsland Basins, with activities undertaken both onshore and in Victorian offshore waters. Offshore activities concern waters effectively within three nautical miles of the coast, as covered by Victorian legislation. Waters greater than three nautical miles offshore from the coast are Commonwealth waters and are as such covered by Commonwealth legislation and therefore not included in this report.
2.1.1. Petroleum tenements In 2013/14, two onshore exploration permits were granted. Two applications for an offshore exploration permit and one application for an offshore production licence were also received. Table 2.1 Overview of petroleum tenements current as at 30 June 2014
Petroleum Exploration Permits (PEPs)
Petroleum Retention Leases (PRLs)
Petroleum Production Licences (PPLs)
Onshore 11 3 13
Offshore (Vic) 1 2 0
Source: DEDJTR
Onshore Table 2.2 Overview of onshore petroleum exploration permits (PEPs)
2006/07 2007/08 2008/09 2009/10 2010/11 2011/12 2012/13 2013/14
PEP Application Received
3 0 0 0 4 1 0 0
PEP Granted 2 1 0 0 1 0 2 2
Source: DEDJTR Table 2.3 Overview of onshore petroleum retention licences (PRLs)
2006/07 2007/08 2008/09 2009/10 2010/11 2011/12 2012/13 2013/14
PRL Application Received
1 0 0 0 0 0
0
0
PRL Granted 2 1 0 0 0 0 0 0
Source: DEDJTR No onshore petroleum production licences applications have been received or licences granted in the period between 2006/07 and 2013/14.

2013/14 STATISTICAL REPORT
5
Offshore (State Waters) No offshore petroleum production licences are current. One application for an offshore petroleum production licence and two applications for an offshore petroleum exploration permit were received in 2013/14. Table 2.4 Overview of offshore petroleum exploration permits (VIC/P(V)s)
2007/08 2008/09 2009/10 2010/11 2011/12 2012/13 2013/14
VIC/P(V) Application Received
0 0 0 1 0 0 2
VIC/P(V) Granted
0 0 0 0 1 0 0
Source: DEDJTR Table 2.5 Overview of offshore petroleum retention leases (VIC/RL(V)s)
2007/08 2008/09 2009/10 2010/11 2011/12 2012/13 2013/14
VIC/RL(V) Application Received
0 1 0 0 0
0
0
VIC/RL(V) Granted
0 1 0 0 0 0 0
Source: DEDJTR Table 2.6 Overview of offshore petroleum production licences (VIC/L(V)s)
2007/08 2008/09 2009/10 2010/11 2011/12 2012/13 2013/14
VIC/L(V) Application Received
0 0 0 0 0 0 1
VIC/L(V) Granted
0 0 0 0 0 0 0
Source: DEDJTR
2.1.2. Petroleum exploration and development The level of petroleum exploration activity was low. No drilling was performed in Victoria and seismic activity was limited. Approximately $6.7 million in expenditure was reported on onshore petroleum exploration permits and retention leases. Most of this expenditure was spent on the acquisition of the seismic surveys in the Otway Basin. The remaining expenditure was mostly accounted for by geological and geophysical studies, geophysical logging, flaring and administration. Petroleum exploration activity in the offshore area was also limited. Around $1.036 million in expenditure was reported on offshore tenements. With no wells drilled or seismic surveys undertaken, most of this expenditure was represented by geological studies, seismic preparation, studies on licensing and permitting, studies on the subsurface, ongoing capital appraisal work and market studies.

2013/14 STATISTICAL REPORT
6
Drilling In the course of 2013/14, no onshore wells were drilled in Victoria as a result of the moratorium on onshore natural gas and hydraulic fracturing. Table 2.7 Number of exploration wells drilled in Victoria over time
Year Offshore (Victoria) Onshore Total wells
Gippsland Otway Gippsland Otway Murray
1999/00 0 0 3 2 0 5
2000/01 0 0 2 5 0 7
2001/02 0 0 4 7 1 12
2002/03 0 0 3 4 0 7
2003/04 0 0 1 2 0 3
2004/05 0 1 2 0 0 3
2005/06 0 0 4 4 0 8
2006/07 1 0 4 2 0 7
2007/08 0 0 0 2 0 2
2008/09 0 0 0 1 0 1
2009/10 0 0 1 0 0 1
2010/11 0 0 0 0 0 0
2011/12 0 0 1 1 0 2
2012/13 0 0 2 0 0 2
2013/14 0 0 0 0 0 0
Total 1 1 27 30 1 60
Source: DEDJTR Graph 2.1 Number of exploration wells drilled over time
Source: DEDJTR

2013/14 STATISTICAL REPORT
7
Geophysical Surveys Three onshore 2D seismic surveys (two in Morgan, in the PEP150 and PEP151 area, and one in Ostrea, within the PEP168 area) were undertaken in the Otway Basin in 2013/14. No other petroleum geophysical surveys were conducted in the course of 2013/14.
Hydrocarbon Discoveries There were no hydrocarbon discoveries made onshore or offshore in 2013/14.
Production Production is currently limited to carbon dioxide production at Boggy Creek and gas injection and production at the Iona gas storage facility, both of which are located in the onshore Otway Basin. Table 2.8: Otway onshore production and injection 2013/14
Field Condensate (bbl*) Gas Production (MMscf**)
CO2 Prod. (tonnes)
Gas Injection (MMscf)
Comments
Iona 644.51 7,671.43 - 8,595.49 Gas storage
Boggy Creek Negligible - 37,145.8 - CO2 production
Source: DEDJTR *bbl = barrels **MMscf = million standard cubic feet
2.2. Geothermal Energy As at 30 June 2014, six geothermal energy exploration permits were current, following the surrender of seven permits in 2013/14. There were no granted geothermal energy retention leases or production licences. Any geothermal energy activities in Victoria remain limited to exploration.
2.2.1. Geothermal energy tenements No geothermal energy tenements were applied for or granted in 2013/14. Table 2.9 Overview of geothermal energy tenements
Description 2006/07 2007/08 2008/09 2009/10 2010/11 2011/12 2012/13 2013/14
GEP Application Received
20 26 0 0 0 0 0 0
GEP Granted 12 11 0 0 0 0 0 0
Source: DEDJTR
2.2.2. Geothermal energy exploration Exploration activities in the geothermal energy sector in 2013/14 were subdued, with $0.908 million reported on exploration permit expenditure. There were no exploration activities that involved drilling or geophysical surveys. Most of the reported activities comprised of geological and geophysical data compilation and analysis, geothermal modelling and administration.

2013/14 STATISTICAL REPORT
8
2.3. Pipelines Licences are granted for the construction and operation of high pressure pipelines, primarily to convey hydrocarbons, including natural gas, crude oil and petroleum products. Pipeline licences are granted onshore under the Pipelines Act 2005 and offshore in Victorian waters under the Offshore Petroleum and Greenhouse Gas Storage Act 2010. Pipeline licences in offshore Victorian waters are used to convey onshore hydrocarbons originating from petroleum production facilities in offshore (Commonwealth) waters to onshore processing facilities. In 2013/14, two pipeline licences were applied for, and one pipeline licence was granted. Table 2.10 Onshore pipeline licences (PL) applications received and granted
Source: DEDJTR Table 2.11 Offshore pipeline licences (PL) applications received and granted (state waters)
Source: DEDJTR Table 2.12 Pipeline licences (PLs) current as at 30 June 2014
Tenement Number of PLs
Onshore 214
Offshore (Vic) 13
Source: DEDJTR
2006/07 2007/08 2008/09 2009/10 2010/11 2011/12 2012/13 2013/14
PL Application Received
9 0 0 0 1 0 0 2
PL Granted 7 2 1 0 0 1 0 1
2006/07 2007/08 2008/09 2009/10 2010/11 2011/12 2012/13 2013/14
PL Application Received
0 0 1 0 0 0 0 0
PL Granted 0 0 0 0 0 0 0 0
2013/14 STATISTICAL REPORT
9
3. Minerals
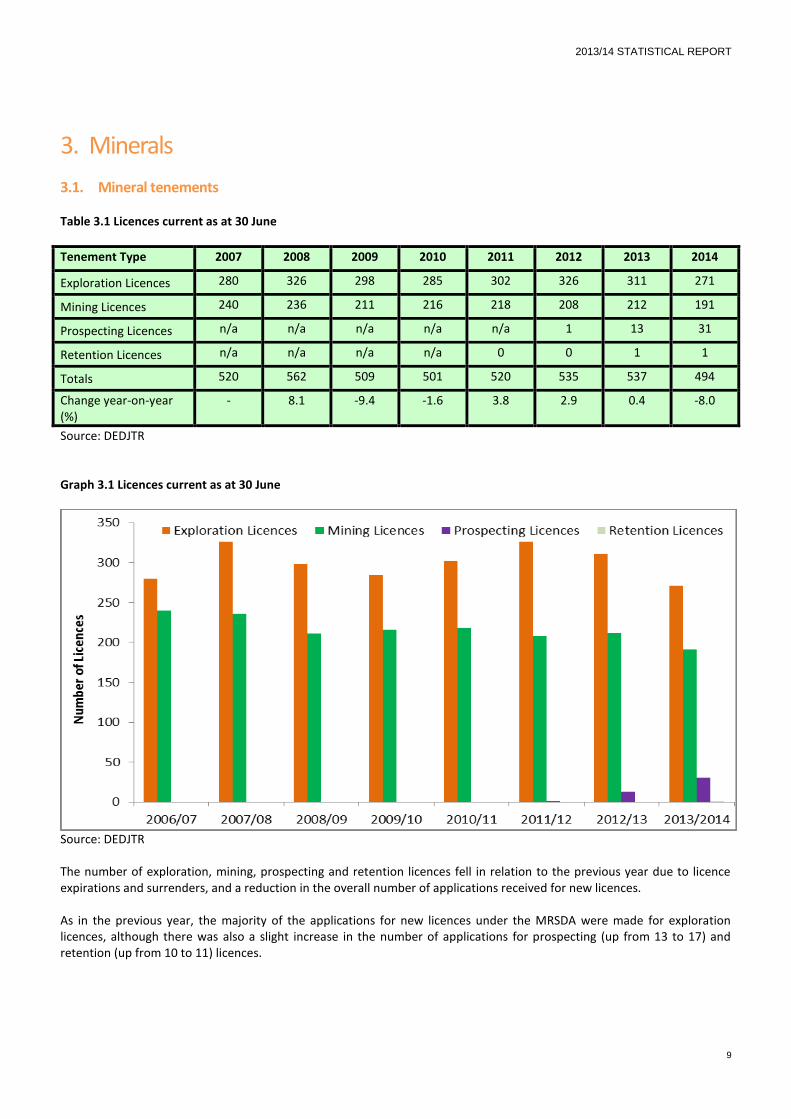
3.1. Mineral tenements Table 3.1 Licences current as at 30 June
Tenement Type 2007 2008 2009 2010 2011 2012 2013 2014
Exploration Licences 280 326 298 285 302 326 311 271
Mining Licences 240 236 211 216 218 208 212 191
Prospecting Licences n/a n/a n/a n/a n/a 1 13 31
Retention Licences n/a n/a n/a n/a 0 0 1 1
Totals 520 562 509 501 520 535 537 494
Change year-on-year (%)
- 8.1 -9.4 -1.6 3.8 2.9 0.4 -8.0
Source: DEDJTR Graph 3.1 Licences current as at 30 June
Source: DEDJTR The number of exploration, mining, prospecting and retention licences fell in relation to the previous year due to licence expirations and surrenders, and a reduction in the overall number of applications received for new licences. As in the previous year, the majority of the applications for new licences under the MRSDA were made for exploration licences, although there was also a slight increase in the number of applications for prospecting (up from 13 to 17) and retention (up from 10 to 11) licences.
2013/14 STATISTICAL REPORT
10
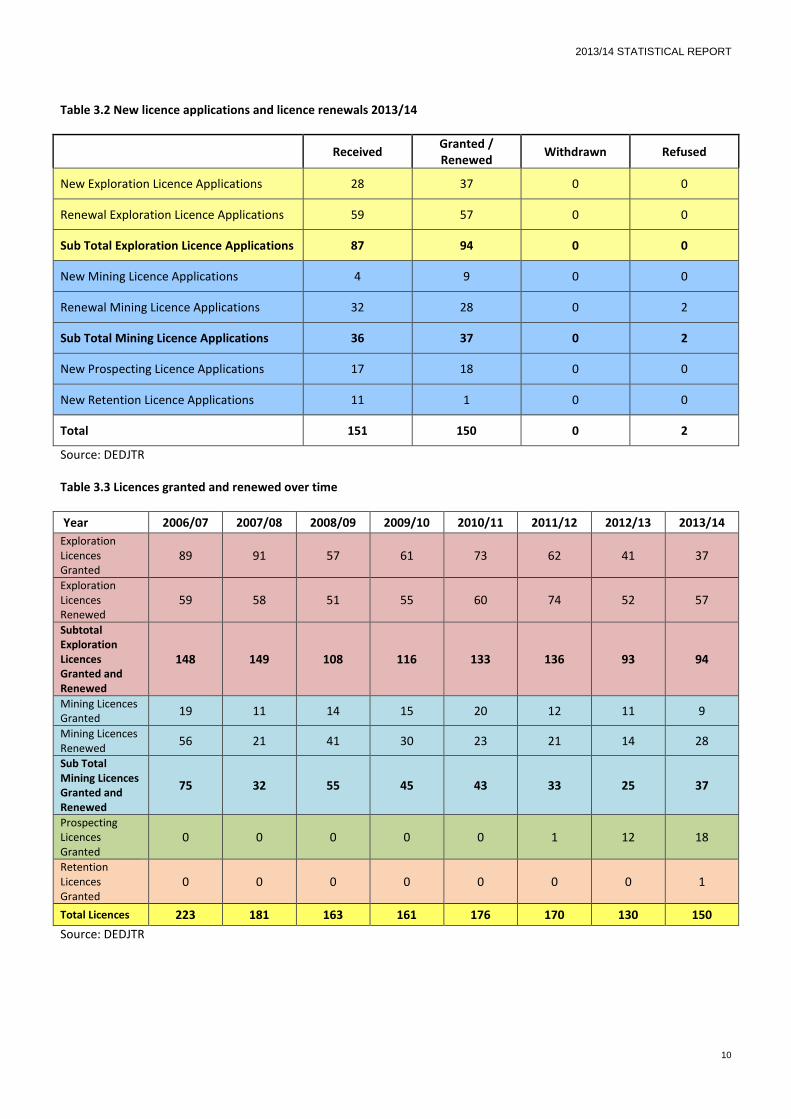
Table 3.2 New licence applications and licence renewals 2013/14
Received Granted / Renewed
Withdrawn Refused
New Exploration Licence Applications 28 37 0 0
Renewal Exploration Licence Applications 59 57 0 0
Sub Total Exploration Licence Applications 87 94 0 0
New Mining Licence Applications 4 9 0 0
Renewal Mining Licence Applications 32 28 0 2
Sub Total Mining Licence Applications 36 37 0 2
New Prospecting Licence Applications 17 18 0 0
New Retention Licence Applications 11 1 0 0
Total 151 150 0 2
Source: DEDJTR Table 3.3 Licences granted and renewed over time
Year 2006/07 2007/08 2008/09 2009/10 2010/11 2011/12 2012/13 2013/14
Exploration Licences Granted
89 91 57 61 73 62 41 37
Exploration Licences Renewed
59 58 51 55 60 74 52 57
Subtotal Exploration Licences Granted and Renewed
148 149 108 116 133 136 93 94
Mining Licences Granted
19 11 14 15 20 12 11 9
Mining Licences Renewed
56 21 41 30 23 21 14 28
Sub Total Mining Licences Granted and Renewed
75 32 55 45 43 33 25 37
Prospecting Licences Granted
0 0 0 0 0 1 12 18
Retention Licences Granted
0 0 0 0 0 0 0 1
Total Licences 223 181 163 161 176 170 130 150
Source: DEDJTR

2013/14 STATISTICAL REPORT
11
Graph 3.2: Exploration licences granted and renewed
Source: DEDJTR Graph 3.3: Mining licences granted and renewed
Source: DEDJTR Graph 3.4: Prospecting* and retention licences granted
Source: DEDJTR * Prospecting licence cannot be renewed.

2013/14 STATISTICAL REPORT
12
The total area of the state covered by exploration licences (current and in application) on 30 June 2014 was 75,018 km², which marked a marginal fall in relation to the previous year and mirrors a general downward trend observed over the five years to 2013/14, reflecting the wider state of the industry. Table 3.5 Total area covered by exploration licences (current and in application as at 30 June)
2007 2008 2009 2010 2011 2012 2013 2014
Total area (km2)
91,500 98,086 95,240 86,365 75,753 83,900 77,366 75,018
Source: DEDJTR Graph 3.5: Total area covered by licences (current and in application as at 30 June)
Source: DEDJTR
3.2. Mineral exploration and mining expenditure Mineral exploration expenditure is a lead indicator of mineral industry activity. ABS data shows a fall of 15.5% in Victorian exploration expenditure in 2013/14, compared to the previous year. While significant, this fall is reflective of falls in exploration expenditure Australia-wide over the same period, from $3,055.4 million to $2,108.8 million (30.9%). MRSDA data on mining also show a continuous decline in the dollar amounts spent on exploration and mining, in line with the trend observed in previous years, with exploration expenditure falling more dramatically (by 10% y-o-y, as compared to 7% for mining).

2013/14 STATISTICAL REPORT
13
Graph 3.6: Expenditure on mineral exploration and mining development
Source: DEDJTR 1
The Australian Bureau of Statistics (ABS) reports quarterly on private mineral exploration expenditure for all Australian States and the Northern Territory
(NT). Victorian mineral exploration and mining expenditure is also reported in accordance with the requirement of the MRSDA. The ABS exploration expenditure statistics can vary significantly from expenditure reported under the MRSDA. The difference between these two exploration expenditure data sets is mainly due to the difference in methodologies for data collection, and the inclusion of the exploration expenditure on mining licences in the MRSDA figure. The ABS statistics are a valid basis for comparison of Victorian expenditure with that of other States/NT. However, the MRSDA figures provide greater detail. 2 The MRSDA exploration expenditure figure is derived from the activity reports required for the period 1 July-30 June. The MRSDA figure covers
exploration carried out on exploration, mining and prospecting licences, and includes all expenditure on exploration licences (including overheads, wages/salaries, land access and rehabilitation expenses) and specified exploration expenditure on mining and prospecting licences. 3
The MRSDA mining expenditure figure covers all expenditure on mining and prospecting licences (including capital and operating expenses), less any
specified exploration expenditure on mining and prospecting licences.
Table 3.6 Expenditure on mineral exploration and mining development ($A million)
Year 2006/07 2007/08 2008/09 2009/10 2010/11 2011/12 2012/13 2013/14
Mineral Exploration (ABS)
1
82.5 93.7 62.2 84.8 57.4 58.5 38.6 32.6
MRSDA Exploration
2 105.4 107.8 103.3 94.3 64.6 65.1 59.7 53.5
MRSDA Mining
3
527.8 576.6 923.3 742 719.2 813.8 701.2 650.3
Source: Figures collated from activity reports forwarded to DEDJTR required by the MRSDA, and ABS, Actual and Expected Private Mineral Exploration (Catalogue No. 8412.0) 1
The Australian Bureau of Statistics (ABS) reports quarterly on private mineral exploration expenditure for all Australian States and the Northern Territory
(NT). Victorian mineral exploration and mining expenditure is also reported in accordance with the requirement of the MRSDA. The ABS exploration expenditure statistics can vary significantly from expenditure reported under the MRSDA. The difference between these two exploration expenditure data sets is mainly due to the difference in methodologies for data collection, and the inclusion of the exploration expenditure on mining licences in the MRSDA figure. The ABS statistics are a valid basis for comparison of Victorian expenditure with that of other States/NT. However, the MRSDA figures provide greater detail. 2 The MRSDA exploration expenditure figure is derived from the activity reports required for the period 1 July-30 June. The MRSDA figure covers
exploration carried out on exploration, mining and prospecting licences, and includes all expenditure on exploration licences (including overheads, wages/salaries, land access and rehabilitation expenses) and specified exploration expenditure on mining and prospecting licences. 3
The MRSDA mining expenditure figure covers all expenditure on mining and prospecting licences (including capital and operating expenses), less any
specified exploration expenditure on mining and prospecting licences.
By sector, exploration on gold mining continues to account for the largest proportion of the total by single sector (over one third of the total exploration expenditure and also of the total mining expenditure). Exploration activities in the brown coal sector were considerably lower than in the previous year, reflecting wider industry trends.

2013/14 STATISTICAL REPORT
14
Graph 3.7 Mineral exploration and mining development expenditure by sector (MRSDA) 2013/14
Source: DEDJTR Table 3.7 Expenditure on mineral exploration and mining development by sector*
Sector Exploration ($A million) As % of total Mining ($A million) As % of total
Brown Coal 1.2 2.2 261.0 40.1
Gold 18.5 34.5 216.0 33.2
Heavy Mineral Sands 4.2 7.8 96.1 14.8
Other 29.6 55.4 77.3 11.9
Total 53.5 100.0 650.3 100.0
Source: DEDJTR *Notes: Expenditures are allocated to commodity according to the primary nominated mineral commodity on the licence. Brown coal includes all coal types.
3.3. Mineral production Victorian mineral production remains mostly brown coal, minerals sands, gold and, to a lesser degree, antimony. Brown coal production remains dominated by the electricity generation companies in the Latrobe Valley, namely Hazelwood Power Corporation, Loy Yang Power Ltd and Yallourn Energy Pty Ltd. The other major brown coal miner was Alcoa Australia Ltd, which produced brown coal at Anglesea to generate electricity for its Point Henry aluminium smelter. The Maddingley Brown Coal Company produces a very small amount of coal at Bacchus Marsh, mainly for fuel and soil conditioning purposes. Brown coal production in the Latrobe Valley fell by 1.5 million tonnes in 2013/14, though this was a marked recovery from the previous year’s fall of nearly 9 million tonnes. The largest fall was reported by the Loy Yang mine, which is partly explained by portfolio effect, following the take-over by AGL in mid-2012 and the achievement of cost and product efficiencies. Output from the Hazelwood mine was also negatively impacted by the February/March 2013 fires. The production at the Yallourn mine, which had been significantly impacted by the collapse of the Morwell River Diversion in June 2012 that resulted in flooding of part of the mine, recovered somewhat, but remains significantly below the pre-flooding levels. Additionally, brown coal production fluctuations can partly be explained by the changes in energy demand and also by the changes in the mix of energy sources. Gold production also fell, though only slightly, with volumes down to 225,148 ounces (from 225,776 in 2012/13). Gold production values, however, experienced a sharper decline, falling to 303.4 million from 333.1 million. Volume production of minerals increased significantly in 2013/14, on account of investment in production of heavy mineral sands. In terms of value of mineral production (excluding brown coal), the total fell significantly from $1,007 million in 2011/12 to $660 million in 2012/13. The decline continued into 2013/14, though not to the same degree, with the total value down to $647 million.

2013/14 STATISTICAL REPORT
15
Table 3.8 Mineral production over time*
Year Fuel Minerals Metallic Minerals Heavy Mineral Sands Industrial Minerals
Brown Coal Gold Anti-
mony
Copper
Concentrate
Zinc
Concentrate
Zircon Rutile Ilmenite Feldspar Gypsum Kaolin
and fine
clay
1993/94 49,683 125,960 - 16,287 1,012 - - - - 176,800 105,400
1994/95 49,922 138,876 - 13,163 5,947 - - - - 193,100 79,500
1995/96 54,281 155,550 - 1,338 6,384 - - - - 198,667 55,065
1996/97 60,795 151,229 - - - - - - - 501,495 114,778
1997/98 65,274 160,122 - - - - - - 25,703 479,820 166,100
1998/99 66,648 159,088 - - - - - - 45,293 404,917 180,634
1999/00 67,363 154,043 - - - - - - 46,162 462,806 201,436
2000/01 64,958 122,632 - - - 1,307 5,921 - 53,148 437,694 203,753
2001/02 66,661 112,283 - - - 3,702 16,805 28,123 56,757 600,931 202,370
2002/03 66,809 107,544 - - - 10,841 28,329 50,984 68,198 420,293 248,692
2003/04 66,343 104,188 - - - 4,645 11,239 19,978 69,552 439,906 251,392
2004/05 67,152 123,308 - - - - - - 75,683 346,522 189,237
2005/06 67,737 203,352 - - - - - - 69,876 416,294 149,218
2006/07 65,613 224,927 1,033 - - 48,636 22,263 - 76,187 235,266 170,727
2007/08 66,033 181,100 1,468 - - 140,853 72,166 13,503 75,384 395,717 151,669
2008/09 68,252 248,918 2,133 - - 102,123 80,317 - 73,893 313,145 90,553
2009/10 68,750 241,965 2,357 - - 90,671 117,314 27,904 66,507 315,509 92,862
2010/11 66,733 186,146 4,859 - - 188,663 209,919 82,075 74,806 289,528 31,683
2011/12 69,124 211,201 5,007 - - 187,538 261,744 42,814 95,310 630,258 80,202
2012/13 59,854 225,776 4,558 - - 86,243 140,842 67,067 61,578 499,681 204,164
2013/14 58,001 225,168 5,336 - - 128,064 243,355 563,371 44,254 454,526 167,333
Change
year-on-
year (%)
-3.10 -0.27 17.06 - - 48.49 72.79 740.01 -28.13 -9.04 -18.04
Source: DEDJTR, Statutory returns under the MRSDA. *Gold reported in ounces, brown coal in million tonnes, gypsum in cubic meters, and the remainder in tonnes.
Table 3.9 Mineral production sales values (A$ million) 2013/14
Mineral 2012/13 2013/14 Change year-on-year (%)
Brown Coal* n/a n/a n/a
Gold 333.1 303.4 -8.9
Antimony 30.8 12.5 -59.3
Heavy Mineral Sands 282.7 316.5 12.0
Industrial Minerals 12.8 14.1 9.8
Others 0.3 0.2 -47.6
Total (excl. brown coal) 659.7 646.6 -2.0
Source: DEDJTR, Statutory returns under the MRSDA. *No unit value is assigned to brown coal for the purposes of determining its production value. Brown coal is almost entirely used for electricity production and is largely an internal transfer within mining/generation entities. As such, there is no available market price for brown coal.
2013/14 STATISTICAL REPORT
16
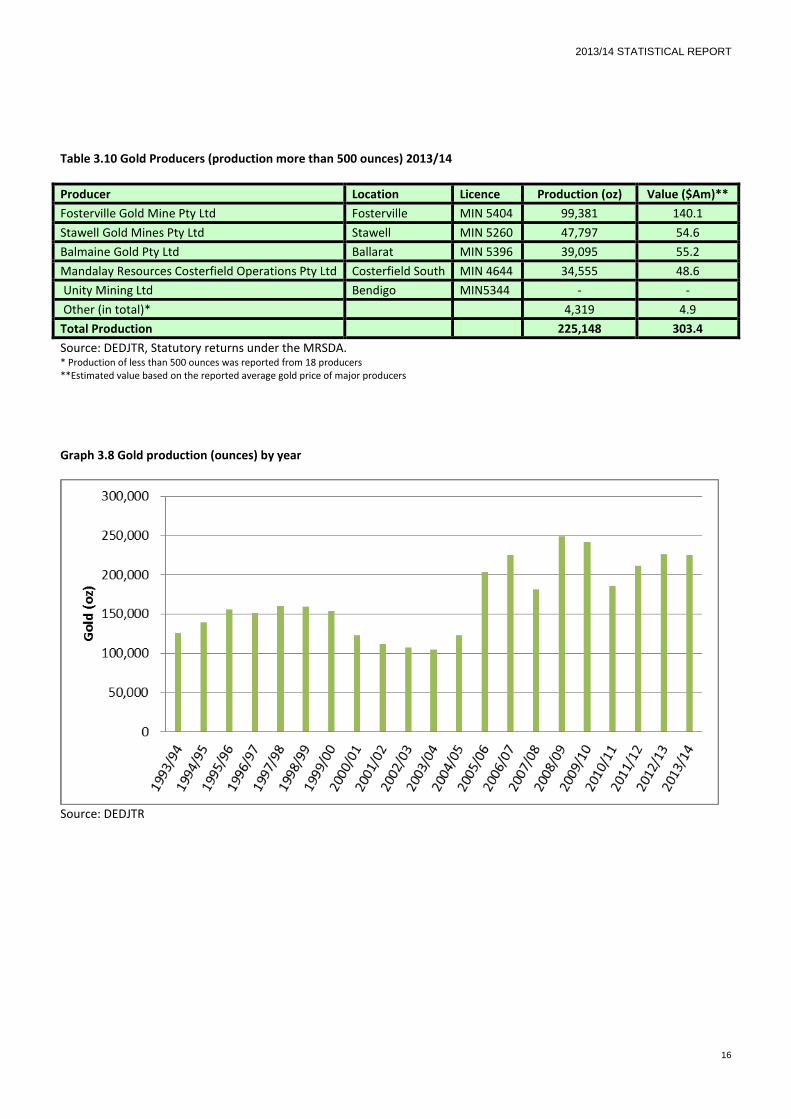
Table 3.10 Gold Producers (production more than 500 ounces) 2013/14
Producer Location Licence Production (oz) Value ($Am)**
Fosterville Gold Mine Pty Ltd Fosterville MIN 5404 99,381 140.1
Stawell Gold Mines Pty Ltd Stawell MIN 5260 47,797 54.6
Balmaine Gold Pty Ltd Ballarat MIN 5396 39,095 55.2
Mandalay Resources Costerfield Operations Pty Ltd Costerfield South MIN 4644 34,555 48.6
Unity Mining Ltd Bendigo MIN5344 - -
Other (in total)* 4,319 4.9
Total Production 225,148 303.4
Source: DEDJTR, Statutory returns under the MRSDA. * Production of less than 500 ounces was reported from 18 producers **Estimated value based on the reported average gold price of major producers
Graph 3.8 Gold production (ounces) by year
Source: DEDJTR
2013/14 STATISTICAL REPORT
17
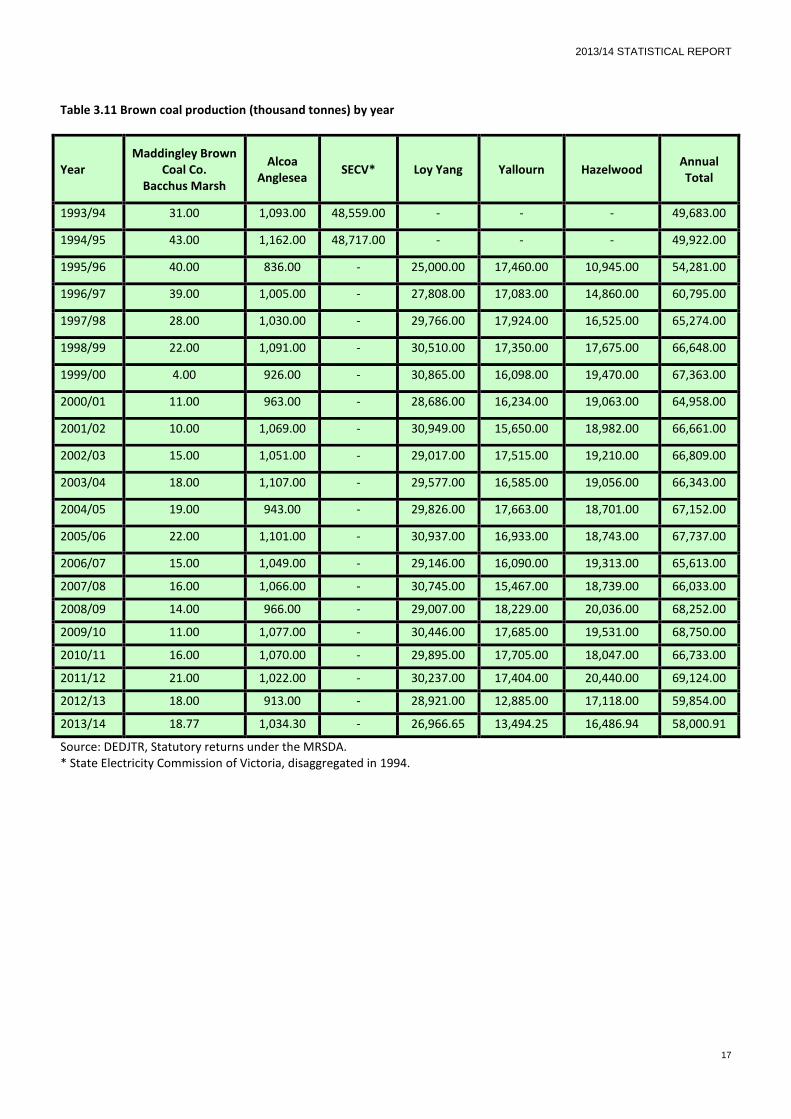
Table 3.11 Brown coal production (thousand tonnes) by year
Year Maddingley Brown
Coal Co. Bacchus Marsh
Alcoa Anglesea
SECV* Loy Yang Yallourn Hazelwood Annual Total
1993/94 31.00 1,093.00 48,559.00 - - - 49,683.00
1994/95 43.00 1,162.00 48,717.00 - - - 49,922.00
1995/96 40.00 836.00 - 25,000.00 17,460.00 10,945.00 54,281.00
1996/97 39.00 1,005.00 - 27,808.00 17,083.00 14,860.00 60,795.00
1997/98 28.00 1,030.00 - 29,766.00 17,924.00 16,525.00 65,274.00
1998/99 22.00 1,091.00 - 30,510.00 17,350.00 17,675.00 66,648.00
1999/00 4.00 926.00 - 30,865.00 16,098.00 19,470.00 67,363.00
2000/01 11.00 963.00 - 28,686.00 16,234.00 19,063.00 64,958.00
2001/02 10.00 1,069.00 - 30,949.00 15,650.00 18,982.00 66,661.00
2002/03 15.00 1,051.00 - 29,017.00 17,515.00 19,210.00 66,809.00
2003/04 18.00 1,107.00 - 29,577.00 16,585.00 19,056.00 66,343.00
2004/05 19.00 943.00 - 29,826.00 17,663.00 18,701.00 67,152.00
2005/06 22.00 1,101.00 - 30,937.00 16,933.00 18,743.00 67,737.00
2006/07 15.00 1,049.00 - 29,146.00 16,090.00 19,313.00 65,613.00
2007/08 16.00 1,066.00 - 30,745.00 15,467.00 18,739.00 66,033.00
2008/09 14.00 966.00 - 29,007.00 18,229.00 20,036.00 68,252.00
2009/10 11.00 1,077.00 - 30,446.00 17,685.00 19,531.00 68,750.00
2010/11 16.00 1,070.00 - 29,895.00 17,705.00 18,047.00 66,733.00
2011/12 21.00 1,022.00 - 30,237.00 17,404.00 20,440.00 69,124.00
2012/13 18.00 913.00 - 28,921.00 12,885.00 17,118.00 59,854.00
2013/14 18.77 1,034.30 - 26,966.65 13,494.25 16,486.94 58,000.91
Source: DEDJTR, Statutory returns under the MRSDA. * State Electricity Commission of Victoria, disaggregated in 1994.

2013/14 STATISTICAL REPORT
18
4. Extractive Industry Extractive industries provide the raw materials for building and construction, which are vital to the State’s development. The industry operates quarries that produce a range of “stone” products, predominantly being hard rock, clay, sand and gravel. As at 30 June 2014, 881 quarries were operating under the MRSDA in Victoria. The total number of quarries has been relatively stable over the last decade. Table 4.1 Status of extractive industry work authorities* as at 30 June 2014
Tenement Proposal** Application*** Current
Work Authority 120 15 881
Source: DEDJTR *A Work Authority is granted under the MRSDA. ** Work Authority is in proposal stage when an initial site meeting takes place attended by the Inspector and other relevant parties. ** *Application stage is when a Work Authority application is lodged with all requirements to obtain an approved Work Plan.
Graph 4.1 Extractive industry quarries and sales
Source: DEDJTR Sales of quarry products fluctuate from year to year, reflecting domestic demand changes from the building and construction sector. The fall in demand in 2013/14 is explained by the continued slowing of activity related to major infrastructure projects, as was the case in 2012/3. A total of 485 quarries reported production in 2013/14, with total sales volume being 40.33 million tonnes. In 2012/13, the number of producing quarries stood at 535, with volume output of 47.44 million. Volume sales of extractive industry (quarry) products in 2013/14 fell by around 7.1 million tonnes, or 17% on a y-o-y basis, which is broadly in line with the previous year’s trend (an 18% y-o-y drop). Value drop was less pronounced, at 9% y-o-y to $676.55 million.
2013/14 STATISTICAL REPORT
19
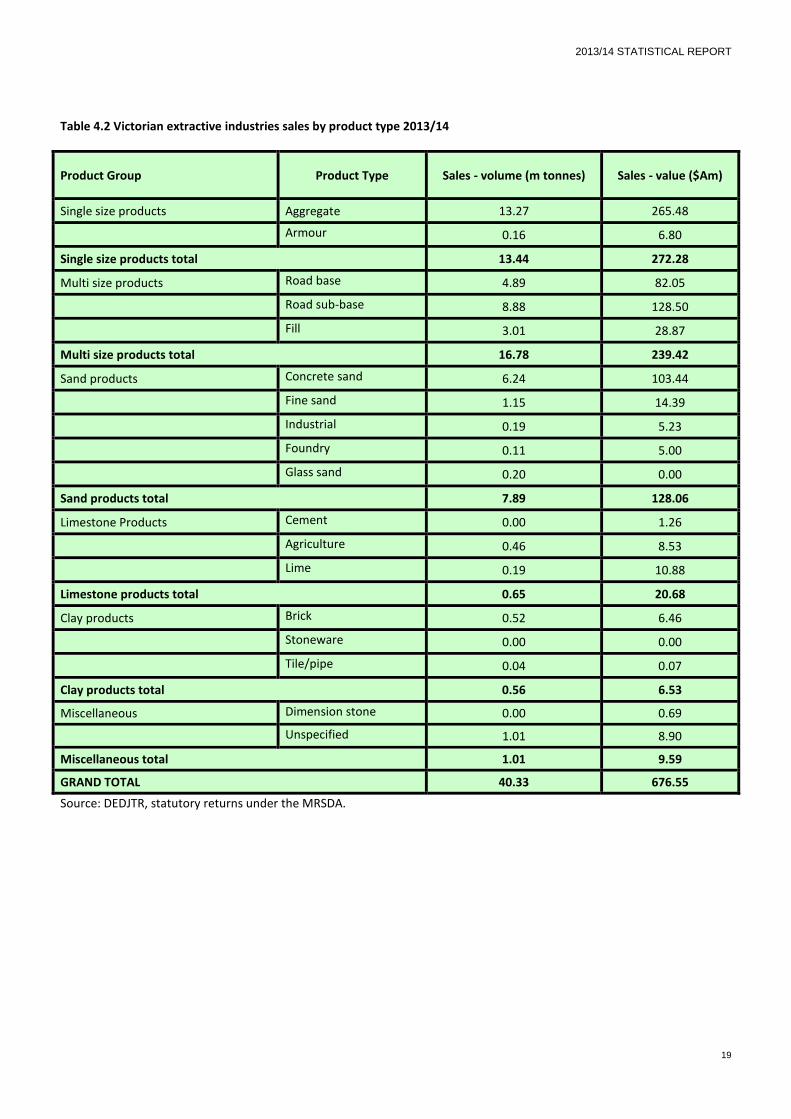
Table 4.2 Victorian extractive industries sales by product type 2013/14
Product Group Product Type Sales - volume (m tonnes) Sales - value ($Am)
Single size products Aggregate 13.27 265.48
Armour 0.16 6.80
Single size products total 13.44 272.28
Multi size products Road base 4.89 82.05
Road sub-base 8.88 128.50
Fill 3.01 28.87
Multi size products total 16.78 239.42
Sand products Concrete sand 6.24 103.44
Fine sand 1.15 14.39
Industrial 0.19 5.23
Foundry 0.11 5.00
Glass sand 0.20 0.00
Sand products total 7.89 128.06
Limestone Products Cement 0.00 1.26
Agriculture 0.46 8.53
Lime 0.19 10.88
Limestone products total 0.65 20.68
Clay products Brick 0.52 6.46
Stoneware 0.00 0.00
Tile/pipe 0.04 0.07
Clay products total 0.56 6.53
Miscellaneous Dimension stone 0.00 0.69
Unspecified 1.01 8.90
Miscellaneous total 1.01 9.59
GRAND TOTAL 40.33 676.55
Source: DEDJTR, statutory returns under the MRSDA.
2013/14 STATISTICAL REPORT
20
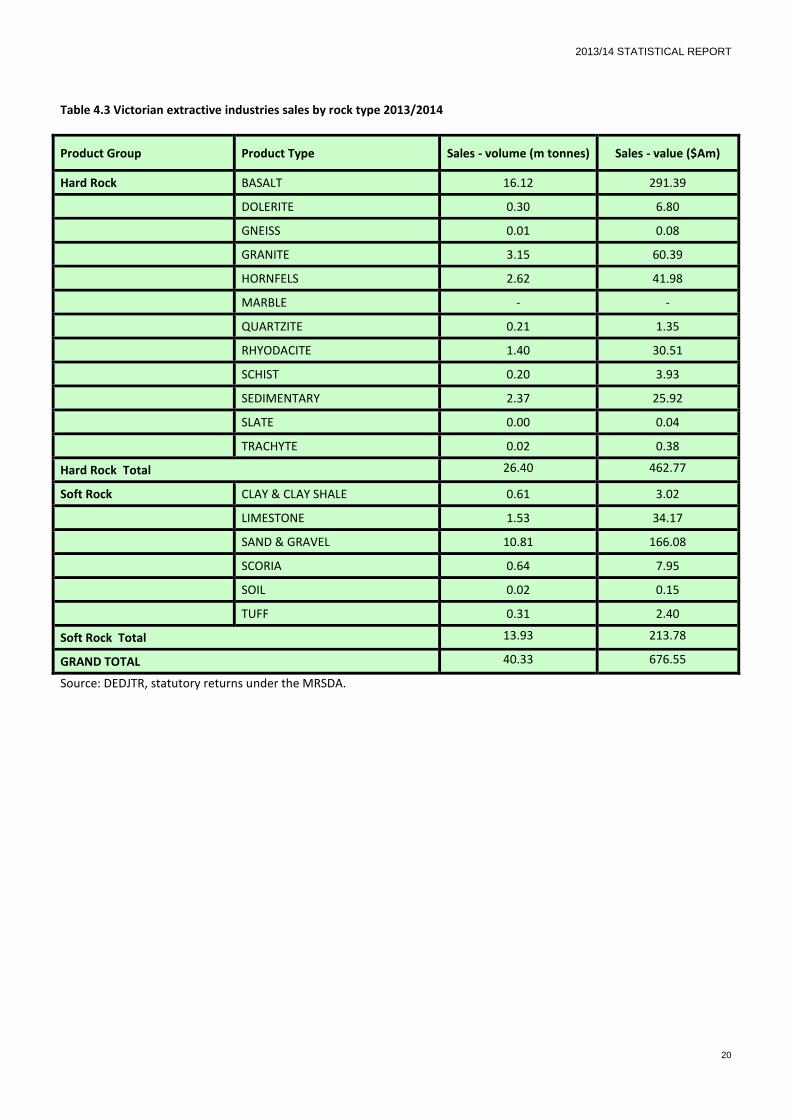
Table 4.3 Victorian extractive industries sales by rock type 2013/2014
Product Group Product Type Sales - volume (m tonnes) Sales - value ($Am)
Hard Rock BASALT 16.12 291.39
DOLERITE 0.30 6.80
GNEISS 0.01 0.08
GRANITE 3.15 60.39
HORNFELS 2.62 41.98
MARBLE - -
QUARTZITE 0.21 1.35
RHYODACITE 1.40 30.51
SCHIST 0.20 3.93
SEDIMENTARY 2.37 25.92
SLATE 0.00 0.04
TRACHYTE 0.02 0.38
Hard Rock Total 26.40 462.77
Soft Rock CLAY & CLAY SHALE 0.61 3.02
LIMESTONE 1.53 34.17
SAND & GRAVEL 10.81 166.08
SCORIA 0.64 7.95
SOIL 0.02 0.15
TUFF 0.31 2.40
Soft Rock Total 13.93 213.78
GRAND TOTAL 40.33 676.55
Source: DEDJTR, statutory returns under the MRSDA.
2013/14 STATISTICAL REPORT
21
5. Revenue and Bonds
5.1. Revenue
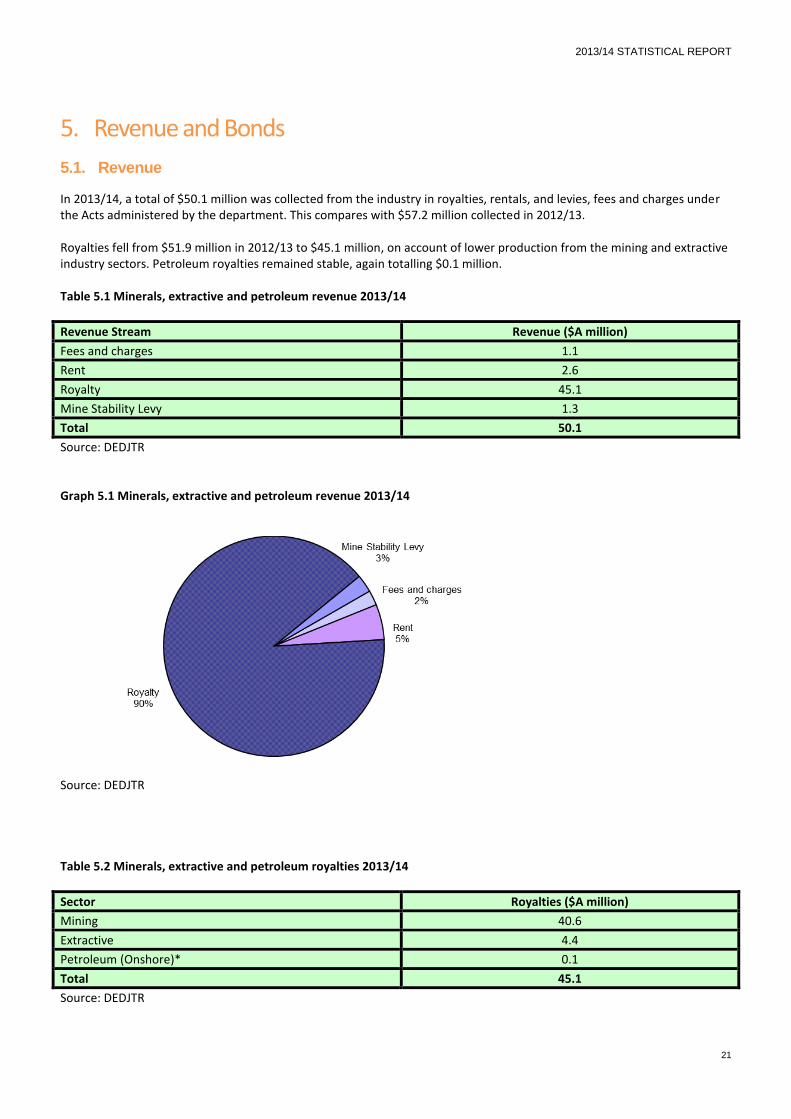
In 2013/14, a total of $50.1 million was collected from the industry in royalties, rentals, and levies, fees and charges under the Acts administered by the department. This compares with $57.2 million collected in 2012/13. Royalties fell from $51.9 million in 2012/13 to $45.1 million, on account of lower production from the mining and extractive industry sectors. Petroleum royalties remained stable, again totalling $0.1 million. Table 5.1 Minerals, extractive and petroleum revenue 2013/14
Revenue Stream Revenue ($A million)
Fees and charges 1.1
Rent 2.6
Royalty 45.1
Mine Stability Levy 1.3
Total 50.1
Source: DEDJTR Graph 5.1 Minerals, extractive and petroleum revenue 2013/14
Source: DEDJTR Table 5.2 Minerals, extractive and petroleum royalties 2013/14
Sector Royalties ($A million)
Mining 40.6
Extractive 4.4
Petroleum (Onshore)* 0.1
Total 45.1
Source: DEDJTR

2013/14 STATISTICAL REPORT
22
Table 5.2 Minerals, extractive and petroleum royalties 2013/14
Source: DEDJTR
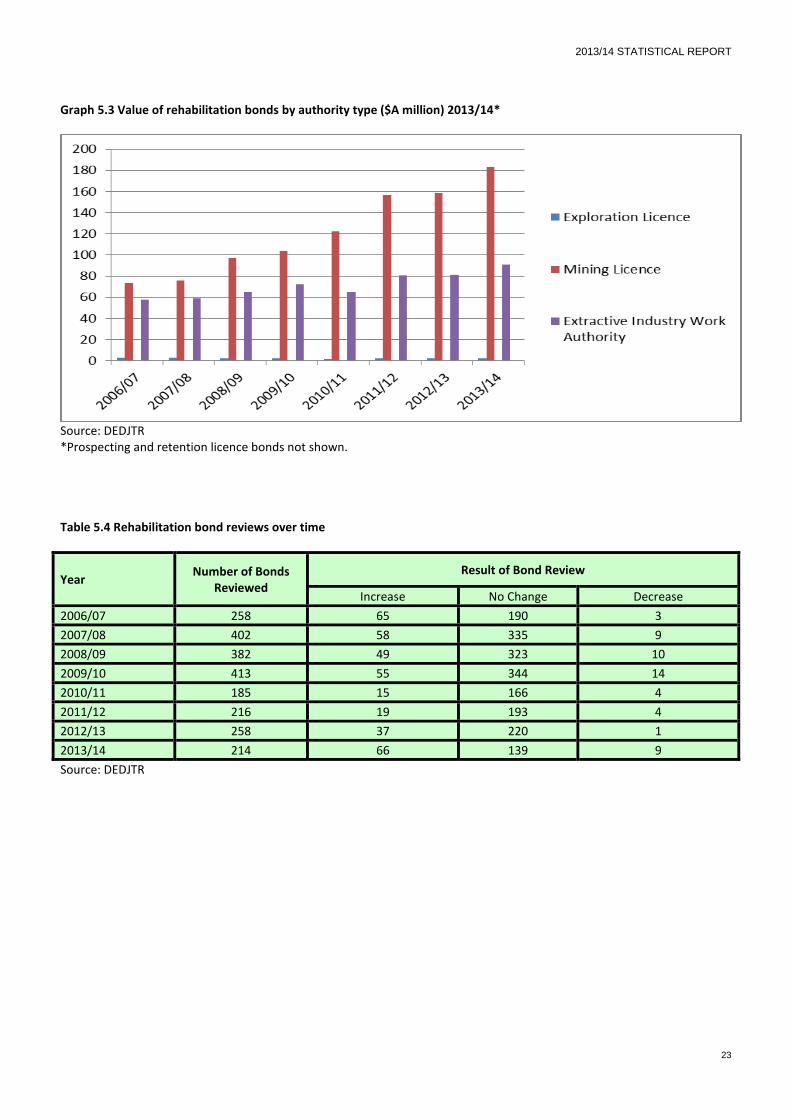
5.2. Rehabilitation Bonds
The sum of rehabilitation bonds held by the Department in 2013/14 was $276.5 million. A reduction in the value of exploration licence bonds between 2012/13 and 2013/14 reflect the reduction in the number of exploration licences from 311 to 271 in the same period and also the return of bonds following the rehabilitation of the site, without necessarily the licence being cancelled or expired or surrendered. In contrast, the value of rehabilitation bonds held against mining licences and work authorities increased, reflecting the recalculation of the rehabilitation liability that exists on those sites, despite the reduction in the number of mining licences from 212 to 191. Table 5.3 Value of rehabilitation bonds by authority type ($A million) 2013/14
Year Exploration Licence
Mining Licence Prospecting Licence
Retention Licence
Extractive Industry Work Authority
Total
2006/07 2.8 73.7 n/a n/a 57.5 134.0
2007/08 3.1 75.6 n/a n/a 58.8 137.5
2008/09 2.0 97.1 n/a n/a 64.9 164.0
2009/10 2.3 103.7 n/a n/a 72.3 178.3
2010/11 1.9 122.1 n/a n/a 65.0 189.0
2011/12 2.5 156.9 0 n/a 80.9 240.3
2012/13 2.4 158.3 0.025 n/a 81.0 241.7
2013/14 2.1 183.4 0.091 0.010 90.9 276.5
Source: DEDJTR
2013/14 STATISTICAL REPORT
23
Graph 5.3 Value of rehabilitation bonds by authority type ($A million) 2013/14*
Source: DEDJTR *Prospecting and retention licence bonds not shown.
Table 5.4 Rehabilitation bond reviews over time
Year Number of Bonds
Reviewed
Result of Bond Review
Increase No Change Decrease
2006/07 258 65 190 3
2007/08 402 58 335 9
2008/09 382 49 323 10
2009/10 413 55 344 14
2010/11 185 15 166 4
2011/12 216 19 193 4
2012/13 258 37 220 1
2013/14 214 66 139 9
Source: DEDJTR
2013/14 STATISTICAL REPORT
24
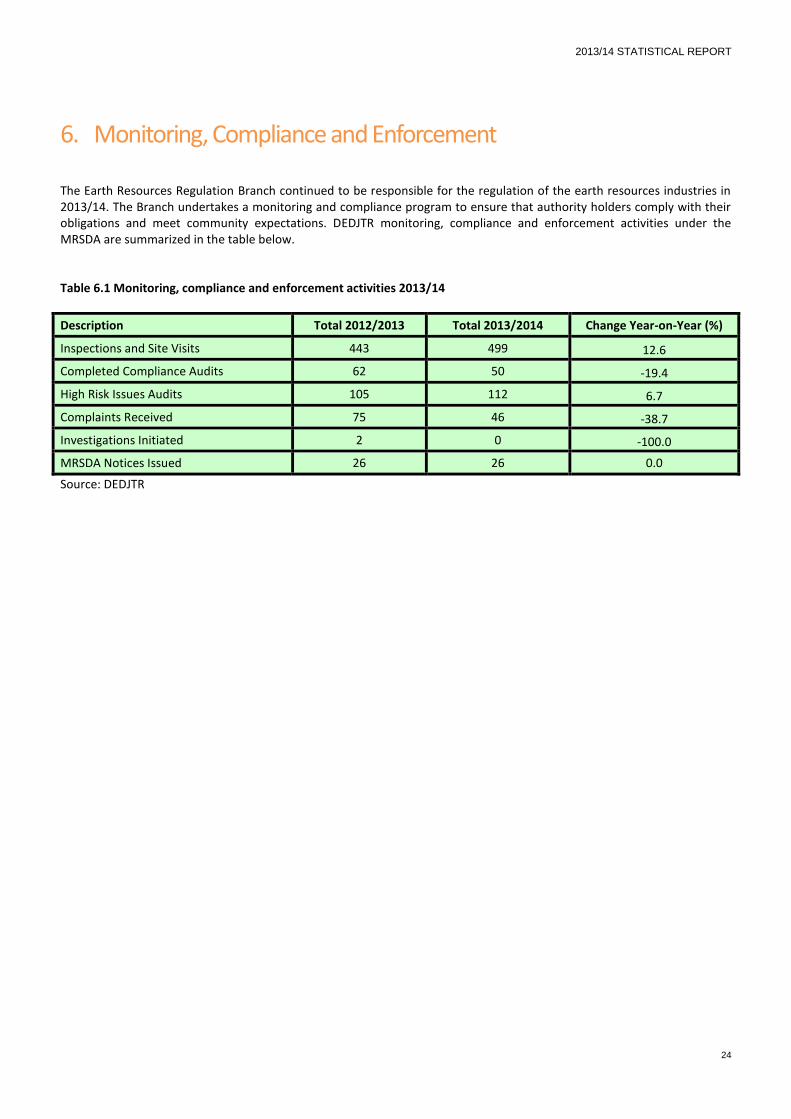
6. Monitoring, Compliance and Enforcement The Earth Resources Regulation Branch continued to be responsible for the regulation of the earth resources industries in 2013/14. The Branch undertakes a monitoring and compliance program to ensure that authority holders comply with their obligations and meet community expectations. DEDJTR monitoring, compliance and enforcement activities under the MRSDA are summarized in the table below. Table 6.1 Monitoring, compliance and enforcement activities 2013/14
Description Total 2012/2013 Total 2013/2014 Change Year-on-Year (%)
Inspections and Site Visits 443 499 12.6
Completed Compliance Audits 62 50 -19.4
High Risk Issues Audits 105 112 6.7
Complaints Received 75 46 -38.7
Investigations Initiated 2 0 -100.0
MRSDA Notices Issued 26 26 0.0
Source: DEDJTR