EARTH RESOURCE SATELLITES - wamis. · PDF fileThese are mainly used for communication and ......
27
EARTH RESOURCE SATELLITES Shefali Aggarwal Photogrammetry and Remote Sensing Division Indian Institute of Remote Sensing, Dehra Dun Abstract : Since the first balloon flight, the possibilities to view the earth’s surface from above had opened up new vistas of opportunities for mankind. The view from above has inspired a number of technological developments that offer a wide-range of techniques to observe the phenomena on the earth’s surface, under oceans, and underneath the surface of the earth. While the first imagery used for remote sensing came from balloons and later from airplanes, today the satellites or spacecraft are widely used for data collection. The uniqueness of satellite remote sensing lies in its ability to provide a synoptic view of the earth’s surface and to detect features at electromagnetic wavelengths, which are not visible to the human eye. Data from satellite images can show larger areas than aerial survey data and, as a satellite regularly passes over the same area capturing new data each time, changes in the land use /land cover can be periodically monitored. In order to use remotely sensed data, the user has to understand the characteristics of the system being used. The most important system characteristic the user has to understand is resolution. Resolution is measured in four ways, spatial, spectral, radiometric and temporal. The article describes the characteristics of satellite orbits and sensor systems, data capturing mechanisms and then highlights some of the commercially available satellites and future missions to be undertaken. INTRODUCTION R emote sensing is defined as the science which deals with obtaining information about objects on earth surface by analysis of data, received from a remote platform. Since the launch of the first remote sensing weather satellite (TIROS-1) in 1960 and the first Earth resources satellite in 1972 (Landsat-1), various platforms with a variety of remote sensing sensors have been launched to study the Earth land cover, the oceans, the atmosphere or to monitor the weather. Satellite Remote Sensing and GIS Applications in Agricultural Meteorology pp. 39-65
-
Upload
nguyennhan -
Category
Documents
-
view
217 -
download
2
Transcript of EARTH RESOURCE SATELLITES - wamis. · PDF fileThese are mainly used for communication and ......

EARTH RESOURCE SATELLITES
Shefali AggarwalPhotogrammetry and Remote Sensing DivisionIndian Institute of Remote Sensing, Dehra Dun
Abstract : Since the first balloon flight, the possibilities to view the earth’s surfacefrom above had opened up new vistas of opportunities for mankind. The view fromabove has inspired a number of technological developments that offer a wide-rangeof techniques to observe the phenomena on the earth’s surface, under oceans, andunderneath the surface of the earth. While the first imagery used for remote sensingcame from balloons and later from airplanes, today the satellites or spacecraft arewidely used for data collection. The uniqueness of satellite remote sensing lies inits ability to provide a synoptic view of the earth’s surface and to detect features atelectromagnetic wavelengths, which are not visible to the human eye. Data fromsatellite images can show larger areas than aerial survey data and, as a satelliteregularly passes over the same area capturing new data each time, changes in theland use /land cover can be periodically monitored.
In order to use remotely sensed data, the user has to understand the characteristicsof the system being used. The most important system characteristic the user has tounderstand is resolution. Resolution is measured in four ways, spatial, spectral,radiometric and temporal. The article describes the characteristics of satellite orbitsand sensor systems, data capturing mechanisms and then highlights some of the
commercially available satellites and future missions to be undertaken.
INTRODUCTION
Remote sensing is defined as the science which deals with obtaininginformation about objects on earth surface by analysis of data, received
from a remote platform. Since the launch of the first remote sensing weathersatellite (TIROS-1) in 1960 and the first Earth resources satellite in 1972(Landsat-1), various platforms with a variety of remote sensing sensors havebeen launched to study the Earth land cover, the oceans, the atmosphere orto monitor the weather.
Satellite Remote Sensing and GIS Applications in Agricultural Meteorologypp. 39-65

40 Earth Resource Satellites
In the present context, information flows from an object to a receiver(sensor) in the form of radiation transmitted through the atmosphere. Theinteraction between the radiation and the object of interest conveys informationrequired on the nature of the object. In order for a sensor to collect and recordenergy reflected or emitted from a target or surface, it must reside on a stableplatform away from the target or surface being observed. Important propertiesof sensor system are the number of spectral bands, the spectral position ofthese bands, the spatial resolution or pixel size and the orbit of the satellite.
Two satellite orbits are important for remote sensing observation of theEarth: the geo-stationary orbit and the polar orbit. The geo-stationary orbitis such a position for a satellite that it keeps pace with the rotation of theEarth. These platforms are covering the same place and give continuous nearhemispheric coverage over the same area day and night. These satellites areput in equatorial plane orbiting from west to east. Its coverage is limited to70oN to 70oS latitudes and one satellite can view one-third globe (Figure 1).As a result it is continuously located above the same geographical position.
These are mainly used for communication and meteorological applications.Weather satellites such as Meteosat, MSG and GOES are normally positionedin this orbit. It enables the sensor aboard the satellite to take every 30 minutesa picture of the weather conditions over the same locations. This geo-stationaryorbit is located at an altitude of 36,000 km above the equator.
The following are the major geo-stationary satellites:
Satellite program Current Satellite Country Operational AgencyLaunch Agency
METEOSAT METEOSAT-7 International EUMETSAT ESA
INDOEX METEOSAT-5 International EUMETSAT ESA
GOMS GOMS-1 Russia(ELEKTRO)
INSAT INSAT Series India
Feng-Yun* Feng-Yun-2B China
GMS GMS-5 Japan
GOES (WEST) GOES-10 U.S.A. NOAA NASA
GOES (EAST) GOES-8 U.S.A. NOAA NASA
* Failed mission

Shefali Aggarwal 41
The second important remote sensing orbit is the polar orbit. Satellitesin a polar orbit, cycle the Earth from North Pole to South Pole. The polarorbits have an inclination of approximately 99 degrees with the equator tomaintain a sun synchronous overpass i.e. the satellite passes over all places onearth having the same latitude twice in each orbit at the same local sun-time.This ensures similar illumination conditions when acquiring images over aparticular area over a series of days (Figure 2). Image acquisition mostly takesplace in the morning when the sun position is optimal between 9.30 and11.00 hr local time. The altitude of the polar orbits varies from approximately650 to 900 km although spy-satellites are in a much lower orbit.
Figure 2. Near Polar Orbits (source CCRS website)
Figure 1. Geo-stationary Orbit (source CCRS website)
As the satellite orbits the Earth from pole to pole, its east-west positionwould not change if the Earth did not rotate. However, as seen from theEarth, it seems that the satellite is shifting westward because the Earth isrotating (from west to east) beneath it. This apparent movement allows the
Satellite Ground Track
EquatorEarth’s Rotation
Satellite Direction

42 Earth Resource Satellites
satellite swath to cover a new area with each pass (Figure 3). The satellite’sorbit and the rotation of the Earth work together to allow complete coverageof the Earth’s surface, after it has completed one complete cycle of orbits (Figure4). Through these satellites the entire globe is covered on regular basis andgives repetitive coverage on periodic basis. All the remote sensing earth resourcesatellites may be grouped in this category. Few of these satellites are LANDSATseries, SPOT series, IRS series, NOAA, SEASAT, TIROS, HCMM, SKYLAB,SPACE SHUTTLE etc.
Figure 3. Area Coverage on each Consecutive pass (source: CCRS website)
Figure 4. Complete Coverage of Earth Surface by Sun Synchronous Satellites

Shefali Aggarwal 43
REMOTE SENSING SENSORS
Sensor is a device that gathers energy (EMR or other), converts it into asignal and presents it in a form suitable for obtaining information about thetarget under investigation. These may be active or passive depending on thesource of energy.
Sensors used for remote sensing can be broadly classified as those operatingin Optical-Infrared (OIR) region and those operating in the microwave region.OIR and microwave sensors can further be subdivided into passive and active.
Active sensors use their own source of energy. Earth surface is illuminatedthrough energy emitted by its own source, a part of it is reflected by the surfacein the direction of the sensor, which is received to gather the information.Passive sensors receive solar electromagnetic energy reflected from the surfaceor energy emitted by the surface itself. These sensors do not have their ownsource of energy and can not be used at nighttime, except thermal sensors.Again, sensors (active or passive) could either be imaging, like camera or sensor,which acquire images of the area and non-imaging types like non-scanningradiometer or atmospheric sounders.
Resolution
Resolution is defined as the ability of the system to render the informationat the smallest discretely separable quantity in terms of distance (spatial),wavelength band of EMR (spectral), time (temporal) and/or radiation quantity(radiometric).
Spatial Resolution
Spatial resolution is the projection of a detector element or a slit onto theground. In other words, scanner’s spatial resolution is the ground segmentsensed at any instant. It is also called ground resolution element (GRE).
The spatial resolution at which data are acquired has two effects – theability to identify various features and quantify their extent. The former onerelates to the classification accuracy and the later to the ability to accuratelymake mensuration. Images where only large features are visible are said to havecoarse or low resolution. In fine resolution images, small objects can be detected.

44 Earth Resource Satellites
Spectral Resolution
Spectral emissivity curves characterize the reflectance and/or emittance ofa feature or target over a variety of wavelengths. Different classes of featuresand details in an image can be distinguished by comparing their responsesover distinct wavelength ranges. Broad classes such as water and vegetationcan be separated using broad wavelength ranges (VIS, NIR), whereas specificclasses like rock types would require a comparison of fine wavelength rangesto separate them. Hence spectral resolution describes the ability of the sensorto define fine wavelength intervals i.e. sampling the spatially segmented imagein different spectral intervals, thereby allowing the spectral irradiance of theimage to be determined.
Radiometric Resolution
This is a measure of the sensor to differentiate the smallest change in thespectral reflectance/emittance between various targets. The radiometricresolution depends on the saturation radiance and the number of quantisationlevels. Thus, a sensor whose saturation is set at 100% reflectance with an 8bit resolution will have a poor radiometric sensitivity compared to a sensorwhose saturation radiance is set at 20% reflectance and 7 bit digitization.
Temporal Resolution
Obtaining spatial and spectral data at certain time intervals. Temporalresolution is also called as the repetivity of the satellite; it is the capability ofthe satellite to image the exact same area at the same viewing angle at differentperiods of time. The temporal resolution of a sensor depends on a variety offactors, including the satellite/sensor capabilities, the swath overlap andlatitude.
Multispectral Scanning Principle
Cameras and their use for aerial photography are the simplest and oldestof sensors used for remote sensing of the Earth’s surface. Cameras are framingsystems (Figure 5a), which acquire a near-instantaneous “snapshot” of an areaof the Earth’s surface. Camera systems are passive optical sensors that use alens (or system of lenses collectively referred to as the optics) to form an imageat the focal plane, the “aerial image plane” at which an image is sharplydefined.

Shefali Aggarwal 45
Many electronic (as opposed to photographic) remote sensors acquire datausing scanning systems, which employ a sensor with a narrow field of viewthat sweeps over the terrain to build up and produce a two-dimensional imageof the surface. Scanning systems can be used on both aircraft and satelliteplatforms and have essentially the same operating principles. A scanning systemused to collect data over a variety of different wavelength ranges is called amultispectral scanner (MSS), and is the most commonly used scanning system.There are two main modes or methods of scanning employed to acquiremultispectral image data - across-track scanning, and along-track scanning.
Across-track scanners scan the Earth in a series of lines (Figure 5b). Thelines are oriented perpendicular to the direction of motion of the sensorplatform (i.e. across the swath). Each line is scanned from one side of the sensorto the other, using a rotating mirror. As the platform moves forward over theEarth, successive scans build up a two-dimensional image of the Earth’s surface.So, the Earth is scanned point by point and line after line. These systems arereferred to as whiskbroom scanners. The incoming reflected or emitted radiationis separated into several spectral components that are detected independently.A bank of internal detectors, each sensitive to a specific range of wavelengths,detects and measures the energy for each spectral band and then, as anelectrical signal, they are converted to digital data and recorded for subsequentcomputer processing.
Figure 5. Principle of imaging sensor systems; (a) framing system, (b) whiskbroom scanner,(c) pushbroom scanner. (source :http://cgi.girs.wageningen-ur.nl/igi-new)
46 Earth Resource Satellites
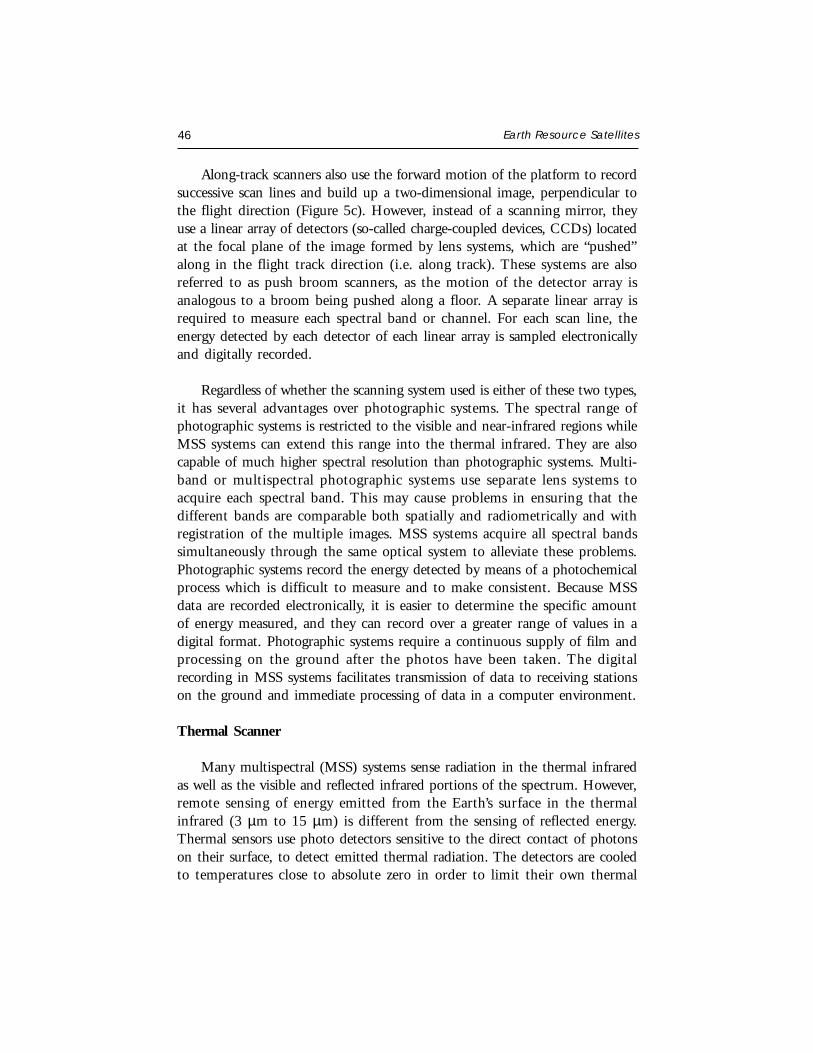
Along-track scanners also use the forward motion of the platform to recordsuccessive scan lines and build up a two-dimensional image, perpendicular tothe flight direction (Figure 5c). However, instead of a scanning mirror, theyuse a linear array of detectors (so-called charge-coupled devices, CCDs) locatedat the focal plane of the image formed by lens systems, which are “pushed”along in the flight track direction (i.e. along track). These systems are alsoreferred to as push broom scanners, as the motion of the detector array isanalogous to a broom being pushed along a floor. A separate linear array isrequired to measure each spectral band or channel. For each scan line, theenergy detected by each detector of each linear array is sampled electronicallyand digitally recorded.
Regardless of whether the scanning system used is either of these two types,it has several advantages over photographic systems. The spectral range ofphotographic systems is restricted to the visible and near-infrared regions whileMSS systems can extend this range into the thermal infrared. They are alsocapable of much higher spectral resolution than photographic systems. Multi-band or multispectral photographic systems use separate lens systems toacquire each spectral band. This may cause problems in ensuring that thedifferent bands are comparable both spatially and radiometrically and withregistration of the multiple images. MSS systems acquire all spectral bandssimultaneously through the same optical system to alleviate these problems.Photographic systems record the energy detected by means of a photochemicalprocess which is difficult to measure and to make consistent. Because MSSdata are recorded electronically, it is easier to determine the specific amountof energy measured, and they can record over a greater range of values in adigital format. Photographic systems require a continuous supply of film andprocessing on the ground after the photos have been taken. The digitalrecording in MSS systems facilitates transmission of data to receiving stationson the ground and immediate processing of data in a computer environment.
Thermal Scanner
Many multispectral (MSS) systems sense radiation in the thermal infraredas well as the visible and reflected infrared portions of the spectrum. However,remote sensing of energy emitted from the Earth’s surface in the thermalinfrared (3 µm to 15 µm) is different from the sensing of reflected energy.Thermal sensors use photo detectors sensitive to the direct contact of photonson their surface, to detect emitted thermal radiation. The detectors are cooledto temperatures close to absolute zero in order to limit their own thermal

Shefali Aggarwal 47
emissions. Thermal sensors essentially measure the surface temperature andthermal properties of targets.
Thermal Imagers are typically across-track scanners that detect emittedradiation in only the thermal portion of the spectrum. Thermal sensors employone or more internal temperature references for comparison with the detectedradiation, so they can be related to absolute radiant temperature. The dataare generally recorded on film and/or magnetic tape and the temperatureresolution of current sensors can reach 0.1 °C. For analysis, an image of relativeradiant temperatures is depicted in grey levels, with warmer temperaturesshown in light tones, and cooler temperatures in dark tones.
Table 1. Thermal Sensors
HCMM TM
Operational period 1978-1980 1982 to present
Orbital altitude 620 mm 705 km
Image coverage 700 by 700 km 185 by 170 km
Acquisition time, day 1:30 p.m. 10:30 a.m.
Acquisition time, night 2:30 a.m. 9:30 p.m.
Visible and reflected IR detectors
Number of bands 1 6
Spectral range 0.5 0 - 1.1 µm 0.4 - 2.35 µm
Ground resolution cell 500 by 500 m 30 by 30 m
Thermal IR detector
Spectral range 10.5 - 12.5 µm 10.5 - 12.5 µm
Ground resolution cell 600 by 600 m 120 by 120m60 m by 60 m in Landsat 7
Microwave Sensing (RADAR)
Microwave data can be obtained by both active and passive systems. Passivesystem monitor natural radiation at a particular frequency or range offrequency. Data may be presented numerically as line trace data or as imagery.Active systems (like SLAR and SAR) transmit their own energy and monitorthe returned signal.

48 Earth Resource Satellites
Characteristics of such radar imagery both in SAR and SLAR and theirresolution depends on various parameters like frequency of the signal, lookdirection, slant range, dielectric constant of the objects, phase, antenna lengthetc. Spatial resolution in range and azimuth direction varies in differentmanners.
RADAR (SAR) imageries have been obtained from satellite SEASAT, ERSand space shuttle missions SIR-A, SIR-B and SIR-C using synthatic apertureradar, which have all weather capability. Such data products are useful forstudies in cloud-covered region of the earth and in oceanography.
Table 2. Microwave Sensors
Seasat SIR-C/X- ESA RADARSAT ENVISAT JERS-1SAR SAR SAR SAR ASAR
Frequency 1.275 GHz 5.3 GHz 5.3 5.33 GHz 5.33 GHz 1.2751.275 GHz GHz GHz
Wave L band X band 3 cm C band C band L Bandlength 23 cm C band 6 cm C band (23 cm)
L band 23 cm
Swath 100 km, 15 to 90 km 100 km 45-510 5 km – 75 kmWidth centered Depend on km 100 km
20o off orientation Varies Variesnadir is antenna
Ground 25 x 25 m 10 to 200 m 30 m 100x100 m 30 mResolution to 9x9 m Varies
Varies
LAND OBSERVATION SATELLITES
Today more than ten earth observation satellites provide imagery that canbe used in various applications (Table-3). The list also includes some failedas well as future missions. Agencies responsible for the distribution and tradingof data internationally are also listed.
Landsat Series of Satellites
NASA, with the co-operation of the U.S. Department of Interior, begana conceptual study of the feasibility of a series of Earth Resources TechnologySatellites (ERTS). ERTS-1 was launched in July 23, 1972, and it operated

Shefali Aggarwal 49
until January 6, 1978. It represented the first unmanned satellite specificallydesigned to acquire data about earth resources on a systematic, repetitive,medium resolution, multispectral basis. It was primarily designed as anexperimental system to test the feasibility of collecting earth resources datafrom unmanned satellites. About 300 individual ERTS-1 experiments wereconducted in 43 US states and 36 nations. Just prior to the launch of ERTS-B on January 22nd 1975, NASA officially renamed the ERTS programme asthe “LANDSAT” programme. All subsequent satellites in the series carriedthe Landsat designation. So far six Landsat satellites have been launchedsuccessfully, while Landsat-6 suffered launch failure. Table-4 highlights thecharacteristics of the Landsat series satellites. There have been four differenttypes of sensors included in various combinations on these missions. Theseare Return Beam Vidicon camera (RBV) systems, Multispectral Scanner (MSS)systems, Thematic Mapper (TM) and Enhanced Thematic Mapper (ETM).
After more than two decades of success, the Landsat program realised itsfirst unsuccessful mission with the launch failure of Landsat-6 on October 5,1993. The sensor included on-board was the Enhanced Thematic Mapper(ETM). To provide continuity with Landsat -4 and -5 the ETM incorporatedthe same seven spectral bands and the same spatial resolutions as the TM.The ETM’s major improvement over the TM was addition of an eighthpanchromatic band operating in 0.50 to 0.90-µm range and spatial resolutionof 15m. Landsat-7 includes two sensors: the Enhanced Thematic Mapper plus(ETM+) and the High Resolution Multispectral Stereo Imager (HRMSI).
Spot Series of Satellite
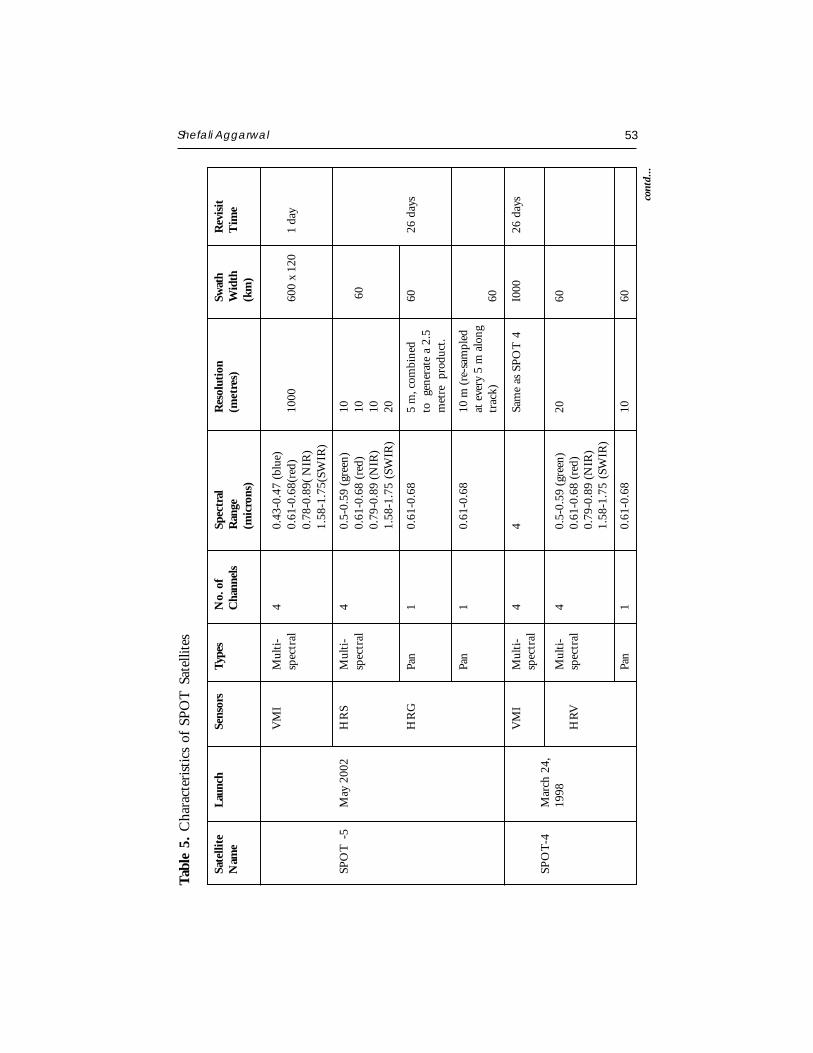
French Government in joint programme with Sweden and Belgiumundertook the development of Systeme Pour l’Observation de la Terre (SPOT)program. Conceived and designed by the French Center National d’EtudesSpatiales (CNES), SPOT has developed into a large-scale internationalprogramme with ground receiving stations and data distribution outlets locatedin more than 30 countries. It is also the first system to have pointable optics.This enables side-to-side off-nadir viewing capabilities, and it affords full scenestereoscopic imaging from two different satellite tracks permitting coverageof the same area. SPOT-1 was retired from full-time services on December31, 1990. The SPOT-2 satellite was launched on January 21, 1990, andSPOT-3 was launched on September 25, 1993. SPOT-4 was launched on26 March, 1998. Characteristics of SPOT Satellites are presented in Table 5.

50 Earth Resource Satellites
Tab
le 3
. O
pera
tion
al E
arth
Obs
erva
tion
Sat
ellit
es
EU
RO
PE
MID
DLE
N
OR
TH
AM
ER
ICA
ASI
AE
AST
Fran
ceE
SAIs
rael
U
SAC
anad
aIn
dia
Japa
n
SPO
T1-
1986
LAN
DSA
T5
10m
-85,
30m
SPO
T2-
90E
RS1
-92/
00LA
ND
SAT
6-10
m R
adar
93
SPO
T3-
93/9
6E
RS2
-95
EAR
LYB
IRD
IKO
NO
S1-
RA
DA
RSA
T-IR
S1C
-95
Rad
ar-9
899
, 1m
95 6
m
SPO
T4-
98E
NV
ISAT
-LA
ND
SAT
7-IK
ON
OS2
IRS1
D-9
710
m20
01R
adar
99, 1
5m-9
9, 1
m 6
m
ERO
S A
/Q
UIC
KB
IRD
-O
RBV
IEW
-1-
00 2
m01
, 0.6
m01
, 1m
SPO
T5-
02ER
OS
B/
OR
BV
IEW
RA
DA
RSA
TIR
S-P6
-03,
ALO
S-3m
+ H
RS1
01-
02, 1
m-0
2, 1
m-0
36M
MSS
03, 2
.5m
Dis
trib
utio
n
SPO
TM
iscel
lane
ous
Imag
esat
SI-E
OSA
T, E
arth
wat
ch,
RA
DA
RSA
TN
RSA
-JS
IIM
AG
ING
Orb
imag
e, U
SGS
EO
SAT

Shefali Aggarwal 51
Tabl
e 4.
Cha
ract
eris
tics
of L
ands
at-1
to -7
Mis
sion
s
Sens
or-
Spec
tral
reso
lutio
nSp
atia
lSc
an-w
idth
Tim
eO
rbita
lO
pera
tion
peri
odsy
stem
(µm
)re
solu
tion
(km
)in
terv
al a
ltitu
de(m
)E
quat
or
MSS
Ban
d 4:
0.5
- 0.
679
×79
185
18 d
ays
918
kmLa
ndsa
t 1
Ban
d 5:
0.6
- 0.
779
×79
23/0
7/19
72-0
6/01
/197
8
Ban
d 6:
0.7
- 0.
879
×79
Land
sat 2
22/0
1/19
75 -
25/0
2/19
82B
and
7: 0
.8 -
1.1
79×7
9La
ndsa
t 305
/03/
1978
- 3
0/11
/198
2
MSS
As L
ands
at 3
Ban
d 1:
0.45
- 0.
5230
×30
Land
sat 4
Ban
d 2:
0.5
2 -
0.60
30×3
016
/07/
1982
- 0
2/19
83
Ban
d 3:
0.63
- 0
.69
30×3
018
516
day
s71
0 km
Land
sat 5
TM
Ban
d 4:
0.76
- 0
.90
30×3
001
/03/
1984
-
Ban
d 5:
1.55
-1.
7530
×30
Ban
d 6:
10.4
0-12
.50
120×
120
Ban
d 7:
2.08
- 2
.35
30×3
0
TM
As L
ands
at 4
-5 3
0x30
185
16 d
ays
705
km
Land
sat 7
Ban
d 6:
10.4
0 -
12.5
060
×60
15/0
4/19
99 -
Panc
hrom
atic
: 0.5
0 - 0
.90
15×1
5
52 Earth Resource Satellites
SPOT-4 includes the additional 20m-resolution band in the mid-infraredportion of the spectrum (between 1.58 and 1.75 µm). This band is intendedto improve vegetation monitoring and mineral discriminating capabilities ofthe data. Furthermore, mixed 20m and 10m data sets will be co-registeredon-board instead of during ground processing. This will be accomplished byreplacing the panchromatic band of SPOT-1, -2 and -3 (0.49 to 0.73 µm)with red band from these systems (0.61 to 0.68 µm). This band will be usedto produce both 10m black and white images and 20m multispectral data.Another change in SPOT-4 is the addition of a separate wide-field-of-view,sensor called the Vegetation Monitoring Instrument (VMI).
IRS Satellite Series
The Indian Space programme has the goal of harnessing space technologyfor application in the areas of communications, broadcasting, meteorology andremote sensing. The important milestones crossed so far are Bhaskara-1 and2 (1979) the experimental satellites, which carried TV Cameras and MicrowaveRadiometers. The Indian Remote Sensing (IRS) Satellite was the next logicalstep towards the National operational satellites, which directly generatesresources information in a variety of application areas such as forestry, geology,agriculture and hydrology. IRS -1A/1B, carried Linear Imaging Self Scanningsensors LISS-I & LISS-II (Table 6). IRS-P2 was launched in October 1994on PSLV-D2, an indigenous launch vehicle. IRS-1C, was launched onDecember 28, 1995, which carried improved sensors like LISS-III, WiFS, PANCamera, etc. Details of IRS series platforms are given in the following section.IRS-P3 was launched into the sun synchronous orbit by another indigenouslaunch vehicle PSLV - D3 on 21.3.1996 from Indian launching stationSriharikota (SHAR). IRS-1D was launched on 29 September 1997 and IRS-P4 was launched on 26 – 5-1999 on-board PSLV from Sriharikota.
IRS-P4 carrying an Ocean Colour Monitor (OCM) and a Multi-frequencyScanning Microwave Radiometer (MSMR) was launched on May 26, 1999.OCM has 8 narrow spectral bands operating in visible and near-infrared bands(402-885 nm) with a spatial resolution of 360 m and swath of 1420 km.IRS-P4 OCM thus provides highest spatial resolution compared to any othercontemporary satellites in the international arena during this time frame. TheMSMR with its all weather capability is configured to have measurements at4 frequencies (6.6, 10.6, 18 & 26 GHZ) with an overall swath of 1360 km.The spatial resolution is 120, 80, 40 and 40 km for the frequency bands of
Shefali Aggarwal 53
Tab
le 5
. C
hara
cter
isti
cs o
f SP
OT
Sat
ellit
es
Sate
llite
Laun
chSe
nsor
sTy
pes
No.
of
Spec
tral
Res
olut
ion
Swat
hR
evis
itN
ame
Cha
nnel
sR
ange
(met
res)
Wid
thT
ime
(mic
rons
)(k
m)
VM
IM
ulti
-4
0.43
-0.4
7 (b
lue)
spec
tral
0.61
-0.6
8(re
d)10
0060
0 x
120
1 da
y0.
78-0
.89(
NIR
)1.
58-1
.75(
SWIR
)
SPO
T -
5M
ay 2
002
HR
SM
ulti
-4
0.5-
0.59
(gr
een)
10sp
ectr
al0.
61-0
.68
(red
)10
60
0.79
-0.8
9 (N
IR)
101.
58-1
.75
(SW
IR)
20
HR
GPa
n1
0.61
-0.6
85
m, c
ombi
ned
6026
day
sto
ge
nera
te a
2.5
met
re p
rodu
ct.
Pan
10.
61-0
.68
10 m
(re
-sam
pled
at e
very
5 m
alo
ngtr
ack)
60
VM
IM
ulti
-4
4Sa
me
as S
POT
4I0
0026
day
ssp
ectr
alSP
OT
-4M
arch
24,
1998
Mul
ti-
40.
5-0.
59 (
gree
n)20
60H
RV
spec
tral
0.61
-0.6
8 (r
ed)
0.79
-0.8
9 (N
IR)
1.58
-1.7
5 (S
WIR
)
Pan
10.
61-0
.68
1060
cont
d...

54 Earth Resource Satellites
SPO
T-
1990
&H
RV
Mul
ti-
30.
5-0.
5920
6026
day
s2
& 3
Mar
ch 1
998
spec
tral
0.61
-0.6
80.
79-0
.89
Pan
10.
51-0
.73
1060
SPO
T-1
1986
HR
VM
ulti
-3
Sam
e as
SPO
T 2
20-d
o-
26 d
ays
spec
tral
Pan
1 -
do-
10 -
do-
Sate
llite
Laun
chSe
nsor
sTy
pes
No.
of
Spec
tral
Res
olut
ion
Swat
hR
evis
itN
ame
Cha
nnel
sR
ange
(met
res)
Wid
thT
ime
(mic
rons
)(k
m)

Shefali Aggarwal 55
Tab
le 6
. C
hara
cter
isti
cs o
f IR
S se
ries
Sat
ellit
es
Sate
llite
Laun
chSe
nsor
sTy
pes
No.
of
Spec
tral
Ran
geR
esol
utio
nSw
ath
Rev
isit
Nam
eB
ands
(mic
rons
)(m
etre
s)W
idth
Tim
e(k
m)
IRS-
P4
May
26,
OC
MM
ulti
-8
0.4
- 0.
885
360
m14
20 k
m(O
cean
sat)
1999
spec
tral
2 da
ys
MSM
RR
AD
AR
46.
6,10
.65,
18,
21
120,
80,
40
13
60 k
mG
Hz
and
40 k
ms
IRS-
1DSe
ptem
ber,
WiF
SM
ulti
spec
tral
20.
62-0
.68
(red
)18
977
45
day
1997
0.77
-0.8
6 (N
IR)
LIS
S-II
IM
ulti
spec
tral
30.
52-0
.59
(gre
en)
2314
224
-25
days
0.62
-0.6
8 (r
ed)
0.77
-0.8
6 (N
IR)
11.
55-1
.70
(SW
IR)
7014
8
PAN
PAN
1
670
IRS-
1C19
95W
iFS
Mul
tisp
ectr
al2
0.62
-0.6
8 (r
ed)
189
810
5 da
y
0.77
-0.8
6 (N
IR)
LIS
S-II
IM
ulti
spec
tral
30.
52-0
.59
(gre
en)
23.6
142
24-2
5 da
ys
0.62
-0.6
8 (r
ed)
0.77
-0.8
6 (N
IR)
11.
55-1
.70
(SW
IR)
70.8
148
PAN
PAN
1
5.8
70
cont
d...

56 Earth Resource Satellites
Sate
llite
Laun
chSe
nsor
sTy
pes
No.
of
Spec
tral
Ran
geR
esol
utio
nSw
ath
Rev
isit
Nam
eB
ands
(mic
rons
)(m
etre
s)W
idth
Tim
e(k
m)
IRS-
1B19
91L
ISS-
IM
ulti
spec
tral
445
0-52
072
.514
822
day
s
0.52
-0.5
9
0.62
-0.6
8
0.77
-0.8
6 (N
IR)
LIS
S-II
Mul
tisp
ectr
al4
(sam
e as
LIS
S I)
36.2
574
IRS-
1A19
88L
ISS-
IM
ulti
spec
tral
4Sa
me
as a
bove
72.5
148
LIS
S-II
Mul
tisp
ectr
al4
Sam
e as
abo
ve36
.25
74
22 d
ays

Shefali Aggarwal 57
6.6., 10.6, 18 and 21 GHz. MSMR will also be in a way a unique sensor asno other passive microwave radiometer is operational in the civilian domaintoday and will be useful for study of both physical oceanographic andmeteorological parameters.
FUTURE INDIAN SATELLITE MISSIONS
Encouraged by the successful operation of the present IRS missions, manymore missions have been planned for realization in the next few years. Thesemissions will have suitable sensors for applications in cartography, crop andvegetation monitoring, oceanography and atmospheric studies.
CARTOSAT-1:
It will have a cutting-edge technology in terms of sensor systems and willprovide state-of-art capabilities for cartographic applications. The satellitewill have only a PAN camera with 2.5 m resolution and 30 km swath andFore-Aft stereo capability. The 2.5 m resolution data will cater to the specificneeds of cartography and terrain modeling applications.
RESOURCESAT-1:
Launched on 17th October, 2003, it is designed mainly for resourcesapplications and having 3-band multi-spectral LISS-4 camera with a spatialresolution 5.8m and a swath of around 24 km with across – track steerabilityfor selected area monitoring. An improved version of LISS-III, with 4 bands(green, red, near—IR and SWIR), all at 23.5 meters resolution and 140 kmswath will also provide the much essential continuity to LISS-III. Thesepayloads will provide enhanced data for vegetation applications and will allowmultiple crop discrimination; species level discrimination and so on. Togetherwith an advanced wide-field sensor, WiFS with ~ 60 m resolution and ~ 740km swath, the payloads will aid greatly for crop and vegetation applicationsand integrated land and water applications. The data will also be useful forhigh accuracy resources management applications, where the emphasis is onmulti crop mapping studies, vegetation species identification and utilitiesmapping.
CLIMATSAT/OCEANSAT-2:
In order to meet the information requirements to study the Planet Earthas an integrated system, satellite missions are planned which would enable

58 Earth Resource Satellites
global observations of climate, ocean and the atmosphere, particularly coveringthe tropical regions, where sufficient data sets are not available. Theinstruments like radiometers, sounders, spectrometers etc. for studying theland, ocean and atmospheric interactions are being planned for these missions.
OTHER COMMERCIALLY AVAILABLE SATELLITES
IKONOS:
The IKONOS-2 satellite was launched in September 1999 and has beendelivering commercial data since early 2000. IKONOS is the first of the nextgeneration of high spatial resolution satellites. IKONOS data records 4channels of multispectral data at 4 m resolution and one panchromatic channelwith 1 m resolution (Table 7). This means that IKONOS is first commercialsatellite to deliver near photographic quality imagery of anywhere in the worldfrom space. Radiometric Resolution: Data is collected as 11 bits per pixel(2048 gray tones).
The applications for this data are boundless: in particular, it will be usedfor large scale mapping, creating precise height models for e.g. micro-cellularradio, and for every application requiring the utmost detail from areas whichare inaccessible for aerial photography.
ENVISAT:
Envisat launched on 1st March 2002 is the most powerful European Earth-observation satellite. Envisat is a key element of the European Space Agency’splans for the next decade to monitor Earth’s environment. It carries instrumentsto collect information that will help scientists to understand each part of theEarth system and to predict how changes in one part will affect others (Table8). It is in a Sun synchronous orbit at an altitude of 800 km and carrying10 instruments onboard.
Variety of earth resources satellites are currently commercially availablefor inventorying and monitoring earth resources. These satellites arecharacterised by varying spatial, spectral, radiometric and temporal resolutions(Table 9).

Shefali Aggarwal 59
Tab
le 7
. C
hara
cter
isti
c of
IK
ON
OS
Sate
llite
Sate
llite
Laun
chSe
nsor
sTy
pes
No.
of
Spec
tral
Ran
geR
esol
utio
nSw
ath
Rev
isit
Nam
eB
ands
(mic
rons
)(m
etre
s)W
idth
Tim
e(k
m)
IKO
NO
S-2
Sept
embe
rIK
ON
OS
Mul
ti-s
pect
ral
40.
45-0
.52
(blu
e)4
11
day
s
24, 1
999
0.52
-0.6
0 (g
reen
)
0.63
-0.6
9 (r
ed)
0.76
-0.9
0 (N
IR)
PAN
1
1

60 Earth Resource Satellites
Tab
le 8
. E
nvis
at’s
Inst
rum
ent
(sou
rce:
ww
w.e
sa.in
t/ex
port
/esa
sa/E
SAD
TO
MB
AM
C_e
arth
_O.h
tml)
Inst
rum
ent
Glo
bal o
zone
mon
itor
ing
by o
ccul
tati
on o
f st
ars
(G
OM
OS)
Scan
nin
g Im
agin
g A
bso
rpti
on S
pec
trom
eter
for
Atm
osp
her
icC
arto
grap
hy (S
CIA
MA
CH
Y)
Mic
hels
on in
terf
erom
eter
for
pas
sive
atm
osph
eric
sou
ndin
g (M
IPA
S)
Med
ium
res
olut
ion
imag
ing
Spec
trom
eter
(M
ER
IS)
Adv
ance
d sy
nthe
tic
aper
ture
Rad
ar (
ASA
R)
Adv
ance
d al
ong
trac
k sc
anni
ng r
adio
met
er (
AA
TSR
)
Rad
ar A
ltim
eter
(R
A-2
)
Mic
row
ave
radi
omet
er (
MW
R)
Dop
pler
Orb
itog
raph
y an
d R
adio
pos
itio
ning
int
egra
ted
by s
atel
lite
(DO
RIS
)
Las
er r
etro
-ref
lect
or (
LR
R)
Mai
n pu
rpos
e
To o
bser
ve t
he c
once
ntra
tion
of
ozon
e in
the
str
atos
pher
e.
To m
easu
re t
race
gas
es a
nd a
eros
ol c
once
ntra
tion
s in
the
atm
osph
ere.
To c
olle
ct i
nfor
mat
ion
abou
t ch
emic
al a
nd p
hysi
cal
proc
esse
s in
the
stra
tosp
here
, suc
h as
thos
e th
at w
ill a
ffec
t ozo
ne c
once
ntra
tion
in fu
ture
.
Mea
sure
s ra
diat
ion
in 1
5 fr
eque
ncy
band
s th
at g
ive
info
rmat
ion
abou
toc
ean
biol
ogy,
mar
ine
wat
er q
ualit
y, a
nd v
eget
atio
n on
land
, clo
ud a
ndw
ater
vap
or.
All
wea
ther
, day
or
nigh
t rad
ar im
agin
g.
To m
easu
re s
ea-s
urfa
ce t
empe
ratu
re,
a ke
y pa
ram
eter
in
dete
rmin
ing
the
exis
tenc
e an
d/or
ext
ent
of g
loba
l war
min
g.
Mea
sure
s di
stan
ce f
rom
sat
ellit
e to
Ear
th.
So c
an m
easu
re s
ea-s
urfa
cehe
ight
, an
impo
rtan
t mea
sure
men
t for
mon
itor
ing
El N
ino,
for
exam
ple.
Allo
ws
corr
ecti
ons
to b
e m
ade
to r
adar
alt
imet
er d
ata.
Giv
es t
he p
osit
ion
of E
nvis
at i
n it
s or
bit
to w
ithi
n a
few
cen
tim
eter
s.T
his
is c
ruci
al t
o un
ders
tand
ing
the
mea
sure
men
ts a
ll th
e in
stru
men
tsm
ake.
Ref
lect
s pu
lsed
lase
r to
gro
und
stat
ions
to
help
det
erm
ine
the
sate
llite
’sex
act
posi
tion
in
its
orbi
t.

Shefali Aggarwal 61
Tab
le 9
. C
hara
cter
isti
cs o
f so
me
mor
e co
mm
erci
ally
ava
ilabl
e sa
telli
tes
Sate
llite
Laun
chSe
nsor
sTy
pes
No.
of
Spec
tral
Ran
geR
esol
utio
nSw
ath
Rev
isit
Nam
eB
ands
(mic
rons
)(m
etre
s)W
idth
Tim
e(k
m)
Qui
ckB
ird-
2O
ct. 1
8, 2
001
M
ulti
-4
blue
(0.
45-0
.52)
2.5
17
spec
tral
gree
n (0
.52-
0.6)
red
(0.6
3-0.
69)
NIR
.(76
-0.8
9)
Pan
10.
45-0
.90.
61
ER
OS
1D
ec. 5
, 200
0
Pan
10.
5-0.
91.
812
.51-
4 da
ys
EO
1N
ov. 2
1, 2
000
ALI
Mul
ti9
0.43
3-0.
453
0.45
-0.5
15
0.52
5-0.
605
0.63
-0.6
9
0.77
5-0.
805
0.84
5-0.
89
1.2-
1.3
1.55
-1.7
5
2.08
-2.3
530
3716
day
s
Pan
10.
48-0
.69
10
Hyp
erio
nH
yper
220
0.4
to 2
.5 (
10nm
307.
5 km
xsa
mpl
ing
inte
rval
)10
0 km
cont
d...

62 Earth Resource Satellites
LAC
Hyp
er25
60.
9-1.
6 (2
-6nm
250
185
kmsa
mpl
ing
inte
rval
)
AST
ER
Mul
ti3
VN
IR -
ste
reo
15(0
.5-0
.9)
6SW
IR (
1.6-
2.5)
3060
16 d
ays
5T
IR (
8-12
)90
CE
RE
SM
ulti
3SW
IR, T
IR, T
otal
20 k
m
Terr
aD
ec. 1
8, 1
999
MIS
RM
ulti
4
250-
275
360
(EO
S A
M-1
)M
OD
ISM
ulti
225
0
50.
4-14
.450
023
30
2910
00
MO
PIT
TM
ulti
32.
3 (C
H4)
2.4
(CO
)22
km
640
4.7
(CO
)
WFI
Mul
ti2
0.66
(gr
een)
260
890
5 da
ys
0.83
(N
IR)
CB
ER
SO
ctob
er 1
4,C
CD
(st
ereo
)M
ulti
50.
51-0
.73
(pan
)
1999
0.45
-0.5
2 (b
lue)
0.52
-0.5
9 (g
reen
)20
113
26 d
ays
0.63
-0.6
9 (r
ed)
0.7-
0.89
(N
IR)
Sate
llite
Laun
chSe
nsor
sTy
pes
No.
of
Spec
tral
Ran
geR
esol
utio
nSw
ath
Rev
isit
Nam
eB
ands
(mic
rons
)(m
etre
s)W
idth
Tim
e(k
m)
cont
d...

Shefali Aggarwal 63
IR-M
SSM
ulti
40.
5-1.
1 (p
an)
8012
0
1.55
-1.7
5 (I
R)
2.08
-2.3
5 (I
R)
10.4
-12.
5 (T
IR)
160
KIT
SAT
-3M
ay 2
6, 1
999
CC
DM
ulti
3re
d, g
reen
, NIR
15
Pan
1
15
NO
AA
-KM
ay -
199
8AV
HR
RM
ulti
5
1100
0.40
2-0.
422
1130
2,80
01
day
0.43
3-0.
453
0.48
-0.5
Orb
Vie
w-2
Aug
ust,
199
7Se
aWiF
SM
ulti
80.
50-0
.52
0.54
5-0.
565
0.66
-0.6
8
0.74
5-0.
785
0.84
5-0.
885
RA
DA
RSA
TN
ovem
ber,
1995
SAR
Rad
ar1
C-b
and
8-12
0
24 d
ays
(HH
pol
ariz
atio
n)
ER
S-2
1995
AM
IR
adar
15.
3 G
Hz(
C-b
and)
2699
35 d
ays
ATSR
Mul
ti4
10
00
Sate
llite
Laun
chSe
nsor
sTy
pes
No.
of
Spec
tral
Ran
geR
esol
utio
nSw
ath
Rev
isit
Nam
eB
ands
(mic
rons
)(m
etre
s)W
idth
Tim
e(k
m)
cont
d...

64 Earth Resource Satellites
NO
AA
-14
1994
AVH
RR
Mul
ti5
11
00
RE
SUR
S-19
94M
SU-S
KM
ulti
40.
5-0.
6 (g
reen
)17
060
021
day
s
O1-
30.
6-0.
7 (r
ed)
0.7-
0.8
(NIR
)
0.8-
1.1
(NIR
)
110
.4-1
2.6
(The
rmal
IR
)60
0
JER
S-1
Febr
uary
, 199
2SA
RR
adar
112
75 M
Hz
(L-b
and,
HH
pola
riza
tion
)18
7544
day
s
OP
SM
ulti
3V
isib
le N
IR18
x 2
475
4SW
IR
ER
S-1
1991
AM
IR
adar
1C
ban
d(V
V p
olar
izat
ion)
26
35 d
ays
ATSR
Mul
ti4
10
00
NO
AA
-12
1991
AVH
RR
Mul
ti5
11
00
Sate
llite
Laun
chSe
nsor
sTy
pes
No.
of
Spec
tral
Ran
geR
esol
utio
nSw
ath
Rev
isit
Nam
eB
ands
(mic
rons
)(m
etre
s)W
idth
Tim
e(k
m)

Shefali Aggarwal 65
CONCLUSIONS
Since the launch of first earth resource satellite in 1972, various satelliteplatforms with a variety of remote sensing sensors have been launched to studythe earth, the ocean, the atmosphere and the environment. These earthresources satellites data are very useful for mapping and monitoring naturalresources and environment at various levels, such as global, regional, local andmicro level.
REFERENCES
Campbell, J.B. 1996. Introduction to Remote Sensing. Taylor & Francis, London.
Curran, P.J. 1985. Principles of Remote Sensing. Longman Group Limited, London.
Elachi C. 1987. Introduction to the Physics and Techniques of Remote Sensing. Wiley Seriesin Remote Sensing, New York.
http://www.ccrs.nrcan.gc.ca/ccrs/learn/tutorials/fundam/chapter1/chapter1_2.
http://www.ersc.edu/resources/EOSC.html
Joseph, G. 1996. Imaging Sensors for Remote Sensing. Remote Sensing Reviews, 13: 257-342.
Lillesand, T.M. and Kiefer, R. 1993. Remote Sensing and Image Interpretation, ThirdEdition. John Villey, New York.
www.planetary.brown.edu/arc/sensor.html
www.spaceimage.com
www.eospso.gfc.nasa.gov
www.landsat.org
www.spotimage.fr/home
www.space.gc.ca
www.esa.int/export/esasa/ESADTOMBAMC_earth_O.html