Earth Observations for Disaster Risk Assessment and Resilience · Earth Observations for Disaster...
23
National Aeronautics and Space Administration Amita Mehta and Sean McCartney 8 August 2019 Earth Observations for Disaster Risk Assessment and Resilience
Transcript of Earth Observations for Disaster Risk Assessment and Resilience · Earth Observations for Disaster...

National Aeronautics and Space Administration
Amita Mehta and Sean McCartney
8 August 2019
Earth Observations for Disaster Risk Assessment
and Resilience

2NASA’s Applied Remote Sensing Training Program
Training Outline
Aug 6, 2019
NASA Remote
Sensing and
Socioeconomic
Data for Disaster
Risk Assessment
Aug 13, 2019
Disaster Risk
Assessment Case
Studies Using
Remote Sensing
Data
Aug 8, 2019
Assessing the Risk
of Floods &
Cyclones Using
NASA Data
Aug 15, 2019
Operational
Application of
Remote Sensing for
Disaster
Management
Image Credits (left to right): EM-DAT; NASA; WRI Resource Watch; PDC

3NASA’s Applied Remote Sensing Training Program
Homework and Certificate
• Homework:
– 2 homework assignments
– Answers to homework from Parts 2 & 4 must be submitted via Google Forms
• Certificate of Completion:
– Attend all webinars
– Complete 2 homework assignments by 30 August
• You will receive certificates approximately two months after the completion of the
course from: [email protected]

NASA’s Applied Remote Sensing Training Program 4
Part-2 Outline
• Examples of Hazard Assessment from Past Data for Disaster Risk Assessment
(DRA)
• Demonstrations:
– Past Earth Observations to Assess Hazard Information
– Application of Past Hazard Information for Near Real-time and Future DRA
• Case Studies:
i. Cyclones over Mozambique
ii. Extreme Rain over Houston
NASA’s Applied Remote Sensing Training Program 5
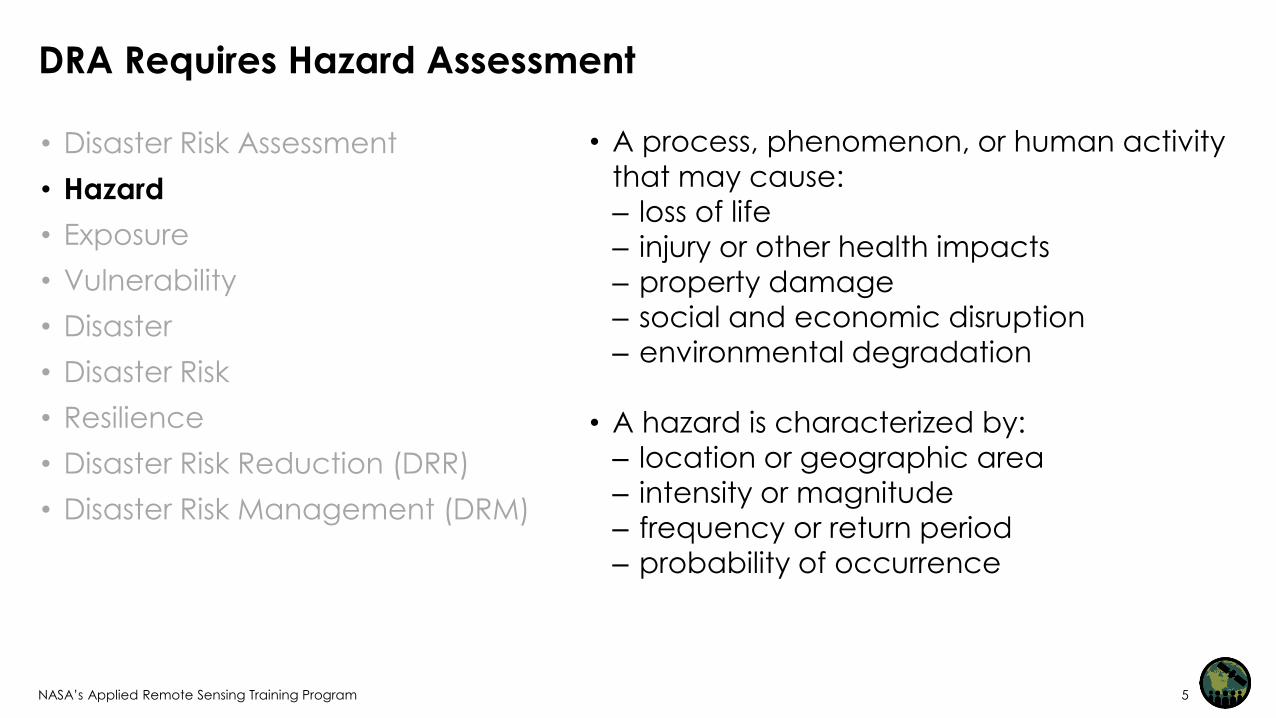
DRA Requires Hazard Assessment
• Disaster Risk Assessment
• Hazard
• Exposure
• Vulnerability
• Disaster
• Disaster Risk
• Resilience
• Disaster Risk Reduction (DRR)
• Disaster Risk Management (DRM)
• A process, phenomenon, or human activity
that may cause:
– loss of life
– injury or other health impacts
– property damage
– social and economic disruption
– environmental degradation
• A hazard is characterized by:
– location or geographic area
– intensity or magnitude
– frequency or return period
– probability of occurrence

6NASA’s Applied Remote Sensing Training Program
DRA Requires Exposure Information with Hazard Assessment
• Disaster Risk Assessment
• Hazard
• Exposure
• Vulnerability
• Disaster
• Disaster Risk
• Resilience
• Disaster Risk Reduction (DRR)
• Disaster Risk Management (DRM)
• The situation of people, infrastructure,
housing, production capacities, and other
tangible human assets located in hazard-
prone areas
• Exposure can be measured by the number
of people or types of assets in an area
• To estimate quantitative risks associated with
a hazard, exposure measurements can be
combined with specific vulnerability and
capacity of exposed elements
Text Credit: UNISDR
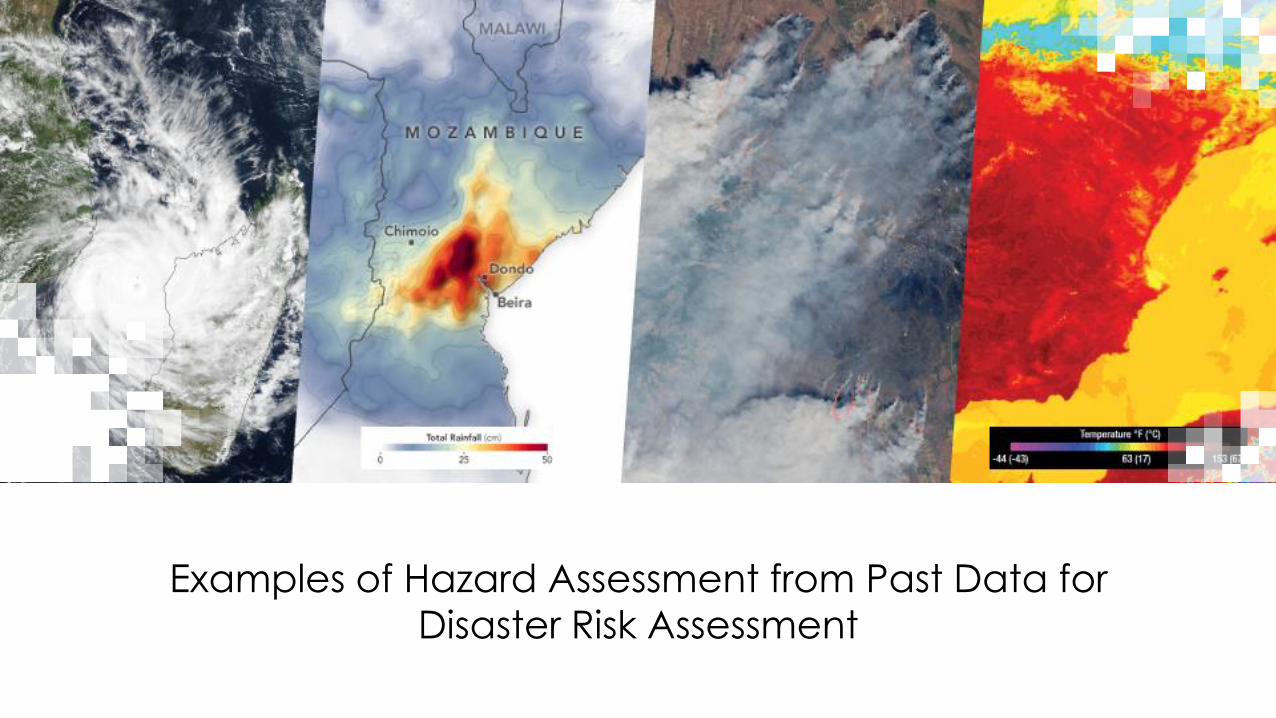
Examples of Hazard Assessment from Past Data for
Disaster Risk Assessment

NASA’s Applied Remote Sensing Training Program 8
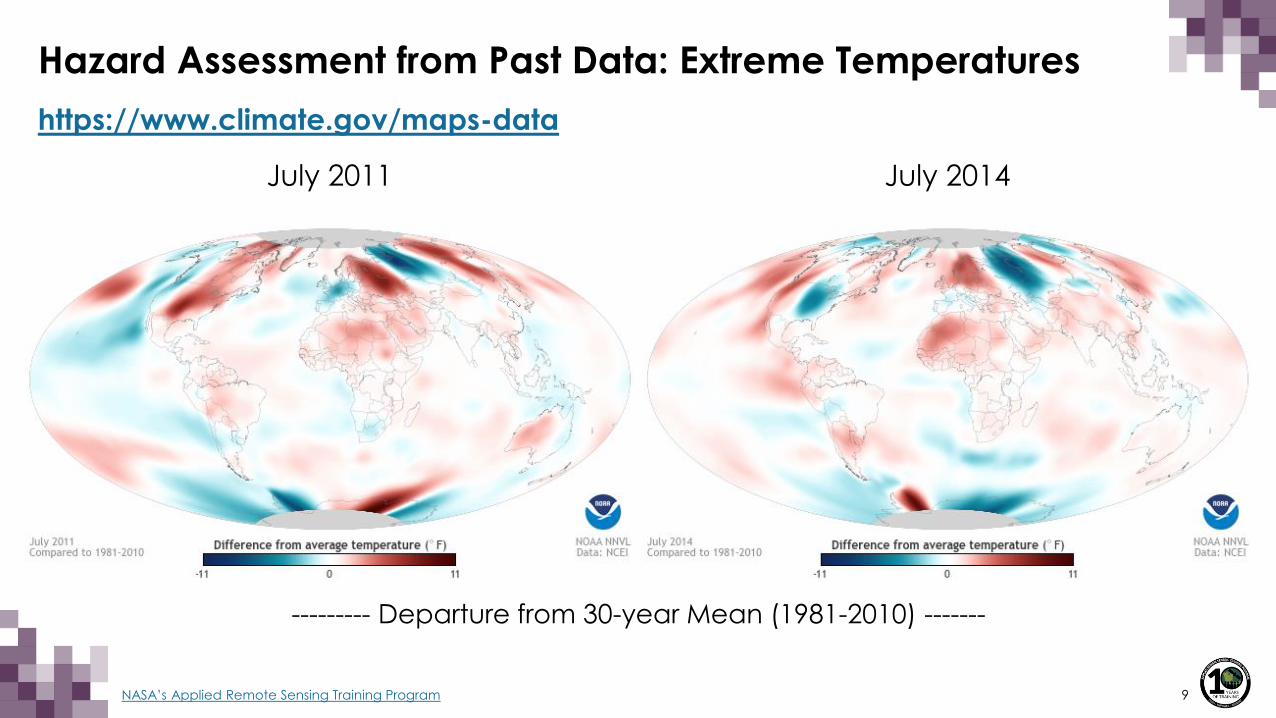
Hazard Assessment from Past Data: Extreme Temperatures
https://www.climate.gov/maps-data
July Mean (1981-2010)
July Max (1981-2010)
--------- Departure from 30-year Mean -------
July 2011 July 2014
9NASA’s Applied Remote Sensing Training Program
Hazard Assessment from Past Data: Extreme Temperatures
https://www.climate.gov/maps-data
July 2011 July 2014
--------- Departure from 30-year Mean (1981-2010) -------
10NASA’s Applied Remote Sensing Training Program
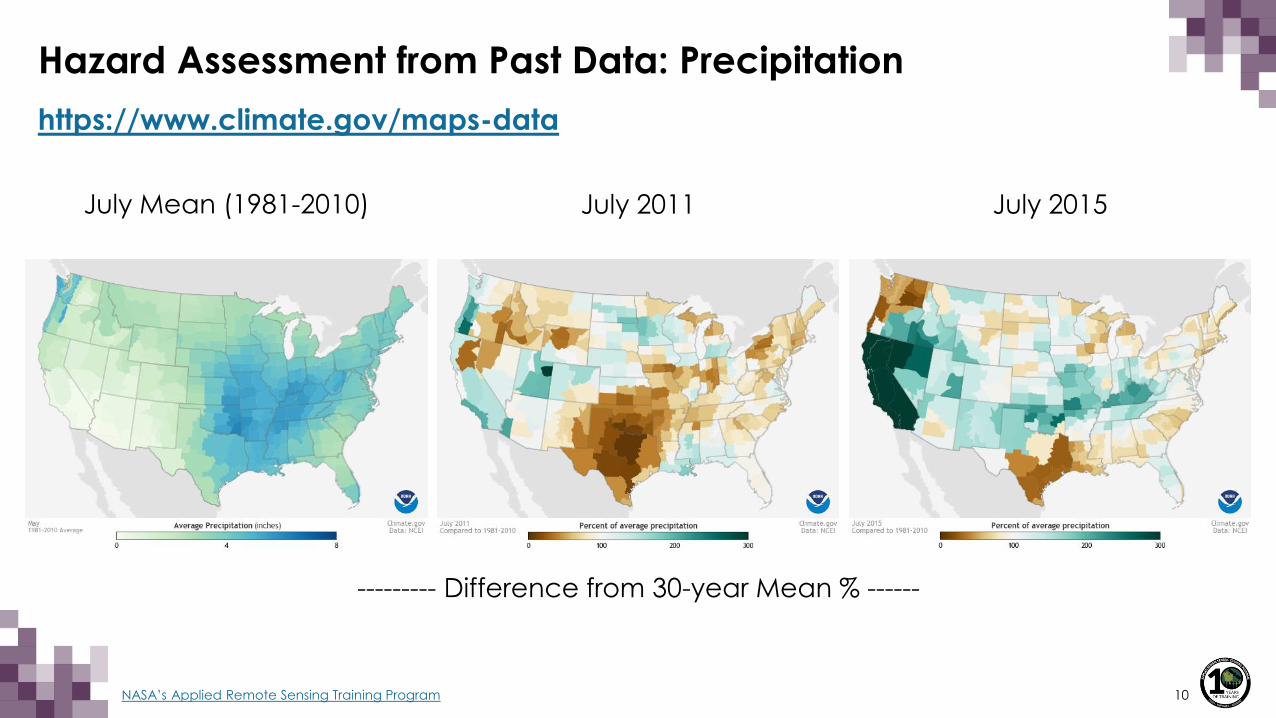
Hazard Assessment from Past Data: Precipitation
https://www.climate.gov/maps-data
July Mean (1981-2010) July 2011 July 2015
--------- Difference from 30-year Mean % ------
11NASA’s Applied Remote Sensing Training Program
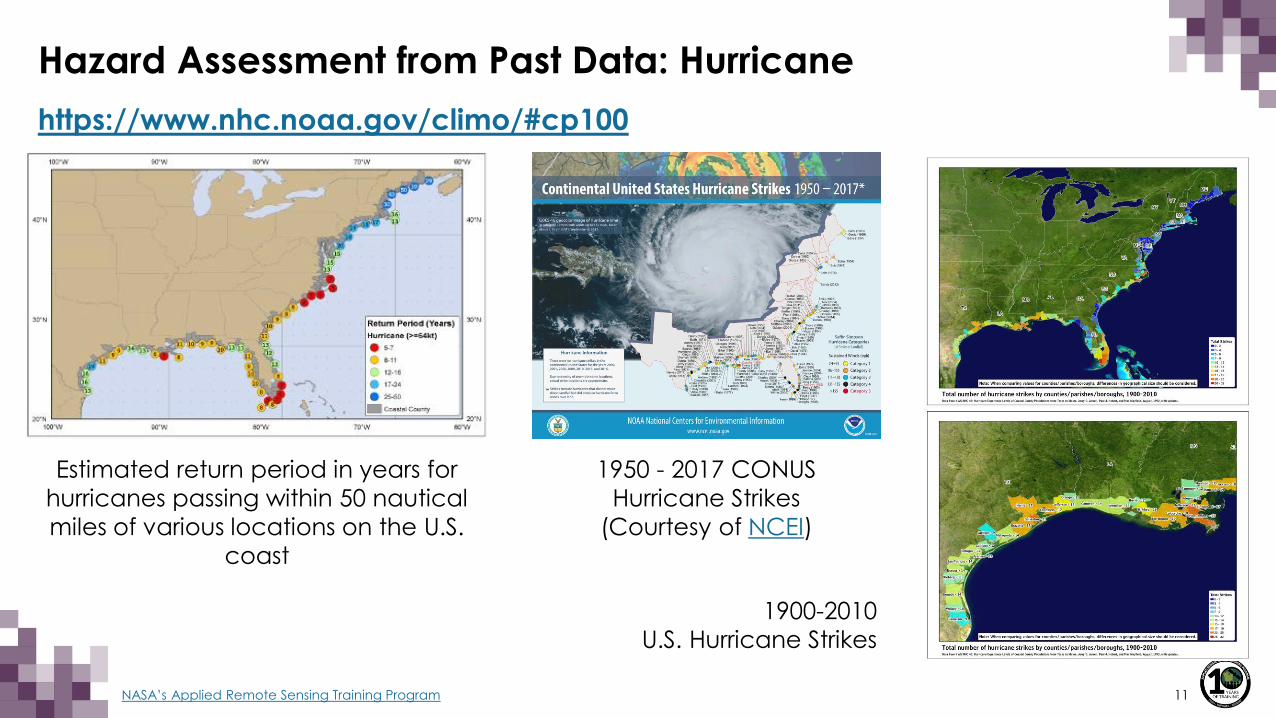
Hazard Assessment from Past Data: Hurricane
https://www.nhc.noaa.gov/climo/#cp100
Estimated return period in years for
hurricanes passing within 50 nautical
miles of various locations on the U.S.
coast
1950 - 2017 CONUS
Hurricane Strikes
(Courtesy of NCEI)
1900-2010
U.S. Hurricane Strikes
12NASA’s Applied Remote Sensing Training Program
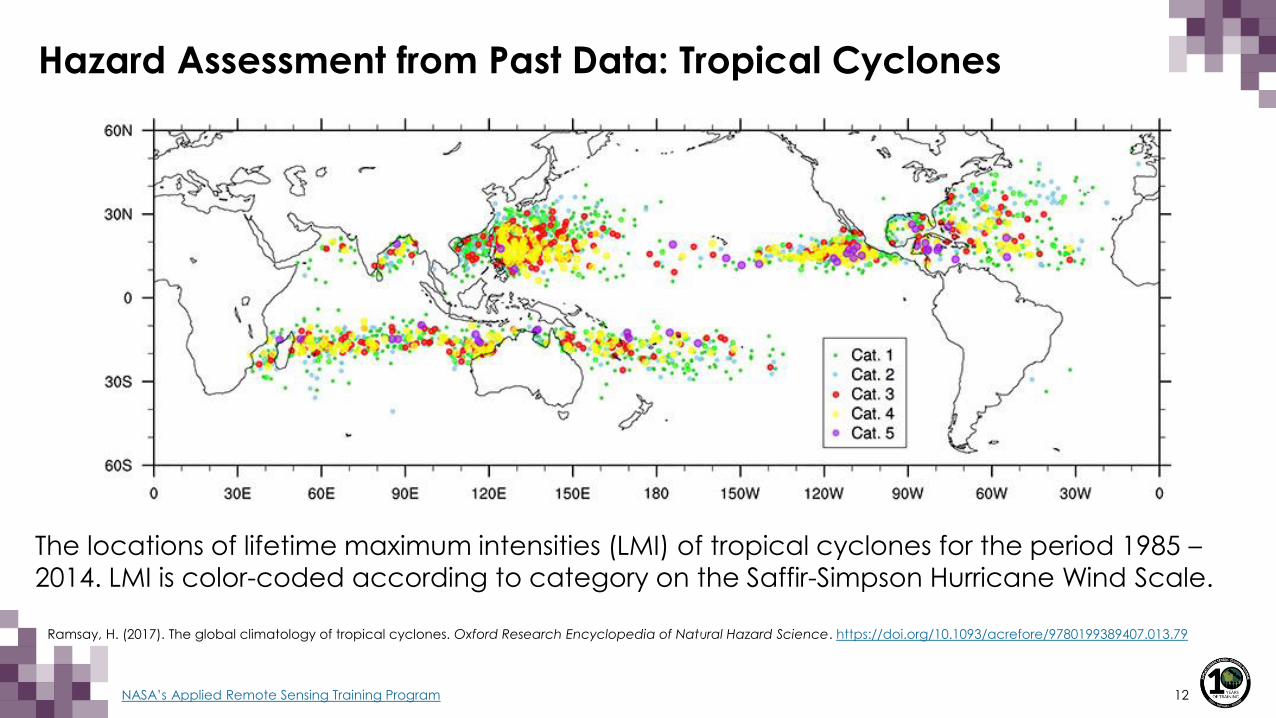
Hazard Assessment from Past Data: Tropical Cyclones
The locations of lifetime maximum intensities (LMI) of tropical cyclones for the period 1985 –2014. LMI is color-coded according to category on the Saffir-Simpson Hurricane Wind Scale.
Ramsay, H. (2017). The global climatology of tropical cyclones. Oxford Research Encyclopedia of Natural Hazard Science. https://doi.org/10.1093/acrefore/9780199389407.013.79

NASA’s Applied Remote Sensing Training Program 13
Hazard Assessment from Past Data: Flooding
https://sedac.ciesin.columbia.edu/data/set/ndh-flood-hazard-frequency-distribution/maps
Reference: Dilley, M., R.S. Chen, U. Deichmann, A.L. Lerner-Lam, M. Arnold, J. Agwe, P. Buys, O. Kjekstad, B. Lyon, and G. Yetman. 2005. Natural Disaster Hotspots: A Global Risk Analysis.
Washington, D.C.: World Bank. https://doi.org/10.1596/0-8213-5930-4.
14NASA’s Applied Remote Sensing Training Program
DRA Based on Hazard and Exposure & Vulnerability Data
• Disaster Risk Assessment (DRA) depends on disaster type, geographical area, and
socioeconomic conditions
• There is no unique methodology to derive local and regional disaster risk, various
data sources and statistical/empirical techniques are generally used
• This session provides a possible methodology to assess hazard frequency and
intensity together with exposure data for Disaster Risk Assessment (DRA) to plan for
Disaster Risk Reduction (DRR)
• Additional data and quantitative analysis may be required for more accurate DRA
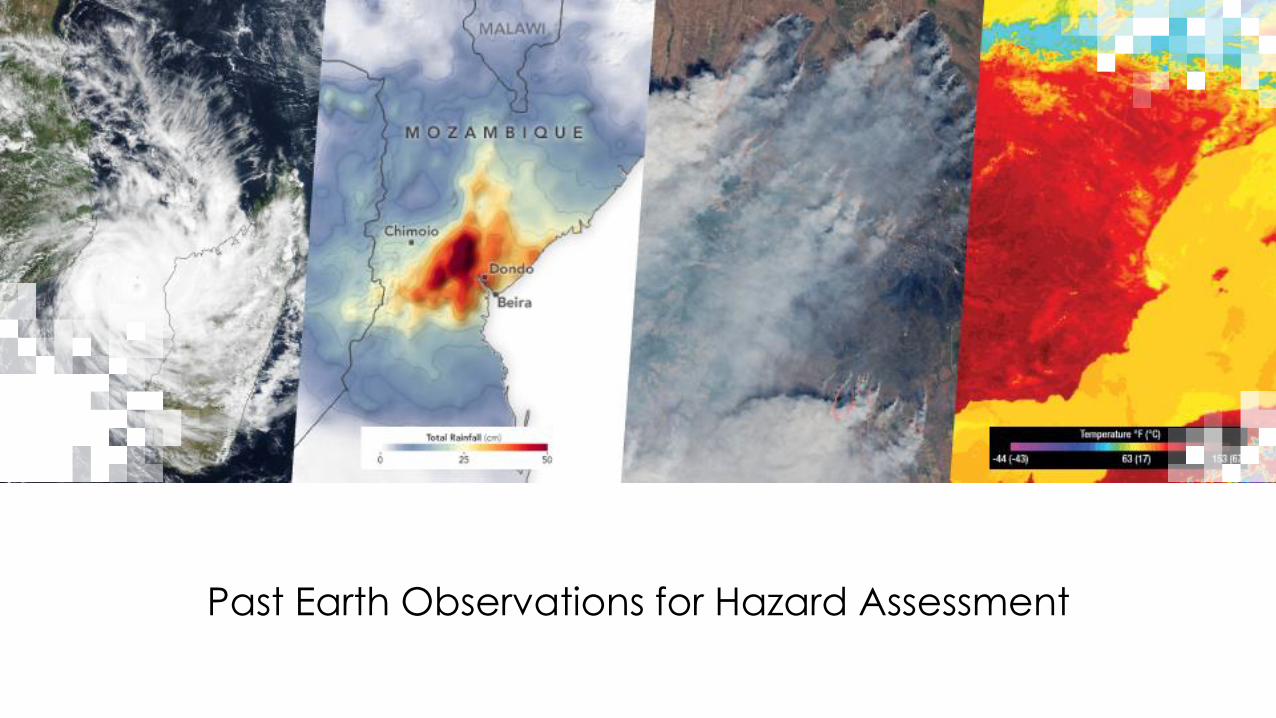
Past Earth Observations for Hazard Assessment
16NASA’s Applied Remote Sensing Training Program
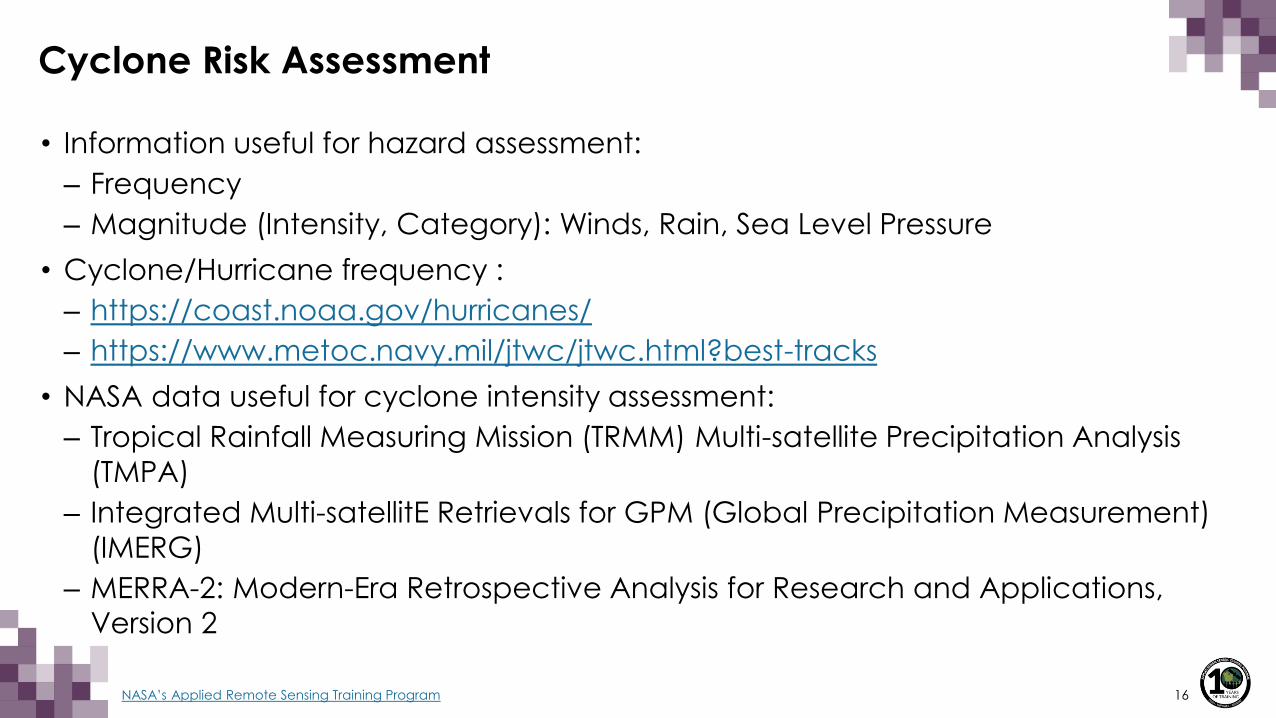
Cyclone Risk Assessment
• Information useful for hazard assessment:
– Frequency
– Magnitude (Intensity, Category): Winds, Rain, Sea Level Pressure
• Cyclone/Hurricane frequency :
– https://coast.noaa.gov/hurricanes/
– https://www.metoc.navy.mil/jtwc/jtwc.html?best-tracks
• NASA data useful for cyclone intensity assessment:
– Tropical Rainfall Measuring Mission (TRMM) Multi-satellite Precipitation Analysis
(TMPA)
– Integrated Multi-satellitE Retrievals for GPM (Global Precipitation Measurement)
(IMERG)
– MERRA-2: Modern-Era Retrospective Analysis for Research and Applications,
Version 2

17NASA’s Applied Remote Sensing Training Program
Extreme Rain Risk Assessment
• Information useful for hazard assessment:
– Frequency
– Magnitude
– Rain Rate Distribution
– Spatial Extent
• NASA data useful for extreme rain assessment:
– Tropical Rainfall Measuring Mission (TRMM) Multi-satellite Precipitation Analysis
(TMPA)
– Integrated Multi-satellitE Retrievals for GPM (Global Precipitation Measurement)
(IMERG)

18NASA’s Applied Remote Sensing Training Program
Cyclone and Extreme Rain Exposure Data for DRA
Exposure Data from SEDAC (https://sedac.ciesin.columbia.edu/):
• Human Population
– https://sedac.ciesin.columbia.edu/data/collection/gpw-v4
– https://sedac.ciesin.columbia.edu/data/set/gpw-v4-basic-demographic-characteristics-rev11
– https://sedac.ciesin.columbia.edu/data/set/povmap-global-subnational-infant-
mortality-rates-v2
• Roads and Infrastructure
– https://sedac.ciesin.columbia.edu/data/set/groads-global-roads-open-access-v1
• Coastal Zones
– https://sedac.ciesin.columbia.edu/data/set/gpw-v3-coastlines
• Human Settlement and Urban Impermeable Surface
– https://sedac.ciesin.columbia.edu/data/set/ulandsat-gmis-v1/data-download

Application of Past Hazard Information for Near
Real-Time and Future Disaster Risk Assessment
20NASA’s Applied Remote Sensing Training Program
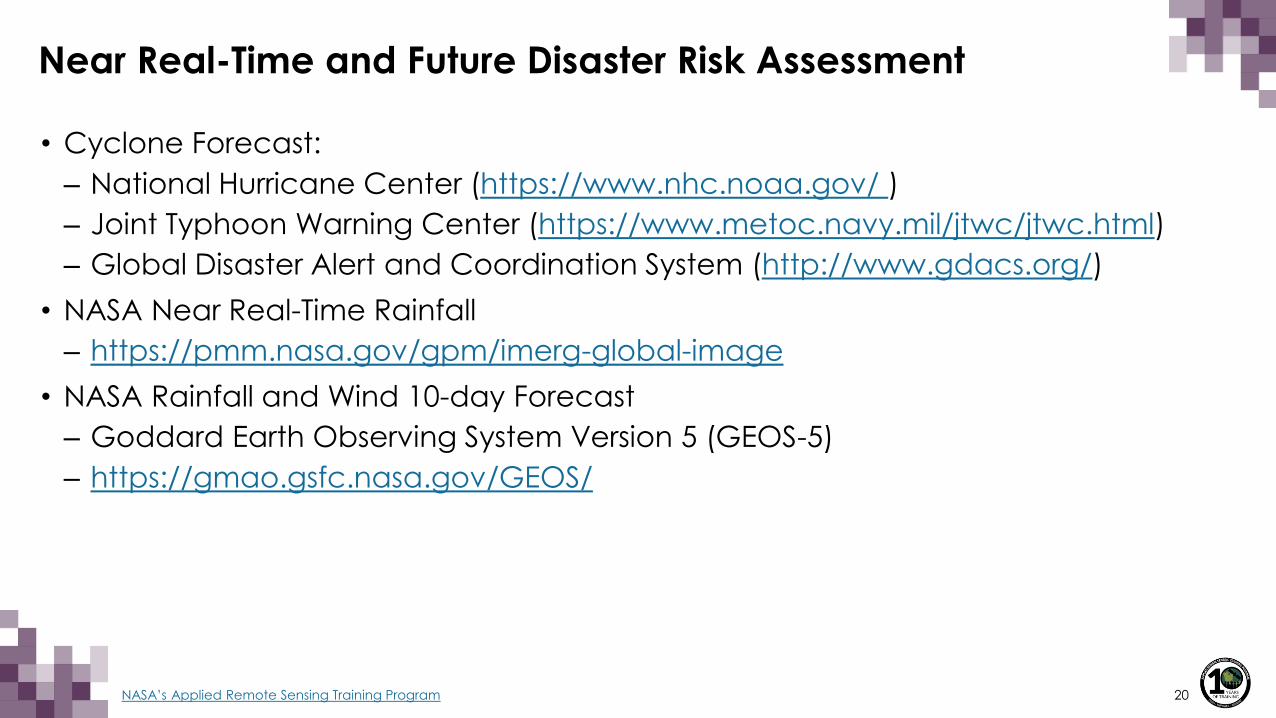
Near Real-Time and Future Disaster Risk Assessment
• Cyclone Forecast:
– National Hurricane Center (https://www.nhc.noaa.gov/ )
– Joint Typhoon Warning Center (https://www.metoc.navy.mil/jtwc/jtwc.html)
– Global Disaster Alert and Coordination System (http://www.gdacs.org/)
• NASA Near Real-Time Rainfall
– https://pmm.nasa.gov/gpm/imerg-global-image
• NASA Rainfall and Wind 10-day Forecast
– Goddard Earth Observing System Version 5 (GEOS-5)
– https://gmao.gsfc.nasa.gov/GEOS/
21NASA’s Applied Remote Sensing Training Program
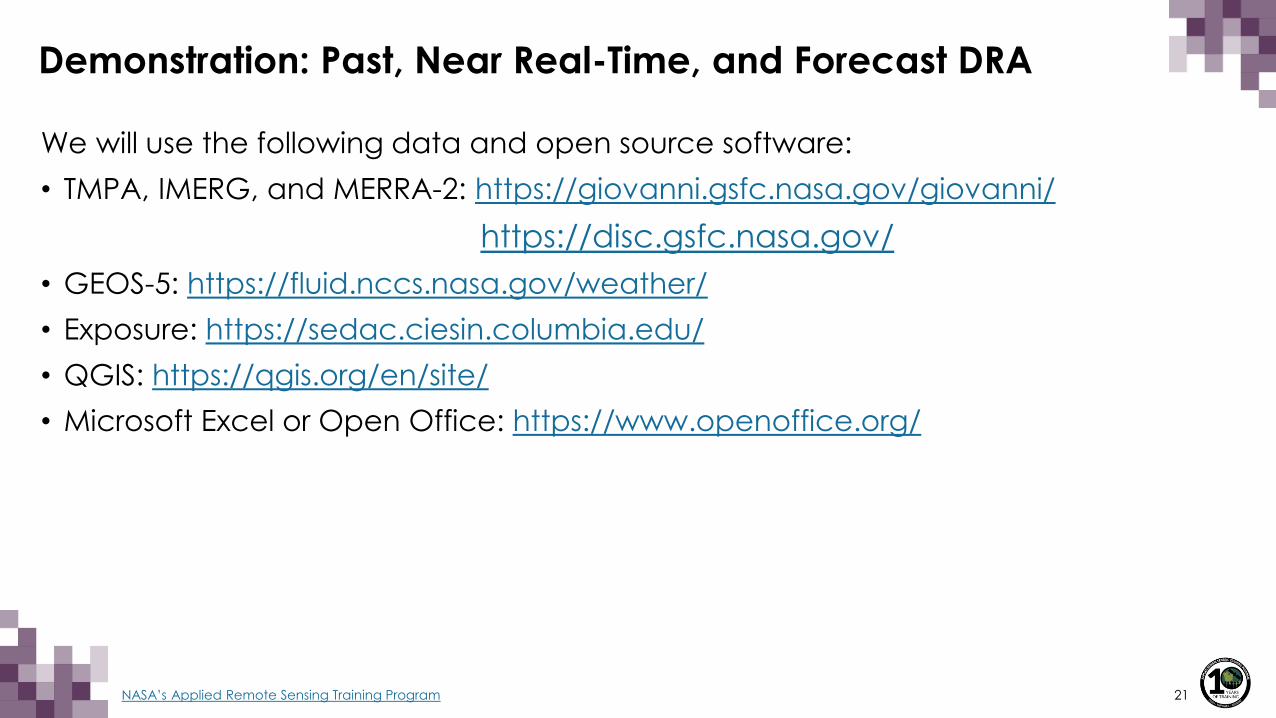
Demonstration: Past, Near Real-Time, and Forecast DRA
We will use the following data and open source software:
• TMPA, IMERG, and MERRA-2: https://giovanni.gsfc.nasa.gov/giovanni/
https://disc.gsfc.nasa.gov/
• GEOS-5: https://fluid.nccs.nasa.gov/weather/
• Exposure: https://sedac.ciesin.columbia.edu/
• QGIS: https://qgis.org/en/site/
• Microsoft Excel or Open Office: https://www.openoffice.org/

22NASA’s Applied Remote Sensing Training Program
Coming Up Next Week:
Disaster Risk Assessment Case Studies Using Remote Sensing Data:
1. Heat wave risk assessment using Earth observations in New York state
2. Web-based DRA tools from World Resources Institute (WRI)

Thank You!