THE EARTH’S ATMOSPHERE. COMPOSITION OF THE EARTH’S ATMOSPHERE.
Upload
truongmienCategory
view
213download
0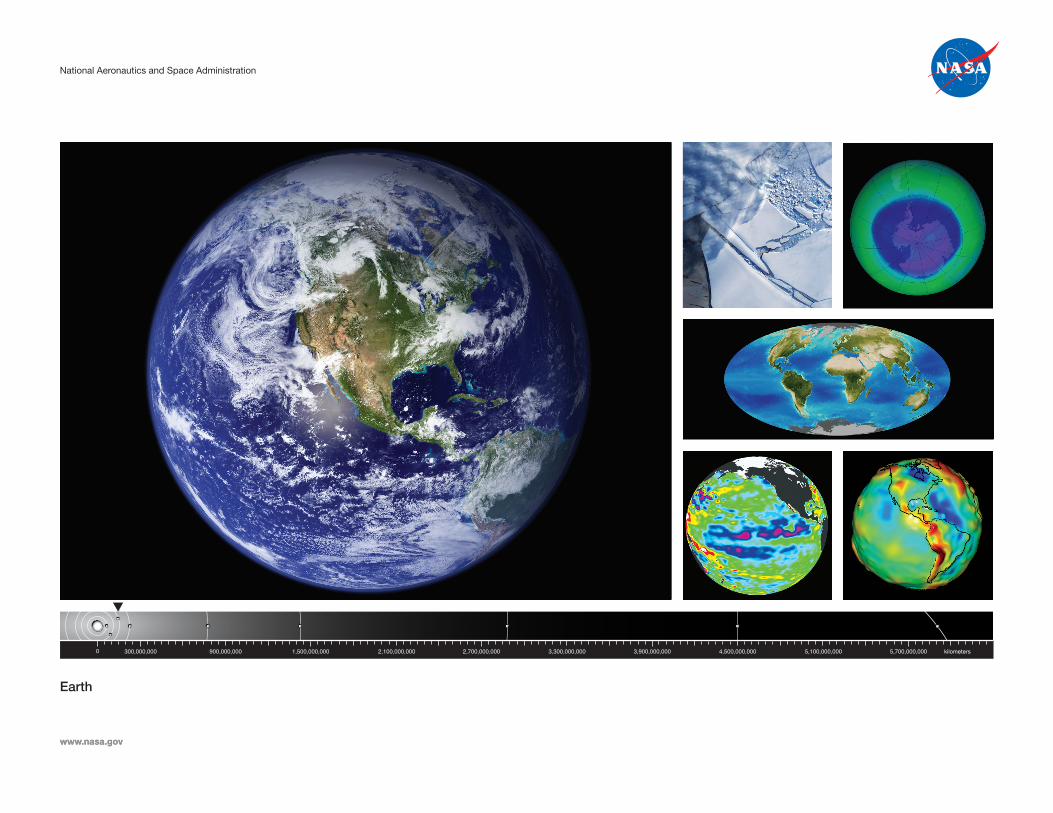
National Aeronautics and Space Administration
www.nasa.gov
Earth
National Aeronautics and Space Administration
300,000,000 900,000,000 1,500,000,000 2,100,000,000 2,700,000,000 3,300,000,000 3,900,000,000 4,500,000,000 5,100,000,000 5,700,000,000 kilometers0
LG-2009-09-567-HQ — JPL 400-1344F 09/09
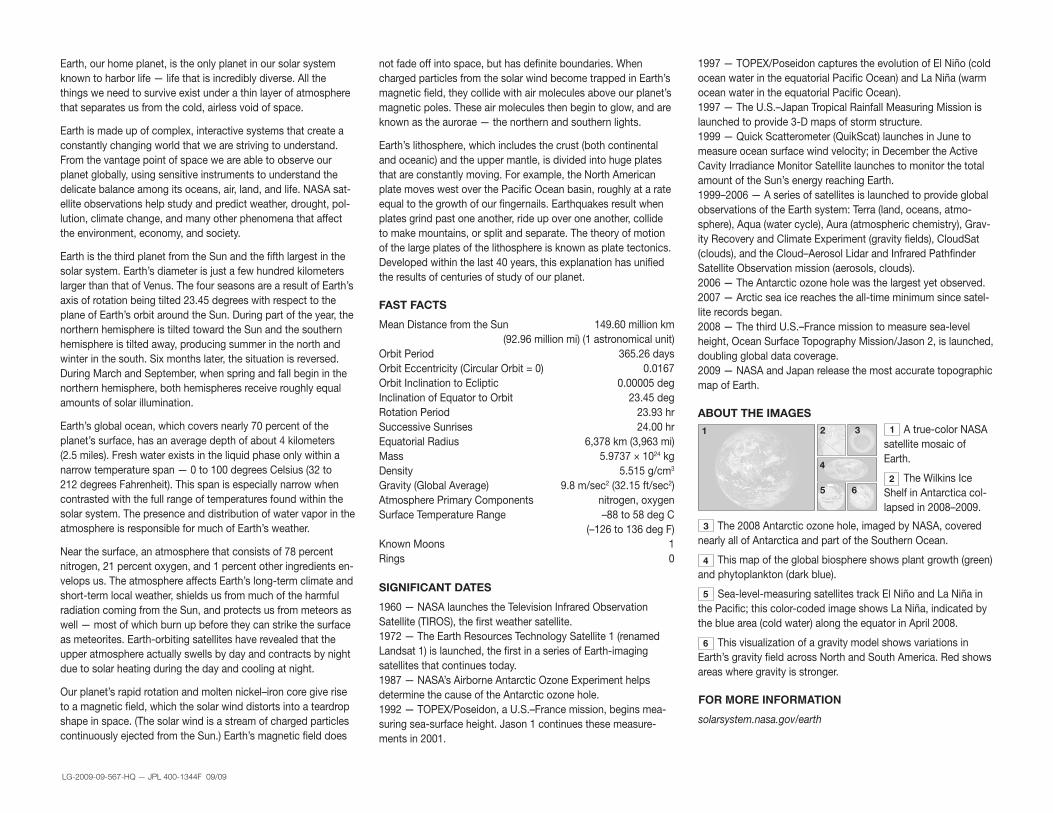
A true-color NASA satellite mosaic of Earth.
The Wilkins Ice Shelf in Antarctica col-lapsed in 2008–2009.
1997 — TOPEX/Poseidon captures the evolution of El Niño (cold ocean water in the equatorial Pacific Ocean) and La Niña (warm ocean water in the equatorial Pacific Ocean). 1997 — The U.S.–Japan Tropical Rainfall Measuring Mission is launched to provide 3-D maps of storm structure. 1999 — Quick Scatterometer (QuikScat) launches in June to measure ocean surface wind velocity; in December the Active Cavity Irradiance Monitor Satellite launches to monitor the total amount of the Sun’s energy reaching Earth. 1999–2006 — A series of satellites is launched to provide global observations of the Earth system: Terra (land, oceans, atmo-sphere), Aqua (water cycle), Aura (atmospheric chemistry), Grav-ity Recovery and Climate Experiment (gravity fields), CloudSat (clouds), and the Cloud–Aerosol Lidar and Infrared Pathfinder Satellite Observation mission (aerosols, clouds). 2006 — The Antarctic ozone hole was the largest yet observed. 2007 — Arctic sea ice reaches the all-time minimum since satel-lite records began. 2008 — The third U.S.–France mission to measure sea-level height, Ocean Surface Topography Mission/Jason 2, is launched, doubling global data coverage. 2009 — NASA and Japan release the most accurate topographic map of Earth.
ABOUT THE IMAGES
The 2008 Antarctic ozone hole, imaged by NASA, covered nearly all of Antarctica and part of the Southern Ocean.
This map of the global biosphere shows plant growth (green) and phytoplankton (dark blue).
Sea-level-measuring satellites track El Niño and La Niña in the Pac
5
ific; this color-coded image shows La Niña, indicated by the blue area (cold water) along the equator in April 2008.
This visualization of a gravity model shows variations in Earth’s gravity field across North and South America. Red shows areas where gravity is stronger.
Earth, our home planet, is the only planet in our solar system known to harbor life — life that is incredibly diverse. All the things we need to survive exist under a thin layer of atmosphere that separates us from the cold, airless void of space.
Earth is made up of complex, interactive systems that create a constantly changing world that we are striving to understand. From the vantage point of space we are able to observe our planet globally, using sensitive instruments to understand the delicate balance among its oceans, air, land, and life. NASA sat-ellite observations help study and predict weather, drought, pol-lution, climate change, and many other phenomena that affect the environment, economy, and society.
Earth is the third planet from the Sun and the fifth largest in the solar system. Earth’s diameter is just a few hundred kilometers larger than that of Venus. The four seasons are a result of Earth’s axis of rotation being tilted 23.45 degrees with respect to the plane of Earth’s orbit around the Sun. During part of the year, the northern hemisphere is tilted toward the Sun and the southern hemisphere is tilted away, producing summer in the north and winter in the south. Six months later, the situation is reversed. During March and September, when spring and fall begin in the northern hemisphere, both hemispheres receive roughly equal amounts of solar illumination.
Earth’s global ocean, which covers nearly 70 percent of the planet’s surface, has an average depth of about 4 kilometers (2.5 miles). Fresh water exists in the liquid phase only within a narrow temperature span — 0 to 100 degrees Celsius (32 to 212 degrees Fahrenheit). This span is especially narrow when contrasted with the full range of temperatures found within the solar system. The presence and distribution of water vapor in the atmosphere is responsible for much of Earth’s weather.
Near the surface, an atmosphere that consists of 78 percent nitrogen, 21 percent oxygen, and 1 percent other ingredients en-velops us. The atmosphere affects Earth’s long-term climate and short-term local weather, shields us from much of the harmful radiation coming from the Sun, and protects us from meteors as well — most of which burn up before they can strike the surface as meteorites. Earth-orbiting satellites have revealed that the upper atmosphere actually swells by day and contracts by night due to solar heating during the day and cooling at night.
Our planet’s rapid rotation and molten nickel–iron core give rise to a magnetic field, which the solar wind distorts into a teardrop shape in space. (The solar wind is a stream of charged particles continuously ejected from the Sun.) Earth’s magnetic field does
not fade off into space, but has definite boundaries. When charged particles from the solar wind become trapped in Earth’s magnetic field, they collide with air molecules above our planet’s magnetic poles. These air molecules then begin to glow, and are known as the aurorae — the northern and southern lights.
Earth’s lithosphere, which includes the crust (both continental and oceanic) and the upper mantle, is divided into huge plates that are constantly moving. For example, the North American plate moves west over the Pacific Ocean basin, roughly at a rate equal to the growth of our fingernails. Earthquakes result when plates grind past one another, ride up over one another, collide to make mountains, or split and separate. The theory of motion of the large plates of the lithosphere is known as plate tectonics. Developed within the last 40 years, this explanation has unified the results of centuries of study of our planet.
FAST FACTS
Mean Distance from the Sun 149.60 million km (92.96 million mi) (1 astronomical unit) Orbit Period 365.26 days Orbit Eccentricity (Circular Orbit = 0) 0.0167 Orbit Inclination to Ecliptic 0.00005 deg Inclination of Equator to Orbit 23.45 deg Rotation Period 23.93 hr Successive Sunrises 24.00 hr Equatorial Radius 6,378 km (3,963 mi) Mass 5.9737 × 1024 kg Density 5.515 g/cm3 Gravity (Global Average) 9.8 m/sec2 (32.15 ft/sec2) Atmosphere Primary Components nitrogen, oxygen Surface Temperature Range –88 to 58 deg C (–126 to 136 deg F) Known Moons 1 Rings 0
SIGNIFICANT DATES
1960 — NASA launches the Television Infrared Observation Satellite (TIROS), the first weather satellite. 1972 — The Earth Resources Technology Satellite 1 (renamed Landsat 1) is launched, the first in a series of Earth-imaging satellites that continues today. 1987 — NASA’s Airborne Antarctic Ozone Experiment helps determine the cause of the Antarctic ozone hole. 1992 — TOPEX/Poseidon, a U.S.–France mission, begins mea-suring sea-surface height. Jason 1 continues these measure-ments in 2001.
4
6
2
4
5
3
6
1
2
1
FOR MORE INFORMATION
solarsystem.nasa.gov/earth
3