Earth and Planetary Science Letters - UCL · Very little data on incongruent melting at lower...
25
Thermodynamics of the MgO–SiO 2 liquid system in Earth’s lowermost mantle from first principles Nico de Koker a,b,n , Bijaya B. Karki c,d , Lars Stixrude e a Bayerisches Geoinstitut, Universit¨ at Bayreuth, D-95440 Bayreuth, Germany b School of Geosciences, University of the Witwatersrand, Private Bag 3, 2050, Wits, South Africa c Department of Computer Science, Louisiana State University, Baton Rouge, LA 70803, United States d Department of Geology and Geophysics, Louisiana State University, Baton Rouge, LA 70803, United States e Department of Earth Sciences, University College London, Gower Street, London, WC1E 6BT, United Kingdom article info Article history: Received 8 September 2012 Received in revised form 12 November 2012 Accepted 15 November 2012 Editor: T. Spohn Available online 14 December 2012 Keywords: Earth’s mantle silicate melts high pressure melting origin of Earth core–mantle boundary abstract Knowledge of the multi-component thermodynamics and phase equilibria of silicate melts in Earth’s deep interior are key to understanding the thermal and chemical evolution of the planet, yet the melting phase diagram of the lower mantle remains poorly constrained, with large uncertainties in both eutectic composition and temperature. We use results from first-principles molecular dynamics of nine composi- tions along the MgO–SiO 2 binary to investigate the compositional dependence of liquid state thermo- dynamics, applying our results to describe incongruent melting for the system at deep lower mantle pressures. Our phase diagram is bi-eutectic throughout the lower mantle, with no liquid immiscibility. Accounting for solid–liquid partitioning of Fe, we find partial melts of basaltic and peridotitic lithologies to be gravitationally stable at the core–mantle boundary, while liquidus density contrasts predict that perovskite will sink and periclase will float in a crystallizing pyrolytic magma ocean. & 2012 Elsevier B.V. All rights reserved. 1. Introduction Melting at high pressure is a ubiquitous process in the forma- tion and evolution of terrestrial planets. The moon forming giant impact alone would have melted the entire Earth (Canup, 2004; Ke and Solomatov, 2006), while seismic ultra-low velocity zones atop the core–mantle boundary (CMB) are often associated with patches of partial melt (Williams and Garnero, 1996). As the vector of chemical differentiation during magma ocean crystallization and melting of the solid mantle, the buoyancy contrast between liquid and solid phases is a critical factor in planetary dynamics and evolution. These contrasts can differ notably among mineral phases, so that the crystallization sequence is just as important for understanding these processes. Most models describing crystal- lization of a magma ocean assume perovskite to be the liquidus phase, with crystallization starting from the base and crystals forming at shallower depths sinking to the bottom (Solomatov, 2007). Very little data on incongruent melting at lower mantle pressures is available to test these assumptions. Indeed, high pressure experiments indicate that the sequence of crystallization depends on pressure (Fiquet, 2010), while it was recently shown that the adiabatic thermal gradient in a magma ocean will be notably steeper than previously thought (Mosenfelder et al., 2007; Stixrude and Karki, 2005), so that crystallization may in fact initiate at depths shallower than the base (Stixrude et al., 2009). High pressure studies of congruent melting indicate that the Clapeyron slope of melting for MgO is likely higher than that of MgSiO 3 perovskite, which could potentially result in a strong pressure dependence in the MgO–MgSiO 3 eutectic composition. The ambient pressure MgO–SiO 2 phase diagram, first mapped out by Bowen and Andersen (1914), suggests a number of intriguing questions regarding potential high pressure phenom- ena. The system exhibits liquid immiscibility in high-silica com- positions (Hageman and Oonk, 1986), a very large contrast between the liquidus temperatures at intermediate (geological) compositions and MgO (Riley, 1966), a eutectic between MgO periclase and MgSiO 4 forsterite, another eutectic between MgSiO 3 enstatite and SiO 2 cristobalite, and a peritectic by which enstatite melts into a slightly more SiO 2 -rich liquid phase co-existing with forsterite. Low pressure liquid immiscibility, notably also observed in the CaO–SiO 2 (Hageman and Oonk, 1986) and FeO–SiO 2 (Bowen and Schairer, 1935) systems, has been shown to vanish by around 5 GPa (Dalton and Presnall, 1997). If this phenomenon reappears at lower mantle pressures, an idea as yet untested by experiment Contents lists available at SciVerse ScienceDirect journal homepage: www.elsevier.com/locate/epsl Earth and Planetary Science Letters 0012-821X/$ - see front matter & 2012 Elsevier B.V. All rights reserved. http://dx.doi.org/10.1016/j.epsl.2012.11.026 n Corresponding author. Tel.: þ27 11 717 6547. E-mail address: [email protected] (N. de Koker). Earth and Planetary Science Letters 361 (2013) 58–63
Transcript of Earth and Planetary Science Letters - UCL · Very little data on incongruent melting at lower...

Earth and Planetary Science Letters 361 (2013) 58–63
Contents lists available at SciVerse ScienceDirect
Earth and Planetary Science Letters
0012-82
http://d
n Corr
E-m
journal homepage: www.elsevier.com/locate/epsl
Thermodynamics of the MgO–SiO2 liquid system in Earth’s lowermostmantle from first principles
Nico de Koker a,b,n, Bijaya B. Karki c,d, Lars Stixrude e
a Bayerisches Geoinstitut, Universitat Bayreuth, D-95440 Bayreuth, Germanyb School of Geosciences, University of the Witwatersrand, Private Bag 3, 2050, Wits, South Africac Department of Computer Science, Louisiana State University, Baton Rouge, LA 70803, United Statesd Department of Geology and Geophysics, Louisiana State University, Baton Rouge, LA 70803, United Statese Department of Earth Sciences, University College London, Gower Street, London, WC1E 6BT, United Kingdom
a r t i c l e i n f o
Article history:
Received 8 September 2012
Received in revised form
12 November 2012
Accepted 15 November 2012
Editor: T. Spohntions along the MgO–SiO2 binary to investigate the compositional dependence of liquid state thermo-
Available online 14 December 2012
Keywords:
Earth’s mantle
silicate melts
high pressure melting
origin of Earth
core–mantle boundary
1X/$ - see front matter & 2012 Elsevier B.V.
x.doi.org/10.1016/j.epsl.2012.11.026
esponding author. Tel.: þ27 11 717 6547.
ail address: [email protected] (N. de Koke
a b s t r a c t
Knowledge of the multi-component thermodynamics and phase equilibria of silicate melts in Earth’s deep
interior are key to understanding the thermal and chemical evolution of the planet, yet the melting phase
diagram of the lower mantle remains poorly constrained, with large uncertainties in both eutectic
composition and temperature. We use results from first-principles molecular dynamics of nine composi-
dynamics, applying our results to describe incongruent melting for the system at deep lower mantle
pressures. Our phase diagram is bi-eutectic throughout the lower mantle, with no liquid immiscibility.
Accounting for solid–liquid partitioning of Fe, we find partial melts of basaltic and peridotitic lithologies
to be gravitationally stable at the core–mantle boundary, while liquidus density contrasts predict that
perovskite will sink and periclase will float in a crystallizing pyrolytic magma ocean.
& 2012 Elsevier B.V. All rights reserved.
1. Introduction
Melting at high pressure is a ubiquitous process in the forma-tion and evolution of terrestrial planets. The moon forming giantimpact alone would have melted the entire Earth (Canup, 2004; Keand Solomatov, 2006), while seismic ultra-low velocity zones atopthe core–mantle boundary (CMB) are often associated with patchesof partial melt (Williams and Garnero, 1996). As the vector ofchemical differentiation during magma ocean crystallization andmelting of the solid mantle, the buoyancy contrast between liquidand solid phases is a critical factor in planetary dynamics andevolution. These contrasts can differ notably among mineralphases, so that the crystallization sequence is just as importantfor understanding these processes. Most models describing crystal-lization of a magma ocean assume perovskite to be the liquidusphase, with crystallization starting from the base and crystalsforming at shallower depths sinking to the bottom (Solomatov,2007).
Very little data on incongruent melting at lower mantlepressures is available to test these assumptions. Indeed, highpressure experiments indicate that the sequence of crystallization
All rights reserved.
r).
depends on pressure (Fiquet, 2010), while it was recently shownthat the adiabatic thermal gradient in a magma ocean will benotably steeper than previously thought (Mosenfelder et al., 2007;Stixrude and Karki, 2005), so that crystallization may in fact initiateat depths shallower than the base (Stixrude et al., 2009). Highpressure studies of congruent melting indicate that the Clapeyronslope of melting for MgO is likely higher than that of MgSiO3
perovskite, which could potentially result in a strong pressuredependence in the MgO–MgSiO3 eutectic composition.
The ambient pressure MgO–SiO2 phase diagram, first mappedout by Bowen and Andersen (1914), suggests a number ofintriguing questions regarding potential high pressure phenom-ena. The system exhibits liquid immiscibility in high-silica com-positions (Hageman and Oonk, 1986), a very large contrastbetween the liquidus temperatures at intermediate (geological)compositions and MgO (Riley, 1966), a eutectic between MgOpericlase and MgSiO4 forsterite, another eutectic between MgSiO3
enstatite and SiO2 cristobalite, and a peritectic by which enstatitemelts into a slightly more SiO2-rich liquid phase co-existing withforsterite.
Low pressure liquid immiscibility, notably also observed in theCaO–SiO2 (Hageman and Oonk, 1986) and FeO–SiO2 (Bowen andSchairer, 1935) systems, has been shown to vanish by around5 GPa (Dalton and Presnall, 1997). If this phenomenon reappearsat lower mantle pressures, an idea as yet untested by experiment
N. de Koker et al. / Earth and Planetary Science Letters 361 (2013) 58–63 59
or simulation, the geochemical evolution of a cooling magmaocean, and subsequently the mantle, would be significantly morecomplex than current models assume.
Description of incongruent melting in the deep mantlerequires knowledge of the liquid Gibbs free energy as a functionnot only of pressure and temperature, but also of composition,GðP,T,XÞ. Numerous studies have considered congruent melting ofmantle phases, thus implicitly taking account of GðP,TÞ, but ourknowledge of the behavior of liquid free energy with compositionat deep mantle pressures remains sparse. Some clues to thenature of GðXÞ are obtained from comparisons between measure-ments of shock compressed liquid volume (Asimow and Ahrens,2010), and studies of the crystallization sequence at deep mantleconditions (Fiquet, 2010; Ito et al., 2004).
Here we use first-principles molecular dynamics (FPMD) todescribe the thermodynamics of mixing in the MgO–SiO2 system,and subsequently derive the chemical potential for the system.We apply this description to constrain incongruent meltingequilibria for the lower mantle.
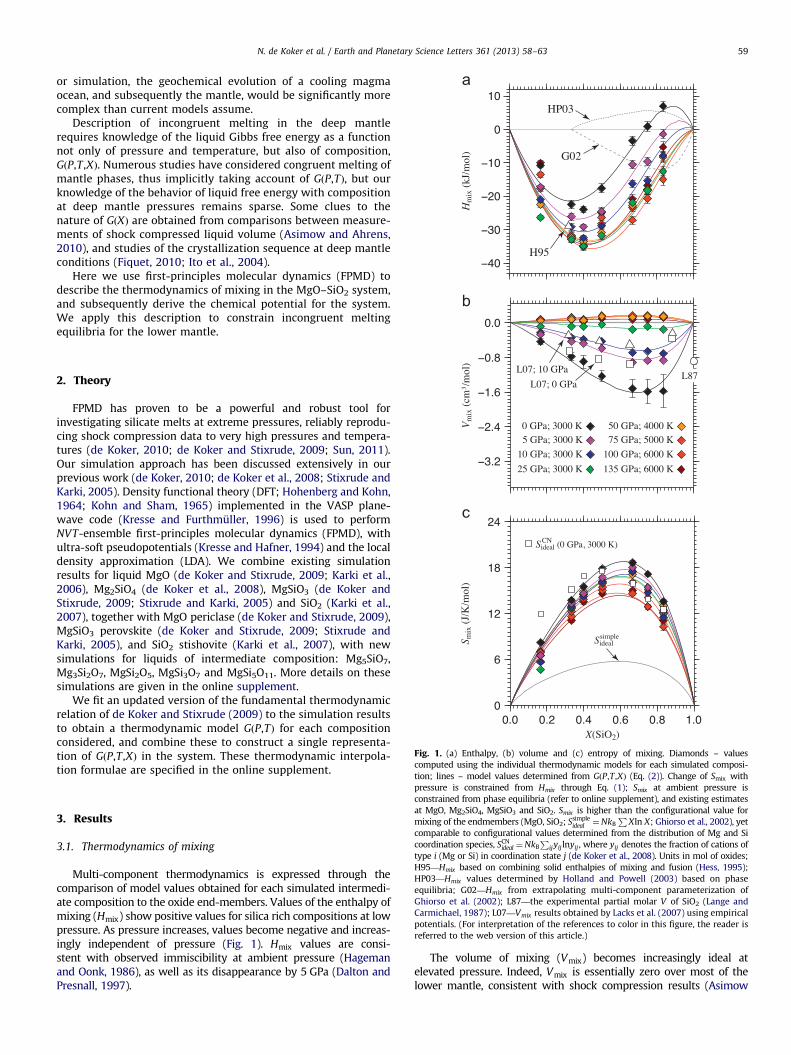
Fig. 1. (a) Enthalpy, (b) volume and (c) entropy of mixing. Diamonds – values
computed using the individual thermodynamic models for each simulated composi-
tion; lines – model values determined from GðP,T ,XÞ (Eq. (2)). Change of S with
2. Theory
FPMD has proven to be a powerful and robust tool forinvestigating silicate melts at extreme pressures, reliably reprodu-cing shock compression data to very high pressures and tempera-tures (de Koker, 2010; de Koker and Stixrude, 2009; Sun, 2011).Our simulation approach has been discussed extensively in ourprevious work (de Koker, 2010; de Koker et al., 2008; Stixrude andKarki, 2005). Density functional theory (DFT; Hohenberg and Kohn,1964; Kohn and Sham, 1965) implemented in the VASP plane-wave code (Kresse and Furthmuller, 1996) is used to performNVT-ensemble first-principles molecular dynamics (FPMD), withultra-soft pseudopotentials (Kresse and Hafner, 1994) and the localdensity approximation (LDA). We combine existing simulationresults for liquid MgO (de Koker and Stixrude, 2009; Karki et al.,2006), Mg2SiO4 (de Koker et al., 2008), MgSiO3 (de Koker andStixrude, 2009; Stixrude and Karki, 2005) and SiO2 (Karki et al.,2007), together with MgO periclase (de Koker and Stixrude, 2009),MgSiO3 perovskite (de Koker and Stixrude, 2009; Stixrude andKarki, 2005), and SiO2 stishovite (Karki et al., 2007), with newsimulations for liquids of intermediate composition: Mg5SiO7,Mg3Si2O7, MgSi2O5, MgSi3O7 and MgSi5O11. More details on thesesimulations are given in the online supplement.
We fit an updated version of the fundamental thermodynamicrelation of de Koker and Stixrude (2009) to the simulation resultsto obtain a thermodynamic model GðP,TÞ for each compositionconsidered, and combine these to construct a single representa-tion of GðP,T ,XÞ in the system. These thermodynamic interpola-tion formulae are specified in the online supplement.
mix
pressure is constrained from Hmix through Eq. (1); Smix at ambient pressure is
constrained from phase equilibria (refer to online supplement), and existing estimates
at MgO, Mg2SiO4, MgSiO3 and SiO2. Smix is higher than the configurational value for
mixing of the endmembers (MgO, SiO2; Ssimpleideal
¼NkBP
Xln X; Ghiorso et al., 2002), yet
comparable to configurational values determined from the distribution of Mg and Si
coordination species, SCNideal ¼NkB
Pijyijlnyij , where yij denotes the fraction of cations of
type i (Mg or Si) in coordination state j (de Koker et al., 2008). Units in mol of oxides;
H95—Hmix based on combining solid enthalpies of mixing and fusion (Hess, 1995);
HP03—Hmix values determined by Holland and Powell (2003) based on phase
equilibria; G02—Hmix from extrapolating multi-component parameterization of
Ghiorso et al. (2002); L87—the experimental partial molar V of SiO2 (Lange and
Carmichael, 1987); L07—Vmix results obtained by Lacks et al. (2007) using empirical
potentials. (For interpretation of the references to color in this figure, the reader is
referred to the web version of this article.)
3. Results
3.1. Thermodynamics of mixing
Multi-component thermodynamics is expressed through thecomparison of model values obtained for each simulated intermedi-ate composition to the oxide end-members. Values of the enthalpy ofmixing (Hmix) show positive values for silica rich compositions at lowpressure. As pressure increases, values become negative and increas-ingly independent of pressure (Fig. 1). Hmix values are consi-stent with observed immiscibility at ambient pressure (Hagemanand Oonk, 1986), as well as its disappearance by 5 GPa (Dalton andPresnall, 1997).
The volume of mixing (Vmix) becomes increasingly ideal atelevated pressure. Indeed, Vmix is essentially zero over most of thelower mantle, consistent with shock compression results (Asimow

Fig. 2. Melting phase diagram for the MgO–SiO2 system in the lower mantle
(heavy red lines). Thinner green and blue lines indicate liquidi adjusted for
indicated Mg# values (refer to online supplement); diamonds indicate the
corresponding solidus points on the cotectic. Error bars represent uncertainty
due to FPMD simulations and the partition coefficient used in adjusting for Fe
(Trønnes and Frost, 2002). Stishovite metastability above 40 GPa is negligible in
the CaCl2-structure stability field, with the change to seifertite above 110 GPa
(Oganov et al., 2005) resulting in a small increase in melting temperature (pink
line, determined using the Clapeyron relation). Experimental measurements are
shown by grey boxes; at 24 GPa, (A) MgO–SiO2 eutectic (Presnall et al., 1998), (B)
peridotite eutectic (Ito et al., 2004); at 136 GPa, (C) shock melting of Fo90 (Holland
and Ahrens, 1997), (D) peridotite solidus and liquidus (Fiquet, 2010), (E) extra-
polated high P melting of MORB (Hirose et al., 1999). Pe—periclase, Se—seifertite,
St—stishovite, Pv—perovskite, Lq—liquid, Harz—harzburgite, Pyr—pyrolite. Inset:
Variation of Pe–Pv (red, left) and Pv–St (blue, right) eutectic compositions with
pressure. Depending on the composition of a peridotitic magma ocean, Pe or Pv
will be the liquidus phase at different depths in the mantle. (For interpretation of
the references to color in this figure legend, the reader is referred to the web
version of this article.)
N. de Koker et al. / Earth and Planetary Science Letters 361 (2013) 58–6360
and Ahrens, 2010). Negative volumes of mixing seen at ambientpressure highlight the fact that applying constant partial molarvolumes to a large compositional range must be done with caution(Ghiorso et al., 2002; Lange and Carmichael, 1987).
Together, Vmix and the pressure dependence of Hmix constrainthe pressure dependence of the entropy of mixing Smix through
T@Smix
@P
� �T
¼@Hmix
@P
� �T
�Vmix ð1Þ
Smix itself is determined by integrating Eq. (1), with the integra-tion constant fixed by matching to experimental phase equilibriaat ambient pressure (refer to online supplement). The variation ofSmix with pressure relative to this fixed point is fully constrainedby our FPMD results.
We find that prominent liquid immiscibility at low pressure inthe MgO–SiO2 system, known to vanish with increasing pressure,remains absent throughout the lower mantle. The increasinglylinear nature of mixing of volume and enthalpy as pressureincreases is consistent with results from shock compression ofliquid silicates, although these experiments were conducted insomewhat different compositions over a notably smaller varia-tions of silica contents (Asimow and Ahrens, 2010).
We fit the excess Gibbs free energy of mixing using anasymmetric regular solution model (Haselton and Newton, 1980;Thompson Jr., 1967)
Gmix ¼ GidealþWAY2 1�Yð ÞþWBY 1�Yð Þ2, ð2Þ
with Wi interaction parameters, and Y ¼ X=½Xþl 1�Xð Þ�, so thatY¼X when l¼1, and la1 allows for additional asymmetry in Gmix.Taking X ¼ X SiO2ð Þ, our low pressure enthalpy of mixing resultsrequire l¼1.43. Previous studies of thermodynamics of mixing insilicate systems have also suggested la1 (Burnham, 1975; Hess,1995; Zhou and Miller, 1997). Although more complex andostensibly more physical models have been developed, we choose(2) for its simplicity, continuity, and the empirical fact that it worksvery well in representing our FPMD results. We note that someprevious studies have interpreted values of l different from unityin terms of the compositions of complexes that are mixing, forexample Si2O4 instead of SiO2, or Mg2O2 instead of MgO (Hess,1995). However, we find no simple relationship between the valueof l required to match our FPMD results and the liquid structuresobserved in our simulations, which contain multiple species at alltemperatures (de Koker, 2010; de Koker et al., 2008; Stixrude andKarki, 2005) that change with compression.
With Gmix constrained, we can derive all other thermodynamicproperties at any composition along the join, including H, V , S,(Fig. 1) and the chemical potential m,
mA ¼@G
@XAð3Þ
3.2. High pressure MgO–SiO2 phase diagram
We find that the MgO–SiO2 phase diagram at lower mantleconditions is bi-eutectic (Fig. 2). The compositions of the twoeutectic points vary only weakly with pressure, correspondingclosely to values characteristic of peridotite and basalt, respec-tively. The periclase-perovskite eutectic shifts by about 2 mol %towards MgO between 25 and 60 GPa, consistent with experi-mental observations (Fiquet, 2010; Ito et al., 2004). For a perido-titic magma ocean, this signals a change in the liquidus phasefrom periclase at shallow depths to perovskite at greater depth,with the position of the transition depending sensitively oncomposition.
Solidus temperatures for the MgO–SiO2 system at the base ofEarth’s mantle (136 GPa) are 49307170 K and 45807210 K for
Xo0.5 and X40.5, respectively. Based on scaling arguments, weestimate that replacement of 10 mol% MgO by FeO (Mg#¼90) willlower the periclase-perovskite solidus temperature by 180–320 K;for Mg#¼80, representative of basaltic oceanic crust, the silica–perovskite solidus will be decreased by a similar amount. Theseestimates are determined by adjusting the chemical potential ofliquid and solid for a given FeO concentration (refer to onlinesupplement), using KMF¼0.4070.15 as an estimate of the partitioncoefficient between solid and melt (Trønnes and Frost, 2002). Thetheoretical basis for this adjustment in the chemical potential isexplained in detail in section S4 of the online supplement.
3.3. Liquid structure as a function of composition
Structural adjustment in response to compression is mostreadily expressed in terms of the coordination of O around Siatoms, ZSi–O, while the nature and extent of polymerization is bestconsidered through ZO–Si, the coordination of Si around O atoms.Coordination numbers are computed as the appropriately normal-ized area under the first peak of the radial distribution function (deKoker et al., 2008; McQuarrie, 1984). ZO–Si values of intermediatecompositions vary continuously along the binary, with multipleO-coordination species present at each composition (Fig. 3). For agiven degree of compression relative to the volume at ambientpressure, ZSi–O values do not vary notably along the binary, but do

Fig. 3. The distribution of oxygen species at 6000 K and 136 GPa (top), and 3000 K
and 0 GPa (bottom). OF–ZO–Si¼0, ON–ZO–Si¼1, OB–ZO–Si¼2, O3–ZO–Si¼3, O4–ZO–Si¼4.
Fig. 4. (a) Silicon coordination ZSi�O increases from 4 to 6 for all species considered
upon two fold compression relative to V0, the volume at 0 GPa and 3000 K as.
determined from fitting the equation of state along the join. However the increase is
notably delayed in SiO2. (b) The Gruneisen parameter g for all liquids on the join
increases with compression and MgO content. The delay in its increase for SiO2
reflects the delayed increase in ZSi–O. T increases from 3000 K at V0 to 6000 K at
0.5V0. Note that here individual colors denote degrees of compression: red—0.5V0,
yellow—0.6V0, green—0.7V0, blue—0.8V0, magenta—0.9V0, black—1.0V0. (For inter-
pretation of the references to color in this figure legend, the reader is referred to the
web version of this article.)
N. de Koker et al. / Earth and Planetary Science Letters 361 (2013) 58–63 61
show a stark contrast with pure SiO2 (Fig. 4a). ZSi–O increasesuniformly from 4 to 6 over a two-fold compression range relativeto V0, the volume at 0 GPa and 3000 K, i.e. V=V0¼1.0 to V=V0¼0.5.However in pure SiO2 compression is initially accommodated by anincrease in the mean framework ring-size (Karki et al., 2007;Stixrude and Bukowinski, 1990), with coordination change becom-ing the primary compression mechanism around V=V0¼0.8(�4 GPa, depending on T), from where coordination changesdominate strongly.
The changes in liquid structure with pressure and composi-tion are strongly reflected by the thermodynamic properties.The Gruneisen parameter (g) increases with compression for allliquids along the join, albeit delayed in SiO2, and highlights therelation between g and ZSi–O (Fig. 4b). In solids, high pressurephase transitions involving an increase in ZSi–O result in notableincreases in g, with similar effects predicted for other cations,including Mg2þ (Jeanloz and Roufosse, 1982). The increase of gwith MgO content, and its notably weaker volume dependence inMgO suggests that Mg–O bonds have intrinsically higher g values,less sensitive to changes in bond length. Density decreases withincreasing silica content at low pressure, but increases withincreasing silica content at high pressure. The greater compres-sibility at the silica rich end is consistent with the collapse of theinitially open framework structure for silica rich compositionsand is reflected in the decrease of the values of the reference bulkmodulus K0 from 24 GPa in the Mg-rich compositions to 12.5 GPain silica-rich compositions. This decrease in bulk modulus isaccompanied by an increase in K0
0 from �5.6 to �6.5 (Table 1),consistent with the K0–K0
0 anti-correlation observed in silicateliquids (Lange, 2007) Fig. 5.
The differences in compressibility and partial molar volume atdifferent compositions are also reflected in the disappearanceof liquid immiscibility with pressure. Liquid immiscibility isoften ascribed to the Coulombic effects (Hudon and Baker,2002; McGahay and Tomozawa, 1989), by which the small sizeand high charge of the Mgþ2 ion is difficult to accommodate inthe high SiO2 compositions, resulting in energetically less favor-able structures in the liquid with increased internal energy values(Hudon and Baker, 2002). However, the volumetric advantage of asingle phase assemblage grows dominant with pressure, so thattwo less dense liquid phases has a higher enthalpy than a singledense phase with somewhat unfavorable structural species.
Therefore, immiscibility arising due to similar structural accommoda-tion problems is unlikely to arise in liquids at high pressures.
4. Geophysical implications
The fact that the MgO–MgSiO3 eutectic composition changeslittle over the entire lower mantle pressure range may at firstseem a simple and unsurprising result. Yet the increasing contrastbetween congruent melting curves of MgO and MgSiO3 has leadto large differences in speculated eutectic compositions (Boehler,1996; Miller et al., 1991; Zhou and Miller, 1997). A high MgOmelting temperature relative to MgSiO3 could potentially evenexpress itself as a peritectic, with MgSiO3 melting incongruentlyinto an SiO2-rich liquid and MgO periclase as residuum. If thesimilarity of the eutectic composition to that of peridotite is notsimply a coincidence, the fact that it does not change much as afunction of pressure raises the enticing possibility that extrasolarplanets with non-volatile bulk compositions similar to that of thesun could also have mantles that are Earth-like in composition.
Computed eutectic temperatures are similar to estimates oftemperatures reached in the thermal boundary layer at the base

Table 1Thermodynamic properties of liquids on the MgO–SiO2 binary at 0 GPa and 3000 K.
MgO Mg5SiO7 Mg2SiO4 Mg3Si2O7 MgSiO3 MgSi2O5 MgSi3O7 MgSi5O11 SiO2
V/V0 16.46 (1) 107.50 (1) 58.40 (8) 100.50 (8) 41.8 (1) 67.50 (9) 93.50 (8) 146.00 (1) 27.8 (2)
KT (GPa) 33.49 (5) 24.33 (2) 19.50 (9) 18.35 (4) 17.2 (1) 12.92 (6) 12.53 (6) 13.06 (5) 6.2 (3)
KS (GPa) 41.75 (9) 29.49 (7) 20.70 (7) 19.55 (4) 18.1 (1) 13.10 (6) 12.96 (10) 13.20 (3) 6.2 (4)
KT0 4.81 5.61 5.99 5.97 6.17 6.9 6.72 5.16 14.94
a (10-6 K�1) 95 (1) 107 (1) 65 (2) 71 (1) 65 (2) 40 (1) 63 (2) 35 (3) 39 (3)
S (J/mol K)a 174.1 (2) 1125.4 (5) 595.1 (3) 1010.8 (5) 415.3 (2) 641.1 (5) 859.3 (7) 1283.2 (17) 205.5 (5)
CV (NkB) 3.6 (2) 3.9 (1) 4.1 (4) 4.2 (2) 4.2 (4) 4.5 (3) 4.4 (3) 4.5 (2) 4.6 (2)
CP (NkB) 4.5 (3) 4.8 (2) 4.4 (5) 4.5 (3) 4.4 (4) 4.5 (4) 4.6 (4) 4.6 (3) 4.6 (2)
g 0.87 (1) 0.66 (1) 0.31 (1) 0.31 (1) 0.27 (1) 0.12 (1) 0.18 (1) 0.10 (1) 0.06 (2)
a Based on entropy of mixing, anchored on Mg2SiO4 and SiO2.
Fig. 5. Liquid density along lines of constant pressure along the MgO–SiO2 join
reveals the greater compressibility of high SiO2 mixtures, with the compressibility
of pure SiO2 notably higher. Colors are coded as in Fig. 1, with lines obtained from
the thermodynamic model. (For interpretation of the references to color in this
figure legend, the reader is referred to the web version of this article.)Fig. 6. (top) Density contrasts between solid and cotectic melt predicted during
crystallization of a pyrolytic magma ocean. Note the opposing density contrasts
of melt with perovskite (Pv) and periclase (Pe), and that a large degree of liquid
fractionation is required for Pv to float. (bottom) Contrasts associated with
melting indicate that partial melts of peridotitic (Pyr) and basaltic (Bas) lithologies
will be gravitationally stable at the core–mantle boundary. Densities are com-
puted at the corresponding eutectic temperatures.
N. de Koker et al. / Earth and Planetary Science Letters 361 (2013) 58–6362
of Earth’s mantle (TCMB), and after the likely decrease due to otherchemical elements on the solidus are taken into account, con-sistent with the proposal that seismic ultra-low velocity zonesrepresent regions of partially molten mantle (Labrosse et al.,2007; Williams and Garnero, 1996). Consistent with previousanalyses (Zhou and Miller, 1997), we find that the solidus ofenriched materials (X40.5) is substantially less than that ofprimitive material, and will likely bracket the upper part of therange of estimates for TCMB. The presence of relatively small scaleenriched mantle heterogeneities may therefore explain the obser-vation that ultra-low velocity zones are relatively localized(Williams and Garnero, 1996).
Analysis of solid-melt density contrasts indicate that partialmelts of both basalt and peridotite will be gravitationally stableat the base of Earth’s mantle. In the Fe-free system, liquids ofeutectic composition are less dense than the isochemical solidaggregate, but inclusion of appropriate concentrations of Ferenders melts in both these systems negatively buoyant. Thesefindings are consistent with previous analyses of the melting ofperovskite (Stixrude and Karki, 2005), and are strengthened byrecent indications that changes in spin state of Fe in silicate meltsfacilitates Fe partitioning into the liquid (Nomura et al., 2011).
Liquidus density contrasts relevant to a crystallizing pyrolyticmagma ocean show that newly crystallized perovskite will sink,while periclase will float (Fig. 6). With perovskite enriched inincompatible elements relative to ferropericlase, this contrast canact as a vector for chemical differentiation. CaSiO3 perovskite is
about 4% denser than MgSiO3 perovskite (Stixrude and Lithgow-Bertelloni, 2005), so that its additional affinity for incompatibleelements will enhance this divergence; only after significant frac-tionation and enrichment of the liquid in iron will the remainingliquid phase be dense enough for perovskite to float.
The density contrast between crystal and liquid is a funda-mental parameter controlling the process of crystal settling in amagma ocean. The fluid dynamics of this process are however stillpoorly understood and it is unclear to what extent slowly sinkingcrystals would gradually settle out or remain entrained in athe background flow (Solomatov, 2007). Stokes settling velocitiesdetermined from these density contrasts are between 10�2 and10�6 m/s, depending on the crystal size and liquid viscosity (Karkiand Stixrude, 2010; Martin and Nokes, 1989; Sparks et al., 1984),much smaller than plausible convective velocities associated witha vigorously convecting magma ocean.
5. Conclusions
First principles molecular dynamics simulations based on densityfunctional theory is now capable of treating chemically rich systems

N. de Koker et al. / Earth and Planetary Science Letters 361 (2013) 58–63 63
with multiple stable phases and extensive solution. Our results onthe MgO–SiO2 join show bi-eutectic melting throughout the lowermantle with a slightly lower eutectic temperature on the enrichedside. The eutectic compositions are remarkably stable with increas-ing pressure and correspond closely to basaltic and peridotitic bulkcompositions. The simulations simultaneously and self-consistentlypredict the density contrast between co-existing liquid and crystals.At the mantle solidus, liquids are denser than co-existing solids,providing a plausible explanation for the origin of ultra-low velocityzones at the base of the mantle in terms of partial melt. At themagma ocean liquidus, crystal buoyancy varies with phase, withperovskites tending to sink and periclase tending to float. Theseresults place important constraints on the presence of melt at thebase of the present-day mantle and on the chemical evolution of theputative magma ocean.
Appendix A. Supplementary material
Supplementary data associated with this article can be found inthe online version at http://dx.doi.org/10.1016/j.epsl.2012.11.026.
References
Asimow, P.D., Ahrens, T.J., 2010. Shock compression of liquid silicates to 125 GPa:the anorthite-diopside join. J. Geophys. Res. 115, B10209, http://dx.doi.org/10.1029/2009JB007145.
Boehler, R., 1996. Melting temperature of the Earth’s mantle and core: Earth’sthermal structure. Annu. Rev. Earth Planet. Sci. 24, 15–40.
Bowen, N.L., Andersen, O., 1914. The binary system MgO–SiO2. Am. J. Sci. 37,487–500.
Bowen, N.L., Schairer, J.F., 1935. The system, MgO–FeO–SiO2. Am. J. Sci. 29, 151–217.Canup, R.M., 2004. Simulations of a late lunar-forming impact. ICARUS 168,
433–456.Dalton, J.A., Presnall, D.C., 1997. No liquid immiscibility in the system MgSiO3–
SiO2 at 5.0 GPa. Geochim. Cosmochim. Acta 61, 2367–2373.de Koker, N., 2010. Structure, thermodynamics, and diffusion in CaAl2Si2O8 liquid
from first-principles molecular dynamics. Geochim. Cosmochim. Acta 74,5657–5671.
de Koker, N., Stixrude, L., 2009. Self-consistent thermodynamic description ofsilicate liquids, with application to shock melting of MgO periclase and MgSiO3
perovskite. Geophys. J. Int. 178, 162–179.de Koker, N., Stixrude, L., Karki, B.B., 2008. Thermodynamics, structure, dynamics,
and freezing of Mg2SiO4 liquid at high pressure. Geochim. Cosmochim. Acta72, 1427–1441, http://dx.doi.org/10.1016/j.gca.2007.12.019.
Fiquet, G., 2010. Melting of peridotite to 140 gigapascals. Science 329, 1516–1518.Ghiorso, M.S., Hirschmann, M.M., Reiners, P.W., Kress, V.C., 2002. The pMELTS: a
revision of MELTS for improved calculation of phase relations and majorelement partitioning related to partial melting of the mantle to 3 GPa.Geochem. Geophy. Geosyst. 3, http://dx.doi.org/10.1029/2001GC000217.
Hageman, V.B.M., Oonk, H.A.J., 1986. Liquid immiscibility in the SiO2þMgO, SiO2þSrO,SiO2þLaO3, and SiO2þY2O3 systems. Phys. Chem. Glasses 27, 194–198.
Haselton, H.T., Newton, R.C., 1980. Thermodynamics of pyrope-grossular garnetsand their stabilities at high temperatures and high pressures. J. Geophys. Res.85, 697306982.
Hess, P.C., 1995. Thermodynamic mixing properties and the structure of silicatemelts. In: Stebbins, J.F., McMillan, P.F., Dingwell, D.B. (Eds.), Structure,Dynamics and Properties of Silicate Melts. Mineralogical Society of America,Washington, D.C.
Hirose, K., Fei, Y., Ma, Y., Mao, H.K., 1999. The fate of subducted basaltic crust inthe Earth’s lower mantle. Nature 397, 53–56.
Hohenberg, P., Kohn, W., 1964. Inhomogeneous electron gas. Phys. Rev. B 136, B864.Holland, K.G., Ahrens, T.J., 1997. Melting of (Mg,Fe)2SiO4 at the core–mantle
boundary of the Earth. Science 275, 1623–1625.Holland, T., Powell, R., 2003. Activity–composition relations for phases in petro-
logical calculations: an asymmetric multicomponent formulation. Contrib.Mineral. Petrol 145, 492–501.
Hudon, P., Baker, D.R., 2002. The nature of phase separation in binary oxide meltsand glasses. I. Silicate systems. J. Non-Cryst. Solids 303, 299–345.
Ito, E., Kubo, A., Katsura, T., Walter, M.J., 2004. Melting experiments of mantlematerials under lower mantle conditions with implications for magma oceandifferentiation. Phys. Earth Planet. Interiors 143–144, 397–406.
Jeanloz, R., Roufosse, M., 1982. Anharmonic properties—ionic model of the effectsof compression and coordination change. J. Geophys. Res. 87, 763–772.
Karki, B., Stixrude, L., 2010. Viscosity of MgSiO3 liquid at Earth’s mantle condi-tions: implications for an early magma ocean. Science 238, 740–743.
Karki, B.B., Bhattarai, D., Stixrude, L., 2006. First principles calculations of thestructural, dynamical and electronic properties of liquid MgO. Phys. Rev. B 73,174208.
Karki, B.B., Bhattarai, D., Stixrude, L., 2007. First-principles simulations of liquidsilica: structural and dynamical behavior at high pressure. Phys. Rev. B 76,104205.
Ke, Y., Solomatov, V.S., 2006. Early transient superplumes and the origin of theMartian crustal dichotomy. J. Geophys. Res., 111, http://dx.doi.org/10.1029/2005JE002631.
Kohn, W., Sham, L.J., 1965. Self-consistent equations including exchange andcorrelation effects. Phys. Rev. 140, 1133.
Kresse, G., Furthmuller, J., 1996. Efficiency of ab-initio total energy calculations formetals and semiconductors using a plane-wave basis set. Comput. Mater. Sci.6, 15–50.
Kresse, G., Hafner, J., 1994. Norm-conserving and ultrasoft pseudopotentials forfirst-row and transition-elements. J. Phys. Condens. Matter 6, 8245–8257.
Labrosse, S., Hernlund, J., Coltice, N., 2007. A crystallizing dense magma ocean atthe base of the Earth’s mantle. Nature 450, 866–869.
Lacks, D.J., Rear, D.B., Van Orman, J.A., 2007. Molecular dynamics investigation ofviscosity, chemical diffusivities and partial molar volumes of liquids along theMgO–SiO2 join as functions of pressure. Geochim. Cosmochim. Acta 71,1312–1323.
Lange, R.A., 2007. The density and compressibility of KAlSi3O8 liquid to 6.5 GPa.Am. Mineral. 92, 114–123.
Lange, R.A., Carmichael, I.S.E., 1987. Densities of Na2O–K2O–CaO–MgO–FeO–Fe2O3–Al2O3–TiO2–SiO2 liquids—new measurements and derived partialmolar properties. Geochim. Cosmochim. Acta 51, 2931–2946.
Martin, D., Nokes, R., 1989. A fluid-dynamical study of crystal settling inconvecting magmas. J. Petrol. 30, 1471–1500.
McGahay, V., Tomozawa, M., 1989. The origin of phase separation in silicate meltsand glasses. J. Non-Cryst. Solids 109, 27–34.
McQuarrie, D.A., 1984. Statistical Mechanics. University Science Books, Sausalito,CA.
Miller, G.H., Stolper, E.M., Ahrens, T.J., 1991. The equation of state of a moltenKomatiite. 2. Application to Komatiite petrogenesis and the Hadean mantle.J. Geophys. Res. 96, 11849–11864.
Mosenfelder, J.L., Asimow, P.D., Ahrens, T.J., 2007. Thermodynamic properties ofMg2SiO4 liquid at ultra-high pressures from shock measurements to 200 GPaon forsterite and wadsleyite. J. Geophys. Res., 112, http://dx.doi.org/10.1029/2006JB004364.
Nomura, R., Ozawa, H., Tateno, S., Hirose, K., Hernlund, J., Muto, Y., Ishii, H.,Hiraoka, N., 2011. Spin crossover and iron-rich silicate melt in the Earth’s deepmantle. Nature 473, 199–202.
Oganov, A.R., Gillan, M., Price, G.D., 2005. Structural stability of silica at highpressures and temperatures. Phys. Rev. B 71, 064104.
Presnall, D.C., Weng, Y.-H., Milholland, C.S., Walter, M.J., 1998. Liquidus phaserelations in the system MgO–MgSiO3 at pressures up to 25 GPa—constraintson crystallization of a molten Hadean mantle. Phys. Earth Planet. Interiors 107,83–95.
Riley, B., 1966. The Determination of melting points at temperatures above20001 Celcius. Revue international des hautes temperatures et des refractaires3, 327–336.
Solomatov, V.S., 2007. Magma oceans and primordial mantle differentiation.In: Schubert, G. (Ed.), Treatise on Geophysics, vol. 9. Evolution of the Earth.Elsevier, Amserdam.
Sparks, R.S.J., Huppert, H.E., Turner, J.S., 1984. The fluid dynamics of evolvingmagma chambers. Philos. Trans. R. Soc. London Ser. A 310, 511–534.
Stixrude, L., Bukowinski, M.S.T., 1990. A novel topological compression mechanismin a covalent liquid. Science 250, 541–543.
Stixrude, L., de Koker, N., Sun, N., Mookherjee, M., Karki, B.B., 2009. Thermo-dynamics of silicate liquids in the deep Earth. Earth Planet. Sci. Lett. 278,226–232.
Stixrude, L., Karki, B., 2005. Structure and freezing of MgSiO3 liquid in Earth’slower mantle. Science 310, 297–299.
Stixrude, L., Lithgow-Bertelloni, C., 2005. Thermodynamics of mantle minerals—I.Physical properties. Geophys. J. Int. 162, 610–632.
Sun, N., 2011. First principles molecular dynamics simulations of diopside (CaMg-Si2O6) liquid to high pressure. Geochim. Cosmochim. Acta 75, 3792–3802.
Thompson Jr., J.B., 1967. Thermodynamic properties of simple solutions. Res.Geochem. 2, 340–361.
Trønnes, R.G., Frost, D.J., 2002. Peridotite melting and mineral-melt partitioning ofmajor and minor elements at 22–24.5 GPa. Earth Planet. Sci. Lett. 197,117–131.
Williams, Q., Garnero, E.J., 1996. Seismic evidence for partial melt at the base ofEarth’s mantle. Science 273, 1528–1530.
Zhou, Y., Miller, G.H., 1997. Constraints from molecular dynamics on the liquidusand solidus of the lower mantle. Geochim. Cosmochim. Acta 61, 2957–2976.
Supplimentary Online Material:
Multi-Component Melting of Earth’s Lowermost Mantle
from First Principles
Nico de Koker, Bijaya Karki, Lars Stixrude
November 3, 2012
1
S1 Details of FPMD SimulationsS1
The new intermediate compositions simulated are Mg5SiO7, Mg3Si2O7, MgSi2O5,S2
MgSi3O7, and MgSi5O11. Simulation cells have 78, 72, 72, 66, and 75 atoms, respec-S3
tively. These intermediate systems are initiated by removing and/or transformingS4
an appropriate number of atoms from either MgSiO3 or Mg2SiO4 and evolving theS5
resulting high energy configuration to a favorable state at 10000 K for at least 6000S6
time steps by FPMD; in all calculations in this work 1 time step = 1 femto second.S7
Results obtained in test simulations initiated using geometries generated by classi-S8
cal molecular dynamics runs of 1 nano second differed negligibly from the FPMDS9
production runs.S10
For compositions with no stable solid phases with which to compute the correctionS11
for the systematic overbinding in LDA, values are interpolated along the join using theS12
known values for MgO, Mg2SiO4, MgSiO3 and SiO2 (Figure S1; Karki and Stixrude,S13
2010; de Koker and Stixrude, 2009; de Koker et al., 2008; Karki et al., 2007, 2006;S14
Stixrude and Karki, 2005).S15
S2 Fundamental Thermodynamic RelationsS16
S2.1 Description of LiquidsS17
The liquid-state fundamental relation (LFTR) we use to model the thermodynamicsS18
of each simulated liquid composition was described in detail in de Koker and StixrudeS19
(2009). The relation uses the Helmholtz free energy as thermodynamic potential,S20
expressed as a function of its natural variablesS21
F (V, T ) = Fig(V, T ) + Fel(V, T ) + Fxs(V, T ), (S1)
by considering three separate contributions due to atomic momenta Fig(V, T ), elec-S22
tronic excitation Fel(V, T ), and bonding Fxs(V, T ), respectively.S23
Fxs(V, T ) is written as a two-dimensional expansion in terms of functions f(V )S24
(Eulerian finite strain) and θ(T ) about the reference volume and temperature V0 andS25
T0,S26
Fxs(V, T ) =
O′
f∑
i=0
O′
θ∑
j=0
aij
i!j!f iθj; (S2)
S27
f =1
2
[
(
V0
V
)2
3
− 1
]
; θ =
[(
T
T0
)m
− 1
]
. (S3)
2

Fel is given byS28
Fel(V, T ) = −ζ
[
1
2
(
T 2− T 2
el
)
− TTel lnT
Tel
]
, (S4)
which follows by integration of the electronic heat capacity for a conductor, modifiedS29
to account for the liquid being conductive only above Tel, with ζ the electronic heatS30
capacity coefficient. The volume dependence of ζ and Tel is described using powerS31
law relationsS32
ζ = ζ0
(
V
V0
)ξ
; Tel = Tel0
(
V
V0
)η
, (S5)
with ζ0, ξ, Tel0, and η free parameters to be determined.S33
Fig is the free energy of an ideal gas with a composition corresponding to that ofS34
the liquid (eg. Callen, 1985; McQuarrie, 1984)S35
Fig(V, T ) = −kBT∑
i
Ni lneqi
Ni, (S6)
with the partition functionS36
qi = V(
mikB/2πh2)3/2
, (S7)
with mi the atomic mass element i.S37
To obtain the level of accuracy in fitting of the LFTR to our FPMD resultsS38
required for considering the thermodynamics of mixing, we use second order tem-S39
perature fits (Oθ = 2). We find that MgO, Mg5SiO7, Mg2SiO4, Mg3Si2O7, MgSiO3,S40
MgSi2O5, and MgSi3O7 are well fit by a third order finite strain expansion (Of = 3),S41
while MgSi5O11 requires Of = 4, and SiO2 Of = 5, consistent with our previousS42
findings (de Koker and Stixrude, 2009). Fits for each composition are shown in Fig-S43
ures S2-S10, with thermodynamic properties at 0 GPa and 3000 K reported in TableS44
1 of the main text.S45
S2.2 Description of SolidsS46
Thermodynamics of FPMD solids are described using the anharmonic relation forS47
high T solids (SFTR) explained in de Koker and Stixrude (2009); for completenessS48
we briefly summarize it here. The Helmholtz free energy of the solid is written asS49
F (V, T ) = F (V0, T0) + Fcmp(V, T0) + Fth(V, T ), (S8)
with F (V0, T0) the free energy at reference volume V0 and temperature T0, Fcmp(V, T0)S50
the contribution due to isothermal compression, and Fth(V, T ) that due to isochoricS51
temperature differences relative to T0.S52
3

Fcmp is expressed as an expansion in terms of the Eulerian finite strain (f) (Birch,S53
1952, 1978)S54
Fcmp = 9KT0V0
[
1
2f2 +
1
6a3f
3 + · · ·
]
, (S9)
a3 = 3(
K ′T0 − 4
)
, (S10)
V0, KT0, and K ′T0 being the volume, bulk modulus, and its first pressure derivativeS55
at zero pressure and a reference temperature T0.S56
Fth is obtained by integration of the entropy asS57
Fth(V, T ) = −S0 [T − T0] − CV
[
T lnT
T0− [T − T0]
]
− CV [T − T0]
∫ V
V0
γ(V ′, T0)
V ′dV ′,
(S11)
where S0 is the entropy at zero pressure and reference temperature, CV is the heatS58
capacity at volume V , assumed to be constant as a function of T though not con-S59
strained to a harmonic value of 3NkB, and γ is the Gruneisen parameter, describedS60
as (Stixrude and Lithgow-Bertelloni, 2005)S61
γ =γ′0 + (2γ′
0 + γ′1) f + 2γ′
1f2
3 (2 + 2γ′0f + γ′
1f2)
, (S12)
withS62
γ0 =1
6γ′0; q0 =
γ′1 + 2γ′
0 − γ′20
−3γ′0
. (S13)
For MgO periclase, Mg2SiO4 forsterite, MgSiO3 perovskite, and SiO2 stishoviteS63
we use a third order finite strain expansion for Fcmp. Fits for each solid compositionS64
considered are shown in Figures S11-S14.S65
S3 Constraining Reference Entropy Values for Thermo-S66
dynamic Relations of Simulated PhasesS67
Complete description of the free energy in the liquid and solid fundamental relationsS68
requires the entropy at one reference point for each system to be known, i.e. 13S69
values of S0 have to be specified, 9 for liquids and 4 for solids. Our description ofS70
the thermodynamics of mixing (eq. 2) gives the total entropy along the binary atS71
constant P and T asS72
S = Y SSiO2+ (1 − Y )SMgO + Sideal + W ′
AY 2(1 − Y ) + W ′B(1 − Y )2Y, (S14)
withS73
Sideal = R[Y ln Y + (1 − Y ) ln(1 − Y )], (S15)
4
S74
Y = X/(X + λ(1 − X)), (S16)S75
W ′ = −(∂W/∂T )P . (S17)
Constraining S0 for the 9 liquid compositions therefore requires λ, W ′A, W ′
B, SSiO2,S76
and SMgO to be specified at a single chosen reference state, the P and T dependenceS77
of these quantities being fixed by our FPMD simulations. λ is determined fromS78
fitting to Hmix (Figure 1). W ′A and W ′
B are constrained by optimizing with respectS79
to three invariant points on the MgO–SiO2 phase diagram (Figure S15) associatedS80
with the ambient pressure liquidi for periclase and forsterite together with the liquidS81
immiscibility field. The three invariant points are i) the critical temperature of liquidS82
immiscibility (T = 2250 K, X = 0.87; Hageman and Oonk, 1986), ii) the forsterite-S83
periclase eutectic (T = 2136 K; X = 0.30 Bowen and Andersen, 1914), and iii) theS84
forsterite-clinoenstatite peritectic (Tliquidus = 1830; X = 0.52 Bowen and Andersen,S85
1914). Values for SSiO2and SMgO are chosen to optimize agreement with the availableS86
estimates of liquid entropy along the binary (Figure S16), obtained asS87
Sliq(T, P ) = Ssol(Tm, P ) + ∆Sm(P ) + ∆Sliq(Tm → T, P ), (S18)
where ∆Sliq(Tm → T, P ) = CP ln(T/Tm), and the subscript m indicates melting.S88
To constrain S0 values in the crystalline phases in a manner that is consistent withS89
the liquid entropies through their measured melting temperatures, we constrain theS90
crystalline S0 values by matching liquid Gibbs free energies at chosen experimentalS91
melting points. These fixed points are: 3070 K, 0 GPa for periclase (Riley, 1966);S92
2163 K, 0 GPa for forsterite (Bowen and Andersen, 1914); 2900 K, 25 GPa forS93
perovskite (Stixrude and Karki, 2005, and references therein); 3120 K, 14 GPa forS94
stishovite (Zhang et al., 1993; Shen and Lazor, 1995). Entropy values in our SFTRsS95
are therefore not directly constrained from calorimetry data; a comparison betweenS96
experimental entropy values and the values in our description is made in Table S1.S97
Our computed ambient pressure phase diagram agrees very well with the ex-S98
perimental data. The optimal Smix model gives the periclase-forsterite eutectic atS99
X = 0.31, T = 2136 K, and the forsterite-clinoenstatite peritectic at X = 0.52.S100
We further obtain the critical point of immiscibility at T = 2250 K, X = 0.92, al-S101
though our computed immiscibility field is narrower than the experimental curve.S102
We find that the shape of the computed immiscibility field is sensitive to Hmix, butS103
not to Smix. Using a different mixing model will not increase the width of the fieldS104
width, and the discrepancy likely results from the approximations made in treatingS105
the exchange-correlation energy at the first-principles level.S106
5

S4 Estimating the Influence of FeOS107
We estimate the influence of the addition of FeO on our results asS108
µβα(X∗, Z) = µβ
α(X∗) + RT ln γβZ, (S19)
where µβα is the chemical potential of component α in phase β, γ is the activityS109
coefficient, and the compositional variablesS110
X∗ =NSiO2
NSiO2+ NMgO + NFeO
, (S20)
S111
Z =NMgO
NMgO + NFeO. (S21)
Motivated by the expectation that Fe will substitute primarily for Mg, we assumeS112
thatS113
µβα(X∗) = µβ
α(X), (S22)
whereS114
X =NSiO2
NSiO2+ NMgO
. (S23)
From our FPMD results, we know the first term on the right-hand side of eq. S19S115
for the components in the liquid phase (Lq), and for the solid phases stishovite (St)S116
(or seifertite), ferropericlase (Fp) and perovskite (Pv) for which µβα(X∗) is simply theS117
chemical potential of the pure end-member in the MgO-SiO2 system. We can thenS118
find the influence of the FeO component on the phase diagram by equating chemicalS119
potentials in coexisting phases. In order to specify the solution completely, we furtherS120
assume values of the Mg-Fe partition coefficients for the pairs liquid-ferropericlaseS121
and perovskite-ferropericlase. The system of equations to be solved is thenS122
µLqMgO(X∗, Z) = µFp
MgO + RT lnZFp
ZLq, (S24)
µLqMgSiO3
(X∗, Z) = µPvMgSiO3
+ RT lnZPv
ZLq, (S25)
µLqSiO2
(X∗, Z) = µPvSiO2
, (S26)
KLq-Fp =ZLq(1 − ZFp)
ZFp(1 − ZLq), (S27)
KPv-Fp =ZPv(1 − ZFp)
ZFp(1 − ZPv), (S28)
where Kβ-δ is the Mg-Fe partition coefficient between phases β and δ, and we haveS123
further assumed that ratios of activity coefficients, e.g. γPv/γLq ≈ 1 because Mg-FeS124
6

solution is found to be close to ideal in many silicate and oxide systems (eg. StixrudeS125
and Lithgow-Bertelloni, 2011, and references therein). For example, for a given valueS126
of temperature T and ZFp of the bulk system, we may solve eqs. S24 and S27 for X∗,S127
the silica fraction on the liquidus in the FeO-bearing system, along which ZLq = ZFp.S128
ReferencesS129
Alfe D. (2005) Melting curve of MgO from first-principles simulations. PhysicalS130
Review Letters 94, 235701.S131
Birch F. (1952) Elasticity and Constitution of the Earth’s Interior. Journal of Geo-S132
physical Research 57, 227–286.S133
Birch F. (1978) Finite Strain Isotherm and Velocities for Single-Crystal and Poly-S134
crystalline NaCl at High Pressures and 300K. Journal of Geophysical ResearchS135
83, 1257–1268.S136
Bowen N.L. and Andersen O. (1914) The binary system MgO − SiO2. AmericanS137
Journal of Science 37, 487–500.S138
Callen H.B. (1985) Thermodynamics and an Introduction to Thermostatistics. JohnS139
Wiley & Sons, New York, 2nd edition.S140
de Koker N. and Stixrude L. (2009) Self-Consistent Thermodynamic Description ofS141
Silicate Liquids, with Application to Shock Melting of MgO Periclase and MgSiO3S142
Perovskite. Geophysical Journal International 178, 162–179.S143
de Koker N., Stixrude L. and Karki B.B. (2008) Thermodynamics, Structure, Dynam-S144
ics, and Freezing of Mg2SiO4 Liquid at High Pressure. Geochimica et CosmochimicaS145
Acta 72, 1427–1441, doi:10.1016/j.gca.2007.12.019.S146
Ferguson J.B. and Merwin H.E. (1918) The Melting Points of Cristobalite andS147
Tridymite. American Journal of Science 46, 417–426.S148
Ghiorso M.S. and Carmichael I. (1980) A Regular Solution Model for Met-AluminousS149
Silicate Liquids: Applications to Geothermometry, Immiscibility, and the SourceS150
Regions of Basic Magmas. Contributions to Mineralogy and Petrology 71, 323–342.S151
Hageman V.B.M. and Oonk H.A.J. (1986) Liquid immiscibility in the SiO2 + MgO,S152
SiO2 + SrO, SiO2 + LaO3, and SiO2 + Y2O3 systems. Physics and Chemistry ofS153
Glasses 27, 194–198.S154
7
Hudon P., Jung I.H. and Baker D.R. (2002) Melting of β-quartz up to 2.0GPa andS155
thermodynamic optimization of the silica liquidus up to 6.0GPa. Physics of theS156
Earth and Planetary Interiors 130, 159–174.S157
Karki B.B., Bhattarai D. and Stixrude L. (2006) First principles calculations of theS158
structural, dynamical and electronic properties of liquid MgO. Physical Review BS159
73, 174208.S160
Karki B.B., Bhattarai D. and Stixrude L. (2007) First-principles simulations of liquidS161
silica: Structural and dynamical behavior at high pressure. Physical Review B 76,S162
104205.S163
Karki B.B. and Stixrude L. (2010) First-principles study of enhancement of transportS164
properties of silica melt by water. Physical Review Letters 104, 215901.S165
McQuarrie D.A. (1984) Statistical Mechanics. University Science Books, Sausalito,S166
CA.S167
Navrotsky A., Ziegler D., Oestrike R. and Maniar P. (1989) Calorimetry of Sili-S168
cate Melts at 1773K - Measurement of Enthalpies of Fusion and of Mixing inS169
the Systems Diopside-Anorthite-Albite and Anorthite-Forsterite. Contributions toS170
Mineralogy and Petrology 101, 122–130.S171
Richet P., Bottinga Y., Denielou L., Petitet J.P. and Tequi C. (1982) ThermodynamicS172
properties of quartz, cristobalite and amorphous SiO2: drop calorimetry measure-S173
ments between 1000 and 1800 K and a review from 0 to 2000 K. Geochimica etS174
Cosmochimica Acta 46, 2639–2658.S175
Riley B. (1966) The Determination of Melting Points at Temperatures Above 2000◦S176
Celcius. Revue international des hautes temperatures et des refractaires 3, 327–336.S177
Robie R.A. and Hemingway B.S. (1995) Thermodynamic Properties of Minerals andS178
Related Substances at 298.15K and 1Bar (105 Pascals) Pressure and at HigherS179
Temperatures, volume 2131 of USGS Bulletin. Eastern Region, Reston, Va.S180
Shen G. and Lazor P. (1995) Measurement of melting temperatures of some mineralsS181
under lower mantle pressures. Journal of Geophysical Research 100, 17699–17713.S182
Stebbins J.F., Carmichael I.S.E. and Moret L.K. (1984) Heat-Capacities and En-S183
tropies of Silicate Liquids and Glasses. Contributions to Mineralogy and PetrologyS184
86, 131–148.S185
8
Stixrude L. and Karki B.B. (2005) Structure and Freezing of MgSiO3 liquid in theS186
Earth’s lower mantle. Science 310, 297–299.S187
Stixrude L. and Lithgow-Bertelloni C. (2005) Thermodynamics of mantle minerals -S188
I. Physical properties. Geophysical Journal International 162, 610–632.S189
Stixrude L. and Lithgow-Bertelloni C. (2011) Thermodynamics of mantle minerals -S190
II. Phase equilibria. Geophysical Journal International in press.S191
Tangeman J.A., Phillips B.L., Navrotsky A., Weber J.K.R., Hixson A.D. and KeyS192
T.S. (2001) Vitreous forsterite (Mg2SiO4): Synthesis, structure, and thermochem-S193
istry. Geophysical Research Letters 28, 2517–2520.S194
Zhang J., Liebermann R.C., Gasparik T. and Herzberg C.T. (1993) Melting andS195
Subsolidus Relations of SiO2 at 9 − 14GPa. Journal of Geophysical Research 98,S196
19785–19793.S197
9
TablesS198
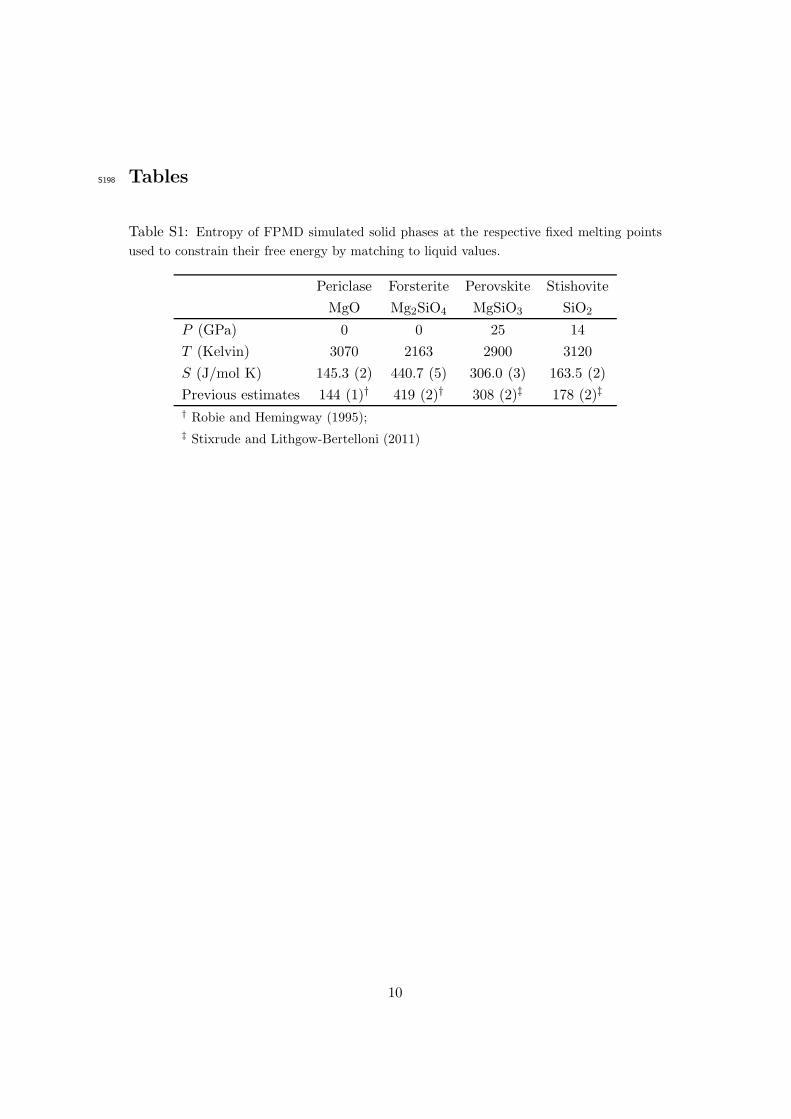
Table S1: Entropy of FPMD simulated solid phases at the respective fixed melting points
used to constrain their free energy by matching to liquid values.
Periclase Forsterite Perovskite Stishovite
MgO Mg2SiO4 MgSiO3 SiO2
P (GPa) 0 0 25 14
T (Kelvin) 3070 2163 2900 3120
S (J/mol K) 145.3 (2) 440.7 (5) 306.0 (3) 163.5 (2)
Previous estimates 144 (1)† 419 (2)† 308 (2)‡ 178 (2)‡
† Robie and Hemingway (1995);
‡ Stixrude and Lithgow-Bertelloni (2011)
10

FiguresS199
X(SiO2)
Pem
p (
GP
a)
1.00
1.25
1.50
1.75
2.00
0.0 0.2 0.4 0.6 0.8 1.0
Pemp = -1.90 X2 + 2.17 X + 1.23
Figure S1: Interpolation of the pressure correction for systematic overbinding of LDA from
phases for which it can be computed (red) to phases with no corresponding solid phases
(blue).
V (cm3/mol)
E (
kJ/
mol)
P (
GP
a)
V (cm3/mol)
Sel
(N
kB
) MgO
0
60
120
180
240
9 12 15 18
−1200
−900
−600
−300
9 12 15 18
0.0
0.4
0.8
6 12 18
Figure S2: FPMD results (circles) and LFTR fit (lines) for MgO liquid. Purple - 2000 K;
blue - 3000 K; green - 4000 K; yellow - 5000 K; orange - 6000 K; red - 7000 K; maroon -
10000 K.
11
V (cm3/mol)
E (
kJ/
mol)
P (
GP
a)
V (cm3/mol)
Sel
(N
kB
) Mg5SiO7
−8000
−7000
−6000
−5000
−4000
60 80 100
0
50
100
150
200
60 80 100
0.0
0.3
0.6
60 90 120
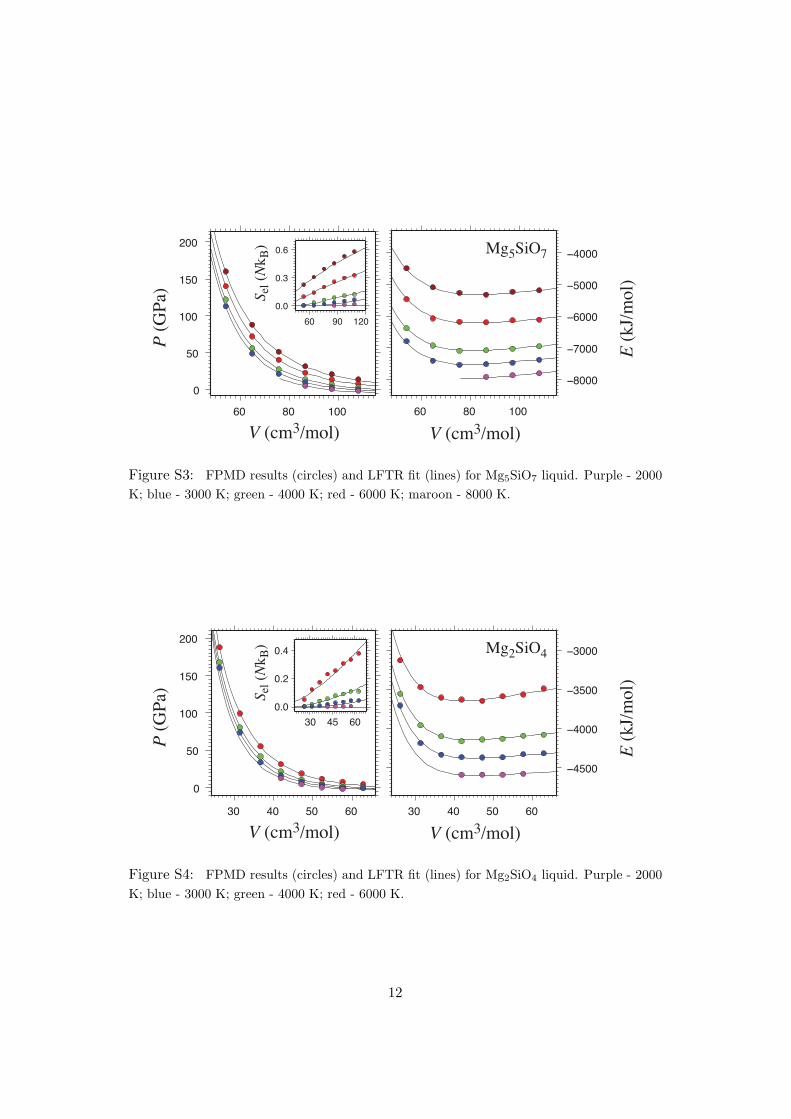
Figure S3: FPMD results (circles) and LFTR fit (lines) for Mg5SiO7 liquid. Purple - 2000
K; blue - 3000 K; green - 4000 K; red - 6000 K; maroon - 8000 K.
V (cm3/mol)
E (
kJ/
mol)
P (
GP
a)
V (cm3/mol)
Sel
(N
kB
) Mg2SiO4
−4500
−4000
−3500
−3000
30 40 50 60
0
50
100
150
200
30 40 50 60
0.0
0.2
0.4
30 45 60
Figure S4: FPMD results (circles) and LFTR fit (lines) for Mg2SiO4 liquid. Purple - 2000
K; blue - 3000 K; green - 4000 K; red - 6000 K.
12

V (cm3/mol)
E (
kJ/
mo
l)
P (
GP
a)
V (cm3/mol)
Sel
(N
kB
) Mg3Si2O7
−8000
−7000
−6000
−5000
40 60 80 100 120
0
60
120
180
240
40 60 80 100 120
0.00
0.25
0.50
40 80 120
Figure S5: FPMD results (circles) and LFTR fit (lines) for Mg3Si2O7 liquid. Purple - 2000
K; blue - 3000 K; green - 4000 K; red - 6000 K.
V (cm3/mol)
0.0
0.2
0.4
15 30 45
−3500
−3000
−2500
−2000
−1500
20 30 40 50
0
60
120
180
240
20 30 40 50
E (
kJ/
mol)
P (
GP
a)
V (cm3/mol)
Sel
(N
kB
) MgSiO3
Figure S6: FPMD results (circles) and LFTR fit (lines) for MgSiO3 liquid. Purple - 2000
K; blue - 3000 K; green - 4000 K; red - 6000 K; maroon - 8000 K.
13

V (cm3/mol)
E (
kJ/
mo
l)
P (
GP
a)
V (cm3/mol)
Sel
(N
kB
)MgSi2O5
−6000
−5000
−4000
−3000
30 45 60 75
0
60
120
180
240
30 45 60 75
0.00
0.25
0.50
0.75
30 50 70
Figure S7: FPMD results (circles) and LFTR fit (lines) for MgSi2O5 liquid. Purple - 2000
K; blue - 3000 K; green - 4000 K; red - 6000 K; maroon - 8000 K.
V (cm3/mol)
E (
kJ/
mo
l)
P (
GP
a)
V (cm3/mol)
Sel
(N
kB
) MgSi3O7
−8000
−7000
−6000
−5000
−4000
30 60 90 120
0
60
120
180
240
30 60 90 120
0.00
0.25
0.50
40 80 120
Figure S8: FPMD results (circles) and LFTR fit (lines) for MgSi3O7 liquid. Purple - 2000
K; blue - 3000 K; green - 4000 K; red - 6000 K; maroon - 8000 K.
14

V (cm3/mol)
E (
kJ/
mo
l)
P (
GP
a)
V (cm3/mol)
Sel
(N
kB
) MgSi5O11
0
50
100
150
200
60 90 120 150
0.0
0.3
0.6
50 100 150
−13000
−11000
−9000
−7000
60 90 120 150
Figure S9: FPMD results (circles) and LFTR fit (lines) for MgSi5O11 liquid. Purple - 2000
K; blue - 3000 K; green - 4000 K; yellow - 5000 K; red - 6000 K; maroon - 8000 K.
V (cm3/mol)
E (
kJ/
mo
l)
P (
GP
a)
V (cm3/mol)
Sel
(N
kB
) SiO2
−2400
−2000
−1600
−1200
10 15 20 25 30
0
50
100
150
200
10 15 20 25 30
0.0
0.3
0.6
10 20 30
Figure S10: FPMD results (circles) and LFTR fit (lines) for SiO2 liquid. Purple - 2000 K;
blue - 3000 K; green - 4000 K; yellow - 5000 K; orange - 6000 K; red - 7000 K.
15

E (
kJ/
mo
l)
P (
GP
a)
V (cm3/mol) V (cm3/mol)
Periclase
−1200
−1000
−800
−600
8 10 12 14
0
60
120
180
240
8 10 12 14
Figure S11: FPMD results (circles) and SFTR fit (lines) for MgO periclase. Purple - 2000
K; blue - 3000 K; green - 4000 K; yellow - 5000 K; red - 6000 K; maroon - 8000 K.
E (
kJ/
mo
l)
P (
GP
a)
−5000
−4800
−4600
−4400
35 40 45 50 55
−20
0
20
40
60
35 40 45 50 55
V (cm3/mol) V (cm3/mol)
Forsterite
Figure S12: FPMD results (circles) and SFTR fit (lines) for Mg2SiO4 forsterite. Grey -
1000 K; purple - 2000 K; blue - 3000 K.
16
E (
kJ/
mo
l)
P (
GP
a)
V (cm3/mol) V (cm3/mol)
Perovskite
−3600
−3200
−2800
−2400
−2000
15 18 21 24 27
0
80
160
240
320
15 18 21 24 27
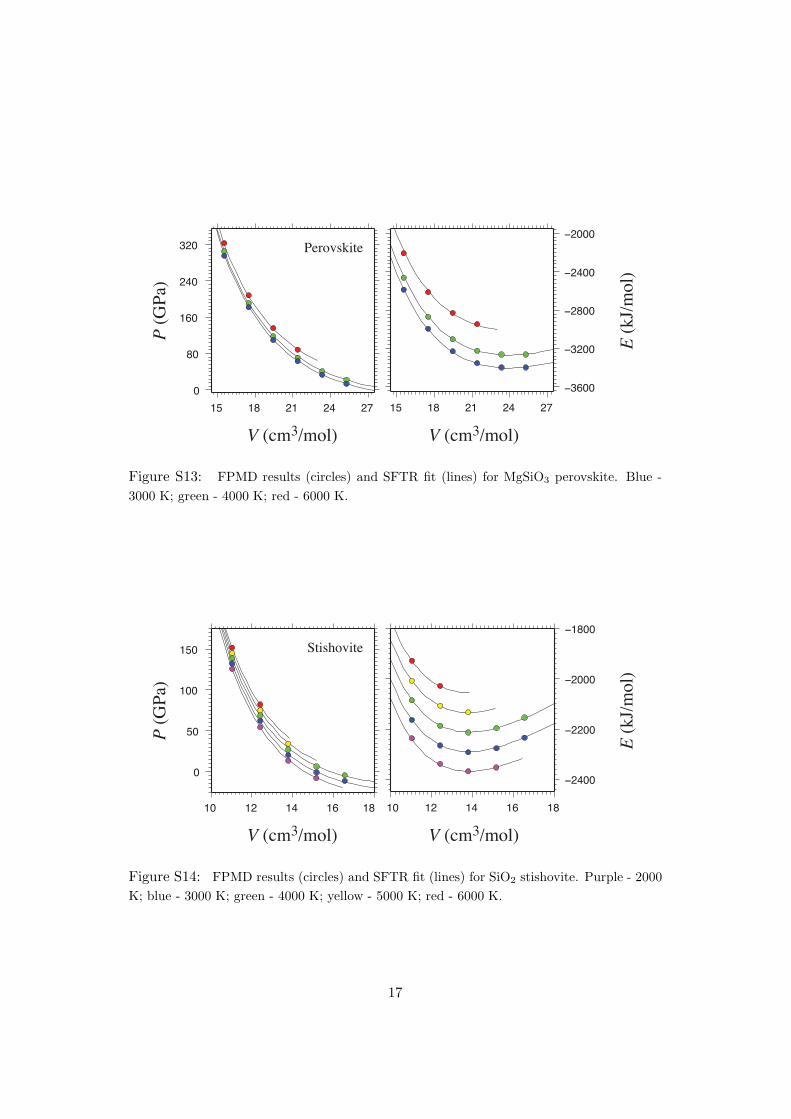
Figure S13: FPMD results (circles) and SFTR fit (lines) for MgSiO3 perovskite. Blue -
3000 K; green - 4000 K; red - 6000 K.
E (
kJ/
mo
l)
P (
GP
a)
V (cm3/mol) V (cm3/mol)
Stishovite
−2400
−2200
−2000
−1800
10 12 14 16 18
0
50
100
150
10 12 14 16 18
Figure S14: FPMD results (circles) and SFTR fit (lines) for SiO2 stishovite. Purple - 2000
K; blue - 3000 K; green - 4000 K; yellow - 5000 K; red - 6000 K.
17
T (
Kel
vin
)
X(SiO2)
1750
2000
2250
2500
2750
3000
0.0 0.2 0.4 0.6 0.8 1.0
HO86
BA14
R66
FM18
This study
Pe + Liq
Cst
2 Liq
Liquid
Fo anchor
Pe anchor
Pe+Fo
Fo
+ Liq
Fo+En
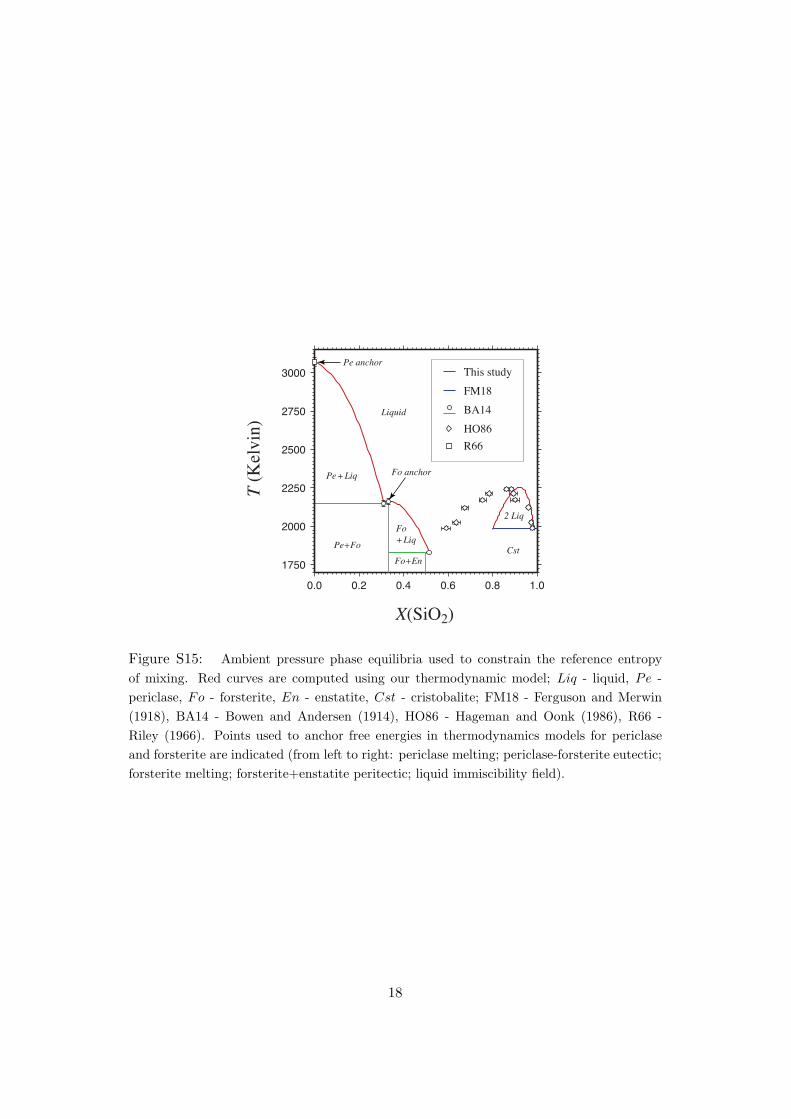
Figure S15: Ambient pressure phase equilibria used to constrain the reference entropy
of mixing. Red curves are computed using our thermodynamic model; Liq - liquid, Pe -
periclase, Fo - forsterite, En - enstatite, Cst - cristobalite; FM18 - Ferguson and Merwin
(1918), BA14 - Bowen and Andersen (1914), HO86 - Hageman and Oonk (1986), R66 -
Riley (1966). Points used to anchor free energies in thermodynamics models for periclase
and forsterite are indicated (from left to right: periclase melting; periclase-forsterite eutectic;
forsterite melting; forsterite+enstatite peritectic; liquid immiscibility field).
18

X(SiO2)
S (
J/K
/mo
l)
R-A-SR-T-T
R-S-S
R-N-S
R-G-SR-R-S
S
C-C-S
H
160
180
200
220
0.0 0.2 0.4 0.6 0.8 1.0
Figure S16: Reference third law entropy of the respective liquid compositions along the
join (blue crosses) and the optimal entropy of mixing (red line) at ambient pressure and
3000 K, constrained via eq. S18 by optimizing agreement with the available estimates of the
entropy of individual compositions (diamonds). Except where a single letter is noted, labels
list the references used for the various components of eq. S18: [Ssol(Tm, P )]–[∆Sfus(P )]–
[∆Sliq(Tm → T, P )]. Labels are: A - Alfe (2005), C - Richet et al. (1982), G - Ghiorso and
Carmichael (1980), H - Hudon et al. (2002), N - Navrotsky et al. (1989), R - Robie and
Hemingway (1995), S - Stebbins et al. (1984), T - Tangeman et al. (2001). Unit is per mol
of oxides.
19