Earth and Planetary Science - Division of Geological and...
7
Earth and Planetary Science Letters 468 (2017) 112–118 Contents lists available at ScienceDirect Earth and Planetary Science Letters www.elsevier.com/locate/epsl Experimental evidence that ooid size reflects a dynamic equilibrium between rapid precipitation and abrasion rates Elizabeth J. Trower ∗ , Michael P. Lamb, Woodward W. Fischer Division of Geological and Planetary Sciences, California Institute of Technology, 1200 E. California Blvd, Pasadena, CA 91125, USA a r t i c l e i n f o a b s t r a c t Article history: Received 16 January 2017 Received in revised form 31 March 2017 Accepted 1 April 2017 Available online 20 April 2017 Editor: D. Vance Keywords: ooids abrasion carbonate precipitation dynamic equilibrium seawater chemistry Ooids are enigmatic concentrically coated carbonate sand grains that reflect a fundamental mode of carbonate sedimentation and inorganic product of the carbon cycle—trends in their composition and size are thought to record changes in seawater chemistry over Earth history. Substantial debate persists concerning the roles of physical, chemical, and microbial processes in their growth, including whether carbonate precipitation on ooid surfaces is driven by seawater chemistry or microbial activity, and what role—if any—sediment transport and abrasion play. To test these ideas, we developed an approach to study ooids in the laboratory employing sediment transport stages and seawater chemistry similar to natural environments. Ooid abrasion and precipitation rates in the experiments were four orders of magnitude faster than radiocarbon net growth rates of natural ooids, implying that ooids approach a stable size representing a dynamic equilibrium between precipitation and abrasion. Results demonstrate that the physical environment is as important as seawater chemistry in controlling ooid growth and, more generally, that sediment transport plays a significant role in chemical sedimentary systems. © 2017 Elsevier B.V. All rights reserved. 1. Introduction The ubiquity of ooids in carbonate sequences of all ages makes them valuable paleoenvironmental proxies. For example, observa- tions of temporal trends in the primary mineralogy (calcite vs. aragonite) of ooid cortices provided key evidence of oscillations in marine carbonate chemistry over Phanerozoic time (Mackenzie and Pigott, 1981; Sandberg, 1983; Wilkinson et al., 1985). Further- more, although most modern ooids are <1 mm in diameter, ooid size distributions have not been constant over Earth history; many Neoproterozoic carbonate successions include units with excep- tionally large “giant ooids” up to ∼1 cm in diameter (Sumner and Grotzinger, 1993; Swett and Knoll, 1989; Zempolich et al., 1988) and worldwide increases in ooid size have been documented in early Triassic strata, succeeding the largest known mass extinction (Li et al., 2015). Much of the potential of ooids as paleoenviron- mental proxies has not been realized because the controls on ooid size and net growth rates remain uncertain. The classic model of ooid growth stipulates that ooid cortices form via abiotic precipitation of aragonite or calcite from flu- ids supersaturated with respect to CaCO 3 while ooid nuclei are fully suspended in the water column (Bathurst, 1975); ooid size * Corresponding author. E-mail address: [email protected] (E.J. Trower). is expected to increase monotonically until grains are permanently buried and/or achieve a maximum size at which they can no longer be suspended (Sumner and Grotzinger, 1993). Under this model, larger ooids are predicted to result from faster precipita- tion rates promoted by seawater chemistry (Li et al., 2015; Swett and Knoll, 1989), combined with increased agitation to allow larger grains to be suspended and lower burial rates resulting in longer ooid lifetimes for active growth (Sumner and Grotzinger, 1993). Recent studies documenting the microbiota associated with ooid cortices have revived the hypothesis that ooid genesis is an inher- ently biological process in which microbially-promoted carbonate precipitation, while grains are at rest, may be significant (Diaz et al., 2015; Mariotti et al., 2014; O’Reilly et al., 2017; Pacton et al., 2012; Summons et al., 2013), with implications for interpreting patterns of ooid occurrence as a biomarker. In principle, both chemical (dissolution) and physical (abrasion) mechanisms could act in opposition to ooid growth. Existing mod- els often implicitly assume that rates of dissolution and abrasion are constantly less than that of precipitation, such that ooids rarely or never reach a stable size at which additive (precipitation) and reductive (abrasion and/or dissolution) rates are equal. Dissolution is unlikely to occur at significant rates in the water column and on the bed surface, although it may be significant when grains are buried for extended periods of time because pore fluids can be corrosive to carbonate phases (Walter and Burton, 1990). Abrasion rates for sand-sized particles have not been well-constrained the- http://dx.doi.org/10.1016/j.epsl.2017.04.004 0012-821X/© 2017 Elsevier B.V. All rights reserved.
Transcript of Earth and Planetary Science - Division of Geological and...

Earth and Planetary Science Letters 468 (2017) 112–118
Contents lists available at ScienceDirect
Earth and Planetary Science Letters
www.elsevier.com/locate/epsl
Experimental evidence that ooid size reflects a dynamic equilibrium
between rapid precipitation and abrasion rates
Elizabeth J. Trower ∗, Michael P. Lamb, Woodward W. Fischer
Division of Geological and Planetary Sciences, California Institute of Technology, 1200 E. California Blvd, Pasadena, CA 91125, USA
a r t i c l e i n f o a b s t r a c t
Article history:Received 16 January 2017Received in revised form 31 March 2017Accepted 1 April 2017Available online 20 April 2017Editor: D. Vance
Keywords:ooidsabrasioncarbonate precipitationdynamic equilibriumseawater chemistry
Ooids are enigmatic concentrically coated carbonate sand grains that reflect a fundamental mode of carbonate sedimentation and inorganic product of the carbon cycle—trends in their composition and size are thought to record changes in seawater chemistry over Earth history. Substantial debate persists concerning the roles of physical, chemical, and microbial processes in their growth, including whether carbonate precipitation on ooid surfaces is driven by seawater chemistry or microbial activity, and what role—if any—sediment transport and abrasion play. To test these ideas, we developed an approach to study ooids in the laboratory employing sediment transport stages and seawater chemistry similar to natural environments. Ooid abrasion and precipitation rates in the experiments were four orders of magnitude faster than radiocarbon net growth rates of natural ooids, implying that ooids approach a stable size representing a dynamic equilibrium between precipitation and abrasion. Results demonstrate that the physical environment is as important as seawater chemistry in controlling ooid growth and, more generally, that sediment transport plays a significant role in chemical sedimentary systems.
© 2017 Elsevier B.V. All rights reserved.
1. Introduction
The ubiquity of ooids in carbonate sequences of all ages makes them valuable paleoenvironmental proxies. For example, observa-tions of temporal trends in the primary mineralogy (calcite vs. aragonite) of ooid cortices provided key evidence of oscillations in marine carbonate chemistry over Phanerozoic time (Mackenzie and Pigott, 1981; Sandberg, 1983; Wilkinson et al., 1985). Further-more, although most modern ooids are <1 mm in diameter, ooid size distributions have not been constant over Earth history; many Neoproterozoic carbonate successions include units with excep-tionally large “giant ooids” up to ∼1 cm in diameter (Sumner and Grotzinger, 1993; Swett and Knoll, 1989; Zempolich et al., 1988) and worldwide increases in ooid size have been documented in early Triassic strata, succeeding the largest known mass extinction (Li et al., 2015). Much of the potential of ooids as paleoenviron-mental proxies has not been realized because the controls on ooid size and net growth rates remain uncertain.
The classic model of ooid growth stipulates that ooid cortices form via abiotic precipitation of aragonite or calcite from flu-ids supersaturated with respect to CaCO3 while ooid nuclei are fully suspended in the water column (Bathurst, 1975); ooid size
* Corresponding author.E-mail address: [email protected] (E.J. Trower).
http://dx.doi.org/10.1016/j.epsl.2017.04.0040012-821X/© 2017 Elsevier B.V. All rights reserved.
is expected to increase monotonically until grains are permanently buried and/or achieve a maximum size at which they can no longer be suspended (Sumner and Grotzinger, 1993). Under this model, larger ooids are predicted to result from faster precipita-tion rates promoted by seawater chemistry (Li et al., 2015; Swett and Knoll, 1989), combined with increased agitation to allow larger grains to be suspended and lower burial rates resulting in longer ooid lifetimes for active growth (Sumner and Grotzinger, 1993). Recent studies documenting the microbiota associated with ooid cortices have revived the hypothesis that ooid genesis is an inher-ently biological process in which microbially-promoted carbonate precipitation, while grains are at rest, may be significant (Diaz et al., 2015; Mariotti et al., 2014; O’Reilly et al., 2017; Pacton et al., 2012; Summons et al., 2013), with implications for interpreting patterns of ooid occurrence as a biomarker.
In principle, both chemical (dissolution) and physical (abrasion) mechanisms could act in opposition to ooid growth. Existing mod-els often implicitly assume that rates of dissolution and abrasion are constantly less than that of precipitation, such that ooids rarely or never reach a stable size at which additive (precipitation) and reductive (abrasion and/or dissolution) rates are equal. Dissolution is unlikely to occur at significant rates in the water column and on the bed surface, although it may be significant when grains are buried for extended periods of time because pore fluids can be corrosive to carbonate phases (Walter and Burton, 1990). Abrasion rates for sand-sized particles have not been well-constrained the-
E.J. Trower et al. / Earth and Planetary Science Letters 468 (2017) 112–118 113
oretically or experimentally, but previous authors have suggested that abrasion might play a significant role in ooid development via several mechanisms; abrasion has been hypothesized to affect cor-tical textures (Heller et al., 1980; Kahle, 1974; Loreau and Purser, 1973; Medwedeff and Wilkinson, 1983; Strasser, 1986), increase grain roundness and sphericity (Bathurst, 1975; Van Ee and Wan-less, 2008), and exert a maximum size limit on a population of ooids (Bathurst, 1975; Sumner and Grotzinger, 1993).
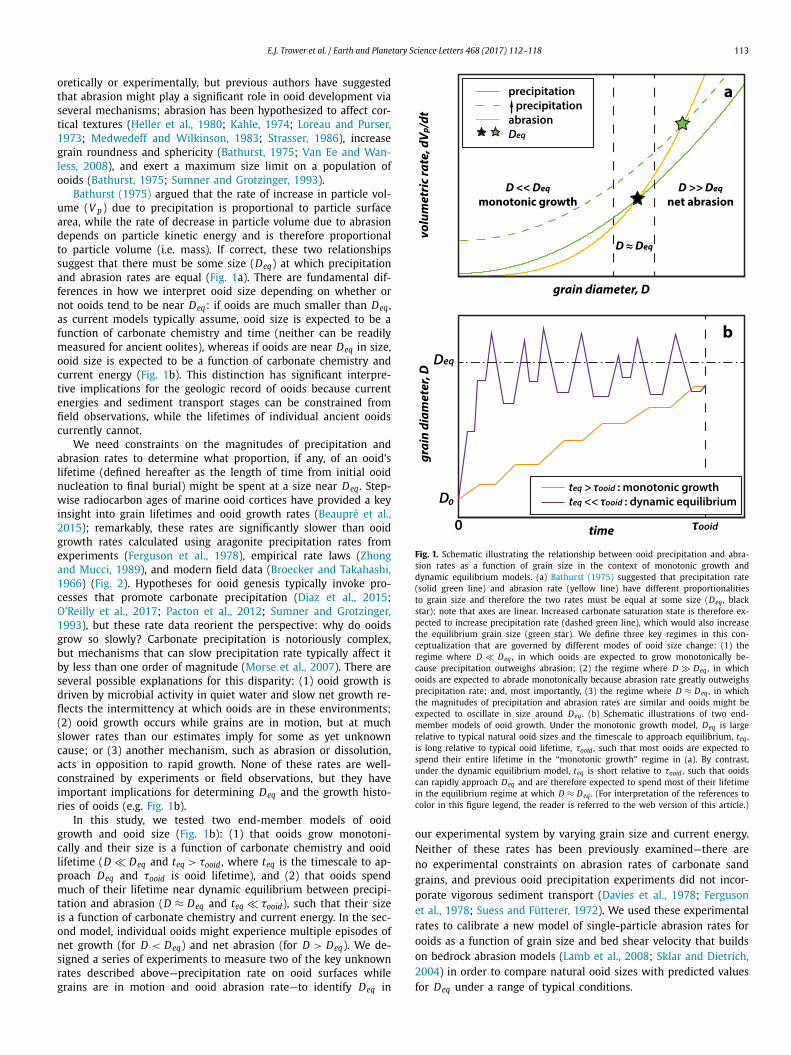
Bathurst (1975) argued that the rate of increase in particle vol-ume (V p ) due to precipitation is proportional to particle surface area, while the rate of decrease in particle volume due to abrasion depends on particle kinetic energy and is therefore proportional to particle volume (i.e. mass). If correct, these two relationships suggest that there must be some size (Deq) at which precipitation and abrasion rates are equal (Fig. 1a). There are fundamental dif-ferences in how we interpret ooid size depending on whether or not ooids tend to be near Deq: if ooids are much smaller than Deq , as current models typically assume, ooid size is expected to be a function of carbonate chemistry and time (neither can be readily measured for ancient oolites), whereas if ooids are near Deq in size, ooid size is expected to be a function of carbonate chemistry and current energy (Fig. 1b). This distinction has significant interpre-tive implications for the geologic record of ooids because current energies and sediment transport stages can be constrained from field observations, while the lifetimes of individual ancient ooids currently cannot.
We need constraints on the magnitudes of precipitation and abrasion rates to determine what proportion, if any, of an ooid’s lifetime (defined hereafter as the length of time from initial ooid nucleation to final burial) might be spent at a size near Deq . Step-wise radiocarbon ages of marine ooid cortices have provided a key insight into grain lifetimes and ooid growth rates (Beaupré et al., 2015); remarkably, these rates are significantly slower than ooid growth rates calculated using aragonite precipitation rates from experiments (Ferguson et al., 1978), empirical rate laws (Zhong and Mucci, 1989), and modern field data (Broecker and Takahashi, 1966) (Fig. 2). Hypotheses for ooid genesis typically invoke pro-cesses that promote carbonate precipitation (Diaz et al., 2015; O’Reilly et al., 2017; Pacton et al., 2012; Sumner and Grotzinger, 1993), but these rate data reorient the perspective: why do ooids grow so slowly? Carbonate precipitation is notoriously complex, but mechanisms that can slow precipitation rate typically affect it by less than one order of magnitude (Morse et al., 2007). There are several possible explanations for this disparity: (1) ooid growth is driven by microbial activity in quiet water and slow net growth re-flects the intermittency at which ooids are in these environments; (2) ooid growth occurs while grains are in motion, but at much slower rates than our estimates imply for some as yet unknown cause; or (3) another mechanism, such as abrasion or dissolution, acts in opposition to rapid growth. None of these rates are well-constrained by experiments or field observations, but they have important implications for determining Deq and the growth histo-ries of ooids (e.g. Fig. 1b).
In this study, we tested two end-member models of ooid growth and ooid size (Fig. 1b): (1) that ooids grow monotoni-cally and their size is a function of carbonate chemistry and ooid lifetime (D � Deq and teq > τooid , where teq is the timescale to ap-proach Deq and τooid is ooid lifetime), and (2) that ooids spend much of their lifetime near dynamic equilibrium between precipi-tation and abrasion (D ≈ Deq and teq � τooid), such that their size is a function of carbonate chemistry and current energy. In the sec-ond model, individual ooids might experience multiple episodes of net growth (for D < Deq) and net abrasion (for D > Deq). We de-signed a series of experiments to measure two of the key unknown rates described above—precipitation rate on ooid surfaces while grains are in motion and ooid abrasion rate—to identify Deq in
Fig. 1. Schematic illustrating the relationship between ooid precipitation and abra-sion rates as a function of grain size in the context of monotonic growth and dynamic equilibrium models. (a) Bathurst (1975) suggested that precipitation rate (solid green line) and abrasion rate (yellow line) have different proportionalities to grain size and therefore the two rates must be equal at some size (Deq, black star); note that axes are linear. Increased carbonate saturation state is therefore ex-pected to increase precipitation rate (dashed green line), which would also increase the equilibrium grain size (green star). We define three key regimes in this con-ceptualization that are governed by different modes of ooid size change: (1) the regime where D � Deq , in which ooids are expected to grow monotonically be-cause precipitation outweighs abrasion; (2) the regime where D � Deq , in which ooids are expected to abrade monotonically because abrasion rate greatly outweighs precipitation rate; and, most importantly, (3) the regime where D ≈ Deq , in which the magnitudes of precipitation and abrasion rates are similar and ooids might be expected to oscillate in size around Deq . (b) Schematic illustrations of two end-member models of ooid growth. Under the monotonic growth model, Deq is large relative to typical natural ooid sizes and the timescale to approach equilibrium, teq , is long relative to typical ooid lifetime, τooid , such that most ooids are expected to spend their entire lifetime in the “monotonic growth” regime in (a). By contrast, under the dynamic equilibrium model, teq is short relative to τooid , such that ooids can rapidly approach Deq and are therefore expected to spend most of their lifetime in the equilibrium regime at which D ≈ Deq . (For interpretation of the references to color in this figure legend, the reader is referred to the web version of this article.)
our experimental system by varying grain size and current energy. Neither of these rates has been previously examined—there are no experimental constraints on abrasion rates of carbonate sand grains, and previous ooid precipitation experiments did not incor-porate vigorous sediment transport (Davies et al., 1978; Ferguson et al., 1978; Suess and Fütterer, 1972). We used these experimental rates to calibrate a new model of single-particle abrasion rates for ooids as a function of grain size and bed shear velocity that builds on bedrock abrasion models (Lamb et al., 2008; Sklar and Dietrich, 2004) in order to compare natural ooid sizes with predicted values for Deq under a range of typical conditions.

114 E.J. Trower et al. / Earth and Planetary Science Letters 468 (2017) 112–118
Fig. 2. Comparison of radiocarbon net ooid growth rates (Beaupré et al., 2015) with precipitation rate estimates for individual ooids from experimental (Ferguson et al., 1978), field (Broecker and Takahashi, 1966), and empirical (Zhong and Mucci, 1989) data (see Supplementary Material). Field and empirical estimates were calculated using for two grain sizes (200 and 330 μm) over a range of Ωaragonite = 2–5 for 35�salinity. The field rate estimates are shown using geometric surface area (circles) and specific surface area estimates (squares).
2. Ooid size model
The hypothesis that abrasion counteracts precipitation in ooid genesis can be expressed as a simple mass balance relation for change in ooid volume (V p ) over time (i.e. net ooid growth rate):
(dV p/dt)net = (dV p/dt)precipitation − f · (dV p/dt)abrasion, (1)
in which an intermittency factor, f , is the time spent in trans-port relative to total time. By combining equations for carbonate precipitation and single particle abrasion rates, we can estimate (dV p/dt)net as a function of intermediate grain diameter, D , and chemical and physical environmental variables.
We used a simple carbonate precipitation rate relation (Morse et al., 2007),
(dV p/dt)precipitation
= k(Ωaragonite − 1)n · Asurface · ρ−1ooid · M(CaCO3), (2)
to predict precipitation rate for a given solution saturation state, Ωaragonite , as a function of particle surface area, Asurface , and ooid density, ρooid , where M(CaCO3) is the molar mass of CaCO3. Both the rate constant, k, and the reaction order, n, can vary with fluid chemistry, reaction mechanism, and surface properties (Morse et al., 2007). For simplicity, we chose k = 12.9 μmol/m2 h and n = 2.26, as determined empirically for aragonite precipitation in artificial seawater (Zhong and Mucci, 1989). Ooid surfaces are characterized by submicron-scale surface roughness that increases the reactive surface area beyond the geometric surface area of a smooth ellipsoid. Here we adopted a specific surface area estimate based on the measurements of sand-sized coral particles (Wal-ter and Morse, 1984) due to similarities in surface microstructure (Fig. S1):
Asurface = 1/6π D3 · ρooid · SSA, (3)
where specific surface area, SSA, is given in m2/g.
Sternberg’s law describes the decrease in particle size due to abrasion during bedload transport as a function of transport dis-tance. This relationship has been evaluated experimentally and in the field for gravel-bed rivers (Gomez et al., 2001; Kodama, 1994; Lewin and Brewer, 2002; Parker, 1991), but it is unclear if this ap-proach can also describe the abrasion of ooids, particularly because these sand-sized particles are often transported near the threshold of suspension. Alternately, Bathurst (1975) and subsequent authors suggested that ooid abrasion rate is proportional to grain volume (V p), but this model does not capture the intuitive prediction that abrasion rate should exhibit an optima and then drop off to zero for large grain sizes that are below the threshold for motion at a given current energy. Thus, we modified a total-load bedrock erosion model (Lamb et al., 2008) to predict single particle abra-sion rates for sand-sized grains in seawater, for a range of grain sizes (D) and bed shear velocities (u∗), transported across bed-load and suspended load regimes, which includes a Stokes number threshold for viscous damping of low energy grain impacts (see Supplementary Material). Notably, bed shear velocity can be re-lated to current and wave properties in a variety of natural coastal settings (unidirectional flow, combined flow, etc.; Grant and Mad-sen, 1982) and is therefore a useful metric for relating the model to modern and ancient ooid environments.
3. Ooid experimental goals and setup
We designed two sets of experiments to test the ooid evolu-tion models by isolating effects of bed shear velocity (u∗) and initial grain size (D) on ooid net growth. The first experimental set consisted of 18 experiments, each with a different bed shear stress (u∗), with all other parameters held constant including ini-tial grain size (D), for two types of natural ooids (see below and Table S1). The second experiment set consisted of three pairs of experiments, each pair with two different initial grain sizes (D), but all other parameters held constant including u∗ . Both sets of experiments employed the same experimental apparatus and used the same seawater carbonate chemistry typical of tropical seawa-ter, prepared with Instant Ocean Aquarium Sea Salt Mix: [Ca2+] =9.4 mM, [Mg2+] = 52 mM, Ωaragonite ≈ 2.9, and 30� salinity (Ta-ble S2). For starting materials, we selected two types of natural ooids that represent classic endmembers in terms of morphology and environment: Bahamian marine ooids sold as CaribSea Arag-Alive Bahamas Oolite aquarium sand and lacustrine ooids collected from Bridger Bay in the Great Salt Lake (GSL), Utah. We used a setup of wet abrasion mills similar to those used to study bedrock abrasion by particles in bed load and suspended load (Scheingross et al., 2014; Sklar and Dietrich, 2001) (Fig. S2) in the Earth Surface Dynamics Laboratory at Caltech. We chose experimental conditions to constrain two key variables in the precipitation-abrasion ooid size model (D and u∗) across ranges that bracket modern ooid-forming environments (Table S1). We assessed how the rate of ooid size change varied over parameter space by varying initial grain type/size or Rouse number (P = ws/(κu∗), where ws is sediment fall velocity and κ = 0.41 is von Kármán’s constant) (Table S1). The u∗ was above the threshold of motion for the coarsest grains and it was visually confirmed that all grains were in motion for all exper-iments. Typical of turbulent suspensions, sediment concentrations were dilute such that grain–grain collisions in the water column were negligible relative to grain-bed impacts (Leeder, 1979).
We ran pairs of experiments with different initial grain sizes at fixed u∗ to test and compare the hypotheses illustrated in Fig. 1b. There are three sets of predicted outcomes corresponding to dif-ferent ooid growth theories:
• If the dynamic equilibrium model is correct and the ini-tial ooid size is near Deq , finer grains (D < Deq) should

E.J. Trower et al. / Earth and Planetary Science Letters 468 (2017) 112–118 115
be more likely to experience net precipitation (dV p/dt > 0), whereas coarser grains (D > Deq) should experience net abra-sion (dV p/dt < 0). Given that the sediment transport and seawater chemistry conditions were similar to modern ooid-forming environments, this hypothesis would suggest that the ooids were also near Deq in nature.
• Conversely, if the monotonic growth model is correct and nat-ural ooids are much finer than Deq , ooids should grow, regard-less of size, under our experimental conditions.
• Finally, if ooids abrade regardless of size, there may be some other factor preventing net precipitation while grains are in motion (e.g. lack of microbial biofilms), which could lend credence to the hypothesis that microbially-mediated ooid growth in quiet water environments is significant.
These experiments, therefore, were not designed to explicitly test the hypothesis that ooid growth can be promoted by microbial biofilms, but instead to determine whether ooids can grow during active transport and, if so, at what rate.
Ooids were washed, dried, and sieved prior to the experiments. Fine- and medium-sand-sized ooids (sieved between 125–250 μm and 250–500 μm, respectively) were used because these size ranges are common in modern ooid environments. Both types of ooids have measured densities of ∼2.8 g/cm3 (Table S3), inter-mediate between the densities of pure calcite and pure aragonite. To capture the appropriate bed roughness, ooid hardgrounds were created for the base of each abrasion mill using epoxy to attach a ∼5 mm layer of medium-sand-sized ooids to a basal plastic disc. These hardgrounds were necessary to create a realistic hy-drodynamic boundary condition, while also preventing interchange between ooids in active transport and ooids at rest (e.g. as a bed of loose ooids). Without this interchange, the experimental time is assumed to be equal to the transport time for the population of ooids ( f = 1 in the experiment). The experimental results depend on Ωaragonite , however it is worth noting that non-marine envi-ronments like the Great Salt Lake could behave differently due to differences in fluid density through salinity and carbonate chem-istry.
For each experiment, all variables were held constant and the change in ooid size and shape was measured after 5 to 17 days of continuous transport. Carbonate speciation and Ωaragonite were tracked by measuring pH via electrode and assuming a constant pCO2 from vigorous mixing with the atmosphere (Fig. S3). The temperature was 21 ± 2 ◦C. Evaporative losses were mitigated by water addition to maintain a consistent experimental water vol-ume during each experiment. After each experiment, ooids were siphoned from each abrasion mill, sieved with 60 μm wire mesh, rinsed with deionized water, and dried.
Ooid populations were characterized before and after each ex-periment using transmitted and reflected light microscopy, scan-ning electron microscopy (Zeiss 1550VP Field Emission SEM at the Caltech GPS Division Analytical Facility), and grain size anal-ysis via the Microtrac Particle Size Analyzer at the University of Wyoming Sedimentary Petrology Lab (Fig. S4); mean grain size di-mensions from Particle Size Analyzer data are reproducible to <1% between measurements for samples >100,000 grains (Fig. S5). We estimated volumetric rates of ooid size change (dV p/dt)net by cal-culating the difference in mean grain volume per unit time, using mean major, intermediate, and minor grain axes determined via the Particle Size Analyzer and assuming an ellipsoidal grain shape. This method of measuring dV p/dt agreed closely with an inde-pendent estimate determined by directly measuring mass loss (see Supplementary Material).
Fig. 3. Secondary electron microscopy (SEM) images of ooid surface textures from both abrasion and growth experiments, using 15 kV accelerating voltage and 8–12 mm working distance. (a–b). Medium-sand-sized Bahamian ooids prior to (a) and after (b) an abrasion experiment showing exhumed microboring traces now ex-posed by abrasion on the polished surface. (c–d). Fine-sand-sized GSL ooids prior to (c) and after (d) a net precipitation experiment illustrating incipient aragonite laminae on the surface.
4. Results
The Bahamian ooids have thin cortices that are often mi-critized, irregular subangular to subrounded shapes, and diverse nuclei, while GSL ooids have thicker cortices with well-preserved textures, subrounded to well-rounded shapes, and two types of nuclei—micritized arthropod fecal pellets and angular quartz grains (Fig. S6). The Bahamian ooids are smaller and more elongated than the GSL ooids (Table S4). Experiments with net abrasion produced ooids with distinctly polished surfaces (Fig. 3a–b), while trials with net precipitation produced irregular geometric surface tex-tures characterized by aragonite precipitation (Fig. 3c–d). Abrasion-polished surfaces of Bahamian ooids commonly revealed networks of microborings (Fig. 3b)—trace fossils of endolithic microbes—comparable to those observed by acid leaching the outermost lay-ers of ooids (Duguid et al., 2010; Harris et al., 1979).
Most experiments (n = 19) produced net abrasion (dV p/dt <
0), but a subset of trials (n = 6) with finer initial grain size or lower u∗ produced net precipitation (dV p/dt > 0) (Fig. 4, Table S1), as expected if grain sizes were near Deq (Fig. 1). Experimen-tal net abrasion (mean 1.1 × 104 μm3/h) and precipitation (mean 5.2 × 103 μm3/h) rates were typically three to four orders of mag-nitude faster than typical radiocarbon net growth rates, but similar to the magnitude predicted using our model for the rate of abiotic carbonate precipitation (Fig. 4, Table S1). For a given ooid type and size (e.g. medium-sand-sized Bahamian ooids), observed abrasion rates were not sensitive to changes in u∗ except for low u∗ , where grains were nearest the threshold for motion and viscous damping of particle impacts was most likely to be significant (Fig. 4a, see Supplementary Material). Paired experiments varying initial grain size at fixed u∗ demonstrate that the sign of net ooid size change (i.e. net growth vs. net abrasion) can be modulated by initial grain size (Fig. 4c), supporting the hypothesis that, under our experi-

116 E.J. Trower et al. / Earth and Planetary Science Letters 468 (2017) 112–118
mental conditions, Deq is an intermediate value between these two grain sizes. In net abrasion experiments, the dimensions of Bahamian ooids were reduced subequally along all axes, while for the GSL ooids reduction of the major axis dimensions was approx-imately double that of the intermediate and minor axis dimen-sions (Fig. S7a). These shape changes are similar to the findings of Domokos et al. (2014) that pebble erosion occurs in two discrete
phases: an initial phase in which sharp edges abrade and round-ness increases, and a second phase in which particle aspect ratios evolve towards unity. Our ooid data generally follow these predic-tions: abrasion of the more angular Bahamian ooids appears to be partitioned more strongly into increasing roundness (Fig. S7b) than the initially more rounded GSL ooids.
5. Discussion and conclusions
Our experiments demonstrate that ooid abrasion rates are sig-nificantly more rapid than radiocarbon net growth rate across a range of transport conditions similar to those on natural ooid shoals (Fig. 4a). Intermittency of ooid transport and abrasion could provide a mitigating factor for rapid abrasion because ooids spend some fraction of their lifetimes at rest, for example in larger bar forms (Davies et al., 1978)—a phenomenon that was purposefully not replicated in our experiments. However, a very small inter-mittency factor ( f ) of ∼5 × 10⁻⁴ (<5 h of movement per year) would be required to reduce the magnitude of our observed time-averaged abrasion rates to that of even the most rapid radio-carbon net growth rate measured. This is in striking contrast to the frequent transport of vigorous suspended sediment transport observed in modern ooid-forming environments (Bathurst, 1975; Rankey et al., 2006). The experimental abrasion rates are simply far too large for intermittency in sediment transport to accommodate. The experimental abrasion rates do, however, match the rates of carbonate precipitation observed in our experiments under condi-tions typical of seawater chemistry and anticipated from field, ex-periment, and empirical-based estimates (Broecker and Takahashi, 1966; Ferguson et al., 1978; Zhong and Mucci, 1989) (Fig. 4).
The calibrated precipitation-abrasion model makes an impor-tant prediction that highlights the significance of sediment trans-port regime. For fine-sand-sized grains and finer, the model pre-dicts that abrasion rate increases monotonically with u∗ (Fig. S8). In contrast, for medium-sand-sized grains and coarser, the model predicts a local minimum in abrasion rate reflecting a trade-off between the frequent low energy impacts in bedload and the less frequent but more energetic impacts in suspended load. This trade-off is not observed in finer grain sizes due to viscous damping of lower energy impacts (Davis et al., 1986; Scheingross et al., 2014), but has significant implications for coarser grains because it illus-trates that abrasion rate can be reduced by increasing bed shear velocity such that more grains are transported in suspension. Thus abrasion rate does not increase monotonically with size as previ-ously envisioned (Fig. 1a), and consequently ooids can have larger
Fig. 4. Comparison of precipitation-abrasion ooid size model with experimental re-sults. (a) Modeled decrease in ooid size (−dV p/dt) for grain sizes bracketing ini-tial (346 and 334 μm) and final (334 and 310 μm) sizes of medium-sand-sized GSL and Bahamian ooids, respectively, versus u∗ for Ωaragonite = 2.9 and f = 1, compared with experimental results net abrasion rates for medium-sand-sized Ba-hamian (open orange diamonds) and GSL ooids (open grey circles). Each data point without error bars represents a single experimental trial, while data points with er-ror bars show the geometric mean and standard deviation of replicate trials, with the number of trials (n = 2 or 3) indicated next to the data point. (b) Modeled in-crease in ooid size (dV p/dt) versus u∗ for f = 1, compared with experimental net precipitation rates for medium-sand-sized Bahamian ooids (solid orange diamonds), fine-sand-sized Bahamian ooids (solid red diamonds) and fine-sand-sized GSL ooids (solid grey circles). Note that the net precipitation observed with fine Bahamian ooids is far less than the similarly sized fine GSL ooids and the model predictions, perhaps suggesting some kinetic limitation for this combination of experimental parameters. (c) Paired experimental trials demonstrating that varying grain size can modulate whether ooids experience net growth (dV p/dt > 0) or net abrasion (dV p/dt < 0) via its impact on transport stage. These trials used fine-sand-sized and medium-sand-sized GSL and Bahamian ooids at shear velocities, demonstrating that finer grain sizes experienced net growth, while coarser grain sizes experienced net abrasion. Note that rates in (c) are plotted on a linear scale, while rates in (a) and (b) are on a logarithmic scale. Different Stokes thresholds in (b) are discussed in Supplementary Material. (For interpretation of the references to color in this figure legend, the reader is referred to the web version of this article.)

E.J. Trower et al. / Earth and Planetary Science Letters 468 (2017) 112–118 117
Deq in higher energy environments—all else kept equal. While in-creased agitation has been suggested as a possible mechanism for producing larger ooids under the monotonic growth model by virtue of allowing larger grains to be suspended and therefore in-creasing τooid (Bathurst, 1975; Sumner and Grotzinger, 1993), the dynamic equilibrium model predicts that larger ooids can occur for higher u∗ because abrasion is minimized, regardless of τooid .
Our experimental results support the dynamic equilibrium model of ooid growth (Fig. 1b): the sign of net ooid size change (i.e. net growth vs. net abrasion) can be changed by varying grain size (Fig. 4c), indicating that Deq in our experiments was within the range of typical natural ooid sizes in modern environments. The monotonic growth theory predicts that ooids should not expe-rience significant abrasion, regardless of size, but our experiments demonstrate net abrasion for a range of transport stages, indicat-ing that ooid size is not a simple monotonic positive function of τooid . Our experiments also demonstrate net growth under con-ditions of constant sediment transport, indicating that biofilms developed on ooids at rest are not required for ooid growth. Fur-thermore, the rapid experimental precipitation rates suggest that grains at rest would be cemented to the bed rather than grow slowly, while, conversely, the rapid experimental abrasion rates in-dicate that typical ooids would rapidly decay in size on timescales of hours in active shoal settings if abrasion was not balanced by precipitation for actively transported grains (Fig. S9). Our data im-ply that both precipitation and abrasion play significant roles in determining ooid size change (eqn. (1)) and that ooids may spend much of their lifetime near an equilibrium size, Deq , represent-ing a dynamic balance between abrasion and precipitation (that is, (dV p/dt)net = 0).
The rapid experimental net precipitation and net abrasion rates suggest that teq , the timescale to approach Deq , is short relative to a typical ooid lifetime (τooid) (see Supplementary Material), such that natural ooids should often have sizes near Deq . We can there-fore apply the calibrated ooid precipitation-abrasion model to gen-erate expectations of ooid size (i.e. Deq) in natural settings. Fig. 5a compares values of Deq predicted by the precipitation-abrasion model as a function of u∗ and Ωaragonite with the observed size ranges of modern and ancient ooids. For f = 0.05 (Bathurst, 1975; Davies et al., 1978) and suspended load transport (0.8 > P > 2.5), the model predicts equilibrium ooid sizes ranging from 350 to 1000 μm (Fig. 5b), consistent with the distributions of ooid sizes in modern marine and lacustrine environments and typical oolitic grainstones in the rock record (Bathurst, 1975; Peryt, 1983). In general, we predict that larger ooids require some combination of higher u∗ , higher Ωaragonite , and lower f (less frequent movement) and that u∗ has the most power to affect equilibrium ooid size without requiring a change in precipitation rate for transport near the threshold of suspension (Fig. 5b)—the regime in which ooids are commonly transported (Bathurst, 1975; Rankey et al., 2006). Energetic transport, therefore, may have been critical for the pro-duction of large ancient ooids.
Notably, the dynamic equilibrium model does not require in-dependent constraints on individual ooid lifetimes or net growth rates, which is useful not only for analyzing ancient ooid grain-stones but also for contextualizing radiocarbon ages and net growth rates of modern ooids. Ages of modern ooids suggest that they are relatively long-lived particles, while sequential ra-diocarbon dating of modern ooid cortices by Beaupré et al. (2015)suggested that growth was relatively steady, if slow, in modern ooids from Australia and the Bahamas. While the precipitation and abrasion rates determined experimentally in this study indicate that ooids should approach Deq rapidly relative to τooid (see Sup-plementary Material), we also expect that Deq should be dynamic over an ooid’s lifetime, particularly due to variable transport con-ditions. Individual ooids may alternate through episodes of net
Fig. 5. Testing the dynamic equilibrium ooid size hypothesis with the calibrated precipitation-abrasion model. (a) Modeled magnitudes of precipitation (green line), abrasion (yellow line), and net size change (dashed black line) rates (|dV p/dt|) vs. grain size (D) for u∗ = 0.05 m/s (near the threshold of suspension for medium-sand-sized grains), f = 1, and Ωaragonite = 2.9, with transport regimes indicated along the top. An equilibrium grain size (Deq) is predicted where precipitation and abrasion rate are equal and |dV p/dt|net goes to zero (purple line). Where grains are below the threshold of motion, abrasion rate drops to zero and ooids are not predicted to form (rightmost region). Grey box indicates range of experi-mental |dV p/dt|net . (b) Predicted equilibrium grain size, Deq , vs. u∗ for a range of Ωaragonite and f . Transport regimes are indicated by Rouse number curves (black lines; P = 2.5 solid, P = 1.2 dashed, P = 0.8 dash–dot). The model predicts that Deq can be increased by increasing Ωaragonite , decreasing f , or, for Ωaragonite ≥ 3, by increasing shear velocity in order to transport more grains in suspension. (For in-terpretation of the references to color in this figure legend, the reader is referred to the web version of this article.)
precipitation and net abrasion throughout their lifetimes (Fig. 1b). We therefore expect that the carbonate preserved in an ooid cor-tex reflects only a portion of the total material added to that ooid via precipitation over its lifetime, the balance of which has been removed during episodes of net abrasion. With this consider-ation, the radiocarbon content of ooid cortices represents only the portions of net precipitation episodes that have been preserved throughout individual ooid histories and is likely to record ap-parent net growth rates that are much slower than instantaneous rates.
118 E.J. Trower et al. / Earth and Planetary Science Letters 468 (2017) 112–118
Finally, the dynamic equilibrium model generates straightfor-ward testable predictions about ooid size that can be validated in modern systems. In particular, the model predicts that, given a constant Ωaragonite , there should be a clear relationship between sediment transport mode and ooid size: zones characterized by suspended load transport should produce larger ooids than zones where sediment transport dominantly occurs in the bed load. Con-versely, ooid size should also be sensitive to changes in carbonate saturation state if transport mode remains constant: for example, the model predicts decreases in ooid size in response to ocean acidification. More broadly, the dynamic equilibrium model indi-cates that ooid size provides a direct record of physical and chem-ical conditions of Earth surface environments, such that sedimen-tological observations of ooid grainstones can be used to quantify the carbonate chemistry of ancient seawater, harnessing a hitherto unrealized potential of ooids as paleoenvironmental proxies.
Acknowledgements
We thank Brian Fuller and Joel Scheingross for assistance with the abrasion mills. Particle size analysis was made in collaboration with Brandon McElroy, who also provided fantastic feedback. We thank John Grotzinger and Frank Corsetti for helpful discussions on this work. EJT acknowledges support from an Agouron Geobiol-ogy Postdoctoral Fellowship. This work was also supported by the Agouron Institute and an American Chemical Society Petroleum Re-search Fund Grant #56757-ND8 (to WWF). The data used are listed in the references, tables, and supplements.
Appendix A. Supplementary material
Supplementary material related to this article can be found on-line at http://dx.doi.org/10.1016/j.epsl.2017.04.004.
References
Bathurst, R.G.C., 1975. Carbonate Sediments and Their Diagenesis. Elsevier Publish-ing Co., Amsterdam.
Beaupré, S.R., Roberts, M.L., Burton, J.R., Summons, R.E., 2015. Rapid, high-resolution 14C chronology of ooids. Geochim. Cosmochim. Acta 159, 126–138.
Broecker, W.S., Takahashi, T., 1966. Calcium carbonate precipitation on the Bahama Banks. J. Geophys. Res. 71, 1575–1602.
Davies, P.J., Bubela, B., Ferguson, J., 1978. Formation of ooids. Sedimentology 25, 703–730.
Davis, R.H., Serayssol, J.-M., Hinch, E., 1986. The elastohydrodynamic collision of two spheres. J. Fluid Mech. 163, 479–497.
Diaz, M.R., Swart, P.K., Eberli, G.P., Oehlert, A.M., Devlin, Q., Saeid, A., Altabet, M.A., 2015. Geochemical evidence of microbial activity within ooids. Sedimentol-ogy 62, 2090–2112.
Domokos, G., Jerolmack, D.J., Sipos, A.Á., Török, Á., 2014. How river rocks round: resolving the shape-size paradox. PLoS ONE 9, e88657.
Duguid, S.M.A., Kyser, T.K., James, N.P., Rankey, E.C., 2010. Microbes and ooids. J. Sed-iment. Res. 80, 236–251.
Ferguson, J., Bubela, B., Davies, P.J., 1978. Synthesis and possible mechanism of for-mation of radial carbonate ooids. Chem. Geol. 22, 285–305.
Gomez, B., Rosser, B.J., Peacock, D.H., Hicks, D.M., Palmer, J.A., 2001. Downstream fining in a rapidly aggrading gravel bed river. Water Resour. Res. 37, 1813–1823.
Grant, W.D., Madsen, O.S., 1982. Movable bed roughness in unsteady oscillatory flow. J. Geophys. Res., Oceans 87, 469–481.
Harris, P.M., Halley, R.B., Lukas, K.J., 1979. Endolith microborings and their preserva-tion in Holocene–Pleistocene (Bahama–Florida) ooids. Geology 7, 216–220.
Heller, P.L., Komar, P.D., Pevear, D.R., 1980. Transport processes in ooid genesis. J. Sediment. Res. 50.
Kahle, C.F., 1974. Ooids from Great Salt Lake, Utah, as an analogue for the genesis and diagenesis of ooids in marine limestones. J. Sediment. Res. 44.
Kodama, Y., 1994. Downstream changes in the lithology and grain size of fluvial gravels, the Watarase River, Japan: evidence of the role of abrasion in down-stream fining. J. Sediment. Res. 64.
Lamb, M.P., Dietrich, W.E., Sklar, L.S., 2008. A model for fluvial bedrock incision by impacting suspended and bed load sediment. J. Geophys. Res., Earth Surf. 113.
Leeder, M., 1979. ‘Bedload’ dynamics: grain–grain interactions in water flows. Earth Surf. Process. 4, 229–240.
Lewin, J., Brewer, P., 2002. Laboratory simulation of clast abrasion. Earth Surf. Pro-cess. Landf. 27, 145–164.
Li, F., Yan, J., Chen, Z.-Q., Ogg, J.G., Tian, L., Korngreen, D., Liu, K., Ma, Z., Woods, A.D., 2015. Global oolite deposits across the Permian–Triassic boundary: a synthe-sis and implications for palaeoceanography immediately after the end-Permian biocrisis. Earth-Sci. Rev. 149, 163–180.
Loreau, J.-P., Purser, B., 1973. Distribution and ultrastructure of Holocene ooids in the Persian Gulf. In: The Persian Gulf. Springer, pp. 279–328.
Mackenzie, F., Pigott, J., 1981. Tectonic controls of Phanerozoic sedimentary rock cy-cling. J. Geol. Soc. 138, 183–196.
Mariotti, G., Pruss, S., Summons, R., Newman, S., Bosak, T., 2014. Where is the ooid factory? In: AGU Fall Meeting Abstracts, p. 04.
Medwedeff, D.A., Wilkinson, B.H., 1983. Cortical fabrics in calcite and aragonite ooids. In: Coated Grains. Springer, pp. 109–115.
Morse, J.W., Arvidson, R.S., Lüttge, A., 2007. Calcium carbonate formation and disso-lution. Chem. Rev. 107, 342–381.
O’Reilly, S., Mariotti, G., Winter, A., Newman, S., Matys, E., McDermott, F., Pruss, S., Bosak, T., Summons, R., Klepac-Ceraj, V., 2017. Molecular biosignatures reveal common benthic microbial sources of organic matter in ooids and grapestones from Pigeon Cay, The Bahamas. Geobiology 15 (1), 112–130.
Pacton, M., Ariztegui, D., Wacey, D., Kilburn, M.R., Rollion-Bard, C., Farah, R., Vas-concelos, C., 2012. Going nano: a new step toward understanding the processes governing freshwater ooid formation. Geology 40, 547–550.
Parker, G., 1991. Selective sorting and abrasion of river gravel. I: Theory. J. Hydraul. Eng. 117, 131–147.
Peryt, T.M., 1983. Coated Grains. Springer-Verlag, New York.Rankey, E.C., Riegl, B., Steffen, K., 2006. Form, function and feedbacks in a tidally
dominated ooid shoal, Bahamas. Sedimentology 53, 1191–1210.Sandberg, P.A., 1983. An oscillating trend in Phanerozoic non-skeletal carbonate
mineralogy. Nature 305, 19–22.Scheingross, J.S., Brun, F., Lo, D.Y., Omerdin, K., Lamb, M.P., 2014. Experimental ev-
idence for fluvial bedrock incision by suspended and bedload sediment. Geol-ogy 42, 523–526.
Sklar, L.S., Dietrich, W.E., 2001. Sediment and rock strength controls on river incision into bedrock. Geology 29, 1087–1090.
Sklar, L.S., Dietrich, W.E., 2004. A mechanistic model for river incision into bedrock by saltating bed load. Water Resour. Res. 40.
Strasser, A., 1986. Ooids in Purbeck limestones (lowermost Cretaceous) of the Swiss and French Jura. Sedimentology 33, 711–727.
Suess, E., Fütterer, D., 1972. Aragonitic ooids: experimental precipitation from sea-water in the presence of humic acids. Sedimentology 19, 129–139.
Summons, R.E., Bird, L.R., Gillespie, A.L., Pruss, S.B., Roberts, M.T., Sessions, A.L., 2013. Lipid biomarkers in ooids from different locations and ages: evidence for a common bacterial flora. Geobiology 11, 420–436.
Sumner, D.Y., Grotzinger, J.P., 1993. Numerical modeling of ooid size and the prob-lem of Neoproterozoic giant ooids. J. Sediment. Petrol. 63, 974–982.
Swett, K., Knoll, A.H., 1989. Marine pisolites from Upper Proterozoic carbonates of East Greenland and Spitsbergen. Sedimentology 36, 75–93.
Van Ee, N.J., Wanless, H.R., 2008. Ooids and grapestone – a significant source of mud on Caicos Platform. In: Morgan, W.A., Harris, P.M. (Eds.), Developing Models and Analogs for Isolated Carbonate Platforms – Holocene and Pleistocene Carbonates of Caicos Platform, British West Indies. SEPM Society for Sedimentary Geology, pp. 121–125.
Walter, L.M., Burton, E.A., 1990. Dissolution of recent platform carbonate sediments in marine pore fluids. Am. J. Sci. 290, 601–643.
Walter, L.M., Morse, J.W., 1984. Reactive surface area of skeletal carbonates during dissolution: effect of grain size. J. Sediment. Res. 54.
Wilkinson, B.H., Owen, R.M., Carroll, A.R., 1985. Submarine hydrothermal weather-ing, global eustasy, and carbonate polymorphism in Phanerozoic marine oolites. J. Sediment. Res. 55.
Zempolich, W.G., Wilkinson, B.H., Lohmann, K.C., 1988. Diagenesis of late Protero-zoic carbonates: the Beck Spring Dolomite of eastern California. J. Sediment. Petrol. 58, 656–672.
Zhong, S., Mucci, A., 1989. Calcite and aragonite precipitation from seawater so-lutions of various salinities: precipitation rates and overgrowth compositions. Chem. Geol. 78, 283–299.