Earscan Acoustic Impedance Audiometer (ES-TRAM) -...
33
Earscan Acoustic Impedance Microprocessor Audiometer with Data Output OWNER’S MANUAL Micro Audiometrics Corporation 655 Keller Rd. Murphy, North Carolina 28906-5890 Voice: (828) 644-0771 Fax: (828) 644-0772 Internet: www.microaud.com Email: [email protected] 1984 - 2002 18 September 1997 ESM 2.26 Information furnished in this manual is believed to be accurate, however, no responsibility is assumed by Micro Audiometrics for its use. No part of this manual may be reproduced without written permission. Printed in USA, 0602.
Transcript of Earscan Acoustic Impedance Audiometer (ES-TRAM) -...
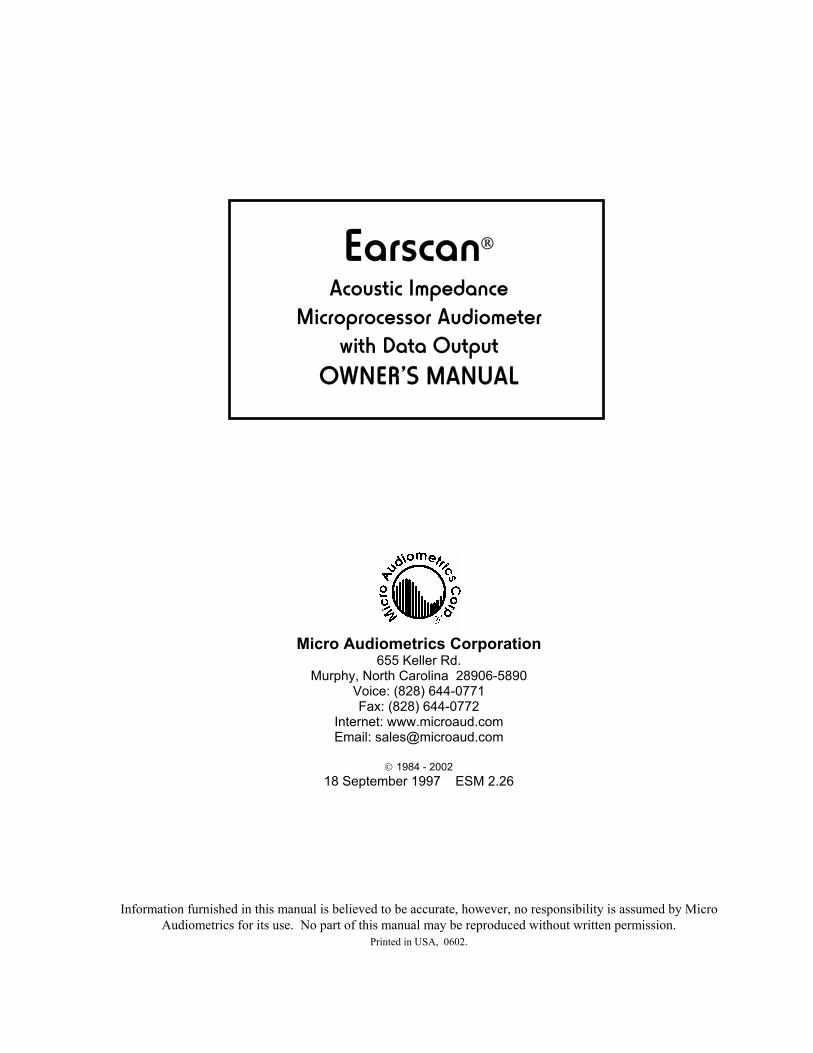
Earscan
Acoustic Impedance Microprocessor Audiometer
with Data Output OWNER’S MANUAL
Micro Audiometrics Corporation
655 Keller Rd. Murphy, North Carolina 28906-5890
Voice: (828) 644-0771 Fax: (828) 644-0772
Internet: www.microaud.com Email: [email protected]
1984 - 2002
18 September 1997 ESM 2.26
Information furnished in this manual is believed to be accurate, however, no responsibility is assumed by Micro Audiometrics for its use. No part of this manual may be reproduced without written permission.
Printed in USA, 0602.
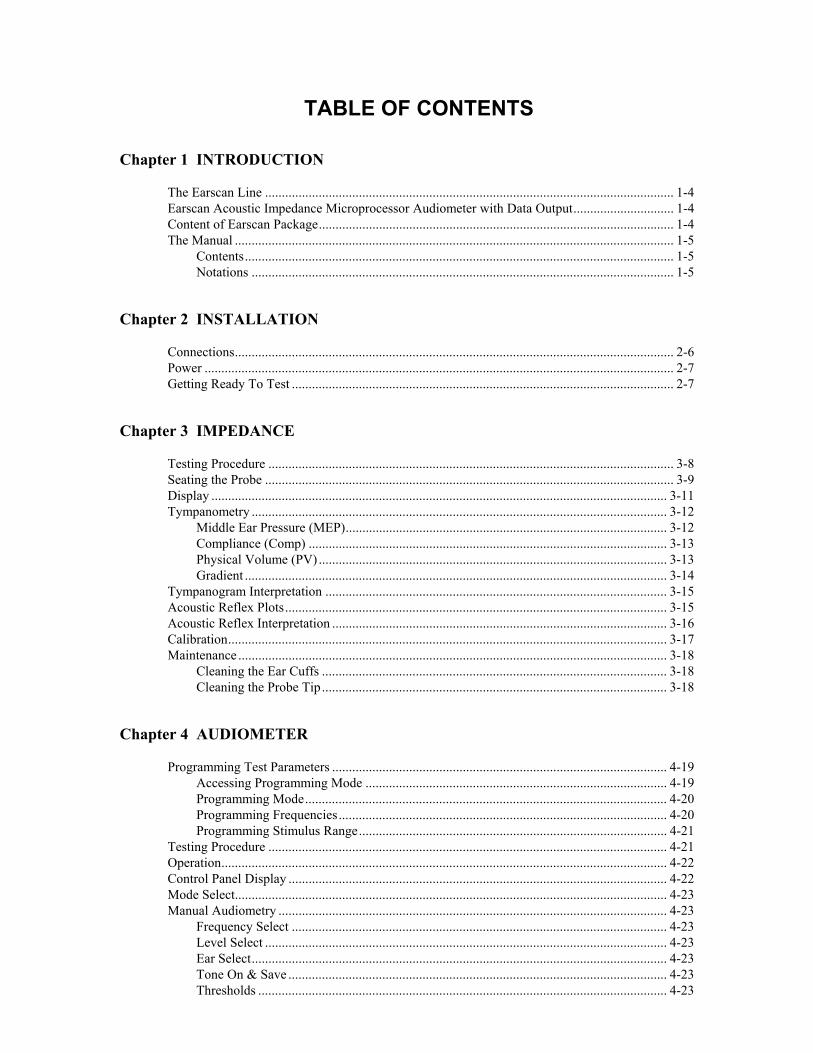
TABLE OF CONTENTS Chapter 1 INTRODUCTION The Earscan Line .......................................................................................................................... 1-4 Earscan Acoustic Impedance Microprocessor Audiometer with Data Output.............................. 1-4 Content of Earscan Package.......................................................................................................... 1-4 The Manual ................................................................................................................................... 1-5 Contents................................................................................................................................ 1-5 Notations .............................................................................................................................. 1-5 Chapter 2 INSTALLATION Connections................................................................................................................................... 2-6 Power ............................................................................................................................................ 2-7 Getting Ready To Test .................................................................................................................. 2-7 Chapter 3 IMPEDANCE Testing Procedure ......................................................................................................................... 3-8 Seating the Probe .......................................................................................................................... 3-9 Display ........................................................................................................................................ 3-11 Tympanometry ............................................................................................................................ 3-12 Middle Ear Pressure (MEP)................................................................................................ 3-12 Compliance (Comp) ........................................................................................................... 3-13 Physical Volume (PV) ........................................................................................................ 3-13 Gradient .............................................................................................................................. 3-14 Tympanogram Interpretation ...................................................................................................... 3-15 Acoustic Reflex Plots.................................................................................................................. 3-15 Acoustic Reflex Interpretation .................................................................................................... 3-16 Calibration................................................................................................................................... 3-17 Maintenance ................................................................................................................................ 3-18 Cleaning the Ear Cuffs ....................................................................................................... 3-18 Cleaning the Probe Tip....................................................................................................... 3-18 Chapter 4 AUDIOMETER Programming Test Parameters .................................................................................................... 4-19 Accessing Programming Mode .......................................................................................... 4-19 Programming Mode............................................................................................................ 4-20 Programming Frequencies.................................................................................................. 4-20 Programming Stimulus Range............................................................................................ 4-21 Testing Procedure ....................................................................................................................... 4-21 Operation..................................................................................................................................... 4-22 Control Panel Display ................................................................................................................. 4-22 Mode Select................................................................................................................................. 4-23 Manual Audiometry .................................................................................................................... 4-23 Frequency Select ................................................................................................................ 4-23 Level Select ........................................................................................................................ 4-23 Ear Select............................................................................................................................ 4-23 Tone On & Save ................................................................................................................. 4-23 Thresholds .......................................................................................................................... 4-23
Automatic Audiometry................................................................................................................ 4-24 Start Testing........................................................................................................................ 4-24 Test Protocol for Automatic Testing .................................................................................. 4-25 Threshold Version...................................................................................................... 4-25 Pass/Fail Screening Version ...................................................................................... 4-25 Pause................................................................................................................................... 4-25 Abort................................................................................................................................... 4-25 Restart................................................................................................................................. 4-25 Retest .................................................................................................................................. 4-26 Display Thresholds ..................................................................................................................... 4-26 Scale of Hearing loss................................................................................................................... 4-26 Chapter 5 REPORTS Types of Reports ......................................................................................................................... 5-27 Data Description ......................................................................................................................... 5-27 Loading Information ................................................................................................................... 5-28 Ear Testing ......................................................................................................................... 5-28 User-Entered Numbers ....................................................................................................... 5-28 Reports ........................................................................................................................................ 5-29 Immediate Reports.............................................................................................................. 5-29 Hand-Recorded Reports ..................................................................................................... 5-29 Hard Copy Reports ............................................................................................................. 5-29 "Tymp Speed" Distinction ......................................................................................... 5-29 Graphs and Data......................................................................................................... 5-29 Data Only................................................................................................................... 5-30 Group Reports............................................................................................................ 5-30 Output to Computer ............................................................................................................ 5-30 Clearing Data Between Tests ...................................................................................................... 5-30 Addendum Keypad Summary Abbreviations Suggested Reading Limited Warranty Instrument Return
Introduction 1 - 4
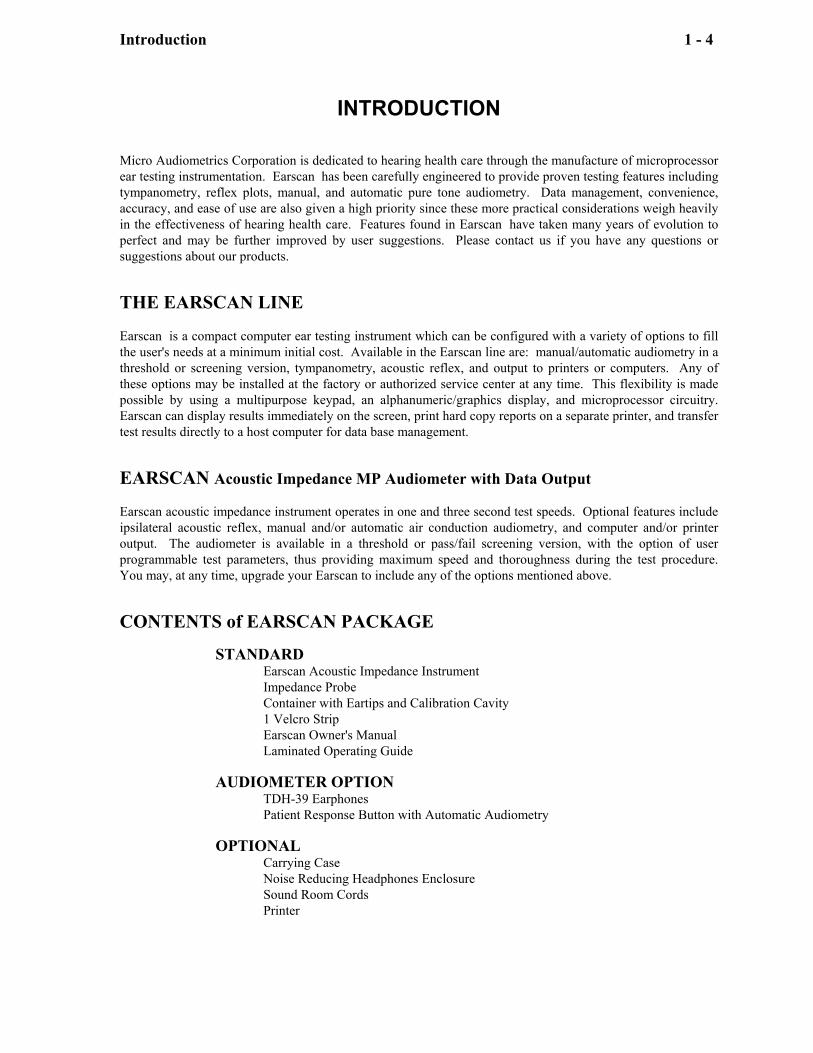
INTRODUCTION Micro Audiometrics Corporation is dedicated to hearing health care through the manufacture of microprocessor ear testing instrumentation. Earscan has been carefully engineered to provide proven testing features including tympanometry, reflex plots, manual, and automatic pure tone audiometry. Data management, convenience, accuracy, and ease of use are also given a high priority since these more practical considerations weigh heavily in the effectiveness of hearing health care. Features found in Earscan have taken many years of evolution to perfect and may be further improved by user suggestions. Please contact us if you have any questions or suggestions about our products. THE EARSCAN LINE Earscan is a compact computer ear testing instrument which can be configured with a variety of options to fill the user's needs at a minimum initial cost. Available in the Earscan line are: manual/automatic audiometry in a threshold or screening version, tympanometry, acoustic reflex, and output to printers or computers. Any of these options may be installed at the factory or authorized service center at any time. This flexibility is made possible by using a multipurpose keypad, an alphanumeric/graphics display, and microprocessor circuitry. Earscan can display results immediately on the screen, print hard copy reports on a separate printer, and transfer test results directly to a host computer for data base management. EARSCAN Acoustic Impedance MP Audiometer with Data Output Earscan acoustic impedance instrument operates in one and three second test speeds. Optional features include ipsilateral acoustic reflex, manual and/or automatic air conduction audiometry, and computer and/or printer output. The audiometer is available in a threshold or pass/fail screening version, with the option of user programmable test parameters, thus providing maximum speed and thoroughness during the test procedure. You may, at any time, upgrade your Earscan to include any of the options mentioned above. CONTENTS of EARSCAN PACKAGE STANDARD
Earscan Acoustic Impedance Instrument Impedance Probe Container with Eartips and Calibration Cavity 1 Velcro Strip Earscan Owner's Manual Laminated Operating Guide
AUDIOMETER OPTION
TDH-39 Earphones Patient Response Button with Automatic Audiometry
OPTIONAL
Carrying Case Noise Reducing Headphones Enclosure Sound Room Cords Printer
Introduction 1 - 5
THE MANUAL Earscan is capable of a wide variety of functions but may be operated by knowing only one function and not the others. For example, if you wish to determine middle ear impedance characteristics and do not require an audiogram or a permanent report, you do not need to refer to the sections on audiometry and reports.
CONTENTS This manual is divided into chapters and an appendix. Refer to the Table of Contents for a listing of each topic and its location in the manual. The following is a summary of the contents of the manual:
INTRODUCTION A basic description of Earscan and this manual. INSTALLATION Instructions for external connections and basic operation. IMPEDANCE Procedures for operating the impedance section and a discussion of
tympanograms and reflex plots. AUDIOMETRY Procedures for operating the manual and automatic audiometer and a
discussion of audiograms. REPORTS Procedures for using the keypad to enter date, operator and patient ID
numbers, printing reports, or sending reports to a computer.
NOTATIONS This manual uses the following notations to illustrate user interaction with the Earscan.
KEY ENTRIES appear in < > i.e. <AUD>. MULTIPLE ENTRIES appear in the order shown and must be keyed-in sequentially. i.e.
<SPEC>, <ID> DISPLAY MESSAGES appear in the manual as shown:
MICRO AUDIOMETRICS
(EI ###)
Installation 2 - 6
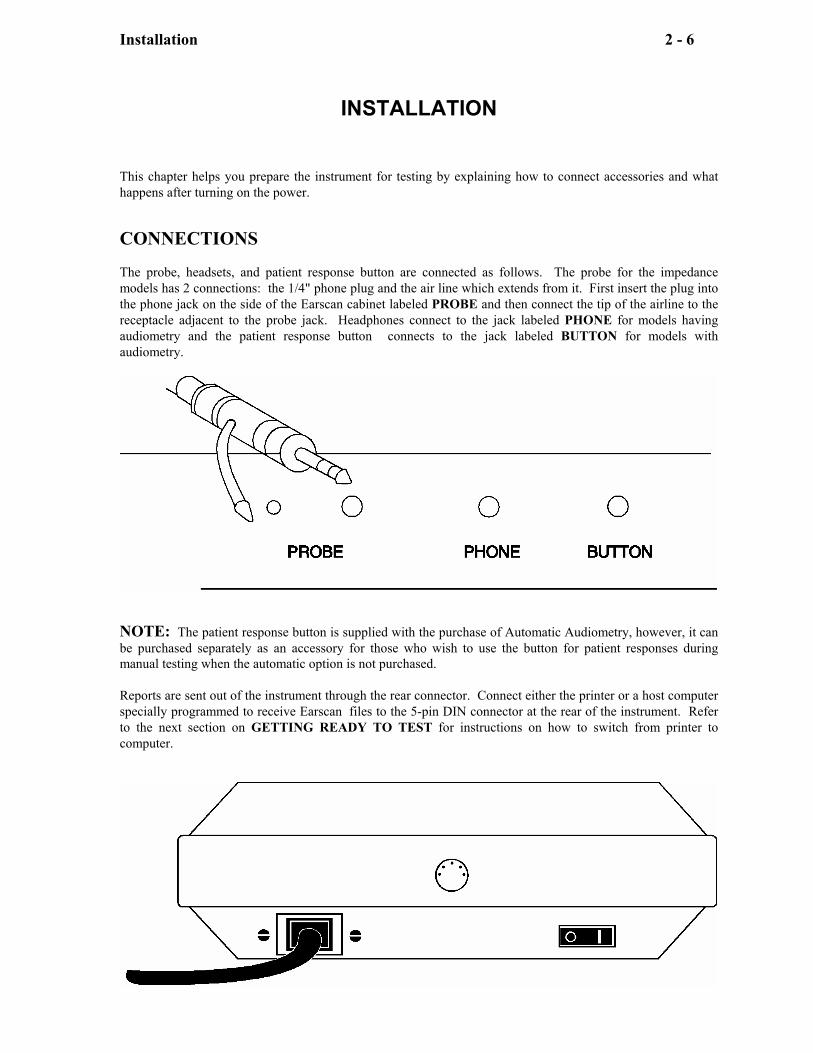
INSTALLATION This chapter helps you prepare the instrument for testing by explaining how to connect accessories and what happens after turning on the power. CONNECTIONS The probe, headsets, and patient response button are connected as follows. The probe for the impedance models has 2 connections: the 1/4" phone plug and the air line which extends from it. First insert the plug into the phone jack on the side of the Earscan cabinet labeled PROBE and then connect the tip of the airline to the receptacle adjacent to the probe jack. Headphones connect to the jack labeled PHONE for models having audiometry and the patient response button connects to the jack labeled BUTTON for models with audiometry.
NOTE: The patient response button is supplied with the purchase of Automatic Audiometry, however, it can be purchased separately as an accessory for those who wish to use the button for patient responses during manual testing when the automatic option is not purchased. Reports are sent out of the instrument through the rear connector. Connect either the printer or a host computer specially programmed to receive Earscan files to the 5-pin DIN connector at the rear of the instrument. Refer to the next section on GETTING READY TO TEST for instructions on how to switch from printer to computer.
Installation 2 - 7
POWER Insert the female connector of the power cord into the power receptacle of Earscan on the rear of the unit. Connect the 3-conductor power cord to a properly grounded outlet which supplies the voltage specified on the serial number tag on the bottom of the instrument. GETTING READY TO TEST Switch power on by pressing the 1 on the switch located on the rear of the unit. The screen will display the message below for approximately two seconds while the internal calibration and the diagnostics take place.
MICRO AUDIOMETRICS
(EI ###)
Earscan then displays which output device may be connected to its serial port.
MAKE SELECTION
Output To Printer
The Printer / Computer selection may be changed back and forth by pressing <SPEC>, <DATA>.
MAKE SELECTION
Output To Computer
The Manual Audiometer can present the stimulus as a 3-pulsed tone or continuous tone by toggling <SPEC>, <AUD>. Normal default is to the 3-pulsed tone. The Impedance test can be run in the normal or fast mode by pressing <SPEC>,<IMP>,<1> for fast or <2> for normal mode. Normal default is to the normal tymp speed. The printer paper formfeed can be manual or automatic by toggling <SPEC>, <GRAPH>. When at the "MAKE SELECTION" screen, the test options selected can be displayed by pressing <DISP>:
IMP :Normal SCALE :1ml fs STIM :Pulsed FORMFD :Manual
Impedance 3 - 8
IMPEDANCE
Earscan may be equipped to conduct acoustic impedance testing. A tympanogram is automatically made by simply sealing the probe in the ear and allowing the internal computer to produce necessary air pressure changes and plot corresponding impedance values. Reflex plots may also be generated by maintaining an ear seal after the completion of the tympanogram and plotting impedance changes during 1 kHz and 2 kHz ipsilateral stimulus pulses. TESTING PROCEDURE Impedance testing is accomplished by sealing the probe in the ear for a few seconds. A tympanogram is instantly displayed.
1. Press <IMP> if not already in the impedance mode. 2. Seal probe in ear. Audible and visual clues will assist you with proper placement. Test is in
progress when the word TESTING appears on the screen.
-> TESTING <-
3. Hold probe steady during testing. 4. If reflexes are not required remove the probe when the audible signal changes pitch and the
tympanogram appears on the screen or else continue holding the probe steady until the audible signal stops and the following message appears:
REMOVE PROBE!
5. Press <DISP> to cycle display of tympanogram, alphanumeric data, and reflex plots. Retest
if necessary by repeating steps 2-5. 6. Press <RIGHT/LEFT> to change ears and repeat steps 2-5. Add audiometric data to the
record, if desired, and save the results by following the procedure in REPORTS.
Impedance 3 - 9
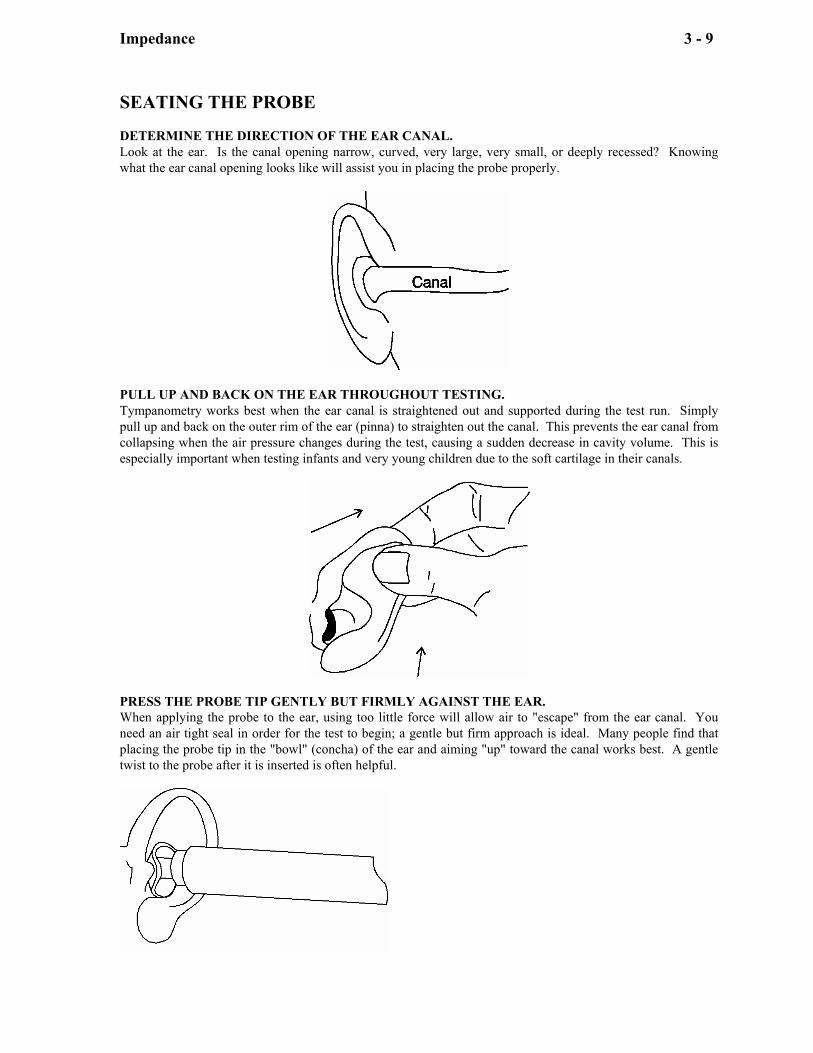
SEATING THE PROBE DETERMINE THE DIRECTION OF THE EAR CANAL. Look at the ear. Is the canal opening narrow, curved, very large, very small, or deeply recessed? Knowing what the ear canal opening looks like will assist you in placing the probe properly.
PULL UP AND BACK ON THE EAR THROUGHOUT TESTING. Tympanometry works best when the ear canal is straightened out and supported during the test run. Simply pull up and back on the outer rim of the ear (pinna) to straighten out the canal. This prevents the ear canal from collapsing when the air pressure changes during the test, causing a sudden decrease in cavity volume. This is especially important when testing infants and very young children due to the soft cartilage in their canals.
PRESS THE PROBE TIP GENTLY BUT FIRMLY AGAINST THE EAR. When applying the probe to the ear, using too little force will allow air to "escape" from the ear canal. You need an air tight seal in order for the test to begin; a gentle but firm approach is ideal. Many people find that placing the probe tip in the "bowl" (concha) of the ear and aiming "up" toward the canal works best. A gentle twist to the probe after it is inserted is often helpful.
Impedance 3 - 10
Proper probe placement is essential for accurate impedance measurements. Improper placement can cause slow starting, prolonged runs, noisy plots, and inconsistent results. If the probe is too loosely sealed air will leak, delay start-up, and possibly prolong the run time. If the probe is misaligned or pressed too firmly it may become blocked and inhibit start-up. Probe movement during a run will result in a wiggly tympanogram and reflex plot. This section will help you achieve satisfactory seals. Earscan will assist you in probe placement by signaling the operator with both auditory and visual messages. An air leak is signaled by the message:
AIR LEAK
A blocked probe is signaled by a high pitched tone and the message:
BLOCK
If the seal is satisfactory and the air pressure is building to the +200 daPa starting point the screen will read:
STEADY
Once all conditions have been met testing will begin and the screen will display:
-> TESTING <-
Impedance 3 - 11
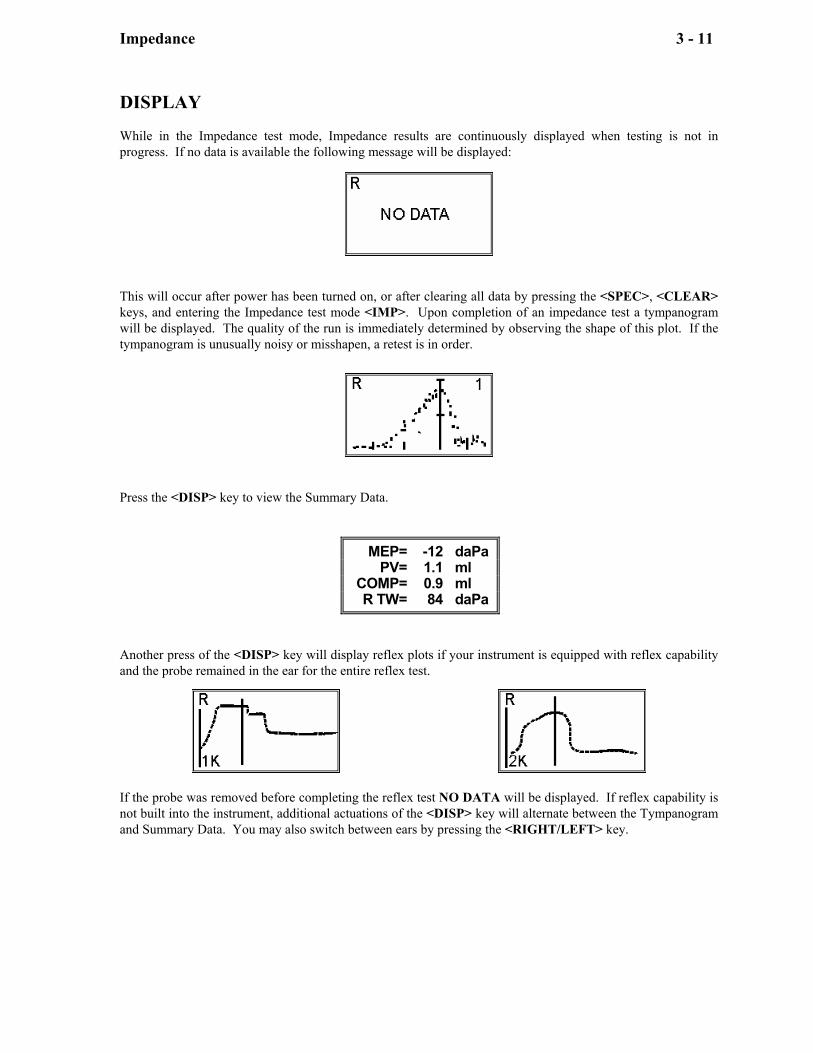
DISPLAY While in the Impedance test mode, Impedance results are continuously displayed when testing is not in progress. If no data is available the following message will be displayed:
This will occur after power has been turned on, or after clearing all data by pressing the <SPEC>, <CLEAR> keys, and entering the Impedance test mode <IMP>. Upon completion of an impedance test a tympanogram will be displayed. The quality of the run is immediately determined by observing the shape of this plot. If the tympanogram is unusually noisy or misshapen, a retest is in order.
Press the <DISP> key to view the Summary Data.
MEP= -12 daPa PV= 1.1 ml COMP= 0.9 ml R TW= 84 daPa
Another press of the <DISP> key will display reflex plots if your instrument is equipped with reflex capability and the probe remained in the ear for the entire reflex test.
If the probe was removed before completing the reflex test NO DATA will be displayed. If reflex capability is not built into the instrument, additional actuations of the <DISP> key will alternate between the Tympanogram and Summary Data. You may also switch between ears by pressing the <RIGHT/LEFT> key.
Impedance 3 - 12
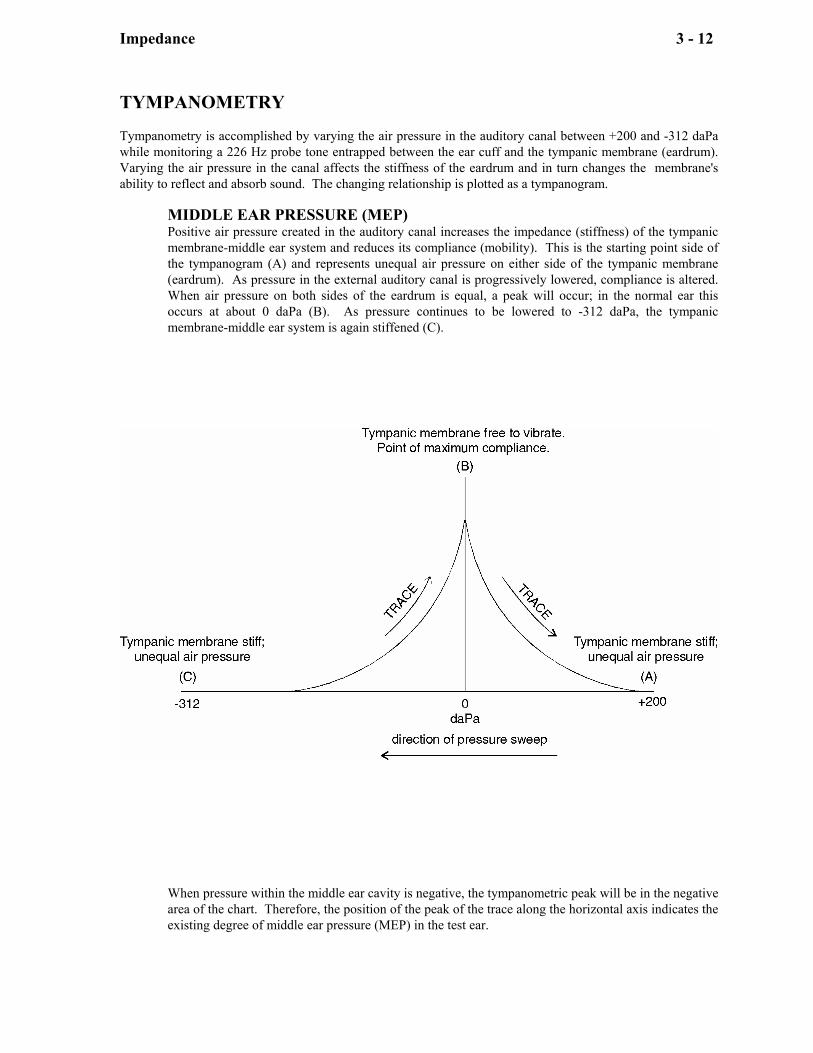
TYMPANOMETRY Tympanometry is accomplished by varying the air pressure in the auditory canal between +200 and -312 daPa while monitoring a 226 Hz probe tone entrapped between the ear cuff and the tympanic membrane (eardrum). Varying the air pressure in the canal affects the stiffness of the eardrum and in turn changes the membrane's ability to reflect and absorb sound. The changing relationship is plotted as a tympanogram.
MIDDLE EAR PRESSURE (MEP) Positive air pressure created in the auditory canal increases the impedance (stiffness) of the tympanic membrane-middle ear system and reduces its compliance (mobility). This is the starting point side of the tympanogram (A) and represents unequal air pressure on either side of the tympanic membrane (eardrum). As pressure in the external auditory canal is progressively lowered, compliance is altered. When air pressure on both sides of the eardrum is equal, a peak will occur; in the normal ear this occurs at about 0 daPa (B). As pressure continues to be lowered to -312 daPa, the tympanic membrane-middle ear system is again stiffened (C).
When pressure within the middle ear cavity is negative, the tympanometric peak will be in the negative area of the chart. Therefore, the position of the peak of the trace along the horizontal axis indicates the existing degree of middle ear pressure (MEP) in the test ear.
Impedance 3 - 13
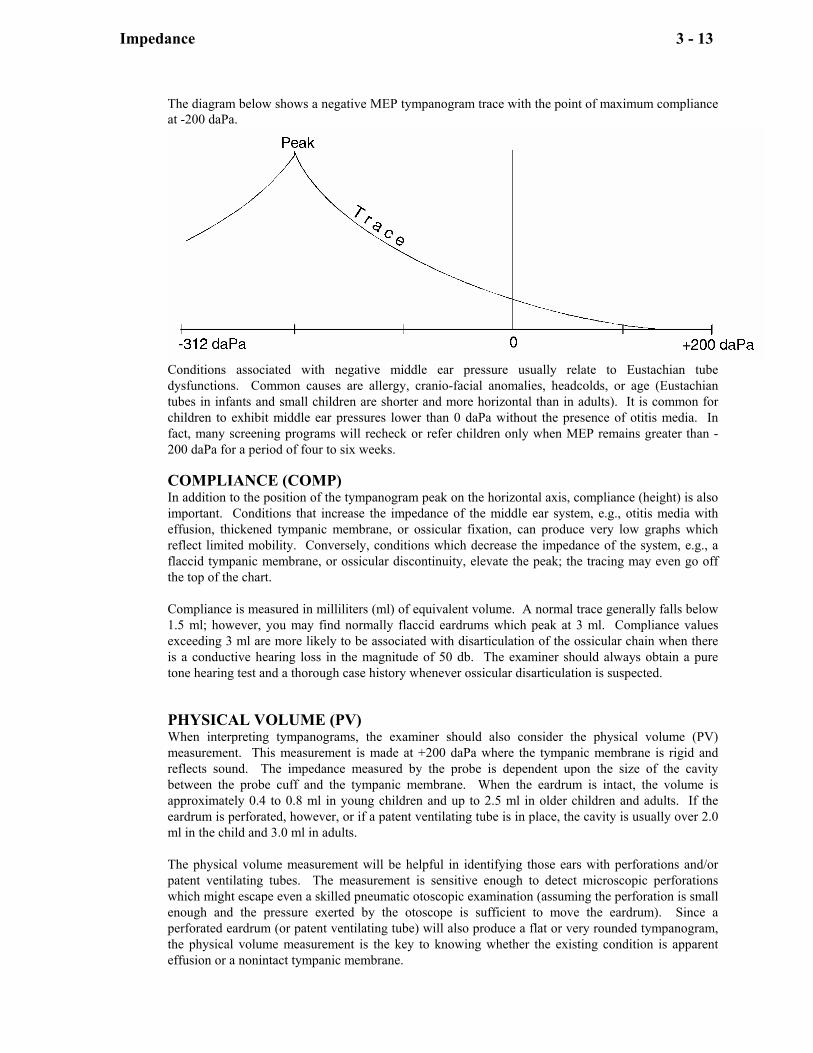
The diagram below shows a negative MEP tympanogram trace with the point of maximum compliance at -200 daPa.
Conditions associated with negative middle ear pressure usually relate to Eustachian tube dysfunctions. Common causes are allergy, cranio-facial anomalies, headcolds, or age (Eustachian tubes in infants and small children are shorter and more horizontal than in adults). It is common for children to exhibit middle ear pressures lower than 0 daPa without the presence of otitis media. In fact, many screening programs will recheck or refer children only when MEP remains greater than -200 daPa for a period of four to six weeks. COMPLIANCE (COMP) In addition to the position of the tympanogram peak on the horizontal axis, compliance (height) is also important. Conditions that increase the impedance of the middle ear system, e.g., otitis media with effusion, thickened tympanic membrane, or ossicular fixation, can produce very low graphs which reflect limited mobility. Conversely, conditions which decrease the impedance of the system, e.g., a flaccid tympanic membrane, or ossicular discontinuity, elevate the peak; the tracing may even go off the top of the chart. Compliance is measured in milliliters (ml) of equivalent volume. A normal trace generally falls below 1.5 ml; however, you may find normally flaccid eardrums which peak at 3 ml. Compliance values exceeding 3 ml are more likely to be associated with disarticulation of the ossicular chain when there is a conductive hearing loss in the magnitude of 50 db. The examiner should always obtain a pure tone hearing test and a thorough case history whenever ossicular disarticulation is suspected. PHYSICAL VOLUME (PV) When interpreting tympanograms, the examiner should also consider the physical volume (PV) measurement. This measurement is made at +200 daPa where the tympanic membrane is rigid and reflects sound. The impedance measured by the probe is dependent upon the size of the cavity between the probe cuff and the tympanic membrane. When the eardrum is intact, the volume is approximately 0.4 to 0.8 ml in young children and up to 2.5 ml in older children and adults. If the eardrum is perforated, however, or if a patent ventilating tube is in place, the cavity is usually over 2.0 ml in the child and 3.0 ml in adults. The physical volume measurement will be helpful in identifying those ears with perforations and/or patent ventilating tubes. The measurement is sensitive enough to detect microscopic perforations which might escape even a skilled pneumatic otoscopic examination (assuming the perforation is small enough and the pressure exerted by the otoscope is sufficient to move the eardrum). Since a perforated eardrum (or patent ventilating tube) will also produce a flat or very rounded tympanogram, the physical volume measurement is the key to knowing whether the existing condition is apparent effusion or a nonintact tympanic membrane.
Impedance 3 - 14
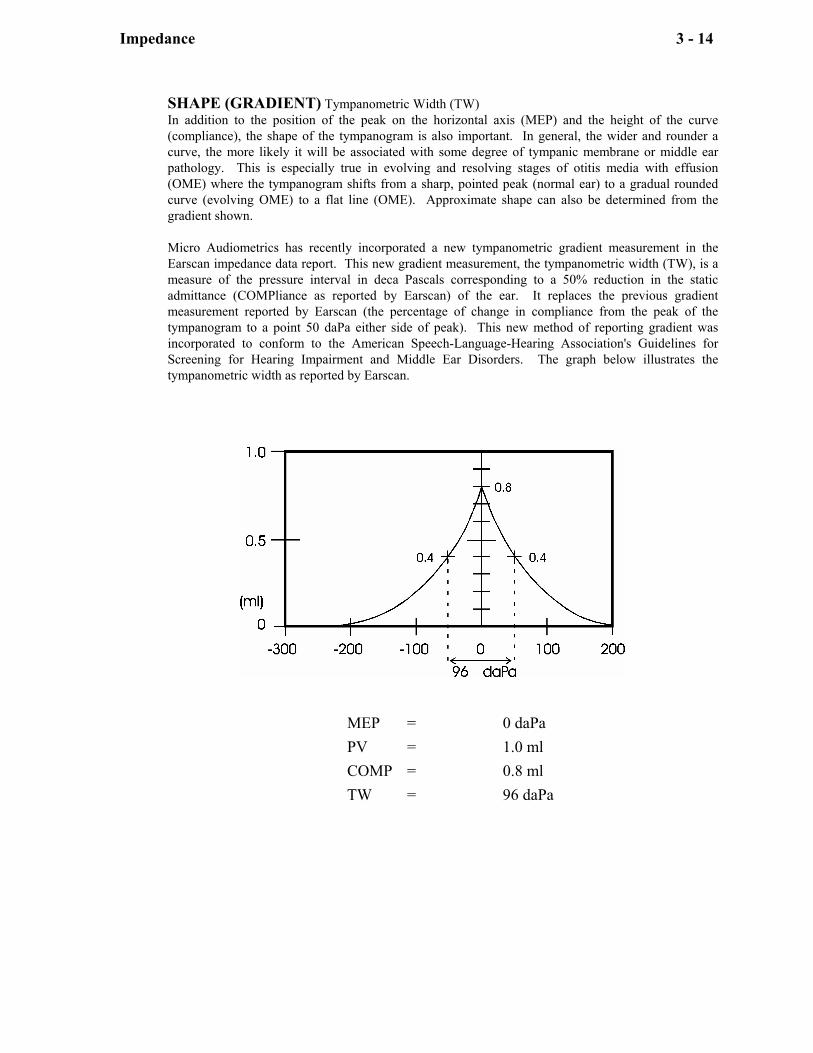
SHAPE (GRADIENT) Tympanometric Width (TW) In addition to the position of the peak on the horizontal axis (MEP) and the height of the curve (compliance), the shape of the tympanogram is also important. In general, the wider and rounder a curve, the more likely it will be associated with some degree of tympanic membrane or middle ear pathology. This is especially true in evolving and resolving stages of otitis media with effusion (OME) where the tympanogram shifts from a sharp, pointed peak (normal ear) to a gradual rounded curve (evolving OME) to a flat line (OME). Approximate shape can also be determined from the gradient shown. Micro Audiometrics has recently incorporated a new tympanometric gradient measurement in the Earscan impedance data report. This new gradient measurement, the tympanometric width (TW), is a measure of the pressure interval in deca Pascals corresponding to a 50% reduction in the static admittance (COMPliance as reported by Earscan) of the ear. It replaces the previous gradient measurement reported by Earscan (the percentage of change in compliance from the peak of the tympanogram to a point 50 daPa either side of peak). This new method of reporting gradient was incorporated to conform to the American Speech-Language-Hearing Association's Guidelines for Screening for Hearing Impairment and Middle Ear Disorders. The graph below illustrates the tympanometric width as reported by Earscan.
MEP = 0 daPa PV = 1.0 ml COMP = 0.8 ml TW = 96 daPa
Impedance 3 - 15
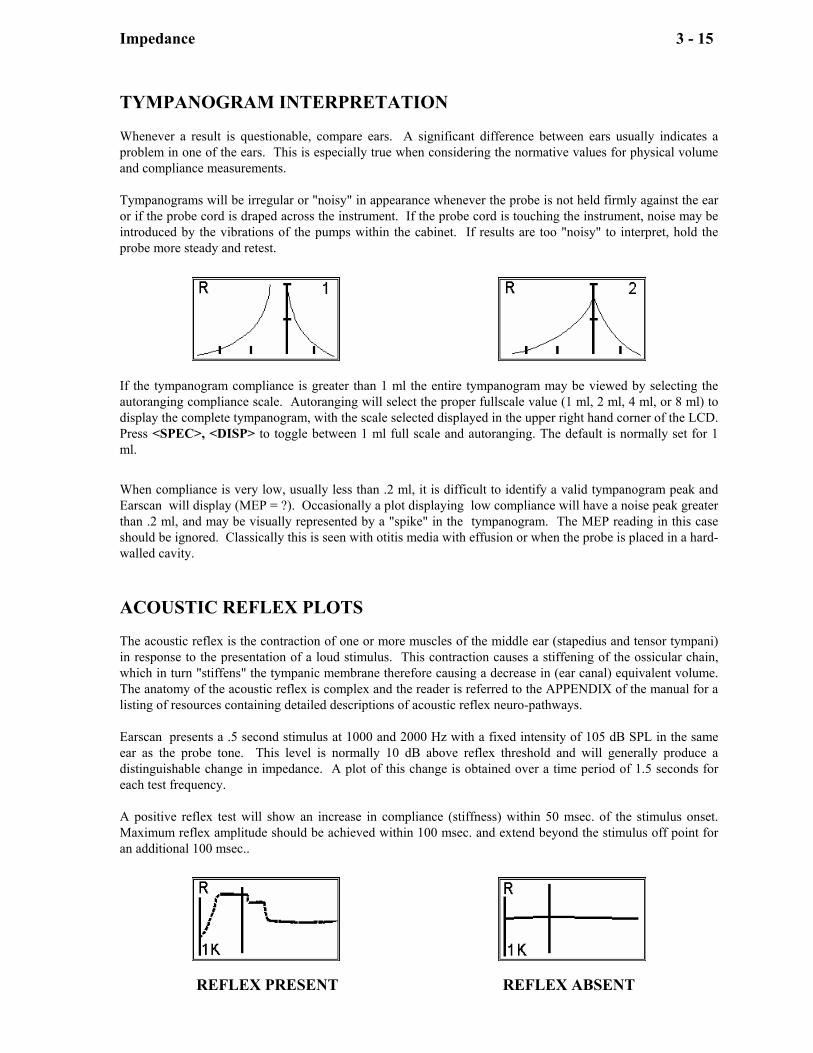
TYMPANOGRAM INTERPRETATION Whenever a result is questionable, compare ears. A significant difference between ears usually indicates a problem in one of the ears. This is especially true when considering the normative values for physical volume and compliance measurements. Tympanograms will be irregular or "noisy" in appearance whenever the probe is not held firmly against the ear or if the probe cord is draped across the instrument. If the probe cord is touching the instrument, noise may be introduced by the vibrations of the pumps within the cabinet. If results are too "noisy" to interpret, hold the probe more steady and retest.
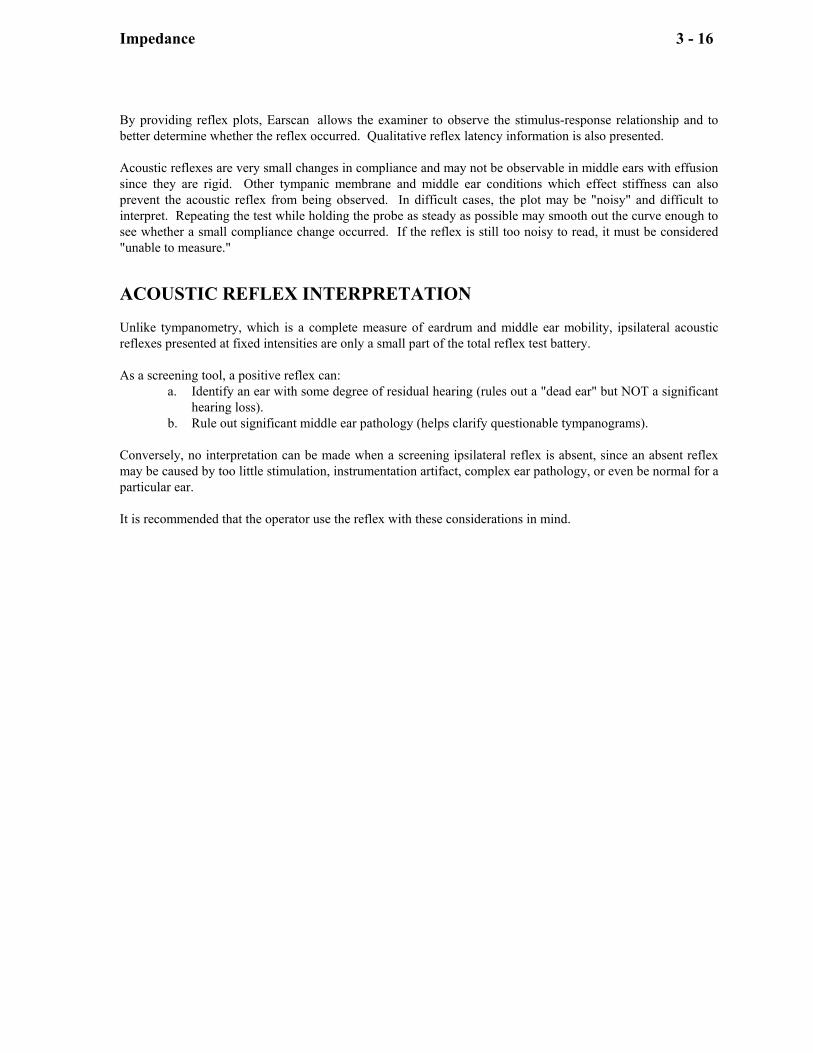
If the tympanogram compliance is greater than 1 ml the entire tympanogram may be viewed by selecting the autoranging compliance scale. Autoranging will select the proper fullscale value (1 ml, 2 ml, 4 ml, or 8 ml) to display the complete tympanogram, with the scale selected displayed in the upper right hand corner of the LCD. Press <SPEC>, <DISP> to toggle between 1 ml full scale and autoranging. The default is normally set for 1 ml. When compliance is very low, usually less than .2 ml, it is difficult to identify a valid tympanogram peak and Earscan will display (MEP = ?). Occasionally a plot displaying low compliance will have a noise peak greater than .2 ml, and may be visually represented by a "spike" in the tympanogram. The MEP reading in this case should be ignored. Classically this is seen with otitis media with effusion or when the probe is placed in a hard-walled cavity. ACOUSTIC REFLEX PLOTS The acoustic reflex is the contraction of one or more muscles of the middle ear (stapedius and tensor tympani) in response to the presentation of a loud stimulus. This contraction causes a stiffening of the ossicular chain, which in turn "stiffens" the tympanic membrane therefore causing a decrease in (ear canal) equivalent volume. The anatomy of the acoustic reflex is complex and the reader is referred to the APPENDIX of the manual for a listing of resources containing detailed descriptions of acoustic reflex neuro-pathways. Earscan presents a .5 second stimulus at 1000 and 2000 Hz with a fixed intensity of 105 dB SPL in the same ear as the probe tone. This level is normally 10 dB above reflex threshold and will generally produce a distinguishable change in impedance. A plot of this change is obtained over a time period of 1.5 seconds for each test frequency. A positive reflex test will show an increase in compliance (stiffness) within 50 msec. of the stimulus onset. Maximum reflex amplitude should be achieved within 100 msec. and extend beyond the stimulus off point for an additional 100 msec..
REFLEX PRESENT REFLEX ABSENT
Impedance 3 - 16
By providing reflex plots, Earscan allows the examiner to observe the stimulus-response relationship and to better determine whether the reflex occurred. Qualitative reflex latency information is also presented. Acoustic reflexes are very small changes in compliance and may not be observable in middle ears with effusion since they are rigid. Other tympanic membrane and middle ear conditions which effect stiffness can also prevent the acoustic reflex from being observed. In difficult cases, the plot may be "noisy" and difficult to interpret. Repeating the test while holding the probe as steady as possible may smooth out the curve enough to see whether a small compliance change occurred. If the reflex is still too noisy to read, it must be considered "unable to measure." ACOUSTIC REFLEX INTERPRETATION Unlike tympanometry, which is a complete measure of eardrum and middle ear mobility, ipsilateral acoustic reflexes presented at fixed intensities are only a small part of the total reflex test battery. As a screening tool, a positive reflex can:
a. Identify an ear with some degree of residual hearing (rules out a "dead ear" but NOT a significant hearing loss).
b. Rule out significant middle ear pathology (helps clarify questionable tympanograms). Conversely, no interpretation can be made when a screening ipsilateral reflex is absent, since an absent reflex may be caused by too little stimulation, instrumentation artifact, complex ear pathology, or even be normal for a particular ear. It is recommended that the operator use the reflex with these considerations in mind.
Impedance 3 - 17
CALIBRATION Earscan is a very stable instrument utilizing digital calibration techniques. There are no analog adjustments; all circuits are calibrated by numbers stored in memory to assure long term stability. Frequencies are quartz crystal controlled and never need adjustment. Air pressure is automatically zeroed upon power-up. Earscan reads the ambient air pressure and stores the reading in memory. If a large fluctuation in temperature should occur during the course of testing, turn the power off, pause for 3 sec., and turn on again. Moving an Earscan from a cold or hot car to room temperature can cause a bias in the air auto zero reading as it changes temperature. Air accuracy can also undergo minor drift with age and may be adjusted by an authorized service center. Sound pressure level of the 226 Hz and ipsilateral stimulus levels do require periodic calibration by an authorized service center due to transducer aging. However, minor changes in probe tone level need not affect the accuracy of the impedance measure if field calibration of the probe is performed. Impedance calibration should be performed daily after Earscan is turned on. This is advisable because pressure variations due to changes in elevation or atmospheric conditions change the density of the air and thus affect acoustic impedance measurements.
1. Turn Earscan on and note the display:
MAKE SELECTION
OUTPUT TO PRINTER
2. Place the probe into the 2.0 ml calibration cavity.
3. Press <CAL> and observe the message:
CALIBRATING
4. An impedance test will automatically be initiated after calibration to verify the accuracy.
5. Remove calibration cavity.
6. Press <DISP>.
7. Accurate calibration is achieved when physical volume (PV) equals 1.8 - 2.1 ml.
This test should be performed in the "normal" tymp speed mode, <SPEC>,<IMP>,<2>. If physical volume does not equal 1.8 - 2.1 ml, repeat test and hold the probe very still. Placing the probe on a piece of foam or a soft surface may be helpful, since ambient movement injects noise into acoustic impedance measurements. The values for middle ear pressure (MEP) and compliance (COMP) will usually display MEP = ? and COMP = 0.0. However, it is irrelevant if they do not, as only the (PV) value is important in this calibration.
Impedance 3 - 18
MAINTENANCE If Earscan will not start, or if the display indicates a blocked probe, check for cerumen or debris blocking the probe.
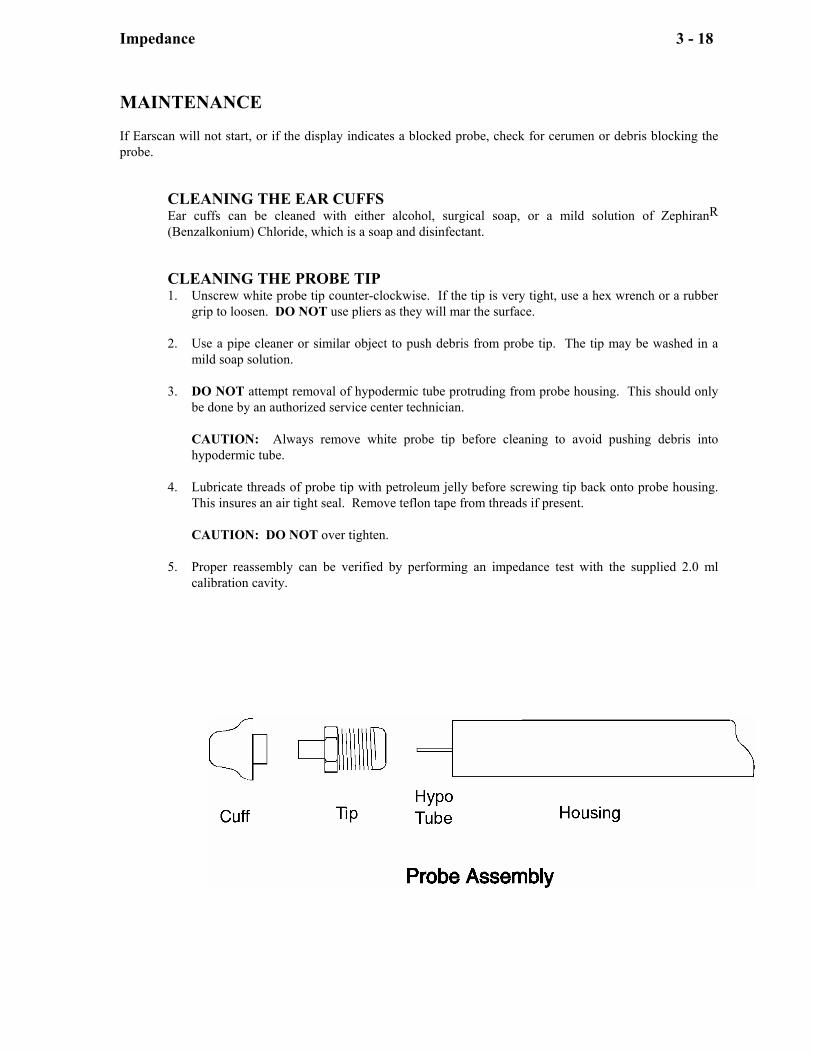
CLEANING THE EAR CUFFS Ear cuffs can be cleaned with either alcohol, surgical soap, or a mild solution of ZephiranR (Benzalkonium) Chloride, which is a soap and disinfectant. CLEANING THE PROBE TIP 1. Unscrew white probe tip counter-clockwise. If the tip is very tight, use a hex wrench or a rubber
grip to loosen. DO NOT use pliers as they will mar the surface. 2. Use a pipe cleaner or similar object to push debris from probe tip. The tip may be washed in a
mild soap solution. 3. DO NOT attempt removal of hypodermic tube protruding from probe housing. This should only
be done by an authorized service center technician. CAUTION: Always remove white probe tip before cleaning to avoid pushing debris into
hypodermic tube. 4. Lubricate threads of probe tip with petroleum jelly before screwing tip back onto probe housing.
This insures an air tight seal. Remove teflon tape from threads if present. CAUTION: DO NOT over tighten. 5. Proper reassembly can be verified by performing an impedance test with the supplied 2.0 ml
calibration cavity.
Audiometer 4 - 19
AUDIOMETER
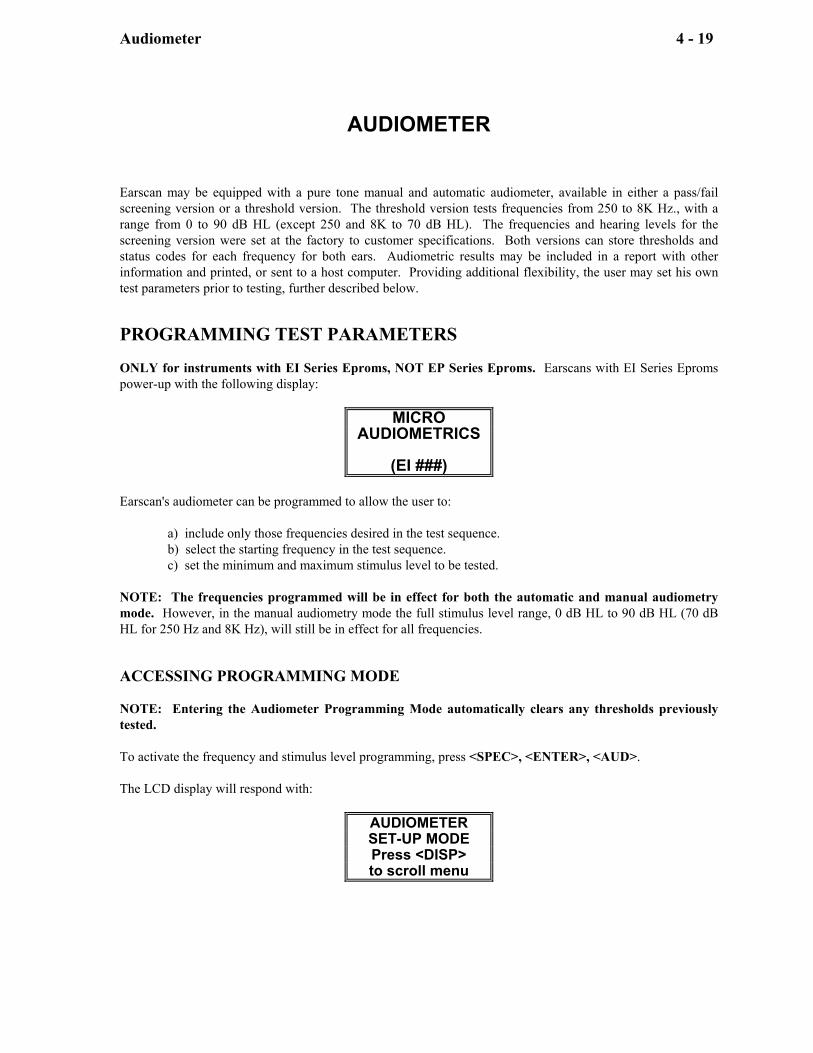
Earscan may be equipped with a pure tone manual and automatic audiometer, available in either a pass/fail screening version or a threshold version. The threshold version tests frequencies from 250 to 8K Hz., with a range from 0 to 90 dB HL (except 250 and 8K to 70 dB HL). The frequencies and hearing levels for the screening version were set at the factory to customer specifications. Both versions can store thresholds and status codes for each frequency for both ears. Audiometric results may be included in a report with other information and printed, or sent to a host computer. Providing additional flexibility, the user may set his own test parameters prior to testing, further described below. PROGRAMMING TEST PARAMETERS ONLY for instruments with EI Series Eproms, NOT EP Series Eproms. Earscans with EI Series Eproms power-up with the following display:
MICRO
AUDIOMETRICS
(EI ###)
Earscan's audiometer can be programmed to allow the user to: a) include only those frequencies desired in the test sequence. b) select the starting frequency in the test sequence. c) set the minimum and maximum stimulus level to be tested. NOTE: The frequencies programmed will be in effect for both the automatic and manual audiometry mode. However, in the manual audiometry mode the full stimulus level range, 0 dB HL to 90 dB HL (70 dB HL for 250 Hz and 8K Hz), will still be in effect for all frequencies. ACCESSING PROGRAMMING MODE NOTE: Entering the Audiometer Programming Mode automatically clears any thresholds previously tested. To activate the frequency and stimulus level programming, press <SPEC>, <ENTER>, <AUD>. The LCD display will respond with:
AUDIOMETER SET-UP MODE Press <DISP> to scroll menu
Audiometer 4 - 20
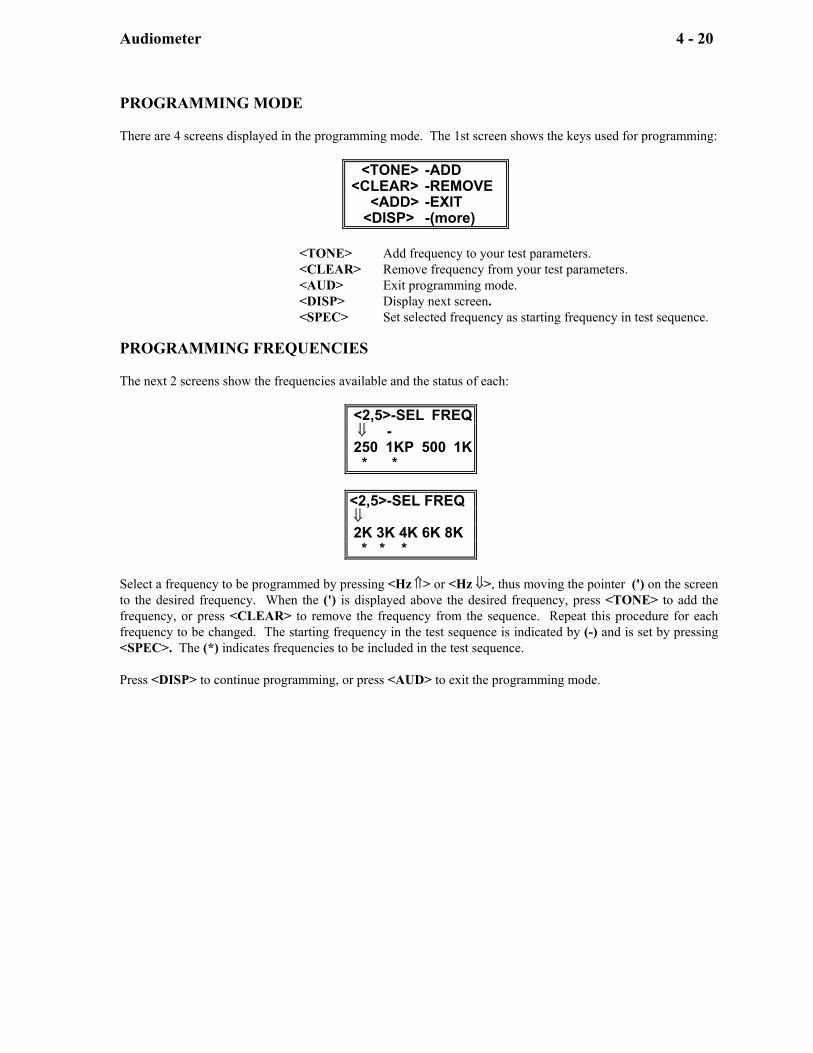
PROGRAMMING MODE There are 4 screens displayed in the programming mode. The 1st screen shows the keys used for programming:
<TONE> -ADD <CLEAR> -REMOVE <ADD> -EXIT
<DISP> -(more)
<TONE> Add frequency to your test parameters. <CLEAR> Remove frequency from your test parameters. <AUD> Exit programming mode. <DISP> Display next screen. <SPEC> Set selected frequency as starting frequency in test sequence.
PROGRAMMING FREQUENCIES The next 2 screens show the frequencies available and the status of each:
<2,5>-SEL FREQ ⇓ - 250 1KP 500 1K * * <2,5>-SEL FREQ ⇓ 2K 3K 4K 6K 8K * * *
Select a frequency to be programmed by pressing <Hz ⇑> or <Hz ⇓>, thus moving the pointer (') on the screen to the desired frequency. When the (') is displayed above the desired frequency, press <TONE> to add the frequency, or press <CLEAR> to remove the frequency from the sequence. Repeat this procedure for each frequency to be changed. The starting frequency in the test sequence is indicated by (-) and is set by pressing <SPEC>. The (*) indicates frequencies to be included in the test sequence. Press <DISP> to continue programming, or press <AUD> to exit the programming mode.
Audiometer 4 - 21
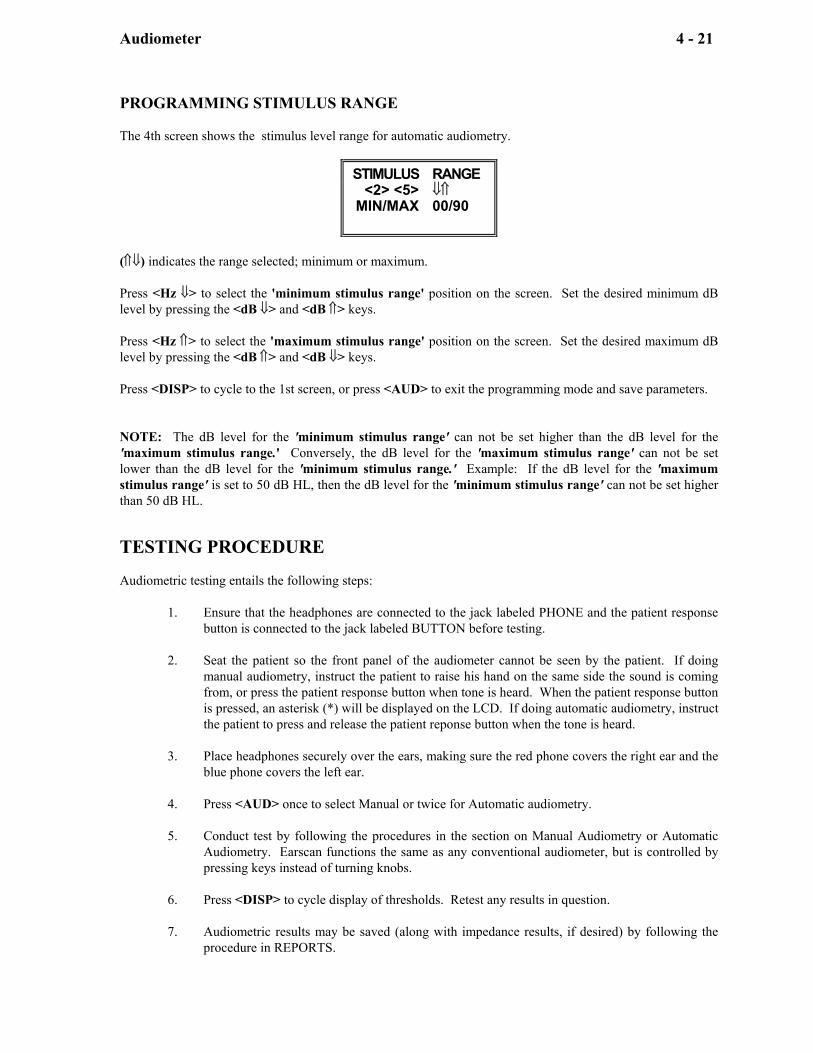
PROGRAMMING STIMULUS RANGE The 4th screen shows the stimulus level range for automatic audiometry.
STIMULUS RANGE <2> <5> ⇓⇑ MIN/MAX 00/90
(⇑⇓) indicates the range selected; minimum or maximum.
Press <Hz ⇓> to select the 'minimum stimulus range' position on the screen. Set the desired minimum dB level by pressing the <dB ⇓> and <dB ⇑> keys. Press <Hz ⇑> to select the 'maximum stimulus range' position on the screen. Set the desired maximum dB level by pressing the <dB ⇑> and <dB ⇓> keys. Press <DISP> to cycle to the 1st screen, or press <AUD> to exit the programming mode and save parameters. NOTE: The dB level for the 'minimum stimulus range' can not be set higher than the dB level for the 'maximum stimulus range.' Conversely, the dB level for the 'maximum stimulus range' can not be set lower than the dB level for the 'minimum stimulus range.' Example: If the dB level for the 'maximum stimulus range' is set to 50 dB HL, then the dB level for the 'minimum stimulus range' can not be set higher than 50 dB HL. TESTING PROCEDURE Audiometric testing entails the following steps: 1. Ensure that the headphones are connected to the jack labeled PHONE and the patient response
button is connected to the jack labeled BUTTON before testing. 2. Seat the patient so the front panel of the audiometer cannot be seen by the patient. If doing
manual audiometry, instruct the patient to raise his hand on the same side the sound is coming from, or press the patient response button when tone is heard. When the patient response button is pressed, an asterisk (*) will be displayed on the LCD. If doing automatic audiometry, instruct the patient to press and release the patient reponse button when the tone is heard.
3. Place headphones securely over the ears, making sure the red phone covers the right ear and the
blue phone covers the left ear. 4. Press <AUD> once to select Manual or twice for Automatic audiometry. 5. Conduct test by following the procedures in the section on Manual Audiometry or Automatic
Audiometry. Earscan functions the same as any conventional audiometer, but is controlled by pressing keys instead of turning knobs.
6. Press <DISP> to cycle display of thresholds. Retest any results in question. 7. Audiometric results may be saved (along with impedance results, if desired) by following the
procedure in REPORTS.
Audiometer 4 - 22
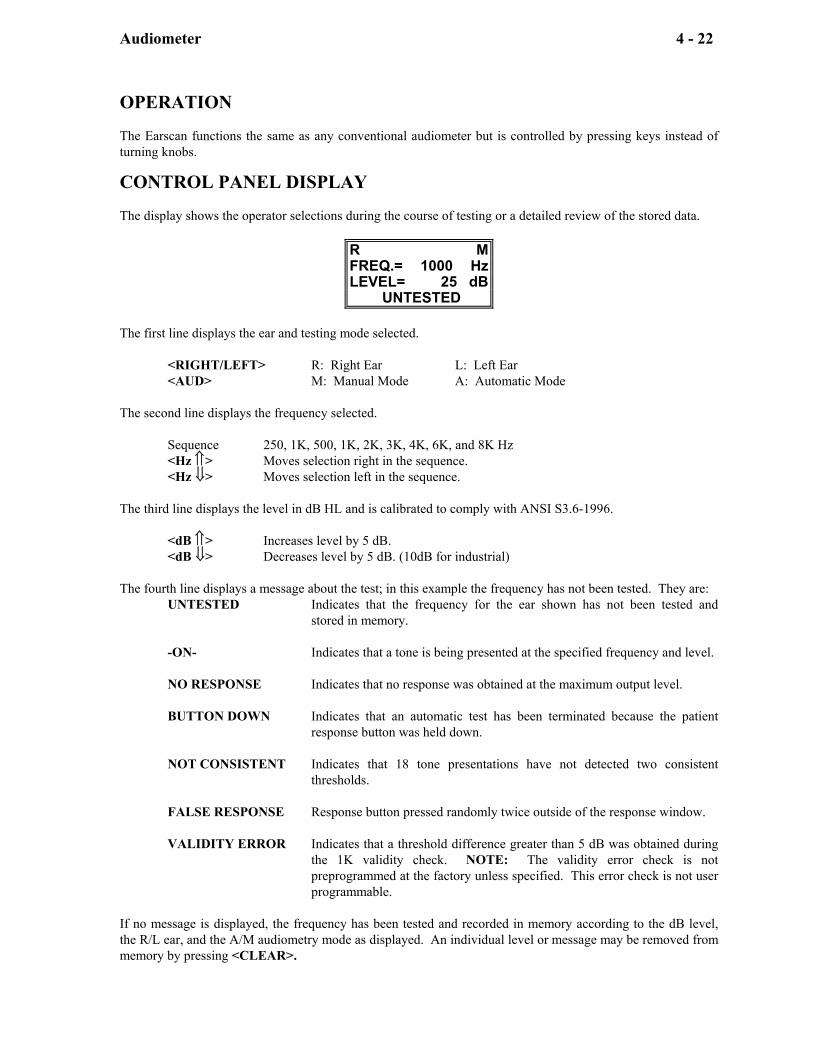
OPERATION The Earscan functions the same as any conventional audiometer but is controlled by pressing keys instead of turning knobs. CONTROL PANEL DISPLAY The display shows the operator selections during the course of testing or a detailed review of the stored data.
R M FREQ.= 1000 Hz LEVEL= 25 dB UNTESTED
The first line displays the ear and testing mode selected. <RIGHT/LEFT> R: Right Ear L: Left Ear <AUD> M: Manual Mode A: Automatic Mode
The second line displays the frequency selected. Sequence 250, 1K, 500, 1K, 2K, 3K, 4K, 6K, and 8K Hz <Hz ⇑> Moves selection right in the sequence. <Hz ⇓> Moves selection left in the sequence.
The third line displays the level in dB HL and is calibrated to comply with ANSI S3.6-1996. <dB ⇑> Increases level by 5 dB. <dB ⇓> Decreases level by 5 dB. (10dB for industrial)
The fourth line displays a message about the test; in this example the frequency has not been tested. They are:
UNTESTED Indicates that the frequency for the ear shown has not been tested and stored in memory.
-ON- Indicates that a tone is being presented at the specified frequency and level. NO RESPONSE Indicates that no response was obtained at the maximum output level. BUTTON DOWN Indicates that an automatic test has been terminated because the patient
response button was held down. NOT CONSISTENT Indicates that 18 tone presentations have not detected two consistent
thresholds. FALSE RESPONSE Response button pressed randomly twice outside of the response window. VALIDITY ERROR Indicates that a threshold difference greater than 5 dB was obtained during
the 1K validity check. NOTE: The validity error check is not preprogrammed at the factory unless specified. This error check is not user programmable.
If no message is displayed, the frequency has been tested and recorded in memory according to the dB level, the R/L ear, and the A/M audiometry mode as displayed. An individual level or message may be removed from memory by pressing <CLEAR>.
Audiometer 4 - 23
MODE SELECT The <AUD> key selects both manual and automatic audiometry. Pressing the <AUD> key will activate the manual audiometer except when Earscan is busy testing, printing, or waiting for a number entry. Once in the manual mode the operator may begin automatic testing by again pressing <AUD> if the instrument is equipped with this option. The program can be stopped by again pressing <AUD> which changes the mode back to manual. During an automatic test, if the program is aborted by an error condition, <CLEAR> must be pressed to return to the manual mode. Data stored during testing will not be lost by switching back and forth between modes. MANUAL AUDIOMETRY While in this mode the audiometer is under the operator's control. Earscan manual audiometer is activated by pressing <AUD>, and then manipulating the <HZ ⇑>, <Hz ⇓>, <dB ⇑>, <dB ⇓>, <RIGHT/LEFT>, <TONE>, <DISP>, and <CLEAR> keys. The controls are:
FREQUENCY SELECT The <Hz ⇑> <Hz ⇓> keys are used to select successively higher or lower frequencies from the sequence: 250, 1K, 500, 1K, 2K, 3K, 4K, 6K, and 8K Hz Note: The sequence ....1K, 500, 1K... is part of the automatic audiometry validity check and therefore appears in the manual mode as well. LEVEL SELECT The <dB ⇑> <dB ⇓> keys are used to increase and decrease level by +5 and -5 dB (-10dB for industrial). Increment levels beyond the maximum level will display NO RESPONSE (NR). EAR SELECT Pressing <RIGHT/LEFT> toggles the ear selection between Right and Left. TONE ON & SAVE The <TONE> key presents the stimulus as a 3-pulsed-tone when it is pressed or as a continuous tone for the duration it is pressed, depending upon the stimulus option chosen. It also stores the level in memory as a threshold and erases previous levels at that frequency. THRESHOLDS To establish a threshold for later printing or review, test the frequency, establish threshold, present the tone at the threshold, and move to a new frequency. Each time Earscan moves to a new frequency, it "remembers" the last decibel level of the "old" frequency. To record a "no response" condition (NR), increment the level until the display message reads NO RESPONSE, then press <ENTER>.
Audiometer 4 - 24
AUTOMATIC AUDIOMETRY In this mode the audiometer is controlled by the computer. Changes in level are made based upon the patient's response and a threshold is determined for each frequency for both ears.
START TESTING Press <AUD> if not already in the manual mode and press <AUD> again to start automatic testing. TEST PROTOCOL for AUTOMATIC AUDIOMETRY (THRESHOLD VERSION)
1. The automatic test starts at a stimulus level of 25dB at the start frequency pre-programmed at the factory, or at the start frequency selected in the programming mode.
2. The stimulus increment and decrement size is initially set to +20 dB and -10 dB, respectively, for the start of each frequency. The increment size remains at +20 dB until a positive response is detected from the Patient Response Button. After a positive response, the increment size is set to +5 dB, and remains set at this level until the threshold is established for this frequency, or until the test is aborted.
3. After each stimulus presentation, Earscan will either decrease the level by 10 dB if a positive response is detected, or increase the level by 5 dB if a negative response is detected (20 dB if no previous response has been detected for a given frequency).
4. Two ascending thresholds are required at a given level for Earscan to record that level as a threshold. An ascending threshold occurs when a positive response to a stimulus presentation immediately follows a 'negative response' to the previous stimulus presentation.
5. If the stimulus is presented at 90 dB HL and there is no response, Earscan will display the message NO RESPONSE and again present the stimulus. If no response is still detected, Earscan will record the threshold as NO RESPONSE, NR, and continue testing with the next frequency in the test sequence.
6. The next frequency in the test sequence will start at a level 5 dB greater than the threshold for the preceding frequency. However, there is a minimum and maximum starting level of 20 dB HL and 60 dB HL, respectively. Ex: if a threshold has been established at 60 dB HL or greater, then Earscan will start the next frequency at a level of 60 dB HL. If the threshold for the previous frequency is less than 20 dB HL, Earscan will start the next frequency at 20 dB HL.
7. After the last frequency in the test sequence has been tested for the selected ear, Earscan will review each frequency in the test sequence, starting with the first frequency in the test sequence; 250, 1K, 500, 1K, 2K, 3K, 4K, 6K, 8K, and test any frequencies for that ear that have not been tested.
8. After all of the frequencies have been tested for one ear, Earscan will check the other ear to see if all of the frequencies have been tested. If both ears have not been tested, Earscan will select the other ear, start testing at the frequency and level as indicated in step (1) above, and continue testing in the manner as described. If both ears have been tested, Earscan will emit an audible 'End of Test' signal, and display:
TEST
COMPLETE
(Select Mode)
9. The results can be displayed from the Display Mode by pressing <DISP>, or from the Manual Audiometry Mode by pressing <DISP>.
Audiometer 4 - 25
TEST PROTOCOL for AUTOMATIC AUDIOMETRY (PASS/FAIL SCREENING VERSION) 1. The automatic screening test starts testing at the minimum stimulus level and 'start' frequency
pre-programmed at the factory, or re-programmed by the user. 2. The stimulus level is incremented in 5 dB steps until a positive response is detected, or until
the maximum level is presented. a. If a positive response is detected, the stimulus level at that presentation is recorded
(corresponding to a PASS condition), and the next frequency in the sequence is tested.
b. If the maximum stimulus level is presented and no response is detected, the stimulus is again presented with a NO RESPONSE message displayed.
c. If there is a positive response this time, the stimulus level is recorded, and the next frequency in the sequence is tested.
d. If there is still no response, the stimulus level is recorded as NR (corresponding to a FAIL condition), and the next frequency in the sequence is tested.
3. The test proceeds in this manner for each frequency in the test sequence until the last frequency is tested for the selected ear. Earscan will then review each frequency, starting with the first, and test any frequencies that have not been tested.
4. After completing the first ear, Earscan will test the other in the same manner as described above.
5. Upon completion of both ears, Earscan will emit an audible 'end of test signal' and display:
TEST COMPLETE
(Select Mode)
6. The results can be reviewed from the Display Mode by pressing <DISP>, or from the Manual
Audiometry Mode by pressing <MAN>. PAUSE Press <AUD> once to stop the automatic test. You may display audiometric results, test in the manual mode, or restart the automatic sequence as desired. ABORT The automatic sequence is aborted when the patient response button is held down continuously, two false responses have been detected, or when 18 tone presentations have not resulted in a threshold. The test will stop, an audible signal will emit, and the LCD will display the error conditions as BUTTON DOWN, FALSE RESPONSE, or NOT CONSISTENT, respectively. RESTART Once the automatic sequence has been aborted the operator should re-instruct the patient and press <CLEAR> to return the audiometer to the manual mode. You may review the current test status by pressing the <DISP> key or manipulating the <Hz> and <RIGHT/LEFT> keys to cycle through each frequency. Restart the automatic test by pressing <AUD> and the sequence will start at the ear, frequency, and level indicated on the display, skipping any frequencies already tested.
Audiometer 4 - 26
RETEST Locate the desired frequency and ear by using the appropriate keys and press the <CLEAR> key. This removes the entry from memory and may be repeated for as many questionable thresholds as desired. All cleared values will be retested when the automatic test is started by pressing <AUD> or may be retested manually by the operator.
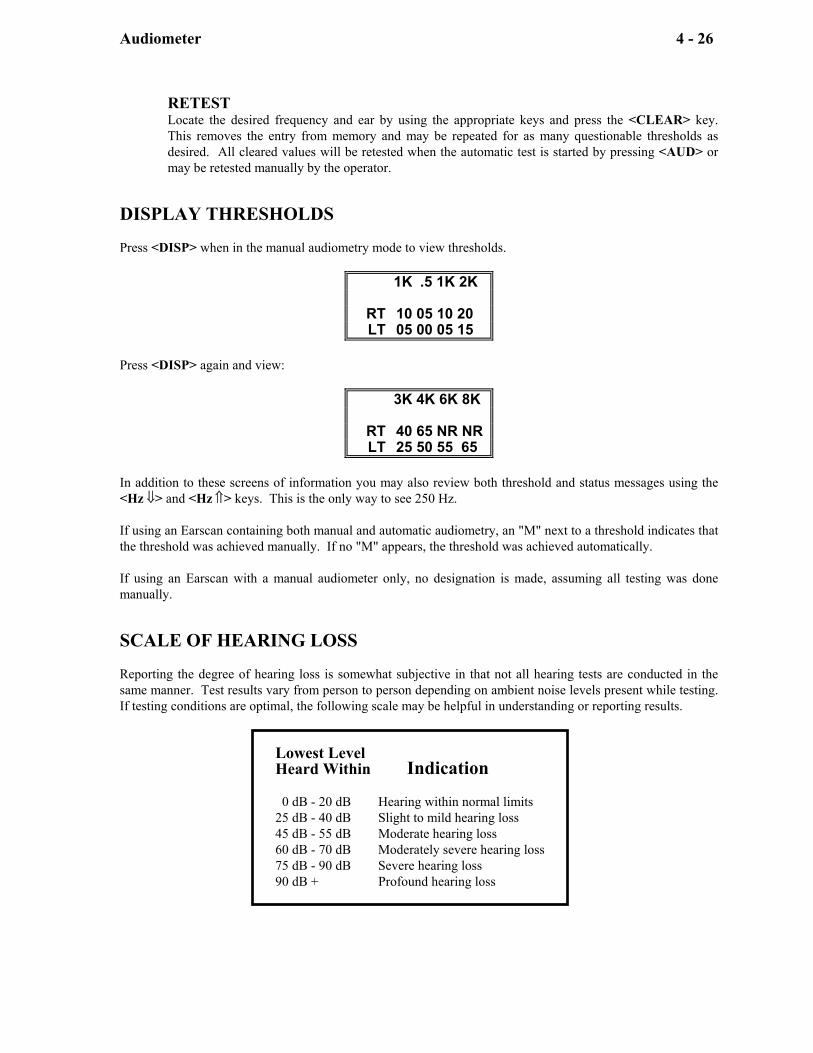
DISPLAY THRESHOLDS Press <DISP> when in the manual audiometry mode to view thresholds.
1K .5 1K 2K RT 10 05 10 20 LT 05 00 05 15
Press <DISP> again and view:
3K 4K 6K 8K RT 40 65 NR NR LT 25 50 55 65
In addition to these screens of information you may also review both threshold and status messages using the <Hz ⇓> and <Hz ⇑> keys. This is the only way to see 250 Hz. If using an Earscan containing both manual and automatic audiometry, an "M" next to a threshold indicates that the threshold was achieved manually. If no "M" appears, the threshold was achieved automatically. If using an Earscan with a manual audiometer only, no designation is made, assuming all testing was done manually. SCALE OF HEARING LOSS Reporting the degree of hearing loss is somewhat subjective in that not all hearing tests are conducted in the same manner. Test results vary from person to person depending on ambient noise levels present while testing. If testing conditions are optimal, the following scale may be helpful in understanding or reporting results.
Lowest Level Heard Within Indication 0 dB - 20 dB Hearing within normal limits 25 dB - 40 dB Slight to mild hearing loss 45 dB - 55 dB Moderate hearing loss 60 dB - 70 dB Moderately severe hearing loss 75 dB - 90 dB Severe hearing loss 90 dB + Profound hearing loss
Reports 5 - 27
REPORTS
Earscan is particularly well suited for record keeping and report generation. All tests for an individual may be stored in memory at one time for immediate display and review. When a permanent report is required the operator has several options from which to choose. He may hand-record test results on a "Hearing Test Results" pad, or allow Earscan to output a report to a printer. This hard copy report may contain graphic and numerical information or just numerical, depending upon your needs. Earscan can also send data to a computer, providing detailed analysis and record comparisons. TYPES OF REPORTS Earscan outputs information in different ways.
IMMEDIATE Displays information on the graphics screen. May be hand-recorded on a "Hearing Test Results" pad.
HARD COPY Outputs test data to a printer. COMPUTER Sends information directly to a computer.
DATA DESCRIPTION There are ten data arrays in memory that are used for storing data: four for test results; three for user-entered numbers, and three permanently loaded with instrument related information.
TEST RESULTS Right Ear Impedance Left Ear Impedance Right Ear Audiogram Left Ear Audiogram
USER ENTERED NUMBERS
Current Date Patient ID Number Operator ID Number
PERMANENT DATA
Instrument Serial Number Instrument Calibration Date Printout Heading
Reports 5 - 28
LOADING INFORMATION Information is loaded into Earscan in three different ways. The actual tests are loaded during testing and remain there until another test is run, or a clear command, <SPEC>,<CLEAR>, is performed, or the power is interrupted. User-entered data is entered through the keypad and only a patient ID number must be re-entered after the clear command if one is desired. DATE and OPERATOR ID remain in memory until power is turned off or specifically cleared. Permanent data is entered at the factory and remains there until instrument calibration.
EAR TESTING If you choose to produce reports, conduct testing according to the instructions found in this manual. Test both ears using the <RIGHT/LEFT> key for both impedance and audiometry, if desired. To review results, select the test mode, then press <IMP> or <AUD>, then <DISP> and switch between ears by pressing <RIGHT/LEFT>. Retest any questionable results. USER-ENTERED NUMBERS DATE, ID, and OPERATOR ID numbers are entered using the keys with legends appearing in the lower right hand corner: <0> through <9>, <->, and <ENTER>. These numbers may be entered before you generate a report (press <GRAPH> or <DATA>), or may be left "blank" for reserving an "underlined space" on the report. To ENTER a number press:
<DATE> for date. <ID> for patient or record identification number. <SPEC>, <ID> for operator identification number.
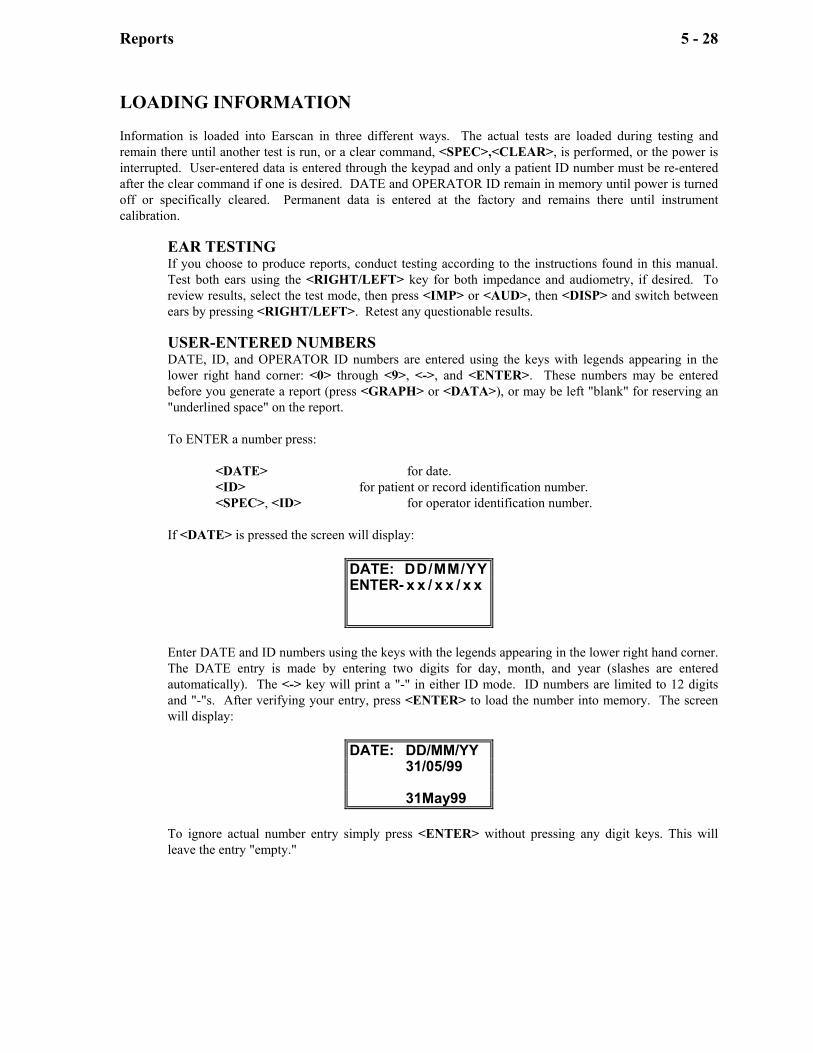
If <DATE> is pressed the screen will display:
DATE: DD/MM/YY ENTER- x x / x x / x x
Enter DATE and ID numbers using the keys with the legends appearing in the lower right hand corner. The DATE entry is made by entering two digits for day, month, and year (slashes are entered automatically). The <-> key will print a "-" in either ID mode. ID numbers are limited to 12 digits and "-"s. After verifying your entry, press <ENTER> to load the number into memory. The screen will display:
DATE: DD/MM/YY 31/05/99 31May99
To ignore actual number entry simply press <ENTER> without pressing any digit keys. This will leave the entry "empty."
Reports 5 - 29
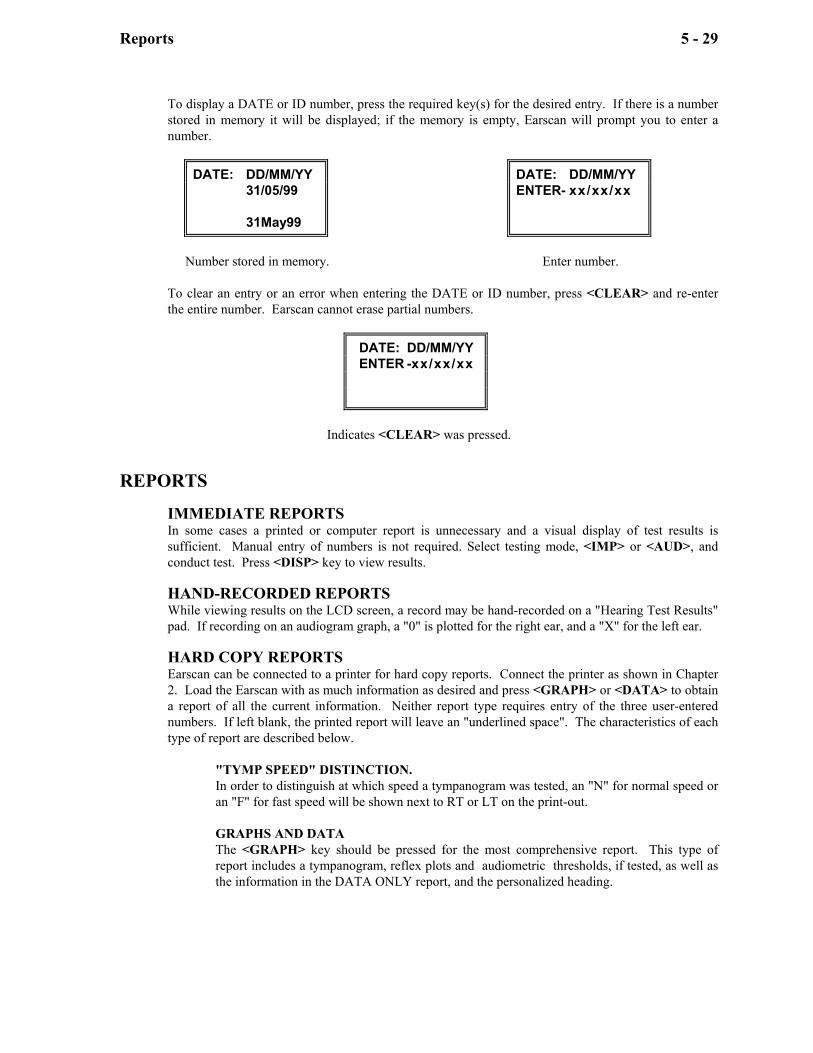
To display a DATE or ID number, press the required key(s) for the desired entry. If there is a number stored in memory it will be displayed; if the memory is empty, Earscan will prompt you to enter a number.
DATE: DD/MM/YY 31/05/99 31May99
Number stored in memory.
DATE: DD/MM/YY ENTER- xx/xx/xx
Enter number.
To clear an entry or an error when entering the DATE or ID number, press <CLEAR> and re-enter the entire number. Earscan cannot erase partial numbers.
DATE: DD/MM/YY ENTER -xx/xx/xx
Indicates <CLEAR> was pressed.
REPORTS
IMMEDIATE REPORTS In some cases a printed or computer report is unnecessary and a visual display of test results is sufficient. Manual entry of numbers is not required. Select testing mode, <IMP> or <AUD>, and conduct test. Press <DISP> key to view results. HAND-RECORDED REPORTS While viewing results on the LCD screen, a record may be hand-recorded on a "Hearing Test Results" pad. If recording on an audiogram graph, a "0" is plotted for the right ear, and a "X" for the left ear. HARD COPY REPORTS Earscan can be connected to a printer for hard copy reports. Connect the printer as shown in Chapter 2. Load the Earscan with as much information as desired and press <GRAPH> or <DATA> to obtain a report of all the current information. Neither report type requires entry of the three user-entered numbers. If left blank, the printed report will leave an "underlined space". The characteristics of each type of report are described below.
"TYMP SPEED" DISTINCTION. In order to distinguish at which speed a tympanogram was tested, an "N" for normal speed or an "F" for fast speed will be shown next to RT or LT on the print-out. GRAPHS AND DATA The <GRAPH> key should be pressed for the most comprehensive report. This type of report includes a tympanogram, reflex plots and audiometric thresholds, if tested, as well as the information in the DATA ONLY report, and the personalized heading.
Reports 5 - 30
DATA ONLY If <DATA> is pressed, the heading, signature line, and remarks are omitted and only numerical information is printed. This reduces printing time for reports that do not require the detail found in the report containing graphs.
Earscan prints tests only if completed, except for the audiogram. If any frequency is tested then the full audiogram is printed with a blank space printed for those frequencies not tested. When reflexes are not measured, Earscan will not print the grid; the same is true for tympanometry.
GROUP REPORTS This report is a combination of the <GRAPH> and <DATA> reports. Clear all data with <SPEC>, <CLEAR> and enter DATE and OPERATOR ID. Press <GRAPH> and print a "report" without obtaining test data. This prints out a group report heading containing your personalized heading, operator number, serial number and calibration date. Now test each individual, entering ID numbers, and press <DATA>. Press <SPEC>, <CLEAR> between each person tested. Each entry into this type of report contains numerical results without unnecessary headings for each individual.
OUTPUT TO COMPUTER Earscan reports can be downloaded to a computer with Micro Audiometrics' software. Connect the computer to Earscan's serial output connector on the rear of the unit. Designate "Output To Computer" by following the directions on page 7, GETTING READY TO TEST. Press <DATA>.
CLEARING TEST DATA BETWEEN PEOPLE After testing is complete and the information has been printed or sent to a host computer, press <SPEC> and then <CLEAR>. This 2-key sequence erases all test data and patient ID number. (The LCD display reflects this by displaying "NEW TEST" for a few seconds). This command does not erase the Operator ID number or the DATE or any of the permanent data. After clearing, Earscan is ready to test a new person. It is not necessary to re-enter DATE or Operator ID before printing each new test. It is not necessary to clear between each person tested although it does guarantee that no data from the previous person will appear in the new report. Retesting will overwrite any old information.
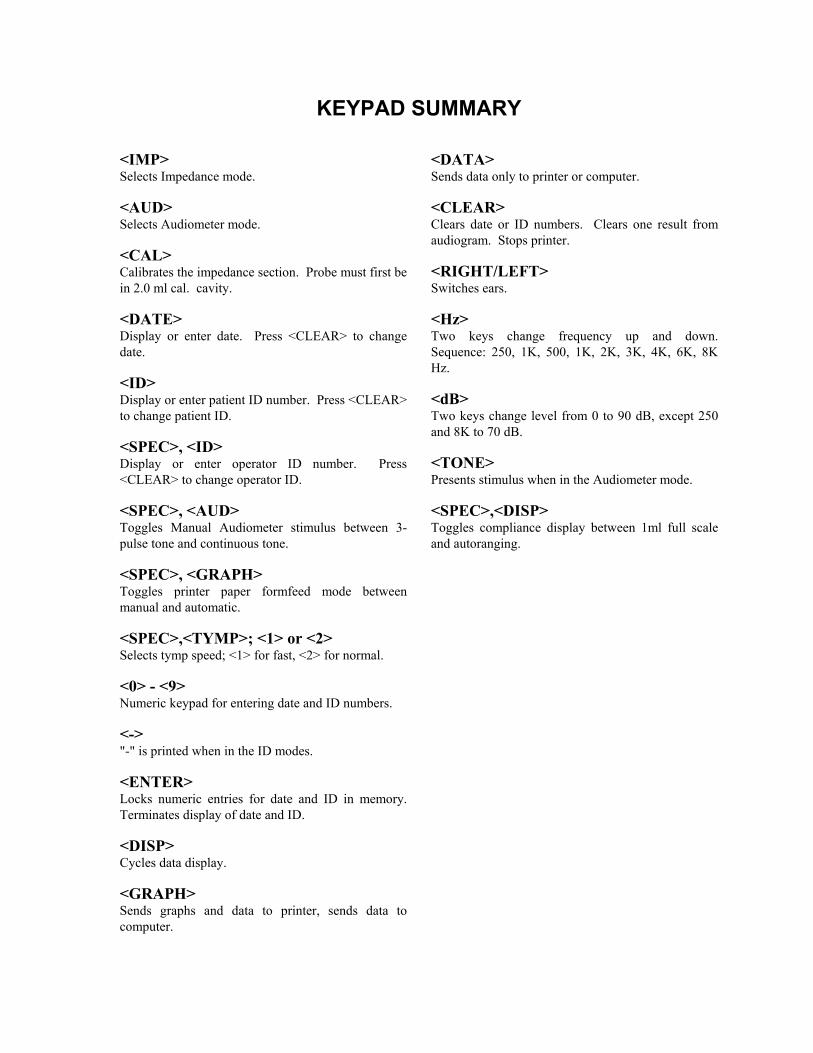
KEYPAD SUMMARY <IMP> Selects Impedance mode. <AUD> Selects Audiometer mode. <CAL> Calibrates the impedance section. Probe must first be in 2.0 ml cal. cavity. <DATE> Display or enter date. Press <CLEAR> to change date. <ID> Display or enter patient ID number. Press <CLEAR> to change patient ID. <SPEC>, <ID> Display or enter operator ID number. Press <CLEAR> to change operator ID. <SPEC>, <AUD> Toggles Manual Audiometer stimulus between 3-pulse tone and continuous tone. <SPEC>, <GRAPH> Toggles printer paper formfeed mode between manual and automatic. <SPEC>,<TYMP>; <1> or <2> Selects tymp speed; <1> for fast, <2> for normal. <0> - <9> Numeric keypad for entering date and ID numbers. <-> "-" is printed when in the ID modes. <ENTER> Locks numeric entries for date and ID in memory. Terminates display of date and ID. <DISP> Cycles data display. <GRAPH> Sends graphs and data to printer, sends data to computer.
<DATA> Sends data only to printer or computer. <CLEAR> Clears date or ID numbers. Clears one result from audiogram. Stops printer. <RIGHT/LEFT> Switches ears. <Hz> Two keys change frequency up and down. Sequence: 250, 1K, 500, 1K, 2K, 3K, 4K, 6K, 8K Hz. <dB> Two keys change level from 0 to 90 dB, except 250 and 8K to 70 dB. <TONE> Presents stimulus when in the Audiometer mode. <SPEC>,<DISP> Toggles compliance display between 1ml full scale and autoranging.
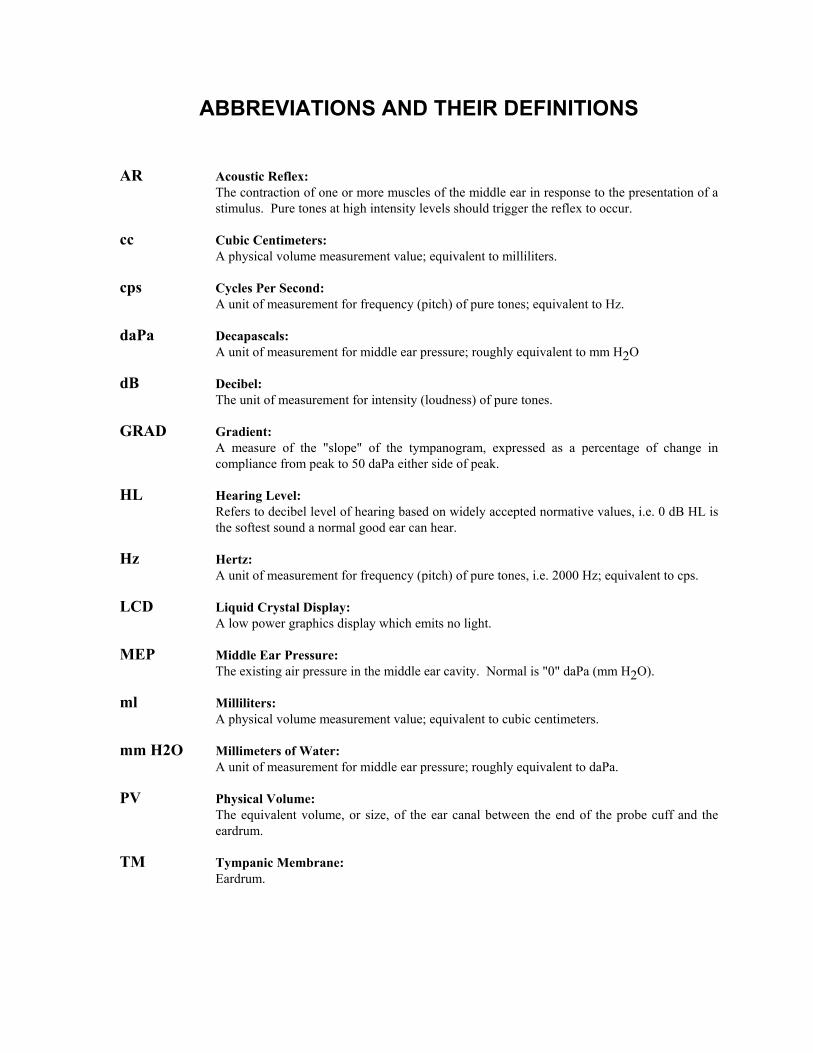
ABBREVIATIONS AND THEIR DEFINITIONS AR Acoustic Reflex:
The contraction of one or more muscles of the middle ear in response to the presentation of a stimulus. Pure tones at high intensity levels should trigger the reflex to occur.
cc Cubic Centimeters:
A physical volume measurement value; equivalent to milliliters. cps Cycles Per Second:
A unit of measurement for frequency (pitch) of pure tones; equivalent to Hz. daPa Decapascals:
A unit of measurement for middle ear pressure; roughly equivalent to mm H2O dB Decibel:
The unit of measurement for intensity (loudness) of pure tones. GRAD Gradient:
A measure of the "slope" of the tympanogram, expressed as a percentage of change in compliance from peak to 50 daPa either side of peak.
HL Hearing Level:
Refers to decibel level of hearing based on widely accepted normative values, i.e. 0 dB HL is the softest sound a normal good ear can hear.
Hz Hertz:
A unit of measurement for frequency (pitch) of pure tones, i.e. 2000 Hz; equivalent to cps. LCD Liquid Crystal Display:
A low power graphics display which emits no light. MEP Middle Ear Pressure:
The existing air pressure in the middle ear cavity. Normal is "0" daPa (mm H2O). ml Milliliters:
A physical volume measurement value; equivalent to cubic centimeters. mm H2O Millimeters of Water:
A unit of measurement for middle ear pressure; roughly equivalent to daPa. PV Physical Volume:
The equivalent volume, or size, of the ear canal between the end of the probe cuff and the eardrum.
TM Tympanic Membrane:
Eardrum.
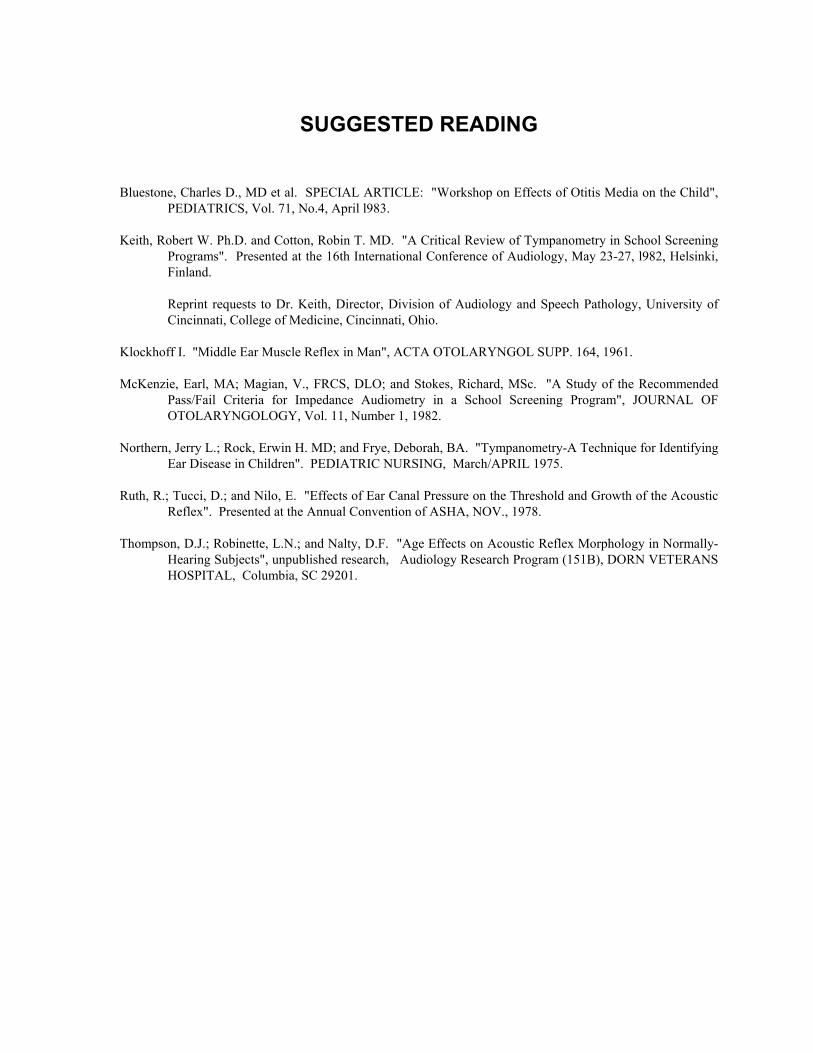
SUGGESTED READING
Bluestone, Charles D., MD et al. SPECIAL ARTICLE: "Workshop on Effects of Otitis Media on the Child",
PEDIATRICS, Vol. 71, No.4, April l983. Keith, Robert W. Ph.D. and Cotton, Robin T. MD. "A Critical Review of Tympanometry in School Screening
Programs". Presented at the 16th International Conference of Audiology, May 23-27, l982, Helsinki, Finland.
Reprint requests to Dr. Keith, Director, Division of Audiology and Speech Pathology, University of Cincinnati, College of Medicine, Cincinnati, Ohio.
Klockhoff I. "Middle Ear Muscle Reflex in Man", ACTA OTOLARYNGOL SUPP. 164, 1961. McKenzie, Earl, MA; Magian, V., FRCS, DLO; and Stokes, Richard, MSc. "A Study of the Recommended
Pass/Fail Criteria for Impedance Audiometry in a School Screening Program", JOURNAL OF OTOLARYNGOLOGY, Vol. 11, Number 1, 1982.
Northern, Jerry L.; Rock, Erwin H. MD; and Frye, Deborah, BA. "Tympanometry-A Technique for Identifying
Ear Disease in Children". PEDIATRIC NURSING, March/APRIL 1975. Ruth, R.; Tucci, D.; and Nilo, E. "Effects of Ear Canal Pressure on the Threshold and Growth of the Acoustic
Reflex". Presented at the Annual Convention of ASHA, NOV., 1978. Thompson, D.J.; Robinette, L.N.; and Nalty, D.F. "Age Effects on Acoustic Reflex Morphology in Normally-
Hearing Subjects", unpublished research, Audiology Research Program (151B), DORN VETERANS HOSPITAL, Columbia, SC 29201.