Earnings Report for the 2nd Quarter ended June 30, 2020
32
Renesas Electronics’ Consolidated Financial Results for the Second Quarter Ended June 30, 2020 Media Contacts Investor Contacts Kyoko Okamoto Shigeo Muto Renesas Electronics Corporation Renesas Electronics Corporation +81 3-6773-3001 +81 3-6773-3002 [email protected] [email protected] Renesas Electronics Reports Financial Results for the Second Quarter Ended June 30, 2020 TOKYO, Japan, July 30, 2020 — Renesas Electronics Corporation (TSE:6723) today announced consolidated financial results in accordance with IFRS for the six months ended June 30, 2020. Summary of Consolidated Financial Results Three months ended June 30, 2020 Six months ended June 30, 2020 Billion Yen % of Revenue Billion Yen % of Revenue Revenue 166.7 100.0 345.4 100.0 Operating profit 17.3 10.4 30.6 8.8 Profit attributable to owners of the parent 11.9 7.2 23.2 6.7 Capital expenditures (Note 2) 3.9 10.2 Depreciation and others (Note 3) 34.3 73.2 R&D expenses (Note 4) 31.4 65.1 Yen Yen Exchange rate (USD) 108 109 Exchange rate (EUR) 118 119 As of June 30, 2020 Billion Yen Total assets 1,634.5 Total equity 629.4 Equity attributable to owners of the parent 626.5 Equity ratio attributable to owners of the parent (%) 38.3 Interest-bearing debt 740.2 Note 1: All figures are rounded to the nearest 100 million yen. Note 2: Capital expenditures refer to the amount of capital for property, plant and equipment (manufacturing equipment) and intangible assets based on the amount of investment decisions made during the quarter ended June 30, 2020. From the quarter ended March 31, 2020, capital expenditures include Integrated Device Technology, Inc. (hereinafter “IDT”)’s investments as well as investments including fixed costs of masks and tools. Note 3: Depreciation and others includes depreciation of fixed assets, amortization of intangible assets and amortization of long-term prepaid expenses in consolidated statements of cash flows. Note 4: R&D expenses includes a partially capitalized R&D expenses recorded as intangible assets.
Transcript of Earnings Report for the 2nd Quarter ended June 30, 2020

Renesas Electronics’ Consolidated Financial Results for the Second Quarter Ended June 30, 2020
Media Contacts Investor Contacts
Kyoko Okamoto Shigeo Muto Renesas Electronics Corporation Renesas Electronics Corporation +81 3-6773-3001 +81 3-6773-3002 [email protected] [email protected]
Renesas Electronics Reports Financial Results
for the Second Quarter Ended June 30, 2020
TOKYO, Japan, July 30, 2020 — Renesas Electronics Corporation (TSE:6723) today announced consolidated financial results in accordance with IFRS for the six months ended June 30, 2020. Summary of Consolidated Financial Results
Three months ended
June 30, 2020
Six months ended
June 30, 2020
Billion Yen % of Revenue Billion Yen % of Revenue
Revenue 166.7 100.0 345.4 100.0
Operating profit 17.3 10.4 30.6 8.8
Profit attributable to owners of
the parent 11.9 7.2 23.2 6.7
Capital expenditures (Note 2) 3.9 10.2
Depreciation and others (Note 3) 34.3 73.2
R&D expenses (Note 4) 31.4 65.1
Yen Yen
Exchange rate (USD) 108 109
Exchange rate (EUR) 118 119
As of June 30, 2020
Billion Yen
Total assets 1,634.5
Total equity 629.4
Equity attributable to owners of
the parent 626.5
Equity ratio attributable to
owners of the parent (%) 38.3
Interest-bearing debt 740.2 Note 1: All figures are rounded to the nearest 100 million yen. Note 2: Capital expenditures refer to the amount of capital for property, plant and equipment (manufacturing equipment) and intangible
assets based on the amount of investment decisions made during the quarter ended June 30, 2020. From the quarter ended March 31, 2020, capital expenditures include Integrated Device Technology, Inc. (hereinafter “IDT”)’s investments as well as investments including fixed
costs of masks and tools. Note 3: Depreciation and others includes depreciation of fixed assets, amortization of intangible assets and amortization of long-term prepaid expenses in consolidated statements of cash flows. Note 4: R&D expenses includes a partially capitalized R&D expenses recorded as intangible assets.

Renesas Electronics’ Consolidated Financial Results for the Second Quarter Ended June 30, 2020
RENESAS ELECTRONICS CORPORATION Consolidated Financial Results for the Second Quarter Ended June 30, 2020
English translation from the original Japanese-language document
July 30, 2020
Company name :Renesas Electronics Corporation Stock exchanges on which the shares are listed :Tokyo Stock Exchange, First Section Code number :6723 URL :https://www.renesas.com Representative :Hidetoshi Shibata, Representative Director,
President and CEO Contact person :Yoichi Kobayashi, Senior Director
Corporate Communications Dept. Tel. +81 (0)3-6773-3002
Filing date of Shihanki Hokokusho (scheduled) :August 5, 2020 (Amounts are rounded to the nearest million yen) 1. Consolidated financial results for the six months ended June 30, 2020 1.1 Consolidated financial results (% of change from corresponding period of the previous year)
Revenue Operating profit
(loss)
Profit before tax from continuing
operations (loss)
Profit (loss)
Profit attributable to owners of the
parent (loss)
Total comprehensive
income (loss)
Million yen
% Million yen
%
Million yen
%
Million yen
%
Million yen
%
Million yen
%
Six months ended June 30, 2020 Six months ended June 30, 2019
345,415
342,884
0.7
(11.8)
30,569
(12,226)
---
---
29,769
(13,491)
---
---
23,260
(11,023)
---
---
23,212
(11,001)
---
---
(720)
(46,389)
---
---
Basic
earnings per share
(loss)
Diluted earnings per share
(loss)
Yen Yen
Six months ended June 30, 2020 Six months ended June 30, 2019
13.55
(6.54)
13.32
(6.54)
1.2 Consolidated financial position
Total assets Total equity Equity attributable to owners of the
parent
Ratio of equity attributable to owners of the
parent
Million yen Million yen Million yen % June 30, 2020 December 31, 2019
1,634,504
1,668,148
629,374
624,404
626,511
621,455
38.3
37.3

Renesas Electronics’ Consolidated Financial Results for the Second Quarter Ended June 30, 2020
2. Cash dividends
Cash dividends per share At the end
of first quarter
At the end of second
quarter
At the end of third quarter
At the end of year
Total
Yen Yen Yen Yen Yen Year ended December 31, 2019
--- 0.00 --- 0.00 0.00
Year ending December 31, 2020
--- 0.00
Year ending December 31, 2020 (forecast)
--- --- ---
Note: Change in forecast of cash dividends since the most recently announced forecast: No
3. Forecast of consolidated results for the nine months ending September 30, 2020
Non-GAAP Revenue
Non-GAAP Gross Margin
Non-GAAP Operating Margin
Nine months ending September 30, 2020
Million yen
508,415 to 516,415
%
(3.4) to (1.9)
%
46.8
%pts
4.7
%
17.2
%pts
5.6
Note 1: The Group reports its consolidated forecast on a quarterly basis (cumulative quarters) as substitute for a yearly forecast in a
range format. For details, please refer to Appendix 1.3. “Consolidated Forecasts” page 6.
Note 2: Non-GAAP figures are calculated by removing or adjusting non-recurring items and other adjustments from GAAP figures
following a certain set of rules. The Group believes non-GAAP measures provide useful information in understanding and
evaluating the Group’s constant business results, and therefore forecasts are provided as a non-GAAP basis.
4. Others 4.1 Changes in significant subsidiaries for the six months ended June 30, 2020: Yes (Changes in specified subsidiaries resulting in changes in scope of consolidation) (Note) For details, please refer to page 16 4.2 Changes in Accounting Policies, Changes in Accounting Estimates and Corrections of Prior Period Errors
1. Changes in accounting policies with revision of accounting standard: No 2. Changes in accounting policies except for 4.2.1: Yes 3. Changes in accounting estimates: No
4.3 Number of shares issued and outstanding (common stock) 1. Number of shares issued and outstanding (including treasury stock)
As of June 30, 2020: 1,719,396,690 shares As of December 31, 2019: 1,710,276,790 shares
2. Number of treasury stock
As of June 30, 2020: 2,581 shares As of December 31, 2019: 2,581 shares
3. Average number of shares issued and outstanding
Six months ended June 30, 2020: 1,713,078,576 shares Six months ended June 30, 2019: 1,681,578,376 shares
(Note) Information regarding the implementation of audit procedures
These financial results are not subject to audit review procedures.

Renesas Electronics’ Consolidated Financial Results for the Second Quarter Ended June 30, 2020
Cautionary Statement
The Group will hold a quarterly earnings conference for institutional investors and analysts on July 30, 2020. The Group plans to post the materials which are provided at the meeting, on the Group’s website on that day.
The statements with respect to the financial outlook of Renesas Electronics Corporation (hereinafter “the Company”) and its consolidated subsidiaries (hereinafter “the Group”) are forward-looking statements involving risks and uncertainties. We caution you in advance that actual results may differ materially from such forward-looking statements due to changes in several important factors.

1 Renesas Electronics’ Consolidated Financial Results for the Second Quarter Ended June 30, 2019
[APPENDIX]
1. Business Results 2
1.1 Analysis of Business Results 2
1.2 Consolidated Financial Condition 5
1.3 Consolidated Forecasts 6
2. Condensed Consolidated Financial Statements 7
2.1 Condensed Consolidated Statement of Financial Position 7
2.2 Condensed Consolidated Statement of Profit or Loss and 9
Consolidated Statement of Comprehensive Income
2.3 Condensed Consolidated Statement of Changes in Equity 13
2.4 Condensed Consolidated Statement of Cash Flows 15
2.5 Notes to Condensed Consolidated Financial Statements 16
(Basis for Preparation) 16
(Basis of Condensed Consolidated Financial Statement) 16
(Notes about Going Concern Assumption) 16
(Significant Accounting Policies) 16
(Significant Accounting Estimates and Judgments) 16
(Business Segments) 18
(Business Combinations) 21
(Trade and Other Receivables) 24
(Trade and Other Payables) 24
(Revenue) 24
(Selling, General and Administrative Expenses) 24
(Other Income) 26
(Other Expenses) 26
(Subsequent Events) 27

2 Renesas Electronics’ Consolidated Financial Results for the Second Quarter Ended June 30, 2020
1. Business Results
1.1 Analysis of Business Results The Group discloses consolidated business results in terms of both its internal measures which the management relies upon in making decisions (hereinafter the “Non-GAAP” financial measures) and those under IFRS. Non-GAAP operating profit is operating profit under IFRS (hereinafter “IFRS operating profit”) after excluding or adjusting non-recurring items and other adjustments following a certain set of rules. The Group believes providing non-GAAP forecasts will help to better understand the Group’s constant business results. Non-recurring items include depreciation of intangible assets recognized from acquisitions, other purchase price allocation (hereinafter “PPA”) adjustments, cost relating to acquisitions and stock-based compensation as well as other non-recurring expenses and income the Group believes to be applicable.
In addition, after acquisition of IDT in March 2019 and the transition to an organizational structure based on two business units, from the third quarter ended September 30, 2019, the financial figures disclosed have been reformed into two segments: “Automotive Business” and “Industrial/Infrastructure/IoT Business”. Following these changes, the Group discontinued the disclosure of the “Non-GAAP Revenue from Semiconductors” segment. As a result, consolidated financial results from the three months ended March 31, 2019 are listed under the new segments. For details, please refer to Appendix 2 “Condensed Consolidated Financial Statements, 2.5 Notes to Condensed Consolidated Financial Statements (Business Segments)”.
Moreover, the Group finalized provisional accounting treatment for business integration as of the financial year ended December 31, 2019, and for the six months ended June 30, 2019 as well as the three months ended June 30, 2019, the condensed quarterly consolidated financial results reflect significant revised acquisition cost allocation. For details, please refer to Appendix 2. “Condensed Consolidated Financial Statements, 2.5 Notes to Condensed Consolidated Financial Statements (Business Combinations)”.
Furthermore, following the acquisition of IDT and the absorption type merger of IDT with Renesas Electronics America Inc., since January 1, 2020, the Group has begun the integration of business processes and IT systems, etc. as part of the “One Renesas” promotion. With these processes as a momentum, expense classifications have been revised in order to appropriately display the Group’s financial status and business performance. Changes in classifications have been applied retroactively; therefore, the consolidated financial results of the three and six months ended June 30, 2019 have been reclassified. For details, please refer to Appendix 2 “Condensed Consolidated Financial Statements, 2.5 Notes to Condensed Consolidated Financial Statements (Basis for Preparation), (4) Changes in Accounting Policy (Changes of the classification of expenses)”. (Note): For disclosure of Non-GAAP financial measures, the Group refers to the rules specified by the U.S. Securities and
Exchange Commission but does not fully comply with such rules. 1) Overview of the current financial operation
Summary of Consolidated Financial Results for the Six Months ended June 30, 2020 (Non-GAAP basis)
Six months ended June 30, 2019
(Jan 1 – Jun 30, 2019)
Six months ended June 30, 2020
(Jan 1 – Jun 30, 2020)
Increase (Decrease)
Billion yen Billion yen
Billion yen
% Change
Non-GAAP Revenue 342.9 345.4 2.5 0.7%
Automotive 177.2 166.2 (11.1) (6.2%)
Industrial/Infrastructure/IoT 156.9 174.1 17.3 11.0%
Non-GAAP Operating Profit Non-GAAP Operating Margin
34.2 10.0%
63.9 18.5%
29.6 8.5pts
86.6% ---
Automotive 7.8
4.4% 22.3
13.4% 14.5
9.0pts 185.7%
---
Industrial/Infrastructure/IoT 25.4
16.2% 43.2
24.8% 17.8
8.6pts 70.1%
---
(Note): For details on the above, please refer to Appendix 2 “Condensed Consolidated Financial Statements, 2.5. Notes to Condensed Consolidated Financial Statements (Business Segments).
<Non-GAAP Revenue> Consolidated non-GAAP revenue for the six months ended June 30, 2020 was 345.4 billion yen, a 0.7% increase year on year. This was mainly due to several factors including a smaller decrease in Renesas’ Automotive business shipment compared to that of the overall automotive industry during the six months ended June 30, 2020, owing to a time lag in the impact from the supply chain despite a slowdown in the global Automotive business as a result of the outbreak of COVID-19 worldwide, as well as an increase in revenue in the Industrial/Infrastructure/IoT business following the recording of IDT’s revenue as Renesas’ consolidated revenue from the completion of the IDT acquisition in March 2019. <Non-GAAP Gross Profit (Margin)> Non-GAAP gross profits for the six months ended June 30, 2020 was 163.7 billion yen, a 22.5 billion yen increase year on year. This was mainly due to operating profit being generated ahead of schedule owing to less-than-expected reduction in
3 Renesas Electronics’ Consolidated Financial Results for the Second Quarter Ended June 30, 2020
production compared to the decrease in revenue from the Automotive business, as well as an increase in revenue for the Industrial/Infrastructure/IoT business. As a result, non-GAAP gross margin for the six months ended June 30, 2020 was 47.4%, an increase by 6.2 points year on year. <Non-GAAP Operating Profit (Margin)> Non-GAAP operating profit for the six months ended June 30, 2020 was 63.9 billion yen, a 29.6 billion yen increase year on year. This was mainly due to an increase in gross profit as well as reduction of costs, mainly in Selling and General Administrative expenses. As a result, non-GAAP operating margin for the six months ended June 30, 2020 was 18.5%, an increase by 8.5 points year on year.
The non-GAAP revenue breakdown of the business segments for the six months ended June 30, 2020 are as follows: Automotive Business The Automotive business includes the product categories “Automotive control,” comprising semiconductor devices for controlling automobile engines and bodies, and “Automotive information,” comprising semiconductor devices used in automotive information systems such as navigation systems. The Group mainly supplies microcontrollers (MCUs), system-on-chips (SoCs), analog semiconductor devices and power semiconductor devices in each of these categories.
Non-GAAP revenue of the Automotive business for the six months ended June 30, 2020 was 166.2 billion yen, a 6.2% decrease year on year. This was mainly due to a decrease in sales in the “Automotive control” category.
Non-GAAP operating profit of the Automotive business for the six months ended June 30, 2020 was 22.3 billion yen, a 14.5 billion yen increase year on year, mainly due to operating profit being generated ahead of schedule owing to less-than-expected reduction in production compared to the decrease in revenue owing to the outbreak of COVID-19, in addition to improvements in gross margin due to product mix improvement as well as a decrease in Selling and General Administration expenses despite a decrease in revenue. Industrial/Infrastructure/IoT Business The Industrial/Infrastructure/IoT business includes the categories “Industrial”, “Infrastructure” and “IoT” which support the smart society. The Group mainly supplies MCUs and SoCs in each of these categories.
Non-GAAP revenue of the Industrial/Infrastructure/IoT business for the six months ended June 30, 2020 was 174.1 billion yen, an 11.0% increase year on year. This was mainly due to increased revenue in the “Infrastructure” and “IoT” categories despite a decrease in revenue in the “Industrial” category.
Non-GAAP operating profit of the Industrial/Infrastructure/IoT business for the six months ended June 30, 2020 was 43.2 billion yen, a 17.8 billion yen increase year on year, due to an increase in profits owing to increases in revenue. 2) Reconciliation of Non-GAAP operating profit to IFRS operating profit
(Billion yen)
Six months ended
June 30, 2019 (Jan 1 – Jun 30, 2019)
Six months ended June 30, 2020
(Jan 1 – Jun 30, 2020)
Non-GAAP gross profit Non-GAAP gross margin
141.2 41.2%
163.7 47.4%
Amortization of purchased intangible assets and depreciation of fixed assets
(0.7) (0.9)
Stock-based compensation (0.4) (0.4)
Market value of inventories (11.3) -
Other reconciliations in non-recurring expenses and adjustments
(0.2) (1.0)
IFRS gross profit IFRS gross margin
128.5 37.5%
161.4 46.7%
Non-GAAP operating profit Non-GAAP operating margin
34.2 10.0%
63.9 18.5%
Amortization of purchased intangible assets and fixed assets
(18.8) (28.5)
Stock-based compensation (4.5) (5.7)
Market value of inventories (11.3) -
Other reconciliations in non-recurring expenses and adjustments
(11.9) 0.8
IFRS operating profit IFRS operating margin
(12.2) (3.6%)
30.6 8.8%
(Note): “Other reconciliations in non-recurring expenses and adjustments” includes the non-recurring items related to acquisitions and other adjustments as well as non-recurring profits or losses.

4 Renesas Electronics’ Consolidated Financial Results for the Second Quarter Ended June 30, 2020
3) Overview of the current financial operation (IFRS basis)
Summary of Consolidated Financial Results for the Six Months ended June 30, 2020 (IFRS basis)
Six months ended June 30, 2019
(Jan 1 – Jun 30, 2019)
Six months ended June 30, 2020
(Jan 1 – Jun 30, 2020)
Increase (Decrease)
Billion yen Billion yen Billion yen
% Change
Revenue 342.9 345.4 2.5 0.7%
Gross Profit Gross Margin
128.5 37.5%
161.4 46.7%
32.9 9.2pts
25.6% ---
Operating Profit Operating Margin
(12.2) (3.6%)
30.6 8.8%
42.8 12.4pts
--- ---
5 Renesas Electronics’ Consolidated Financial Results for the Second Quarter Ended June 30, 2020
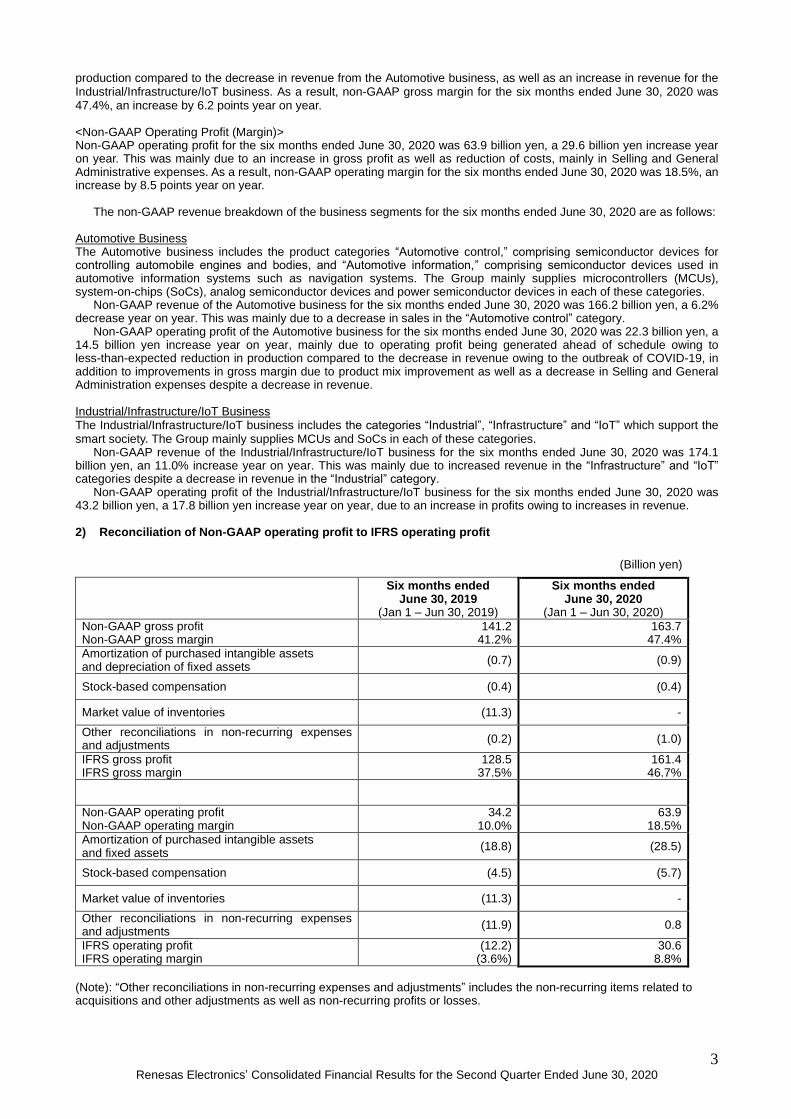
1.2 Consolidated Financial Condition 1.2.1 Total Assets, Liabilities and Total Equity
As of December 31, 2019
As of June 30, 2020
Increase (Decrease)
Billion yen Billion yen Billion yen
Total assets Total equity Equity attributable to owners of the parent Equity ratio attributable to owners of the parent (%) Interest-bearing debt Debt / Equity ratio
1,668.1 624.4 621.5
37.3 785.9
1.26
1,634.5 629.4 626.5
38.3 740.2
1.18
(33.6) 5.0 5.0 1.0
(45.7) (0.08)
Total assets at the six months ended June 30, 2020 were 1,634.5 billion yen, a 33.6 billion yen decrease from the year ended December 31, 2019. This was mainly due to a decrease in fixed assets due to depreciation, as well as a decrease in goodwill owing to fluctuations in the exchange rate. Total equity were 629.4 billion yen, a 5.0 billion yen increase from the year ended December 31, 2019. This was due to an increase in retained earnings despite a decrease in other components of equity owing to a decrease in conversion differences in overseas sales activities following fluctuations in the exchange rate. Equity attributable to owners of the parent increased by 5.0 billion yen from the year ended December 31, 2019, and the Equity ratio attributable to owners of the parent was 38.3%. In addition to this, Interest-bearing debt decreased by 45.7 billion yen from the year ended December 31, 2019, mainly due to a decrease from debt repayment. Consequently, the debt to equity ratio increased to 1.18. 1.2.2 Cash Flows
Six months ended June 30, 2019
(Jan 1 – Jun 30, 2019)
Six months ended June 30, 2020
(Jan 1 – Jun 30, 2020)
Billion yen Billion yen
Net cash provided by (used in) operating activities Net cash provided by (used in) investing activities
75.0 (718.2)
76.6 (19.8)
Free cash flows (643.2) 56.8
Net cash provided by (used in) financing activities 573.8 (52.5)
Cash and cash equivalents at the beginning of period Cash and cash equivalents at the end of period
188.8 116.5
146.5 148.5
(Net cash provided by (used in) operating activities) Net cash provided by operating activities for the six months ended June 30, 2020 was 76.6 billion yen. This was mainly due to a recording of 29.8 billion yen in income before tax as well as adjustments in non-cash items such as depreciation, despite payments made in trade and other payables and other current liabilities. (Net cash provided by (used in) investing activities) Net cash used in investing activities for the six months ended June 30, 2020 was 19.8 billion yen. This was mainly due to the purchase of fixed assets and intangible assets. The foregoing resulted in positive free cash flows of 56.8 billion yen for the six months ended June 30, 2020. (Net cash provided by (used in) financing activities) Net cash used in financing activities for the six months ended June 30, 2020 was 52.5 billion yen. This was mainly due to repayments of long-term borrowings to main financing banks.

6 Renesas Electronics’ Consolidated Financial Results for the Second Quarter Ended June 30, 2020
1.3 Consolidated Forecasts The Group reports its consolidated forecasts for the next quarter (cumulative quarters) as a range because of the difficulty of forecasting full-year results with high accuracy due to the short-term volatility of the semiconductor market. Additionally, in order to provide useful information to better understand the Group’s constant business results, figures such as revenue and gross margin are presented in the non-GAAP format, which excludes or adjusts the non-recurring items related to acquisitions and other adjustments including non-recurring expenses or income from the figures based on GAAP (IFRS based) following a certain set of rules. The gross margin and operating margin forecasts are given assuming the midpoint in the revenue forecast. (For the nine months ending September 30, 2020)
Non-GAAP Revenue
Non-GAAP Gross Margin
Non-GAAP Operating Margin
Previous forecasts --- --- ---
Revised forecasts (July 30, 2020)
Million yen
508,415 to 516,415
%
46.8
%
17.2
Increase (decrease) --- --- ---
Percent change --- --- ---
Reference: Results of the nine months ended September 30, 2019
526,241 42.1 11.6
(*1) Non-GAAP figures are calculated by removing or adjusting non-recurring items and other adjustments from GAAP figures following a certain set of rules. The Group believes non-GAAP measures provide useful information in understanding and evaluating the Group’s constant business results, and therefore, forecasts are provided as a non-GAAP basis. This adjustment and exclusion include depreciation of fixed assets, amortization of intangible assets recognized from acquisitions, other PPA adjustments and costs relating to acquisitions, stock-based compensation, as well as other non-recurring expenses and income the Group believes to be applicable.
The consolidated forecasts for the nine months ending September 30, 2020 are calculated by combining the forecasts for the three months ending September 30, 2020, to the financial results of the six months ended June 30, 2020. The consolidated forecasts for the nine months ending September 30, 2020 are calculated at the rate of 108 yen per USD and 119 yen per Euro. The statements with respect to the financial outlook of the Group are forward-looking statements involving risks and uncertainties. The Company cautions you in advance that actual results may vary materially from such forward-looking statements due to several important factors.

7 Renesas Electronics’ Consolidated Financial Results for the Second Quarter Ended June 30, 2020
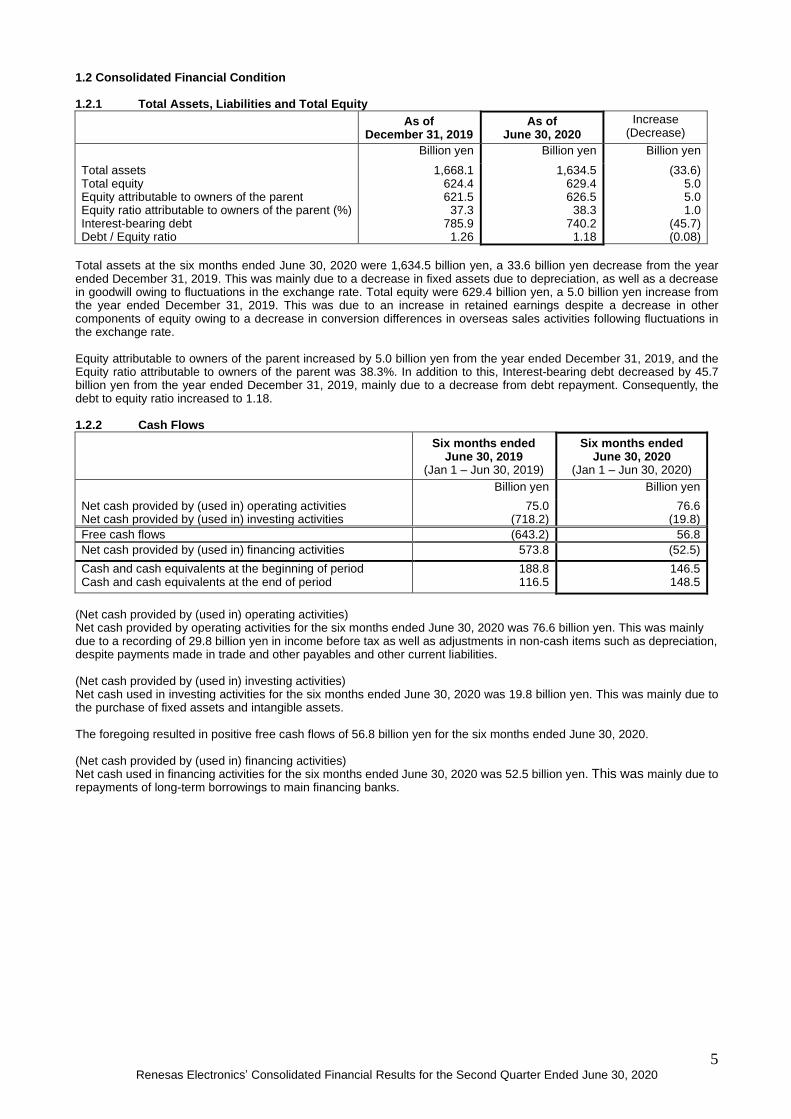
2. Condensed Consolidated Financial Statements 2.1 Condensed Consolidated Statement of Financial Position
(In millions of yen)
As of December 31, 2019 As of June 30, 2020
Assets
Current assets
Cash and cash equivalents 146,468 148,505
Trade and other receivables 84,459 76,578
Inventories 90,785 101,789
Other current financial assets 468 437
Income tax receivables 4,438 2,792
Other current assets 7,344 8,036
Total current assets 333,962 338,137
Non-current assets
Property, plant and equipment 232,579 208,237
Goodwill 625,030 614,648
Intangible assets 414,582 409,825
Other non-current financial assets 9,995 8,505
Deferred tax assets 46,050 49,611
Other non-current assets 5,950 5,541
Total non-current assets 1,334,186 1,296,367
Total assets 1,668,148 1,634,504
8 Renesas Electronics’ Consolidated Financial Results for the Second Quarter Ended June 30, 2020
(In millions of yen)
As of December 31, 2019 As of June 30, 2020
Liabilities and equity
Liabilities
Current liabilities
Trade and other payables 100,187 93,948
Bonds and Borrowings 93,182 93,182
Other current financial liabilities 4,362 4,051
Income tax payables 7,861 10,531
Provisions 7,521 4,224
Other current liabilities 55,528 43,250
Total current liabilities 268,641 249,186
Non-current liabilities
Trade and other payables 845 28,889
Bonds and Borrowings 678,577 632,507
Other non-current financial liabilities 10,093 10,808
Income tax payables 4,499 4,460
Retirement benefit liabilities 29,572 29,080
Provisions 3,860 3,019
Deferred tax liabilities 43,257 42,852
Other non-current liabilities 4,400 4,329
Total non-current liabilities 775,103 755,944
Total liabilities 1,043,744 1,005,130
Equity
Issued capital 22,213 25,055
Share premium 201,588 204,430
Retained earnings 403,857 427,863
Treasury shares (11) (11)
Other components of equity (6,192) (30,826)
Total equity attributable to owners of the parent 621,455 626,511
Non-controlling interests 2,949 2,863
Total equity 624,404 629,374
Total liabilities and equity 1,668,148 1,634,504
9 Renesas Electronics’ Consolidated Financial Results for the Second Quarter Ended June 30, 2020
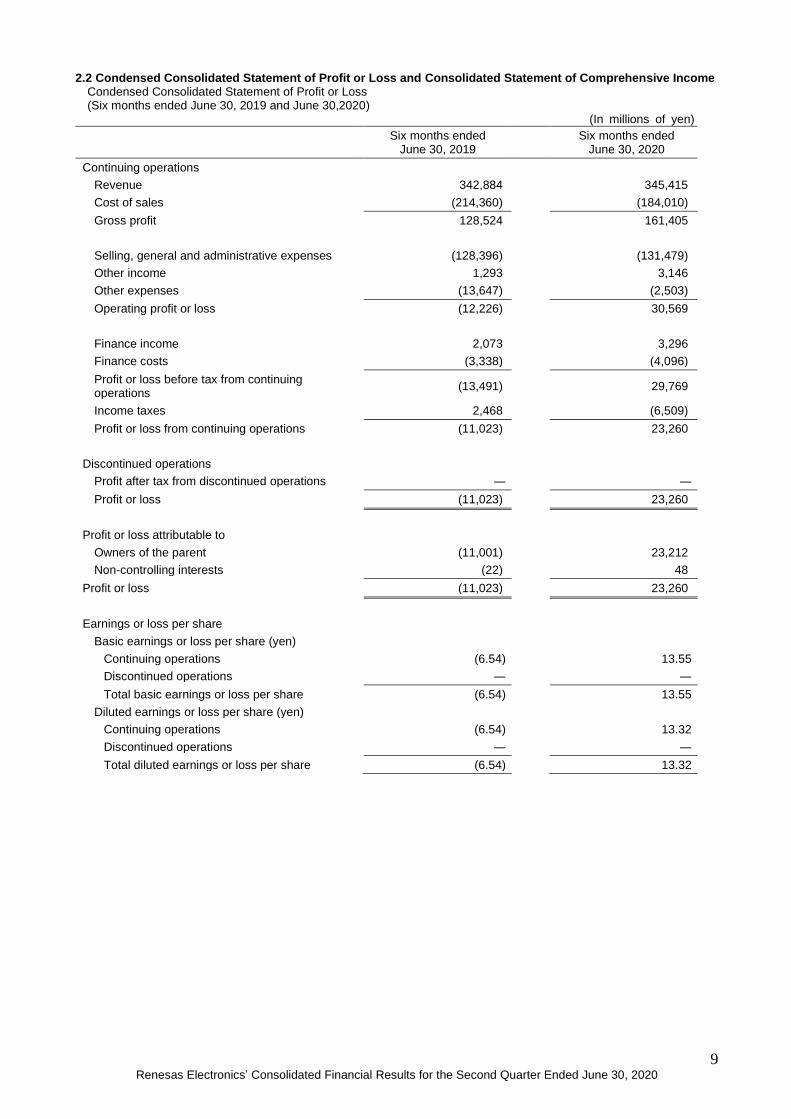
2.2 Condensed Consolidated Statement of Profit or Loss and Consolidated Statement of Comprehensive Income Condensed Consolidated Statement of Profit or Loss (Six months ended June 30, 2019 and June 30,2020)
(In millions of yen)
Six months ended
June 30, 2019
Six months ended June 30, 2020
Continuing operations
Revenue 342,884 345,415
Cost of sales (214,360) (184,010)
Gross profit 128,524 161,405
Selling, general and administrative expenses (128,396) (131,479)
Other income 1,293 3,146
Other expenses (13,647) (2,503)
Operating profit or loss (12,226) 30,569
Finance income 2,073 3,296
Finance costs (3,338) (4,096)
Profit or loss before tax from continuing operations
(13,491) 29,769
Income taxes 2,468 (6,509)
Profit or loss from continuing operations (11,023) 23,260
Discontinued operations
Profit after tax from discontinued operations ― ―
Profit or loss (11,023) 23,260
Profit or loss attributable to
Owners of the parent (11,001) 23,212
Non-controlling interests (22) 48
Profit or loss (11,023) 23,260
Earnings or loss per share
Basic earnings or loss per share (yen)
Continuing operations (6.54) 13.55
Discontinued operations ― ―
Total basic earnings or loss per share (6.54) 13.55
Diluted earnings or loss per share (yen)
Continuing operations (6.54) 13.32
Discontinued operations ― ―
Total diluted earnings or loss per share (6.54) 13.32

10 Renesas Electronics’ Consolidated Financial Results for the Second Quarter Ended June 30, 2020
Condensed Consolidated Statement of Comprehensive Income (Six months ended June 30, 2019 and June 30,2020)
(In millions of yen)
Six months ended
June 30, 2019
Six months ended June 30, 2020
Profit or loss (11,023) 23,260
Other comprehensive income
Items that will not be reclassified to profit or loss
Remeasurements of defined benefit plans (1,964) 270
Equity instruments measured at fair value through other comprehensive income
(95) (434)
Total of items that will not be reclassified to profit or loss
(2,059) (164)
Items that may be reclassified subsequently to profit or loss
Exchange differences on translation of foreign operations
(38,921) (23,816)
Changes in fair value of cash flow hedges 5,614 ―
Total of items that may be reclassified subsequently to profit or loss
(33,307) (23,816)
Total other comprehensive income (35,366) (23,980)
Total comprehensive income (46,389) (720)
Comprehensive income attributable to
Owners of the parent (46,310) (634)
Non-controlling interests (79) (86)
Total comprehensive income (46,389) (720)

11 Renesas Electronics’ Consolidated Financial Results for the Second Quarter Ended June 30, 2020
Condensed Consolidated Statement of Profit or Loss (Three months ended June 30, 2019 and June 30,2020)
(In millions of yen)
Three months ended
June 30, 2019
Three months ended June 30, 2020
Continuing operations
Revenue 192,625 166,672
Cost of sales (119,476) (87,567)
Gross profit 73,149 79,105
Selling, general and administrative expenses (71,952) (63,153)
Other income 640 2,513
Other expenses (12,693) (1,209)
Operating profit or loss (10,856) 17,256
Finance income 1,952 233
Finance costs (2,668) (1,898)
Profit or loss before tax from continuing operations
(11,572) 15,591
Income taxes 2,470 (3,689)
Profit or loss from continuing operations (9,102) 11,902
Discontinued operations
Profit after tax from discontinued operations ― ―
Profit or loss (9,102) 11,902
Profit or loss attributable to
Owners of the parent (9,092) 11,923
Non-controlling interests (10) (21)
Profit or loss (9,102) 11,902
Earnings or loss per share
Basic earnings or loss per share (yen)
Continuing operations (5.36) 6.95
Discontinued operations ― ―
Total basic earnings or loss per share (5.36) 6.95
Diluted earnings or loss per share (yen)
Continuing operations (5.36) 6.84
Discontinued operations ― ―
Total diluted earnings or loss per share (5.36) 6.84

12 Renesas Electronics’ Consolidated Financial Results for the Second Quarter Ended June 30, 2020
Condensed Consolidated Statement of Comprehensive Income (Three months ended June 30, 2019 and June 30,2020)
(In millions of yen)
Three months ended
June 30, 2019
Three months ended June 30, 2020
Profit or loss (9,102) 11,902
Other comprehensive income
Items that will not be reclassified to profit or loss
Remeasurements of defined benefit plans (854) 4
Equity instruments measured at fair value through other comprehensive income
(366) (434)
Total of items that will not be reclassified to profit or loss
(1,220) (430)
Items that may be reclassified subsequently to profit or loss
Exchange differences on translation of foreign operations
(39,673) (11,207)
Total of items that may be reclassified subsequently to profit or loss
(39,673) (11,207)
Total other comprehensive income (40,893) (11,637)
Total comprehensive income (49,995) 265
Comprehensive income attributable to
Owners of the parent (49,878) 286
Non-controlling interests (117) (21)
Total comprehensive income (49,995) 265

13 Renesas Electronics’ Consolidated Financial Results for the Second Quarter Ended June 30, 2020
2.3 Condensed Consolidated Statement of Changes in Equity (Six months ended June 30, 2019)
(In millions of yen)
Equity attributable to owners of the parent
Other components of equity
Issued capital
Share premium
Retained earnings
Treasury shares
Stock acquisition
rights
Remea- surements of defined
benefit plans
Equity
instru- ments
measured at fair value
through other
compre- hensive income
Exchange differences
on translation of foreign operations
Changes in fair
value of cash flow hedges
Total
Total equity attributable to owners of the parent
Non- controlling interests
Total equity
Balance as of January 1, 2019
10,699 190,074 410,652 (11) 5,165 ― (1,072) (3,089) (14,318) (13,314) 598,100 2,868 600,968
Impact of changes in accounting policies
― ― 1,192 ― ― ― ― ― ― ― 1,192 ― 1,192
Balance as of
January 1, 2019
after changes in
accounting policies
10,699 190,074 411,844 (11) 5,165 ― (1,072) (3,089) (14,318) (13,314) 599,292 2,868 602,160
Loss ― ― (11,001) ― ― ― ― ― ― ― (11,001) (22) (11,023)
Other comprehensive income
― ― ― ― ― (1,964) (95) (38,864) 5,614 (35,309) (35,309) (57) (35,366)
Total comprehensive income
― ― (11,001) ― ― (1,964) (95) (38,864) 5,614 (35,309) (46,310) (79) (46,389)
Issue of new shares
8,659 9,232 ― ― ― ― ― ― ― ― 17,891 ― 17,891
Share-based payments
― ― ― ― 10,078 ― ― ― ― 10,078 10,078 ― 10,078
Transfer to retained earnings
― (573) (1,038) ― (389) 1,964 36 ― ― 1,611 ― ― ―
Reclassification
to non-financial
assets
― ― ― ― ― ― ― ― 8,704 8,704 8,704 ― 8,704
Total amount of transactions with owners
8,659 8,659 (1,038) ― 9,689 1,964 36 ― 8,704 20,393 36,673 ― 36,673
Balance as of June 30, 2019
19,358 198,733 399,805 (11) 14,854 ― (1,131) (41,953) ― (28,230) 589,655 2,789 592,444

14 Renesas Electronics’ Consolidated Financial Results for the Second Quarter Ended June 30, 2020
(Six months ended June 30, 2020) (In millions of yen)
Equity attributable to owners of the parent
Other components of equity
Issued capital
Share premium
Retained earnings
Treasury shares
Stock acquisition
rights
Remea- surements of defined
benefit plans
Equity
instru-
ments measured
at fair value
through other
compre- hensive income
Exchange differences
on translation of foreign operations
Changes in fair
value of cash flow hedges
Total
Total equity attributable to owners of the parent
Non- controlling interests
Total equity
Balance as of January 1, 2020
22,213 201,588 403,857 (11) 16,053 ― (1,131) (21,114) ― (6,192) 621,455 2,949 624,404
Profit ― ― 23,212 ― ― ― ― ― ― ― 23,212 48 23,260
Other comprehensive income
― ― ― ― ―
270 (434) (23,682) ― (23,846) (23,846) (134) (23,980)
Total comprehensive income
― ―
23,212 ― ―
270 (434) (23,682) ― (23,846) (634) (86) (720)
Issue of new shares
2,842 2,842 ― ― ― ― ― ― ― ― 5,684 ― 5,684
Share-based payments
― ― ― ― 6 ― ― ― ― 6 6 ― 6
Transfer to retained earnings
― ― 794 ― (958) (270) 434 ― ― (794) ― ― ―
Total amount of transactions with owners
2,842 2,842 794 ― (952) (270) 434 ― ― (788) 5,690 ― 5,690
Balance as of June 30, 2020
25,055 204,430 427,863 (11) 15,101 ― (1,131) (44,796) ― (30,826) 626,511 2,863 629,374

15 Renesas Electronics’ Consolidated Financial Results for the Second Quarter Ended June 30, 2020
2.4 Condensed Consolidated Statement of Cash Flows (Six months ended June 30, 2019 and June 30, 2020)
(In millions of yen)
Six months ended
June 30, 2019
Six months ended June 30, 2020
Cash flows from operating activities
Profit or loss (13,491) 29,769
Depreciation and amortization 69,742 73,166
Impairment loss 1,498 580
Finance income and costs 2,315 3,439
Share-based payments 4,318 5,680
Loss (gain) on sales of property, plant and equipment, and intangible assets
(424) (448)
Changes in inventories 34,113 (11,713)
Changes in trade and other receivables 7,584 7,023
Changes in trade and other payables (2,603) (11,182)
Changes in retirement benefit liabilities (3,319) (342)
Changes in provisions 2,922 (3,910)
Changes in other current liabilities (25,421) (11,869)
Other (1,271) (502)
Subtotal 75,963 79,691
Interest received 1,011 183
Dividend received 11 219
Income taxes paid (1,937) (3,474)
Net cash flows from operating activities 75,048 76,619
Cash flows from investing activities
Purchase of property, plant and equipment (22,291) (10,487)
Proceeds from sales of property, plant and equipment
460 645
Purchase of intangible assets (9,943) (8,426)
Purchase of other financial assets (265) (320)
Proceeds from sales of other financial assets
543 304
Acquisition of subsidiaries (685,831) ―
Other (918) (1,489)
Net cash flows from investing activities (718,245) (19,773)
Cash flows from financing activities
Net increase (decrease) in short-term borrowings
(25,000) ―
Proceeds from long-term borrowings 847,000 ―
Repayments of long-term borrowings (171,034) (46,710)
Repayment of lease liabilities (2,520) (2,623)
Interest paid (9,258) (3,220)
Payments for retirement by purchase of bonds
(65,409) ―
Other 32 9
Net cash flows from financing activities 573,811 (52,544)
Effect of exchange rate changes on cash and cash equivalents
(2,965) (2,265)
Increase (decrease) in cash and cash equivalents
(72,351) 2,037
Cash and cash equivalents at beginning of the period
188,820 146,468
Cash and cash equivalents at end of the period
116,469 148,505

16 Renesas Electronics’ Consolidated Financial Results for the Second Quarter Ended June 30, 2020
2.5 Notes to Condensed Consolidated Financial Statements (Basis for Preparation)
(1) Compliance with IFRS Because the Group meets the requirements for “Specified Companies Complying with Designated International Accounting Standards” stated in Article 1-2 of Ordinance on Consolidated Financial Statements, the Group has adopted the provisions of Article 93 of the Ordinance. The condensed consolidated financial statements of the Group have been prepared in accordance with IAS34 “Interim Financial Reporting”. The condensed consolidated financial statements do not contain all of the information required of the consolidated financial statements of the fiscal year. Therefore, the condensed consolidated financial statements have to be used with the consolidated financial statements from the prior fiscal year.
(2) Basis of measurement
In the condensed consolidated financial statements of the Group, assets and liabilities are measured at a historical cost basis except for items such as financial instruments measured at fair value.
(3) Functional currency and presentation currency The condensed consolidated financial statements are presented in Japanese yen (rounded to the nearest million yen), which is the functional currency of the Company.
(4) Changes in Accounting Policy (Changes of the classification of expenses)
Following the acquisition of IDT and the subsequent merger of Renesas Electronics America Inc. by IDT, the Company began to integrate its business processes and IT systems from January 1, 2020 for the launch of “One Renesas” operations. In conjunction with the integration, the Company has also decided to revise the classification of expenses in order to better present the financial position and results of operations of the Group.
Royalty expenses paid as technology licensing fees were previously recorded in selling, general and administrative expenses in the past. However, because the percentage of royalty expenses linked to sales revenue has been increasing in recent years, the Company has decided to divide the royalty expenses into those linked to sales revenue and those not linked to sales revenue, and from the first quarter of the current fiscal year, the portion linked to sales revenue has been classified into cost of sales and inventories as manufacturing costs. In addition, the costs incurred by the department at the head office, which oversees IT infrastructure and company-wide system operations, were recorded in selling, general and administrative expenses. However, from the first quarter of the current fiscal year, the Company has changed its method of accounting for the IT costs to be recorded also by cost of sales and inventories as manufacturing costs as well as research and development expenses (selling, general and administrative expenses) to reflect the nature of the expenses, as it is more appropriate to allocate those costs to the beneficiaries who actually use the infrastructure and systems.
The change in accounting policy has been applied retrospectively to the condensed consolidated financial statements for the six months ended June 30, 2019 and three months ended June 30, 2019. As a result of this change, compared with the accounting policy prior to retrospective application, cost of sales for the six months ended June 30, 2020 increased by 4,231 million yen, selling, general and administrative expenses decreased by 3,886 million yen and operating loss and loss before tax from continuing operations increased by 345 million yen, respectively. In addition, cost of sales for the three months ended June 30, 2020 increased 2,431 million yen, selling general and administrative expenses decreased by 2,196 million yen and operating loss before tax from continuing operations increased by 235 million yen, respectively.
Reflecting the cumulative effect on equity at the beginning of the six months ended June 30, 2019, the beginning balance of retained earnings in the condensed consolidated statement of changes in equity after retroactive application increased by 1,192 million yen. This accounting change has no material impact on earnings per share.
(Basis of Condensed Consolidated Financial Statements)
Scope of consolidation From the three months ended March 31, 2020, Renesas Electronics America Inc. has been excluded from the scope of consolidation due to the merger with IDT. Renesas Electronics America Inc. is a specified subsidiary of Renesas Electronics Corporation. On January 1, 2020 IDT merged with Renesas Electronics America Inc. in an absorption-type merger and changed the trade name to Renesas Electronics America Inc. No change in the scope of consolidation for the three months ended June 30,2020.
(Notes about Going Concern Assumption) Not applicable (Significant Accounting Policies)
Except as stated in “(Basis for Preparation), (4) Changes in Accounting Policy (Changes of the classification of expenses)”, the significant accounting policies for the condensed consolidated financial statements of the Group are the same with the accounting policies for the prior fiscal year financial statements. In addition, income taxes for the six months ended June 30, 2020 are calculated using the estimated annual effective tax rate.
(Significant Accounting Estimates and Judgments)
In preparing the condensed consolidated financial statements, management of the Group is required to make judgments, accounting estimates and assumptions that could have an impact on the application of accounting policies and the reporting amounts of assets, liabilities, revenue and expenses. These estimates and assumptions are based on the best judgment of management, taking into account various factors that are deemed reasonable on the closing date in light of past experience and available information. However, figures based on these estimates and assumptions may differ from the actual results due to their nature.

17 Renesas Electronics’ Consolidated Financial Results for the Second Quarter Ended June 30, 2020
Estimates and underlying assumptions are reviewed continuously. The impact of the review of these estimates is recognized in the period when the estimates are revised and future periods. The Company reflects the impact of the COVID-19 to estimates and assumptions (judgment to indication of impairment loss of goodwill and others), which are based on information available and believes to be reasonable at the moment. However, estimates and assumptions which make a significant impact on figures of the condensed consolidated financial statements are same as the prior fiscal year and the three months ended March 31, 2020 in principle. These estimates and assumptions may be affected depending on the future situations of the spread of the COVID-19.

18 Renesas Electronics’ Consolidated Financial Results for the Second Quarter Ended June 30, 2020
(Business Segments) (1) Overview of reportable segments The Group’s reportable segments are components of the Group for which separate financial information is available that is evaluated regularly by the Board of Directors to determine the allocation of management resources and assess performance.
The Group consists of “Automotive Business” and “Industrial/Infrastructure/IoT Business” and those are the Group’s reportable segments.
The Automotive Business includes the product categories "Automotive control", comprising semiconductor devices for controlling automobile engines and bodies, and “Automotive information”, comprising semiconductor devices used in automotive information systems such as navigation systems. The Group mainly supplies microcontrollers (MCUs), system-on-chips (SoCs), analog semiconductor devices and power semiconductor devices in each of these categories. The Industrial/Infrastructure/IoT Business includes the product categories “Industrial”, “Infrastructure” and “IoT” which support the smart society. The Group mainly supplies MCUs and SoCs in each of these categories. Additionally, commissioned development and manufacturing from the Group’s design and manufacturing subsidiaries are categorized as “Other”.
From the nine months ended September 30, 2019, the Group has implemented a change in the Group’s classification of segments for allocation of management resources and assessment of performance. Following this change, the legacy reported sole operating segment of the Group has been divided into “Automotive Business”, “Industrial/Infrastructure/IoT Business”, with commissioned development and manufacturing from the Group’s design and manufacturing subsidiaries categorized as “Other”. The information on reportable segments for the six months ended June 30, 2019 and three months ended June 30, 2019 has also been reclassified in accordance with the new classification of reportable segments. (2) Information on reportable segments The accounting treatment for reportable segments is same as described in “Significant Accounting Policies”. The internal indicators which are used by management when making decisions have been adjusted by non -recurring items specified by the Group and other adjustment following a certain set of rules from operating profit in accordance with IFRS. Segment profit or loss is calculated by deducting “Cost of Sale”, “General, Selling and Administrative Expenses” and “Other Expenses” from “Revenue” and adding “Other Income”. The Group’s Executive Officers assess the performance after eliminating intragroup transactions, and therefore, there is no transfer between reportable segments. Information on reportable segments is as follows. Six months ended June 30, 2019 (In millions of yen)
Reportable Segments Other Adjustment (Note 1)
Total Adjustment (Note 2)
Consolidation basis Automotive Industrial/
Infrastructure/ IoT
Revenue from external customers
177,237 156,860 8,787 ― 342,884 ― 342,884
Segment profit or loss 7,790 25,396 563 500 34,249 (46,475) (12,226)
Financial income 2,073 Financial expenses (3,338) Loss before tax for the period
(13,491)
(Other adjustment) Depreciation and amortization
29,955 20,672 292 ― 50,919 18,823 69,742
Six months ended June 30, 2020 (In millions of yen)
Reportable Segments Other Adjustment (Note 1)
Total Adjustment (Note 2)
Consolidation basis Automotive Industrial/
Infrastructure/ IoT
Revenue from external customers
166,174 174,122 5,119 ― 345,415 ― 345,415
Segment profit or loss 22,256 43,198 742 (2,303) 63,893 (33,324) 30,569
Financial income 3,296 Financial expenses (4,096) Profit before tax for the period
29,769
(Other adjustment) Depreciation and amortization
24,144 20,200 236 ― 44,580 28,586 73,166

19 Renesas Electronics’ Consolidated Financial Results for the Second Quarter Ended June 30, 2020
Three months ended June 30, 2019 (In millions of yen)
Reportable Segments Other Adjustment (Note 1)
Total Adjustment (Note 2)
Consolidation basis Automotive Industrial/
Infrastructure/ IoT
Revenue from external customers
94,525 93,523 4,577 ― 192,625 ― 192,625
Segment profit or loss 6,821 19,555 291 500 27,167 (38,023) (10,856)
Financial income 1,952 Financial expenses (2,668) Loss before tax for the period
(11,572)
(Other adjustment) Depreciation and amortization
14,734 10,791 263 ― 25,788 14,652 40,440
Three months ended June 30, 2020 (In millions of yen)
Reportable Segments Other Adjustment (Note 1)
Total Adjustment (Note 2)
Consolidation basis Automotive Industrial/
Infrastructure/ IoT
Revenue from external customers
72,626 91,567 2,479 ― 166,672 ― 166,672
Segment profit or loss 7,861 24,224 440 (2,303) 30,222 (12,966) 17,256
Financial income 233 Financial expenses (1,898) Profit before tax for the period
15,591
(Other adjustment) Depreciation and amortization
10,305 10,304 ― ― 20,609 13,728 34,337
(Note 1) Reportable Segment’s allocation of non-recurring items and other specified adjustments deducted or adjusted following a certain set of rules (Note 2) Non-recurring items and other specified adjustments deducted or adjusted following a certain set of rules

20 Renesas Electronics’ Consolidated Financial Results for the Second Quarter Ended June 30, 2020
(3) Information on products and services Information on products and services is the same with information on reportable segments and therefore, omitted from this section.
(4) Information on regions and countries The components of revenue from external customers by region and country are as follows. (Six months ended June 30, 2019 and June 30, 2020)
(In millions of yen)
Six months ended
June 30, 2019
Six months ended June 30,2020
Japan 128,258 123,558
China 72,074 81,540
Asia (Excluding China) 50,675 57,670
Europe 58,740 51,802
North America 31,638 29,557
Others 1,499 1,288
Total 342,884 345,415
(Three months ended June 30, 2019 and June 30, 2020)
(In millions of yen)
Three months ended
June 30, 2019
Three months ended June 30,2020
Japan 67,482 59,920
China 46,003 42,894
Asia (Excluding China) 30,108 29,994
Europe 30,770 21,788
North America 17,466 11,514
Others 796 562
Total 192,625 166,672
(Note) Revenue are categorized into the country or region based on the location of the customers.

21 Renesas Electronics’ Consolidated Financial Results for the Second Quarter Ended June 30, 2020
(Business Combinations)
(1) Business combination by acquisition
(The year ended December 31, 2019)
a. Overview of business combination
The Company resolved at the Meeting of Board of Directors to reach an agreement with IDT, whereby IDT would
become a wholly-owned subsidiary of the Company and concluded a merger agreement for the purpose of
implementing the acquisition on September 11, 2018. In addition, on March 30, 2019, following the completion of the
acquisition, IDT has become a wholly-owned subsidiary of the Company.
1) Name and overview of the acquiree
Name of the acquiree: Integrated Device Technology, Inc.
Business overview: Development, Manufacturing and Sale of mixed signal analog integrated circuit, etc.
2) Date of the acquisition
March 30, 2019 (Pacific Daylight Time: March 29, 2019)
3) Purpose of the Acquisition
The Group has been executing its growth strategy to thrive as a world-leading embedded solution provider in the
rapidly changing global semiconductor market. As the pillars of its growth strategy, the Group is accelerating its
focus on the automotive segment, where the Group has maintained a key global position over many years and
further growth is anticipated in areas such as autonomous driving and EV/HEV; industrial and infrastructure
segments, which are expected to advance with Industry 4.0 and 5G (fifth-generation) wireless communications, as
well as the fast-growing IoT segment.
In order to achieve this growth strategy, the Group is working to expand its analog solution lineup and to
strengthen its kit solution offerings that combine its world-leading microcontrollers (MCUs), system-on-chips (SoCs)
and analog products. In this context, the Group already completed the acquisition of Intersil Corporation (hereafter
“Intersil”), a U.S.-based analog semiconductor supplier, in February 2017.
With the Intersil acquisition, the Group enhanced its lineup of power management-related analog devices as well
as its ability to deliver kit solutions to customers combining the Group’s MCUs/SoCs and analog products from the
former Intersil. At the same time, the Group expanded its sales and design-ins outside of Japan and strengthened
global management capabilities by absorbing the former Intersil’s experienced management team into the Group.
The Group has made the decision to acquire IDT, a U.S.-based analog semiconductor supplier, to contribute
further towards the growth strategy. IDT is a global enterprise engaged in the development, production, sale, and
provision of services related to analog semiconductor products such as mixed-signal semiconductor solutions
particularly for markets related to the data economy such as data center and communication infrastructure that
require big-data processing. IDT has annual sales of approximately US$843 million (approximately 92.7 billion yen
at an exchange rate of 110 yen to the dollar, as of March 2018) and an operating profit margin of over 25 percent
(Non-GAAP basis).
The main strategic benefits this transaction is expected to bring are: (i) Complementary products expand the
Group’s solution offerings, and (ii) Expands business growth opportunities. Details are as follows:
(i) Complementary products expand the Group’s solution offerings
The acquisition will provide the Group with access to a vast array of robust analog mixed-signal capabilities in
embedded systems, including RF, high performance timing, memory interface, real-time interconnect, optical
interconnect, wireless power and smart sensors. The combination of these product lines with the Group’s advanced
MCUs and SoCs and power management ICs enables the Group to offer an integrated solution that supports the
increasing demand of high data processing performance. The enriched solution offerings will bring optimal systems
from external sensors through analog front end to processors and interfaces.
(ii) Expands business growth opportunities
IDT's analog mixed-signal products for data sensing, storage and interconnect are key devices that support the
growth of data economy. Acquisition of these products enables the Group to extend its reach to fast-growing data
economy-related applications including data center and communication infrastructure and strengthens its presence
in the industrial and automotive segments.
Welcoming IDT as part of the Group after the Intersil acquisition completed in 2017 is therefore seen as an effective
measure to further enhance the Group’s competitiveness in fields where the Group is focusing its efforts to
strengthen the company’s position as a global leader.

22 Renesas Electronics’ Consolidated Financial Results for the Second Quarter Ended June 30, 2020
4) Acquisition Method
For the purpose of the acquisition, the Group had established a wholly-owned subsidiary (“acquisition subsidiary”) in
Delaware, United States that then merged with IDT (in a reverse triangular merger). The surviving company
following the merger is IDT. Cash was issued for IDT’s shares as consideration for the merger, and the shares of the
acquisition subsidiary owned by the Group was converted into outstanding shares in the surviving company, making
the surviving company a wholly-owned subsidiary of the Group.
b. Consideration for the acquisition and its breakdown
(In millions of yen)
Consideration Amount
Cash consideration for the acquisition 703,559
Stock options consideration for the acquisition 23,188
Total consideration for the acquisition A 726,747
Acquisition-related expenses for the business combination were 1,258 million yen, with 885 million yen recorded in “Selling, general and administrative expenses” for the year ended December 31, 2019.
c. Fair value of assets acquired, liabilities assumed and goodwill
(In millions of yen)
Date of acquisition (March 30, 2019)
Current assets
Cash and cash equivalents 26,326
Trade and other receivables (Note 2) 16,136
Inventories 18,808
Other 786
Total current assets 62,056
Non-current assets
Property, plant and equipment 19,775
Intangible assets 320,276
Other 11,852
Total non-current assets 351,903
Total assets 413,959
Current liabilities
Trade and other payables 5,121
Bonds and borrowings (Note 3) 65,262
Other 13,997
Total current liabilities 84,380
Non-current liabilities
Income tax payables 2,599
Deferred tax liabilities 33,853
Other 3,759
Total non-current liabilities 40,211
Total liabilities 124,591
Net assets B 289,368
Basis adjustments C 8,598
Goodwill (Note 4) A-B+C 445,976

23 Renesas Electronics’ Consolidated Financial Results for the Second Quarter Ended June 30, 2020
(Note) 1. Due to the finalization of the provisional accounting treatment on December 31, 2019 for a business combination, we have reflected the revision of allocation of the acquisition cost to financial results of the six months ended June 30, 2019 and three months ended June 30, 2019 and therefore, the financial statements have been revised retrospectively. As a result, the gross margin of the six and three months ended June 30, 2019 increased 2,054 million yen and operating loss and loss before tax increased 8,109 million yen respectively. 2. The total contract amount is same as the fair value, and there are no receivables that are expected to be unrecoverable. 3. The content of bonds and borrowings is bonds. 4. Goodwill reflects future excess earning power expected from future business development including IDT and synergies between the Company and IDT. No amount of goodwill is expected to be deductible for tax purposes.
d. Expenditure for the acquisition
(In millions of yen)
Item Amount
Consideration for acquisition in cash (703,559)
Cash and cash equivalents held by the acquiree at the time of obtaining control 26,326
Amount of cash paid for the acquisition of subsidiaries (677,233)
Basis adjustments (8,598)
Amount of cash paid for the acquisition of subsidiaries (net amount) (685,831)
e. Impact on profit of the period on the assumption that the date of the acquisition of IDT was at the beginning of the fiscal year Provisional pro forma information (unaudited information) on the assumption that the date of the acquisition of IDT was at the beginning of the prior fiscal year is as follows.
(In millions of yen)
The year ended
December 31, 2019
Revenue 745,184
Profit or loss (8,598)
The above information has not been audited. In addition, items such as the amortization of intangible assets on the assumption that the date of the acquisition of IDT was at the beginning of the prior fiscal year were added to the approximate amount of impact. The pro forma information is not necessarily indicative of events that may happen in the future.

24 Renesas Electronics’ Consolidated Financial Results for the Second Quarter Ended June 30, 2020
(Trade and Other Receivables) The components of trade and other receivables are as follows.
(In millions of yen)
As of December 31, 2019 As of June 30, 2020
Notes and trade receivables 81,473 72,034
Other receivables 3,081 4,646
Loss allowance (95) (102)
Total 84,459 76,578
(Note) Trade and other receivables are classified as financial assets measured at amortized cost.
(Trade and Other Payables) The components of trade and other payables are as follows.
(In millions of yen)
As of December 31, 2019 As of June 30, 2020
Trade payables 64,740 57,005
Other payables 16,974 49,985
Electronically recorded obligations
16,725 11,397
Refund liabilities 2,593 4,450
Total 101,032 122,837
Current liabilities 100,187 93,948
Non-current liabilities 845 28,889
(Note) Trade and other payables are classified as financial liabilities measured at amortized cost.
(Revenue)
All of the revenue arises from contracts with customers. In addition, disaggregation of revenue recognized from contracts with customers are stated in “Business segments, (2) Information on reportable segments and (4) Information on regions and countries”.
(Selling, General and Administrative Expenses)
The components of selling, general and administrative expenses are as follows. (Six months ended June 30, 2019 and June 30, 2020)
(In millions of yen)
Six months ended
June 30, 2019
Six months ended June 30, 2020
Research and development expenses (Note 1) 63,620 64,338
Personnel expenses 22,574 20,876
Depreciation and amortization (Note 2) 22,862 31,905
Retirement benefit expenses 1,700 1,218
Other 17,640 13,142
Total 128,396 131,479

25 Renesas Electronics’ Consolidated Financial Results for the Second Quarter Ended June 30, 2020
(Three months ended June 30, 2019 and June 30, 2020)
(In millions of yen)
Three months ended
June 30, 2019
Three months ended June 30, 2020
Research and development expenses (Note 1) 33,560 31,053
Personnel expenses 12,046 9,776
Depreciation and amortization (Note 2) 16,515 14,758
Retirement benefit expenses 916 664
Other 8,915 6,902
Total 71,952 63,153
(Note 1) As stated in“(Basis for Preparation) (4) Changes in Accounting Policy (Changes of the classification of expenses),”, research and development expenses for the six and three months ended June 30, 2019 disclosed as comparative information have been revised. (Note 2) As stated in “(Business Combinations)”, disclosed figures of depreciation and amortization of the six and three months ended June 30, 2019 as comparisons have been revised.

26 Renesas Electronics’ Consolidated Financial Results for the Second Quarter Ended June 30, 2020
(Other Income) The components of other income are as follows. (Six months ended June 30, 2019 and June 30, 2020)
(In millions of yen)
Six months ended
June 30, 2019
Six months ended June 30, 2020
Insurance claim income 21 2,313
Gain on sales of property, plant and equipment 514 489
Other 758 344
Total 1,293 3,146
(Three months ended June 30, 2019 and June 30, 2020)
(In millions of yen)
Three months ended
June 30, 2019
Three months ended June 30, 2020
Insurance claim income 9 2,313
Gain on sales of property, plant and equipment 209 19
Other 422 181
Total 640 2,513
(Other Expenses)
The components of other expenses are as follows. (Six months ended June 30, 2019 and June 30, 2020)
(In millions of yen)
Six months ended
June 30, 2019
Six months ended June 30, 2020
Business structure improvement expenses (Note) 10,762 1,245
Impairment loss 1,498 580
Other 1,387 678
Total 13,647 2,503
(Three months ended June 30, 2019 and June 30, 2020)
(In millions of yen)
Three months ended
June 30, 2019
Three months ended June 30, 2020
Business structure improvement expenses (Note) 10,317 293
Impairment loss 1,495 495
Other 881 421
Total 12,693 1,209
(Note) Business structure improvement expenses for the six and three months ended June 30, 2019 include Extra retirement payments and others incurred from Early Retirement Incentive program.

27 Renesas Electronics’ Consolidated Financial Results for the Second Quarter Ended June 30, 2020
(Subsequent Events) (Commitment Line Agreement) The Company has concluded the Commitment Line Agreement for the purpose of securing flexible means of procuring financing in order to meet funding requirements for future business developments and to secure working capital, as well as to improve the stability of the Company's financial base.
Counterparties of agreement MUFG Bank, Ltd., Mizuho Bank, Ltd., Sumitomo Mitsui Trust Bank, Limited., Resona Bank, Ltd.
Maximum loan amount 75 billion yen
Date of agreement July 13, 2020
Term of agreement Two years
Collateral and guarantee No collateral or guarantees
(Issuance of Stock Acquisition Rights as Stock options) The Company resolved at the Meeting of Board of Directors held on July 30, 2020 certain subscription items for stock acquisition rights to be issued as stock options for directors, corporate officers and employees of the Company and directors and employees of the subsidiaries. The Company has also determined items regarding taking applications or persons who will receive these stock options.
Fiscal year 2020 Stock options No.3 Fiscal year 2020 Stock options No.4
Date of resolution July 30, 2020
Date of allotment August 31, 2020
Category and number of grantees
Director of the Company 1 Corporate officers of the Company 4 Employees of the Company 918 Director of the subsidiaries 1 Employees of the subsidiaries 78
Corporate officers of the Company 4 Directors of the subsidiaries 5 Employees of the subsidiaries 1,548
Number of stock options 11,490 35,898
Type and number of shares
Common stock 1,149,000
Common stock 3,589,800
Exercise price yen per share
1
Exercise period From August 31, 2020 to August 30, 2030 (JST)
Issuance price by the issuance of shares upon the exercise of stock options
To be determined
Fiscal year 2020 Stock options No.5 Fiscal year 2020 Stock options No.6
Date of resolution July 30, 2020
Date of allotment August 31, 2020
Category and number of grantees
Employees of the Company 219 Employees of the subsidiaries 18
Employees of the subsidiaries 143
Number of stock options 4,444 2,214
Type and number of shares
Common stock 444,400
Common stock 221,400
Exercise price yen per share
1
Exercise period From September 1, 2020 to August 31, 2030 (JST)
Issuance price by the issuance of shares upon the exercise of stock options
To be determined

28 Renesas Electronics’ Consolidated Financial Results for the Second Quarter Ended June 30, 2020
Forward-Looking Statements
The statements in this press release with respect to the plans, strategies and financial outlook of Renesas Electronics
Corporation and its consolidated subsidiaries (collectively “we”) are forward-looking statements involving risks and
uncertainties. We caution you in advance that actual results may differ materially from such forward-looking statements
due to several important factors including, but not limited to, general economic conditions in our markets, which are
primarily Japan, North America, Asia, and Europe; demand for, and competitive pricing pressure on, products and
services in the marketplace; ability to continue to win acceptance of products and services in these highly competitive
markets; and fluctuations in currency exchange rates, particularly between the yen and the U.S. dollar. Among other
factors, downturn of the world economy; deteriorating financial conditions in world markets, or deterioration in domestic
and overseas stock markets, may cause actual results to differ from the projected results forecast.
About Renesas Electronics Corporation
Renesas Electronics Corporation (TSE: 6723) delivers trusted embedded design innovation with complete
semiconductor solutions that enable billions of connected, intelligent devices to enhance the way people work and
live—securely and safely. A global leader in microcontrollers, analog, power, and SoC products and integrated
platforms, Renesas provides the expertise, quality, and comprehensive solutions for a broad range of Automotive,
Industrial, Home Electronics, Office Automation and Information Communication Technology applications to help shape
a limitless future. Learn more at renesas.com.

![Announces Q1 results, Limited Review Report & Earnings Release for the Quarter ended June 30, 2015 [Result]](https://static.fdocuments.in/doc/165x107/577cb2f01a28aba7118c3021/announces-q1-results-limited-review-report-earnings-release-for-the-quarter.jpg)