Earnings Release Q1 2017 - Samsungimages.samsung.com/is/content/samsung/p5/sg/ir/docs/2017_1Q... ·...
8
Earnings Release Q1 2017 Samsung Electronics April 2017
Transcript of Earnings Release Q1 2017 - Samsungimages.samsung.com/is/content/samsung/p5/sg/ir/docs/2017_1Q... ·...

Disclaimer
Earnings Release Q1 2017
Samsung Electronics
April 2017
Disclaimer
The financial information in this document are consolidated earnings results based on K-IFRS.
This document is provided for the convenience of investors only, before the external audit on our Q1 2017 financial results is
completed. The audit outcomes may cause some parts of this document to change.
This document contains "forward-looking statements" - that is, statements related to future, not past, events. In this context,
"forward-looking statements" often address our expected future business and financial performance, and often contain words
such as "expects”, "anticipates”, "intends”, "plans”, "believes”, "seeks” or "will ". “Forward-looking statements" by their nature
address matters that are, to different degrees, uncertain. For us, particular uncertainties which could adversely or positively affect
our future results include:
· The behavior of financial markets including fluctuations in exchange rates, interest rates and commodity prices
· Strategic actions including dispositions and acquisitions
· Unanticipated dramatic developments in our major businesses including CE (Consumer Electronics),
IM (IT & Mobile communications), DS (Device Solutions)
· Numerous other matters at the national and international levels which could affect our future results
These uncertainties may cause our actual results to be materially different from those expressed in this document.
-------
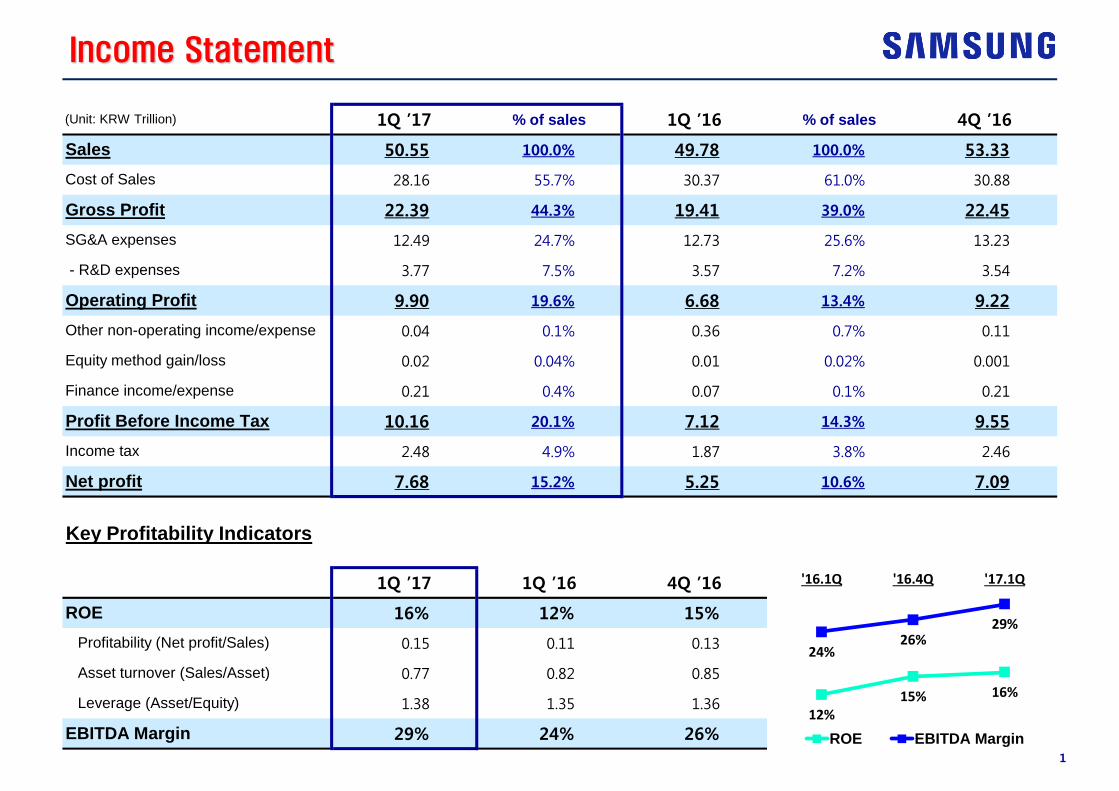
1Q ’17 % of sales 1Q ’16 % of sales 4Q ’16
50.55 100.0% 49.78 100.0% 53.33
28.16 55.7% 30.37 61.0% 30.88
22.39 44.3% 19.41 39.0% 22.45
12.49 24.7% 12.73 25.6% 13.23
3.77 7.5% 3.57 7.2% 3.54
9.90 19.6% 6.68 13.4% 9.22
0.04 0.1% 0.36 0.7% 0.11
0.02 0.04% 0.01 0.02% 0.001
0.21 0.4% 0.07 0.1% 0.21
10.16 20.1% 7.12 14.3% 9.55
2.48 4.9% 1.87 3.8% 2.46
7.68 15.2% 5.25 10.6% 7.09
Key Profitability Indicators
1Q ’17 1Q ’16 4Q ’16
16% 12% 15%
0.15 0.11 0.13
0.77 0.82 0.85
1.38 1.35 1.36
29% 24% 26%
1
(Unit: KRW Trillion)
Sales
Cost of Sales
Gross Profit
SG&A expenses
- R&D expenses
Operating Profit
Other non-operating income/expense
Equity method gain/loss
Finance income/expense
Profit Before Income Tax
Income tax
Net profit
ROE
Profitability (Net profit/Sales)
Asset turnover (Sales/Asset)
Leverage (Asset/Equity)
EBITDA Margin
16% 15% 12%
29% 26%
24%
'17.1Q '16.4Q '16.1Q
ROE EBITDA Margin
Income Statement
-------
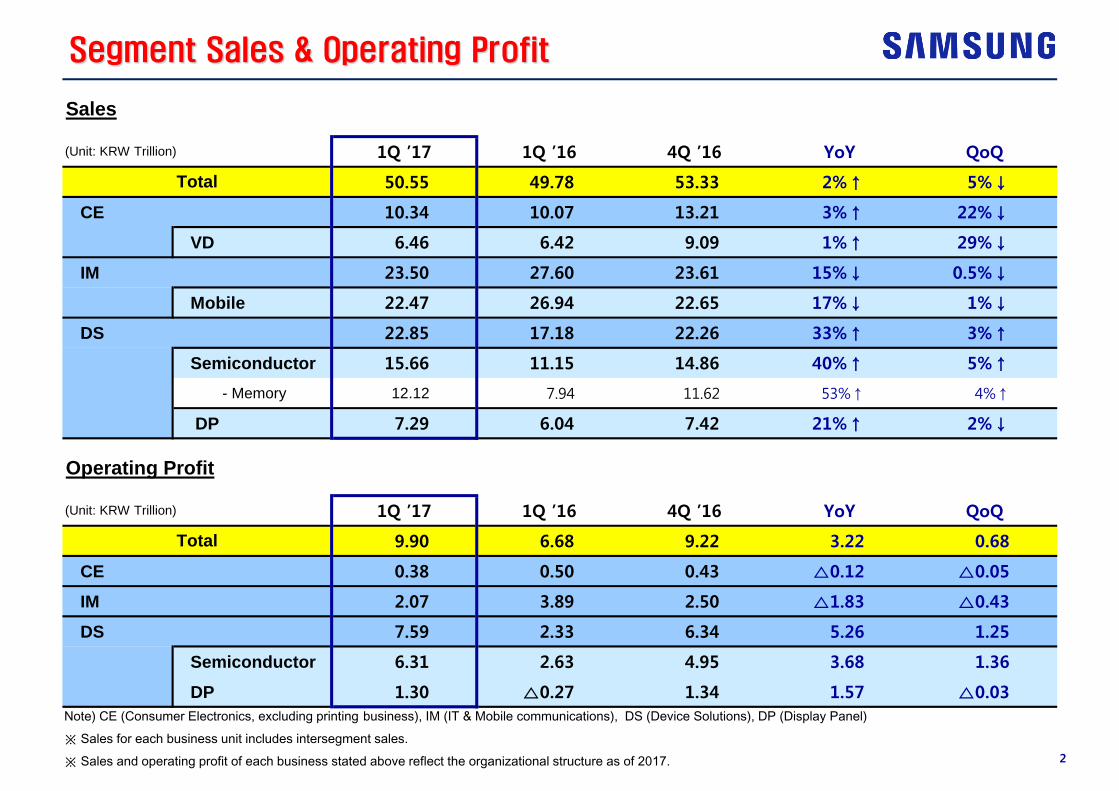
Sales
1Q ’17 1Q ’16 4Q ’16 YoY QoQ
50.55 49.78 53.33 2%↑ 5%↓
CE 10.34 10.07 13.21 3%↑ 22%↓
VD 6.46 6.42 9.09 1%↑ 29%↓
IM 23.50 27.60 23.61 15%↓ 0.5%↓
Mobile 22.47 26.94 22.65 17%↓ 1%↓
DS 22.85 17.18 22.26 33%↑ 3%↑
Semiconductor 15.66 11.15 14.86 40%↑ 5%↑
- Memory 12.12 7.94 11.62 53%↑ 4%↑
DP 7.29 6.04 7.42 21%↑ 2%↓
Operating Profit
1Q ’17 1Q ’16 4Q ’16 YoY QoQ
9.90 6.68 9.22 3.22 0.68
CE 0.38 0.50 0.43 △0.12 △0.05
IM 2.07 3.89 2.50 △1.83 △0.43
DS 7.59 2.33 6.34 5.26 1.25
Semiconductor 6.31 2.63 4.95 3.68 1.36
DP 1.30 △0.27 1.34 1.57 △0.03
2
Total
Total
(Unit: KRW Trillion)
(Unit: KRW Trillion)
Segment Sales & Operating Profit
Note) CE (Consumer Electronics, excluding printing business), IM (IT & Mobile communications), DS (Device Solutions), DP (Display Panel)
※ Sales for each business unit includes intersegment sales.
※ Sales and operating profit of each business stated above reflect the organizational structure as of 2017.
-------
3
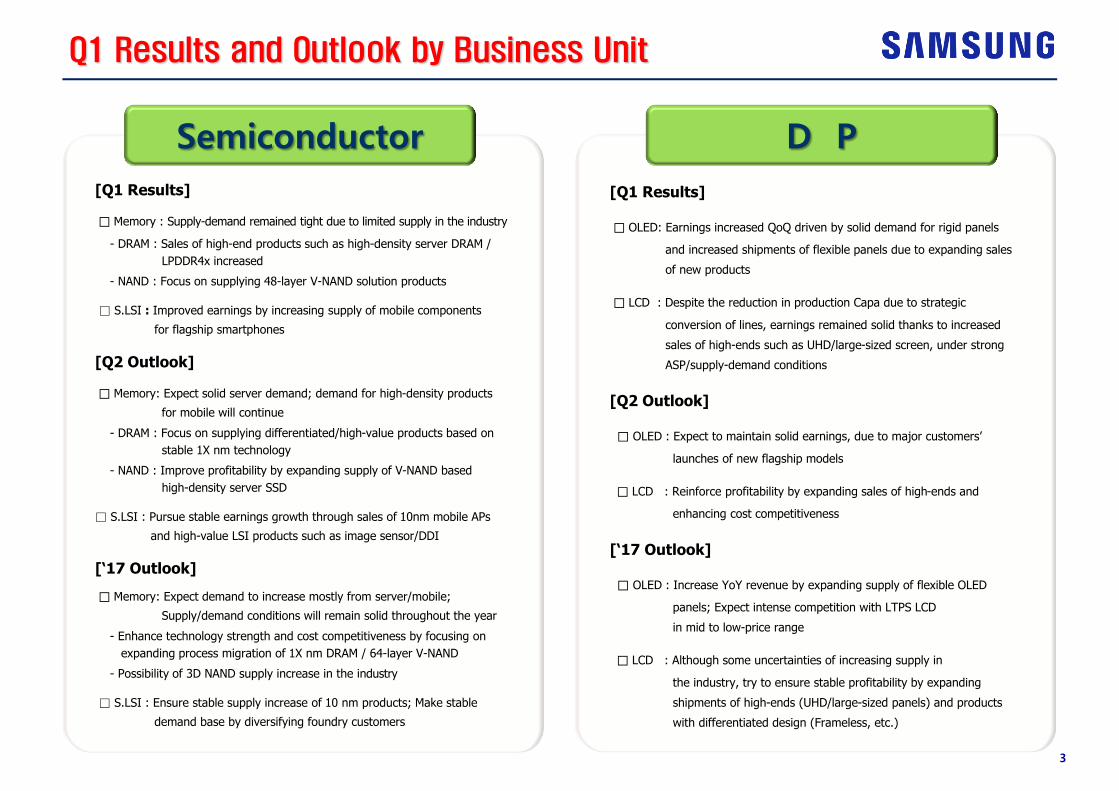
Q1 Results and Outlook by Business Unit
[Q1 Results]
□ OLED: Earnings increased QoQ driven by solid demand for rigid panels
and increased shipments of flexible panels due to expanding sales
of new products
□ LCD : Despite the reduction in production Capa due to strategic
conversion of lines, earnings remained solid thanks to increased
sales of high-ends such as UHD/large-sized screen, under strong
ASP/supply-demand conditions
[Q2 Outlook]
□ OLED : Expect to maintain solid earnings, due to major customers’
launches of new flagship models
□ LCD : Reinforce profitability by expanding sales of high-ends and
enhancing cost competitiveness
[‘17 Outlook]
□ OLED : Increase YoY revenue by expanding supply of flexible OLED
panels; Expect intense competition with LTPS LCD
in mid to low-price range
□ LCD : Although some uncertainties of increasing supply in
the industry, try to ensure stable profitability by expanding
shipments of high-ends (UHD/large-sized panels) and products
with differentiated design (Frameless, etc.)
[Q1 Results]
□ Memory : Supply-demand remained tight due to limited supply in the industry
- DRAM : Sales of high-end products such as high-density server DRAM /
LPDDR4x increased
- NAND : Focus on supplying 48-layer V-NAND solution products
□ S.LSI : Improved earnings by increasing supply of mobile components
for flagship smartphones
[Q2 Outlook]
□ Memory: Expect solid server demand; demand for high-density products
for mobile will continue
- DRAM : Focus on supplying differentiated/high-value products based on
stable 1X nm technology
- NAND : Improve profitability by expanding supply of V-NAND based
high-density server SSD
□ S.LSI : Pursue stable earnings growth through sales of 10nm mobile APs
and high-value LSI products such as image sensor/DDI
[‘17 Outlook]
□ Memory: Expect demand to increase mostly from server/mobile;
Supply/demand conditions will remain solid throughout the year
- Enhance technology strength and cost competitiveness by focusing on
expanding process migration of 1X nm DRAM / 64-layer V-NAND
- Possibility of 3D NAND supply increase in the industry
□ S.LSI : Ensure stable supply increase of 10 nm products; Make stable
demand base by diversifying foundry customers
Semiconductor D P
-------
4
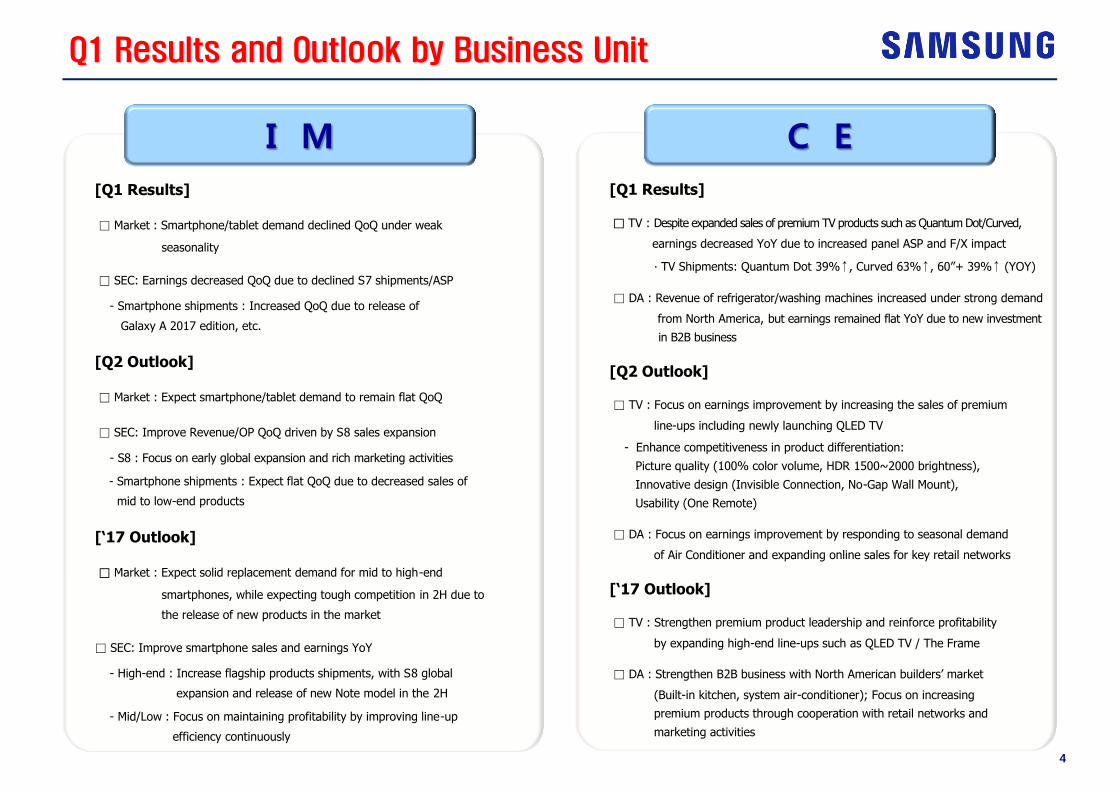
Q1 Results and Outlook by Business Unit
[Q1 Results]
□ Market : Smartphone/tablet demand declined QoQ under weak
seasonality
□ SEC: Earnings decreased QoQ due to declined S7 shipments/ASP
- Smartphone shipments : Increased QoQ due to release of
Galaxy A 2017 edition, etc.
[Q2 Outlook]
□ Market : Expect smartphone/tablet demand to remain flat QoQ
□ SEC: Improve Revenue/OP QoQ driven by S8 sales expansion
- S8 : Focus on early global expansion and rich marketing activities
- Smartphone shipments : Expect flat QoQ due to decreased sales of
mid to low-end products
[‘17 Outlook]
□ Market : Expect solid replacement demand for mid to high-end
smartphones, while expecting tough competition in 2H due to
the release of new products in the market
□ SEC: Improve smartphone sales and earnings YoY
- High-end : Increase flagship products shipments, with S8 global
expansion and release of new Note model in the 2H
- Mid/Low : Focus on maintaining profitability by improving line-up
efficiency continuously
[Q1 Results]
□ TV : Despite expanded sales of premium TV products such as Quantum Dot/Curved,
earnings decreased YoY due to increased panel ASP and F/X impact
∙ TV Shipments: Quantum Dot 39%↑, Curved 63%↑, 60”+ 39%↑ (YOY)
□ DA : Revenue of refrigerator/washing machines increased under strong demand
from North America, but earnings remained flat YoY due to new investment
in B2B business
[Q2 Outlook]
□ TV : Focus on earnings improvement by increasing the sales of premium
line-ups including newly launching QLED TV
- Enhance competitiveness in product differentiation:
Picture quality (100% color volume, HDR 1500~2000 brightness),
Innovative design (Invisible Connection, No-Gap Wall Mount),
Usability (One Remote)
□ DA : Focus on earnings improvement by responding to seasonal demand
of Air Conditioner and expanding online sales for key retail networks
[‘17 Outlook]
□ TV : Strengthen premium product leadership and reinforce profitability
by expanding high-end line-ups such as QLED TV / The Frame
□ DA : Strengthen B2B business with North American builders’ market
(Built-in kitchen, system air-conditioner); Focus on increasing
premium products through cooperation with retail networks and
marketing activities
I M C E
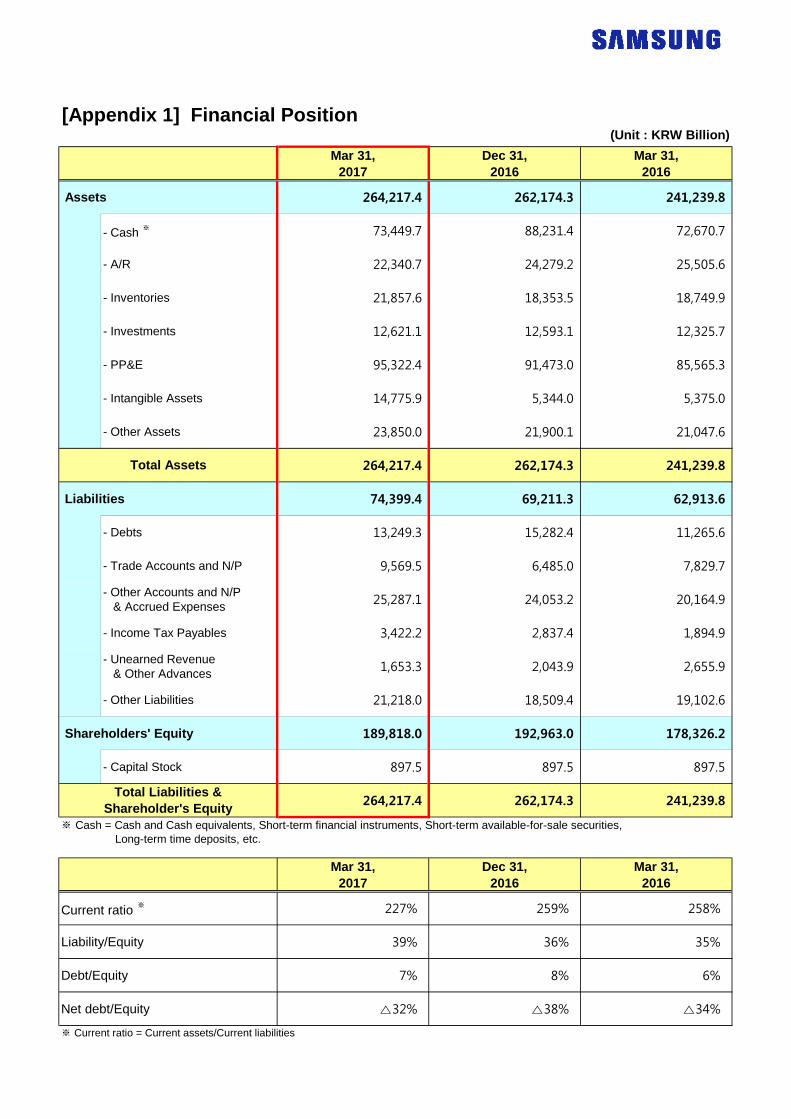
[Appendix 1] Financial Position(Unit : KRW Billion)
Mar 31,2017
Dec 31,2016
Mar 31,2016
Assets 264,217.4 262,174.3 241,239.8
- Cash ※ 73,449.7 88,231.4 72,670.7
- A/R 22,340.7 24,279.2 25,505.6
- Inventories 21,857.6 18,353.5 18,749.9
- Investments 12,621.1 12,593.1 12,325.7
- PP&E 95,322.4 91,473.0 85,565.3
- Intangible Assets 14,775.9 5,344.0 5,375.0
- Other Assets 23,850.0 21,900.1 21,047.6
264,217.4 262,174.3 241,239.8
Liabilities 74,399.4 69,211.3 62,913.6
- Debts 13,249.3 15,282.4 11,265.6
- Trade Accounts and N/P 9,569.5 6,485.0 7,829.7
- Other Accounts and N/P & Accrued Expenses 25,287.1 24,053.2 20,164.9
- Income Tax Payables 3,422.2 2,837.4 1,894.9
- Unearned Revenue & Other Advances 1,653.3 2,043.9 2,655.9
- Other Liabilities 21,218.0 18,509.4 19,102.6
Shareholders' Equity 189,818.0 192,963.0 178,326.2
- Capital Stock 897.5 897.5 897.5
264,217.4 262,174.3 241,239.8
Mar 31,2017
Dec 31,2016
Mar 31,2016
Current ratio ※ 227% 259% 258%
Liability/Equity 39% 36% 35%
Debt/Equity 7% 8% 6%
Net debt/Equity △32% △38% △34%
※ Current ratio = Current assets/Current liabilities
Total Liabilities &Shareholder's Equity
※ Cash = Cash and Cash equivalents, Short-term financial instruments, Short-term available-for-sale securities, Long-term time deposits, etc.
Total Assets
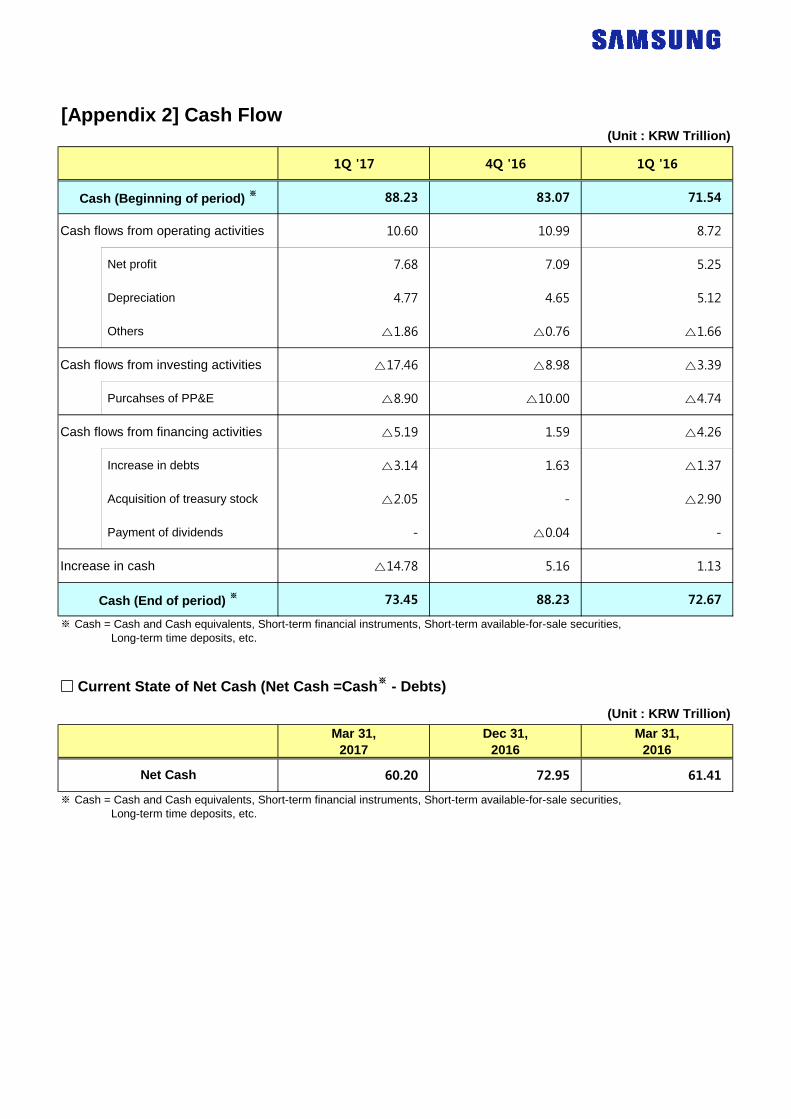
[Appendix 2] Cash Flow(Unit : KRW Trillion)
1Q '17 4Q '16 1Q '16
88.23 83.07 71.54
Cash flows from operating activities 10.60 10.99 8.72
Net profit 7.68 7.09 5.25
Depreciation 4.77 4.65 5.12
Others △1.86 △0.76 △1.66
Cash flows from investing activities △17.46 △8.98 △3.39
Purcahses of PP&E △8.90 △10.00 △4.74
Cash flows from financing activities △5.19 1.59 △4.26
Increase in debts △3.14 1.63 △1.37
Acquisition of treasury stock △2.05 - △2.90
Payment of dividends - △0.04 -
Increase in cash △14.78 5.16 1.13
73.45 88.23 72.67
□ Current State of Net Cash (Net Cash =Cash※ - Debts)
(Unit : KRW Trillion)
Mar 31,2017
Dec 31,2016
Mar 31,2016
60.20 72.95 61.41
※ Cash = Cash and Cash equivalents, Short-term financial instruments, Short-term available-for-sale securities, Long-term time deposits, etc.
Net Cash
※ Cash = Cash and Cash equivalents, Short-term financial instruments, Short-term available-for-sale securities, Long-term time deposits, etc.
Cash (End of period) ※
Cash (Beginning of period) ※