Earnings Release Cresud IQ12 - cresud.com.ar · of of a fraction of 9,784 hectares of its "Jatobá"...
19
Earnings Release IQ FY 2019
Transcript of Earnings Release Cresud IQ12 - cresud.com.ar · of of a fraction of 9,784 hectares of its "Jatobá"...

Earnings Release
IQ FY 2019

1
CRESUD invites you to participate in its first quarter of the Fiscal Year 2019 conference call
Tuesday, November 13, 2018, at 08:00 a.m.
(Eastern Time)
The call will be hosted by:
Alejandro Elsztain, CEO
Carlos Blousson, Gen Mgr of Argentina & Bolivia
Matías Gaivironsky, CFO
If you would like to participate, please call:
1-412-317-6377 (International) or
1-844-686-3840 (Toll Free USA)
ID#CRESUD
In addition, you can access through the following webcast:
http://webcastlite.mziq.com/cover.html?webcastId=e33d358d-a06c-4ef5-b547-dd8dfdecedbc
Preferably, 10 minutes before the call is due to begin.
The conference will be held in English.
PLAYBACK
Available until November 22, 2018
1-877-344-7529
1-412-317-0088
Access Code: 10125885
Contact Information Tel: +54 11 4323 7449
Alejandro Elsztain – CEO E-mail: [email protected]
Matías Gaivironsky – CFO Website: http://www.cresud.com.ar

2
The net result of the first quarter of fiscal year 2019 recorded a gain of ARS 7,439 million compared to a
gain of ARS 28 million in the same period of the FY 2018, mainly driven by higher results due to changes
in the fair value of investment properties in Argentina’s Business Center and a higher market valuation
of the investment in CLAL, in the Israel Business Center, both effects from our subsidiary IRSA.
Adjusted EBITDA for the period reached ARS 4,486 million, of which ARS 1,666 million come from the
agricultural business due to higher production results, grain holdings and farmland sales, and ARS 2,592
million from the urban property and investment business (IRSA).
Very good weather conditions in the region are expected for 2019 campaign. We hope to plant
approximately 257,000 ha and to develop 8,500 ha in the region.
Our subsidiary Brasilagro has completed a partial sale of 9,784 hectares of its Jatobá farm(Jaborandi -
Bahía), for an amount of BRL 177.8 million.
The Adjusted EBITDA of the urban rental segments in Argentina (IRSA) grew by 31.3% in the compared
period.
On October 29, our Shareholders Meeting approved a distribution among its shareholders of
20,656,215 treasury shares, representative of 4.1% of the share capital.
On November 8, we issued a bond in the local market for the sum of USD 73.6 million at a fixed annual
interest rate of 9% due 2020. The funds will be used to refinance short-term debt.
IQ FY19 Main Highlights
3
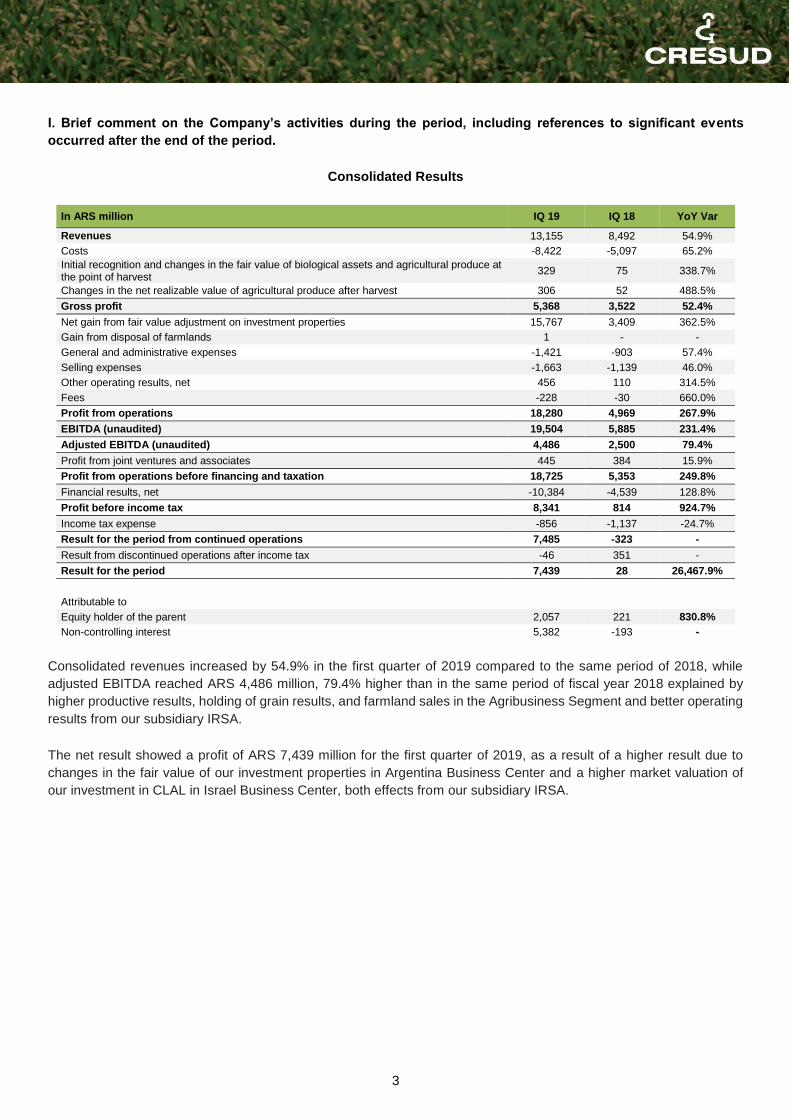
I. Brief comment on the Company’s activities during the period, including references to significant events
occurred after the end of the period.
Consolidated Results
In ARS million IQ 19 IQ 18 YoY Var
Revenues 13,155 8,492 54.9%
Costs -8,422 -5,097 65.2%
Initial recognition and changes in the fair value of biological assets and agricultural produce at the point of harvest
329 75 338.7%
Changes in the net realizable value of agricultural produce after harvest 306 52 488.5%
Gross profit 5,368 3,522 52.4%
Net gain from fair value adjustment on investment properties 15,767 3,409 362.5%
Gain from disposal of farmlands 1 - -
General and administrative expenses -1,421 -903 57.4%
Selling expenses -1,663 -1,139 46.0%
Other operating results, net 456 110 314.5%
Fees -228 -30 660.0%
Profit from operations 18,280 4,969 267.9%
EBITDA (unaudited) 19,504 5,885 231.4%
Adjusted EBITDA (unaudited) 4,486 2,500 79.4%
Profit from joint ventures and associates 445 384 15.9%
Profit from operations before financing and taxation 18,725 5,353 249.8%
Financial results, net -10,384 -4,539 128.8%
Profit before income tax 8,341 814 924.7%
Income tax expense -856 -1,137 -24.7%
Result for the period from continued operations 7,485 -323 -
Result from discontinued operations after income tax -46 351 -
Result for the period 7,439 28 26,467.9%
Attributable to
Equity holder of the parent 2,057 221 830.8%
Non-controlling interest 5,382 -193 -
Consolidated revenues increased by 54.9% in the first quarter of 2019 compared to the same period of 2018, while
adjusted EBITDA reached ARS 4,486 million, 79.4% higher than in the same period of fiscal year 2018 explained by
higher productive results, holding of grain results, and farmland sales in the Agribusiness Segment and better operating
results from our subsidiary IRSA.
The net result showed a profit of ARS 7,439 million for the first quarter of 2019, as a result of a higher result due to
changes in the fair value of our investment properties in Argentina Business Center and a higher market valuation of
our investment in CLAL in Israel Business Center, both effects from our subsidiary IRSA.
4
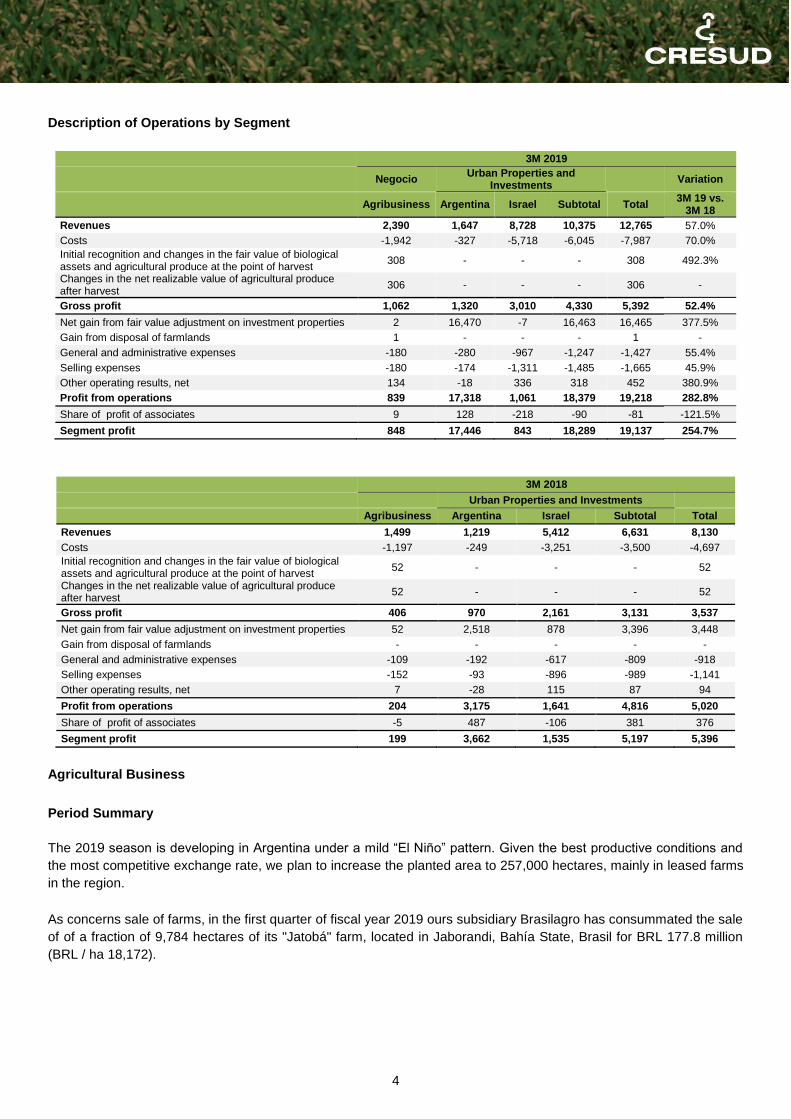
Description of Operations by Segment
3M 2019
Negocio Urban Properties and
Investments Variation
Agribusiness Argentina Israel Subtotal Total 3M 19 vs.
3M 18
Revenues 2,390 1,647 8,728 10,375 12,765 57.0%
Costs -1,942 -327 -5,718 -6,045 -7,987 70.0%
Initial recognition and changes in the fair value of biological assets and agricultural produce at the point of harvest
308 - - - 308 492.3%
Changes in the net realizable value of agricultural produce after harvest
306 - - - 306 -
Gross profit 1,062 1,320 3,010 4,330 5,392 52.4%
Net gain from fair value adjustment on investment properties 2 16,470 -7 16,463 16,465 377.5%
Gain from disposal of farmlands 1 - - - 1 -
General and administrative expenses -180 -280 -967 -1,247 -1,427 55.4%
Selling expenses -180 -174 -1,311 -1,485 -1,665 45.9%
Other operating results, net 134 -18 336 318 452 380.9%
Profit from operations 839 17,318 1,061 18,379 19,218 282.8%
Share of profit of associates 9 128 -218 -90 -81 -121.5%
Segment profit 848 17,446 843 18,289 19,137 254.7%
3M 2018
Urban Properties and Investments
Agribusiness Argentina Israel Subtotal Total
Revenues 1,499 1,219 5,412 6,631 8,130
Costs -1,197 -249 -3,251 -3,500 -4,697
Initial recognition and changes in the fair value of biological assets and agricultural produce at the point of harvest
52 - - - 52
Changes in the net realizable value of agricultural produce after harvest
52 - - - 52
Gross profit 406 970 2,161 3,131 3,537
Net gain from fair value adjustment on investment properties 52 2,518 878 3,396 3,448
Gain from disposal of farmlands - - - - -
General and administrative expenses -109 -192 -617 -809 -918
Selling expenses -152 -93 -896 -989 -1,141
Other operating results, net 7 -28 115 87 94
Profit from operations 204 3,175 1,641 4,816 5,020
Share of profit of associates -5 487 -106 381 376
Segment profit 199 3,662 1,535 5,197 5,396
Agricultural Business
Period Summary
The 2019 season is developing in Argentina under a mild “El Niño” pattern. Given the best productive conditions and
the most competitive exchange rate, we plan to increase the planted area to 257,000 hectares, mainly in leased farms
in the region.
As concerns sale of farms, in the first quarter of fiscal year 2019 ours subsidiary Brasilagro has consummated the sale
of of a fraction of 9,784 hectares of its "Jatobá" farm, located in Jaborandi, Bahía State, Brasil for BRL 177.8 million
(BRL / ha 18,172).

5
Our Portfolio
Our portfolio under management is composed of 732,825 hectares, of which 287,464 are in operation and 445,361 are
land reserves distributed among the four countries in the region where we operate: Argentina, with a mixed model
combining land development and agricultural production; Bolivia, with a productive model in Santa Cruz de la Sierra;
and through our subsidiary BrasilAgro, Brazil and Paraguay, where the strategy is exclusively focused on the
development of lands.
Breakdown of Hectares
Own and under Concession (*) (**) (***)
Productive Lands Land Reserves
Agricultural Cattle
Under Development
Reserved Total
Argentina 59,894 150,328 2,060 323,906 536,189
Brazil 42,814 14,912 4,442 66,716 128,884
Bolivia 8,858 - - 1,017 9,875
Paraguay 7,799 2,859 1,977 45,243 57,878
Total 119,365 168,099 8,479 436,883 732,825 (*) Includes Brazil, Paraguay, Agro-Uranga S.A. at 35.723% and 132,000 hectares under Concession. (**) Includes 85,000 hectares intended for sheep breeding (***) Excludes double crops.
Leased (*)
Agricultural Cattle Other Total
Argentina 67,692(*) 14,135 2,201 84,028
Brazil 48,997 - 1,334 50,331
Bolivia 1,020 - - 1,020
Total 117,708 14,135 3,535 135,378 (*) Excludes double crops.
Segment Income – Agricultural Business
I) Land Development, Transformation and Sales
We periodically sell properties that have reached a considerable appraisal to reinvest in new farms with higher
appreciation potential. We analyze the possibility of selling based on a number of factors, including the expected future
yield of the farmland for continued agricultural and livestock exploitation, the availability of other investment opportunities
and cyclical factors that have a bearing on the global values of farmlands.
During the first quarter of fiscal year 2019 Brasilagro completed a successful sale of a fraction of 9,784 hectares of its
"Jatobá" farm, located in Jaborandi, Bahía State, Brasil for BRL 177.8 million (BRL / ha 18.172). The farm was valued
in books at BRL 18.0 million and the internal rate of return in dollars reached 7.05%.
in ARS million IQ 19 IQ 18 YoY Var
Revenues - - -
Costs -3 -4 -25.0%
Gross loss -3 -4 -25.0%
Net gain from fair value adjustment on investment properties 2 52 -96.2%
Gain from disposal of farmlands 1 - -
Profit from operations - 48 -
Segment profit - 48 -
EBITDA 1 49 -98.0%
Adjusted EBITDA 748 -3 -

6
During the quarter, Brasilagro completed the partial sale of Jatobá farm, as previously mentioned. This farm was
considered as investment property in IQ18 since it was leased to third parties, reflecting a gain from changes in the fair
value of ARS 52 million. The sale of the farm made in IQ19 had no impact on results since it has already been recognized
at fair value in IQ18. Adjusted EBITDA, which excludes changes in fair value of investment properties and includes the
fair value realized from the sale, reflects that result and reaches ARS 748 million.
Area under Development (hectares) Projected for 2018/2019 Developed in 2017/2018
Argentina 2,060 2,486
Brasil 4,442 6,190
Paraguay 1,977 2,008
Total 8,479 10,684
During this campaign we expect to transform 8,479 in the region: 2,060 hectares in Argentina, 1,977 hectares in Paraguay and 4,442 hectares in Brazil,
II) Agricultural Production
The result of the Farming segment increased by ARS 541 million, from ARS 160 million gain during the first quarter of
2018 to ARS 701 million gain during the same period of 2019.
in ARS million IQ 19 IQ 18 YoY Var
Revenues 1,380 924 49,4%
Costs -1,206 -684 76,3%
Initial recognition and changes in the fair value of biological assets and agricultural produce at the point of harvest
305 52 486,5%
Changes in the net realizable value of agricultural produce after harvest 306 52 488,5%
Gross gain 785 344 128,2%
General and administrative expenses -118 -72 63,9%
Selling expenses -104 -115 -9,6%
Other operating results, net 132 5 2,540,0%
Profit from operations 695 162 329,0%
Profit from associates 6 -2 -
Segment profit 701 160 338,1%
EBITDA 771 212 263,7%
Adjusted EBITDA 771 212 263,7%
II,a) Crops and Sugarcane
Crops
In ARS Million IQ 19 IQ 18 YoY Var
Revenues 727 459 58.4%
Costs -627 -331 89.4%
Initial recognition and changes in the fair value of biological assets and agricultural produce
at the point of harvest 52 1 5,100.0%
Changes in the net realizable value of agricultural produce after harvest 306 52 488.5%
Gross profit / (loss) 458 181 153.0%
General and administrative expenses -59 -39 51.3%
Selling expenses -91 -107 -15.0%
Other operating results, net 133 7 1,800.0%
Profit from operations 441 42 950.0%
Share of loss of associates 6 -2 -
Segment income 447 40 1,017.5%

7
Sugarcane
In ARS Million IQ 19 IQ 18 YoY Var
Revenues 564 373 51.2%
Costs -510 -292 74.7%
Initial recognition and changes in the fair value of biological assets and agricultural produce
at the point of harvest 207 59 250.8%
Gross profit 261 140 86.4%
General and administrative expenses -36 -19 89.5%
Selling expenses -4 -1 300.0%
Other operating results, net - -1 -
Profit from operations 221 119 85.7%
Profit from the segment 221 119 85.7%
Operations
Production Volume1) 3M19 3M18 3M17 3M16 3M15
Corn 103,688 240,927 223,377 165,041 211,212
Soybean -686 4,842 - 256 837
Wheat 77 208 - 58 -
Sorghum 1,048 606 298 298 1,335
Sunflower -0 - - - 208
Others 1,790 718 816 2,959 1,718
Total Crops (tons) 105,917 247,301 224,491 168,612 215,310
Sugarcane (tons) 957,663 907,075 441,851 556,485 415,760
(1) Includes Brasilagro, Acres del Sud, Ombú, Yatay and Yuchán, Excludes Agro-Uranga,
Volume of 3M19 3M18 3M17 3M16 3M15
Sales (1) D,M, F,M, Total D,M, F,M, Total D,M, F,M, Total D,M, F,M, Total D,M, F,M, Total
Corn 65.3 - 65.3 134.4 - 134.4 121.8 - 121.8 62.6 23.6 86.2 150.9 - 150.9
Soybean 14.3 29.2 43.5 21.1 5.8 26.9 29.8 - 29.8 41.3 8.6 49.9 36.7 14.2 50.9
Wheat 4.4 - 4.4 6.4 - 6.4 0.4 0.1 0.5 5.1 28.9 34.0 0.2 - 0.2
Sorghum - - - - - - 0.1 - 0.1 0.1 - 0.1 0.3 - 0.3
Sunflower 2.0 - 2.0 0.4 - 0.4 0.7 - 0.7 0.6 - 0.6 1.7 - 1.7
Others - - - 0.6 - 0.6 1.5 - 1.5 1.1 - 1.1 - - -
Total Crops (thousands of tons)
86.0 29.2 115 162.9 5.8 168.7 154.3 0.1 154.4 110.8 61.1 171.9 189.8 14.2 204.0
Sugarcane (thousands of tons)
890.9 - 890.9 895.1 - 895.1 441.9 - 441.9 554.0 - 554.0 415.8 - 415.8
D,M,: Domestic market F,M,: Foreign market (1) Includes Brasilagro, CRESCA at 50%, Acres del Sud, Ombú, Yatay and Yuchán, Excludes Agro-Uranga,
The result of the Grains activity increased ARS 407 million, from ARS 40 million gain during the first quarter of 2018 to
ARS 447 million gain during the same quarter of 2019, mainly as a result of:
A positive variation in the holding result of ARS 253,3 million originated in Argentina, as a result of the increase in
prices in argentine pesos as a result of the devaluation that occurred between August and September, while in the
past fiscal year the exchange rate remained more stable.
A positive variation from the result of commodity derivatives, net from income from sales, of ARS 113.5 million
from:
Higher operated volumes in soybean and corn derivatives, as well as the impact of the exchange rate
depreciation in Argentina.
Higher operated volume in soybean derivatives in Brazil.
The result of the Sugarcane activity increased by ARS 102 million, going from a gain of ARS 119 million in the first
quarter of FY 2018 to a gain of ARS 221 million in the same period of FY 2019. This is mainly due to higher production
results from Brazil as a result of better yields and less costs per hectare, as well as better prices and a positive variation
of the exchange rate between Brazilian real and Argentine peso.

8
Area in Operation - Crops (hectares) (1) As of
09/30/18 As of
09/30/17 YoY Var
Own farms 97,268 115,450 -15.7%
Leased farms 137,868 66,582 107.1%
Farms under concession 21,801 23,636 -7.8%
Own farms leased to third parties 14,128 7,772 81.8%
Total Area Assigned to Crop Production 271,066 213,440 27.0%
(1) IIncludes AgroUranga, Brazil and Paraguay,
The area in operation assigned to the crops activity increased by 27% as compared to the same period of the previous
fiscal year, mainly due to the larger area of leased farms and own farms leased to third parties,
II,b) Cattle Production
During the past season, we started raising cattle in Brazil, in addition to our cattle operations in Argentina and Paraguay,
Production Volume (1) 3M19 3M18 3M17 3M16 3M15
Cattle herd (tons) 2,338 2,010 1,918 1,546 1,151
Milking cows (tons) - 133 174 135 119
Cattle (tons) 2,338 2,143 2,093 1,681 1,270
Milk (thousands of liters) - 2,693 4,078 4,539 4,560
(1) Includes Carnes Pampeanas and CRESCA at 50%,
Volume of 3M19 3M18 3M17 3M16 3M15
Sales (1) D,M, F,M, Total D,M, F,M, Total D,M, F,M, Total D,M, F,M, Total D,M, F,M, Total
Cattle herd 1.7 - 1.7 2.3 - 2.3 2.1 - 2.1 3.1 - 3.1 4.0 - 4.0
Milking cows - - - 0.1 - 0.1 0.2 - 0.2 0.2 - 0.2 0.1 - 0.1
Cattle (thousands of tons)
1.7 - 1.7 2.4 - 2.4 2.3 - 2.3 3.3 - 3.3 4.1 - 4.1
Milk (millions of liters)
- - - 2.7 - 2.7 3.9 - 3.9 4.4 - 4.4 4.4 - 4.4
D,M,: Domestic market
F,M,: Foreign market
(1) Includes Carnes Pampeanas and CRESCA at 50%,
Cattle
In ARS Million IQ 19 IQ 18(1) YoY Var
Revenues 70 72 32.1%
Costs -59 -61 34.1%
Initial recognition and changes in the fair value of biological assets and agricultural produce 46 -8 -
Gross profit 57 3 1,800.0%
General and administrative expenses -13 -11 18.2%
Selling expenses -8 -7 14.3%
Other operating results, net -1 -1 -
Profit / (Loss) from operations 35 -16 -
Profit / (Loss) from the segment 35 -16 -
(1) Includes Dairy, discontinued on December 2017.
Area in operation – Cattle (hectares) (1) As of 09/30/18
As of 09/30/17
YoY Var
Own farms 79,071 86,749 -8,9%
Leased farms 14,135 12,635 11,9%
Farms under concession 2,703 1,404 92,5%
Own farms leased to third parties 1,325 70 1,792,9%
Total Area Assigned to Cattle Production 97,234 100,858 -3,6%
(1) Includes AgroUranga, Brazil and Paraguay,

9
Stock of Cattle Heard As of 09/30/18 As of 09/30/17 YoY Var
Breeding stock 84,183 74,964 12%
Winter grazing stock 9,116 7,440 23%
Milk farm stock 2 3,470 -100%
Total Stock (heads) 93,301 85,874 9%
The result of the Cattle activity increased by ARS 54 million: from a profit of ARS 3 million in the first quarter of fiscal
year 2018 to a gain of ARS 57 million in the first quarter of 2019, as a result of the increase in the holding result driven
by the increase in cattle prices.
II,c) Agricultural Rental and Services
in ARS million IQ 19 IQ 18 YoY Var
Revenues 19 20 -5,0%
Costs -10 - -
Gross profit 9 20 -55,0%
General and Administrative expenses -10 -3 233,3%
Selling expenses -1 - -
(Loss) / Profit from operations -2 17 -
(Loss) / Profit form the segment -2 17 -
The result of the activity decreased by ARS 19 million, going from a profit of ARS 17 million in the first quarter of FY
2018 to a loss of ARS 2 million in the first quarter of FY 2019.
III) Other Segments
We include within "Others" the results coming from our Agroindustrial activity, developed in our refrigeration plant in La
Pampa and our investment in FyO,
The result of the “Others” segment increased by ARS 169 million, going from a gain of ARS 8 million for the first quarter
fiscal year 2018 to a gain of ARS 177 million for the same period of 2019. This is due to a profit of ARS 122 million from
FyO due to higher consignment operations and a profit of ARS 47 million from the meatpacking plant that has reversed
its operating losses as a result of the positive impact on its sales, both in the internal and external market, of the
exchange rate depreciation in Argentina together with the increase of the volume slaughtered.
In ARS million IQ 19 IQ 18 YoY Var
Revenues 1,010 575 75,7%
Costs -733 -509 44,0%
Initial recognition and changes in the fair value of biological assets and agricultural produce at the point of harvest
3 - -
Gross profit 280 66 324,2%
General and administrative expenses -32 -20 60,0%
Selling expenses -76 -37 105,4%
Other operating results, net 2 2 -
Profit from operations 174 11 1,481,8%
Profit from associates 3 -3 -
Segment profit 177 8 2,112,5%
EBITDA 177 12 1,375,0%
Adjusted EBITDA 177 12 1,375,0%
10
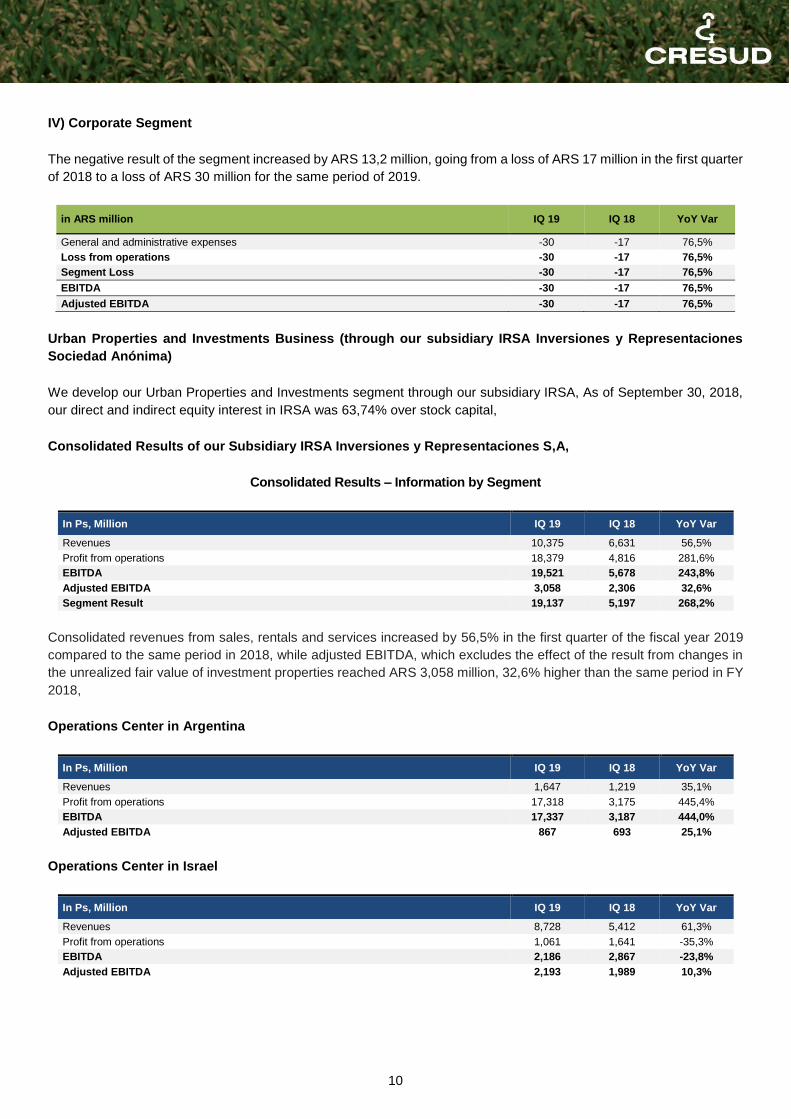
IV) Corporate Segment
The negative result of the segment increased by ARS 13,2 million, going from a loss of ARS 17 million in the first quarter
of 2018 to a loss of ARS 30 million for the same period of 2019.
in ARS million IQ 19 IQ 18 YoY Var
General and administrative expenses -30 -17 76,5%
Loss from operations -30 -17 76,5%
Segment Loss -30 -17 76,5%
EBITDA -30 -17 76,5%
Adjusted EBITDA -30 -17 76,5%
Urban Properties and Investments Business (through our subsidiary IRSA Inversiones y Representaciones
Sociedad Anónima)
We develop our Urban Properties and Investments segment through our subsidiary IRSA, As of September 30, 2018,
our direct and indirect equity interest in IRSA was 63,74% over stock capital,
Consolidated Results of our Subsidiary IRSA Inversiones y Representaciones S,A,
Consolidated Results – Information by Segment
In Ps, Million IQ 19 IQ 18 YoY Var
Revenues 10,375 6,631 56,5%
Profit from operations 18,379 4,816 281,6%
EBITDA 19,521 5,678 243,8%
Adjusted EBITDA 3,058 2,306 32,6%
Segment Result 19,137 5,197 268,2%
Consolidated revenues from sales, rentals and services increased by 56,5% in the first quarter of the fiscal year 2019
compared to the same period in 2018, while adjusted EBITDA, which excludes the effect of the result from changes in
the unrealized fair value of investment properties reached ARS 3,058 million, 32,6% higher than the same period in FY
2018,
Operations Center in Argentina
In Ps, Million IQ 19 IQ 18 YoY Var
Revenues 1,647 1,219 35,1%
Profit from operations 17,318 3,175 445,4%
EBITDA 17,337 3,187 444,0%
Adjusted EBITDA 867 693 25,1%
Operations Center in Israel
In Ps, Million IQ 19 IQ 18 YoY Var
Revenues 8,728 5,412 61,3%
Profit from operations 1,061 1,641 -35,3%
EBITDA 2,186 2,867 -23,8%
Adjusted EBITDA 2,193 1,989 10,3%

11
Financial Indebtedness and Other
The following tables contain a breakdown of company’s indebtedness:
Agricultural Business
Description Currency Amount (2) Interest Rate Maturity
Bank overdrafts ARS 13,3 Variable < 30 days
Cresud 2018 NCN, Series XVI (1) USD 38,5 1,500% 19-Nov-18
Cresud 2019 NCN, Series XVIII (1) USD 32,6 4,00% 12-Sep-19
Cresud 2019 NCN, Series XXII (1) USD 21,7 4,00% 1-Aug-19
Cresud 2023 NCN, Series XXIII USD 113,2 6,50% 16-Feb-23
Other debt (USD) - 174,8 - -
CRESUD’s Total Debt (3) 394,2
Cash and cash equivalents (3) 0,9
Total Net Debt 393,3
Brasilagro’s Total Net Debt 14,5
(1) Includes repurchases (2) Principal amount stated in USD (million) at an exchange rate of 41,25 ARS/USD, 6,96 BOB/USD and 4,05 BRL/USD, without considering accrued interest or elimination of balances with subsidiaries, (3) Does not include Carnes Pampeanas nor FyO
Urban Properties and Investments Business
Operations Center in Argentina
The following table describes our total debt as of September 30, 2018:
Description Currency Amount (1) Interest Rate Maturity
Bank overdrafts ARS 32,8 Floating < 360 days
IRSA 2020 Series II Non-Convertible Notes, USD 71,4 11,50% Jul-20
Series VII Non-Convertible Notes ARS 9,3 Badlar + 299 Sep-19
Series VIII Non-Convertible Notes USD 184,5 7,00% Sep-19
Other debt USD 41,2 - Feb-22
IRSA’s Total Debt 339,3
IRSA’s Cash + Cash Equivalents + Investments (2)
USD 1,7
IRSA’s Net Debt USD 337,6
Bank overdrafts ARS 0,3 - < 360 d
PAMSA loan USD 35,0 Fixed Feb-323
IRCP NCN Class IV USD 140,0 5,0% Sep-20
IRSA CP NCN Class II USD 360,0 8,75% Mar-23
IRSA CP’s Total Debt 535,3
Cash & Cash Equivalents + Investments (3 270,5
Consolidated Net Debt 264,8
(1) Principal amount in USD (million) at an exchange rate of Ps, 41,25 Ps,/USD, without considering accrued interest or eliminations of balances with subsidiaries, (2) “IRSA’s Cash & Cash Equivalents plus Investments” includes IRSA’s Cash & Cash Equivalents + IRSA’s Investments in current and non-current financial assets, (3) “IRSA CP’s Cash & Cash Equivalents plus Investments” includes IRSA CP’s Cash and cash equivalents + Investments in Current Financial Assets and our
holding in TGLT's convertible Notes,
Operations Center in Israel
Net Financial Debt (USD million)
Indebtedness(1) Total Net
IDBD’s Total Debt 966 643
DIC’s Total Debt 973 684
(1) Principal amount in USD (million) at an exchange rate of 3,6573 NIS/USD, without considering accrued interest or elimination of balances with subsidiaries, Includes bonds and loans,

12
Comparative Summary Consolidated Balance Sheet Data
In millions of Ps, Sep-18 Sep-17
Current assets 167,183 75,276
Non-current assets 346,932 175,034
Total assets 514,115 250,310
Current liabilities 96,703 50,263
Non-current liabilities 313,712 151,006
Total liabilities 410,415 201,269
Total capital and reserves attributable to the shareholders of the controlling company
27,225 16,600
Minority interests 76,475 32,441
Shareholders’ equity 103,700 49,041
Total liabilities plus minority interests plus shareholders’ equity 514,115 250,310
Comparative Summary Consolidated Statement of Income Data
In millions of Ps, Sep-18 Sep-17
Gross profit 5,368 3,522
Profit from operations 18,280 4,969
Share of profit / (loss) of associates and joint ventures 445 384
Profit from operations before financing and taxation 18,725 5,353
Financial results, net -10,384 -4,539
Profit before income tax 8,341 814
Income tax expense -856 -1,137
Profit of the period of continuous operations 7,485 -323
Profit of discontinued operations after taxes -46 351
Profit for the period 7,439 28
Controlling company’s shareholders 2,057 221
Non-controlling interest 5,382 -193
Comparative Summary Consolidated Statement of Cash Flow Data
In millions of Ps, Sep-18 Sep-17
Net cash generated by operating activities 1,399 2,450
Net cash generated by / (used in) investment activities 805 -5,567
Net cash generated by financing activities 11,834 4,044
Total net cash generated during the fiscal period 14,038 927
Ratios
In millions of Ps, Sep-18 Sep-17
Liquidity (1) 1.729 1.498
Solvency (2) 0.253 0.244
Restricted capital (3) 0.675 0.699 (1) Current Assets / Current Liabilities (2) Total Shareholders’ Equity/Total Liabilities (3) Non-current Assets/Total Assets

13
Material events of the quarter and subsequent events
July 2018: End of the Share Repurchase Plan
In July 2018 the Company completed the share repurchase plan acquiring 3,924,695 ordinary shares (V,N ARS 1 per
share) for a total amount of ARS 169,8 million and 1,673,152 ADRs (representing 16,731,520 ordinary shares) for a
total of USD 31,0 million, representing 4,1% of the capital stock, fulfilling the terms and conditions of the share
repurchase plan
October 2018: General Ordinary and Extraordinary Shareholders’ Meeting
On October 29, 2018, the Company’s General Ordinary and Extraordinary Shareholders’ Meeting was held, and the
following resolutions were adopted by majority vote:
Distribution of 20,656,215 treasury shares, representing 4.1% of the share capital (0.04294551131 shares /
ordinary share and 0.4294551131 shares / ADR), to be done on November 12, 2018.
Fees payable to the Board of Directors and Supervisory Committee for fiscal year 2018 ended June 30, 2018,
Renewal of appointment of regular and alternate directors due to expiration of their terms and appointment of
new alternate director,
November 2018: Bond issuance
On November 8, we issued Negotiable Obligations in the local market for the sum of USD 73,6 million at a fixed interest
rate of 9% per annum due in 2020, The funds will be used to refinance short-term debt,
EBITDA Reconciliation
In this summary report we present EBITDA and Adjusted EBITDA, We define EBITDA as profit for the period excluding:
(i) result of discontinued operations, (ii) income tax expense, (iii) financial results, net iv) results from participation in
associates and joint ventures; and (v) depreciation and amortization, We define Adjusted EBITDA as EBITDA minus net
profit from changes in the fair value of investment properties, not realized,
EBITDA and Adjusted EBITDA are non-IFRS financial measures that do not have standardized meanings prescribed by
IFRS, We present EBITDA and adjusted EBITDA because we believe they provide investors supplemental measures
of our financial performance that may facilitate period-to-period comparisons on a consistent basis, Our management
also uses EBITDA and Adjusted EBITDA from time to time, among other measures, for internal planning and
performance measurement purposes, EBITDA and Adjusted EBITDA should not be construed as an alternative to profit
from operations, as an indicator of operating performance or as an alternative to cash flow provided by operating
activities, in each case, as determined in accordance with IFRS, EBITDA and Adjusted EBITDA, as calculated by us,
may not be comparable to similarly titled measures reported by other companies, The table below presents a
reconciliation of profit for the relevant period to EBITDA and Adjusted EBITDA for the periods indicated:
For the three-month period ended September 30 (in ARS million)
2018 2017
Profit for the period 7,439 28
Profit from discontinued operations 46 -351
Income tax expense 856 1,137
Net financial results 10,384 4,539
Share of profit of associates and joint ventures -445 -384
Depreciation and amortization 1,224 916
EBITDA (unaudited) 19,504 5,885
Unrealized gain from fair value of investment properties -15,018 -3,385
Adjusted EBITDA (unaudited) 4,486 2,500

14
Prospects for fiscal year
The 2019 Campaign is developing in Argentina under the climatic characteristics of a neutral “el niño” phenomenon,
with precipitations level above the average. We expect an increase in the country’s agricultural production greater than
30%, mainly driven by Soybean and Corn. Regarding the markets, in the case of oilseeds, the price trend will be
influenced by the development of the trade conflict between China and the US, Should this dispute continue, we would
see lower prices in the US and firmer prices in South America due to China's demand orientation towards this origin,
while, if resolved, we would see a positive reaction from the Chicago quotes at the expense of the FOB premiums from
South America, For cereals, the decline in production in the countries of Europe and Eastern Europe provide support to
prices, providing good prospects for their prices,
Given the new agricultural scenario, with more competitive exchange rates in Argentina and Brazil, Cresud plans to
plant 257,000 hectares in the region and to produce more than 800,000 tons, a historical record. Likewise, the Company
is strongly complementing its activity in its own farms with farms leased to third parties in Argentina, Brazil and Bolivia.
Regarding livestock activity, we will focus on improving productivity by minimizing the impact of increased costs due to
the economic situation, working efficiently to achieve the highest possible operating margins, We will continue
concentrating our cattle production in our own farms, mainly in the Northwest of the country and hoping to continue
appreciating the cattle price,
Regarding the transformation and farmland sales, we hope to get the permits to increase the area under development
since we have a large area of land reserves in the region with agricultural and / or livestock potential while we will
continue to sell the farms that have reached their maximum level of appreciation,
In relation to our urban properties and investments segment, the diversification in real estate assets of our subsidiary
IRSA, in Argentina and abroad, including the United States and Israel, protects us from the exchange rate volatility of
the last months. We trust in the value of our investment in IRSA and we expect good results for FY 2019.
We believe that companies like Cresud, with many years of experience and great knowledge of the sector, will have
excellent opportunities to take advantage in the market, especially considering that our main job is to produce food for
a world population that grows and demands it,
Alejandro G. Elsztain
Second Vice Chairman in office
of the Presidency

15
Consolidated Condensed Interim Balance Sheets
as of September 30, 2018 and June 30, 2018 (Amounts stated in millions)
Note 09.30.18 06.30.18
ASSETS
Non-current Assets
Investment properties 8 226,971 163,510 Property, plant and equipment 9 28,720 20,646 Trade properties 10 3,188 6,020 Intangible assets 11 17,473 12,363 Biological assets 12 1,085 900 Other assets 114 189 Investment in associates and joint ventures 7 34,257 24,747 Deferred Income tax assets 20 2,635 1,679 Income tax and MPIT credit 453 453 Restricted assets 14 2,695 2,178 Trade and other receivables 15 14,040 9,129 Investments in financial assets 14 2,406 1,704 Financial assets available for sale 14 12,895 7,788 Derivative financial instruments 14 - 30
Total Non-Current Assets 346,932 251,336
Current Assets
Trade properties 10 3,705 3,232 Biological assets 12 1,211 913 Inventories 13 3,219 2,324 Restricted assets 14 6,497 4,248 Income tax and MPIT credit 497 400 Group of assets held for sale 30 8,922 5,192 Trade and other receivables 15 24,722 17,208 Investments in financial assets 14 35,574 25,646 Financial assets held for sale 14 10,772 4,466 Derivative financial instruments 14 330 155 Cash and cash equivalents 14 71,734 38,650
Total Current Assets 167,183 102,434
TOTAL ASSETS 514,115 353,770
SHAREHOLDERS’ EQUITY
Attributable to equity holders of the parent 27,225 20,925
Non-controlling interest 76,475 54,396
TOTAL SHAREHOLDERS’ EQUITY 103,700 75,321
LIABILITIES
Non-current Liabilities
Borrowings 19 271,514 187,462 Deferred Income tax liabilities 20 34,042 26,563 Trade and other payables 17 2,325 3,577 Provisions 18 5,475 3,567 Employee benefits 159 110 Income tax and MPIT expense 27 - Derivative financial instruments 14 63 40 Salaries and social security liabilities 107 76
Total Non-Current Liabilities 313,712 221,395
Current Liabilities
Trade and other payables 17 20,994 17,892 Borrowings 19 64,317 32,083 Provisions 18 1,543 1,059 Group of liabilities held for sale 30 6,118 3,243 Payroll and social security liabilities 2,606 1,868 Income tax and minimum presumed income tax expense 752 595 Derivative financial instruments 14 373 314
Total Current Liabilities 96,703 57,054
TOTAL LIABILITIES 410,415 278,449
TOTAL LIABILITIES AND SHAREHOLDERS’ EQUITY 514,115 353,770
16
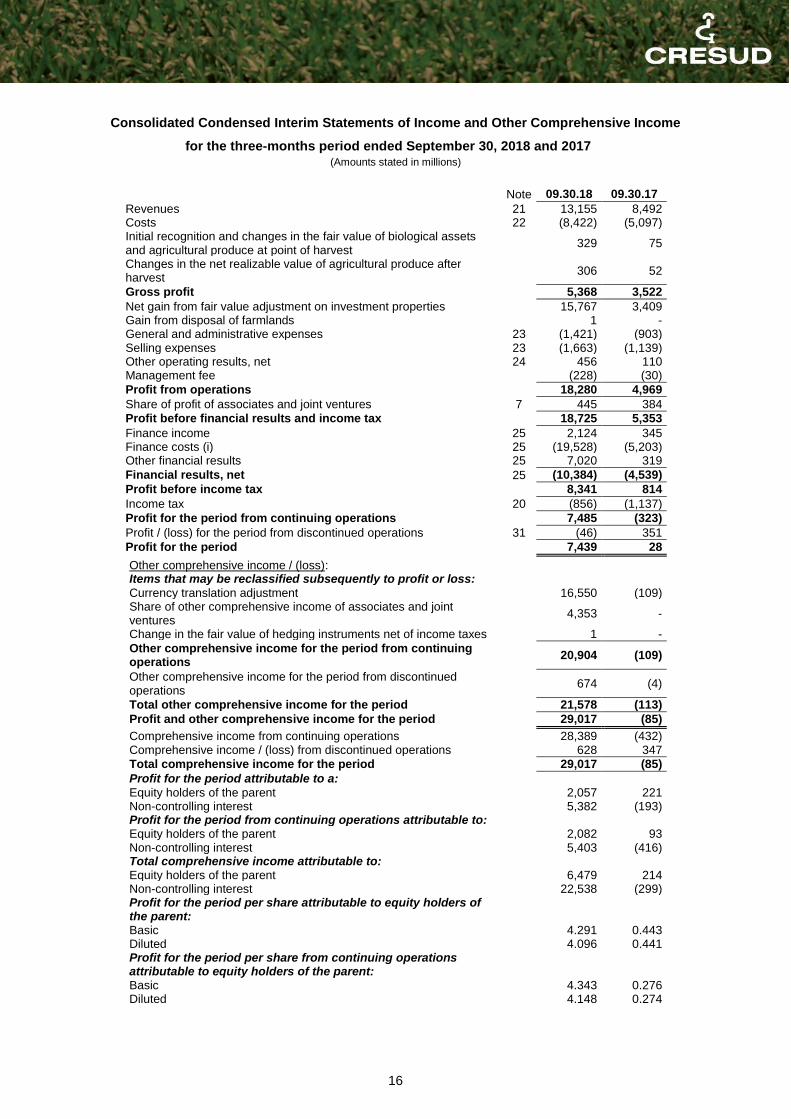
Consolidated Condensed Interim Statements of Income and Other Comprehensive Income
for the three-months period ended September 30, 2018 and 2017 (Amounts stated in millions)
Note 09.30.18 09.30.17
Revenues 21 13,155 8,492 Costs 22 (8,422) (5,097) Initial recognition and changes in the fair value of biological assets and agricultural produce at point of harvest
329 75
Changes in the net realizable value of agricultural produce after harvest
306 52
Gross profit 5,368 3,522
Net gain from fair value adjustment on investment properties 15,767 3,409 Gain from disposal of farmlands 1 - General and administrative expenses 23 (1,421) (903) Selling expenses 23 (1,663) (1,139) Other operating results, net 24 456 110 Management fee (228) (30)
Profit from operations 18,280 4,969
Share of profit of associates and joint ventures 7 445 384
Profit before financial results and income tax 18,725 5,353
Finance income 25 2,124 345 Finance costs (i) 25 (19,528) (5,203) Other financial results 25 7,020 319
Financial results, net 25 (10,384) (4,539)
Profit before income tax 8,341 814
Income tax 20 (856) (1,137)
Profit for the period from continuing operations 7,485 (323)
Profit / (loss) for the period from discontinued operations 31 (46) 351
Profit for the period 7,439 28 Other comprehensive income / (loss):
Items that may be reclassified subsequently to profit or loss:
Currency translation adjustment 16,550 (109) Share of other comprehensive income of associates and joint ventures
4,353 -
Change in the fair value of hedging instruments net of income taxes 1 -
Other comprehensive income for the period from continuing operations
20,904 (109)
Other comprehensive income for the period from discontinued operations
674 (4)
Total other comprehensive income for the period 21,578 (113)
Profit and other comprehensive income for the period 29,017 (85)
Comprehensive income from continuing operations 28,389 (432) Comprehensive income / (loss) from discontinued operations 628 347
Total comprehensive income for the period 29,017 (85)
Profit for the period attributable to a:
Equity holders of the parent 2,057 221 Non-controlling interest 5,382 (193) Profit for the period from continuing operations attributable to:
Equity holders of the parent 2,082 93 Non-controlling interest 5,403 (416) Total comprehensive income attributable to:
Equity holders of the parent 6,479 214 Non-controlling interest 22,538 (299) Profit for the period per share attributable to equity holders of the parent:
Basic 4.291 0.443 Diluted 4.096 0.441 Profit for the period per share from continuing operations attributable to equity holders of the parent:
Basic 4.343 0.276 Diluted 4.148 0.274

17
Consolidated Condensed Interim Cash Flow Statements
for the three-month periods ended September 30, 2018 and 2017 (Amounts stated in millions)
Note 09.30.18 09.30.17
Operating activities:
Net cash generated from continuing operating activities before income tax 16 1,266 2,205
Income tax paid (58) (155)
Net cash generated from continuing operating activities 1,208 2,050
Net cash generated from discontinued operating activities 191 400
Net cash generated from operating activities 1,399 2,450
Investing activities:
Interest held increase in associates and joint ventures (49) (30) Contributions of capital in associates and joint ventures (31) - Proceeds from sales of investment properties (5) - Acquisition and improvements of investment properties (1,172) (621) Cash incorporated by deconsolidation of subsidiary 33 - Farm sales advance payments - 69 Proceeds from farm sales - 6 Proceeds from sales of investment properties 7 26 Acquisitions and improvements of property, plant and equipment (641) (835) Proceeds from sales of property, plant and equipment 1 - Financial advance payments (16) (110) Acquisitions of intangible assets (433) (114) Net increase of restricted deposits (182) (223) Dividends received from associates and joint ventures 90 - Proceeds from associate liquidation 389 - Proceeds from loans granted 57 - Acquisitions of investments in financial assets (5,005) (6,913) Proceeds from investments in financial assets 7,573 3,722 Interest received from financial assets 183 54 Dividends received 125 98 Loans granted to related parties - (229) Loans granted - (88)
Net cash generated from / (used in) continuing investing activities 924 (5,188)
Net cash used in discontinued investing activities (119) (379)
Net cash generated from / (used in) investing activities 805 (5,567)
Financing activities:
Borrowings and issuance of non-convertible notes 14,408 15,116 Payment of borrowings and non-convertible notes (3,153) (11,243) Obtention of short term loans, net 3,095 71 Interests Paid (1,740) (1,625) Issuance of capital in subsidiaries - 276 Repurchase of non-convertible notes (634) - Non-controlling interest contributions in subsidiaries - 129 Acquisition of non-controlling interest in subsidiaries (227) (48) Proceeds from sales of non-controlling interest in subsidiaries 7 18 Loans received from associates and joint ventures, net 53 - Dividends paid to non-controlling interest in subsidiaries (220) - Cancellation of financed purchases (1) 1 Dividend paid - (130) Proceeds from derivative financial instruments 147 17
Net cash generated from continuing financing activities 11,735 2,582
Net cash generated from discontinued financing activities 99 1,463
Net cash generated from financing activities 11,834 4,045
Net (decrease) / increase in cash and cash equivalents from continuing operations
13,867 (556)
Net increase in cash and cash equivalents from discontinued operations 171 1,484
Net increase in cash and cash equivalents 14,038 928
Cash and cash equivalents at beginning of the period 15 38,650 23,879 Cash and cash equivalents reclassified to held for sale (184) 1,488 Foreign exchange gain on cash and changes in fair value of cash equivalents 19,230 94
Cash and cash equivalents at end of the period 71,734 26,389

18
Headquarters
Moreno 877 23º Piso
Tel +(54 11) 4814-7800/9
Fax +(54 11) 4814-7876
www.cresud.com.ar
C1091AAF – Cdad. Autónoma de Buenos Aires – Argentina
Investor Relations
Alejandro Elsztain – CEO
Matías Gaivironsky - CFO
Tel +(54 11) 4323 7449
e-mail [email protected]
Legal Advisors
Estudio Zang. Bergel & Viñes
Tel +(54 11) 4322 0033
Florida 537 18º Piso
C1005AAK – Cdad. Autónoma de Buenos Aires – Argentina
Audit Commetee
PricewaterhouseCoopers Argentina
Tel +(54 11) 4850-0000
Bouchard 557 Piso 7°
C1106ABG – Cdad. Autónoma de Buenos Aires – Argentina
Registry and Transfer Agent
Caja de Valores S.A.
Tel +(54 11) 4317 8900
25 de Mayo 362
C1002ABH – Cdad. Autónoma de Buenos Aires – Argentina
Depositary Agent ADS´s
The Bank of New York Mellon
Tel. 1 888 BNY ADRS (269-2377) Tel. 1 610 312 5315
P.O. Box 11258 Church Street Station
New York. NY 10286 1258 – Estados Unidos de Norteamérica
Símbolo BYMA: CRES
Nasdaq Symbol: CRESY