Earnings Release and Supplemental Report
52
Earnings Release and Supplemental Report ___________________________________________________________________ Second Quarter 2021 Sorrento Gateway Rendering San Diego, CA
Transcript of Earnings Release and Supplemental Report
Earnings Releaseand Supplemental Report___________________________________________________________________
Second Quarter 2021
Sorrento Gateway RenderingSan Diego, CA
Return to TOC2Return to TOC
2
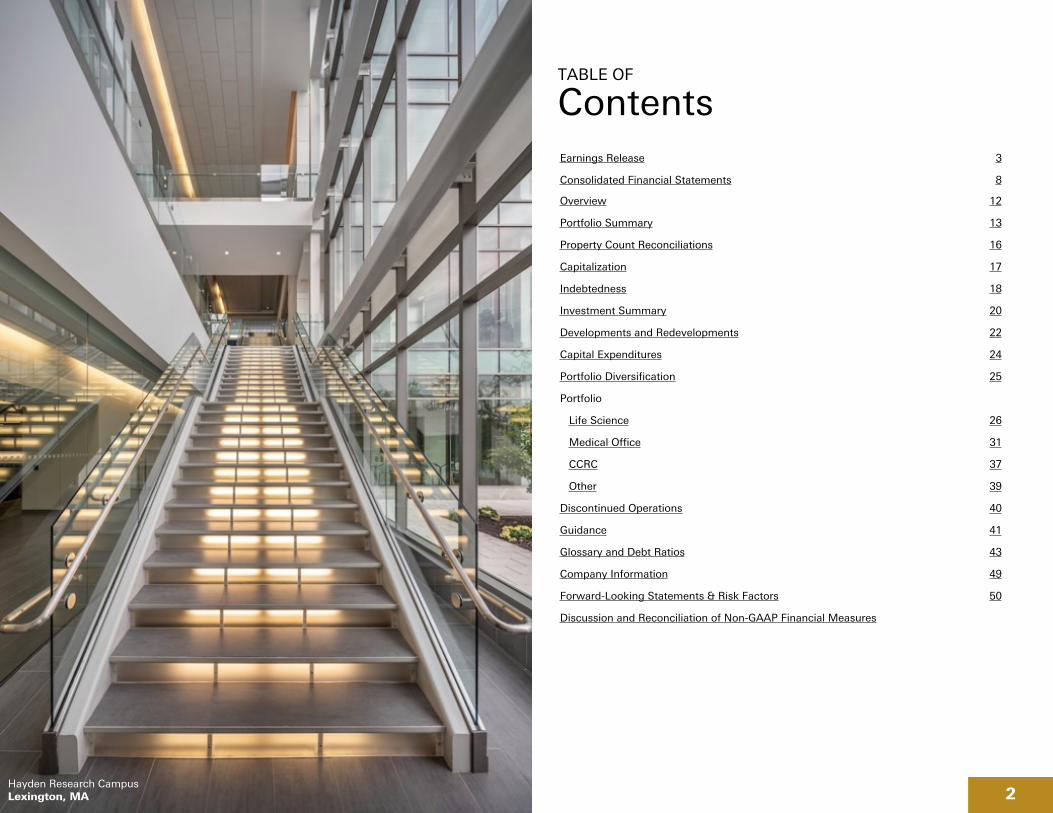
Earnings Release 3
Consolidated Financial Statements 8
Overview 12
Portfolio Summary 13
Property Count Reconciliations 16
Capitalization 17
Indebtedness 18
Investment Summary 20
Developments and Redevelopments 22
Capital Expenditures 24
Portfolio Diversification 25
Portfolio
Life Science 26
Medical Office 31
CCRC 37
Other 39
Discontinued Operations 40
Guidance 41
Glossary and Debt Ratios 43
Company Information 49
Forward-Looking Statements & Risk Factors 50
Discussion and Reconciliation of Non-GAAP Financial Measures
TABLE OF
Contents
Hayden Research CampusLexington, MA
Return to TOC3Return to TOC
Healthpeak Reports Second Quarter 2021 Results
DENVER, August 3, 2021 - Healthpeak Properties, Inc. (NYSE: PEAK) today announced results for the second quarter ended June 30, 2021.
SECOND QUARTER 2021 FINANCIAL PERFORMANCE AND RECENT HIGHLIGHTS
– Net income of $0.51 per share, Nareit FFO of $0.28 per share, FFO as Adjusted of $0.40 per share, and blended Total Same-Store Portfolio Cash (Adjusted) NOI growth of 1.2%
• Total pro forma Same-Store Portfolio Cash (Adjusted) NOI growth of 7.6% excluding government grants received under the CARES Act at our CCRC properties
• Life Science and MOB Same-Store Portfolio Cash (Adjusted) NOI growth of 7.4% and 4.1%, respectively
– Acquisitions:
• Closed on $425 million of MOB acquisitions during the second quarter
• In July 2021, acquired an aggregate $205 million of MOBs in off-market transactions, consisting of three buildings that are 100% leased to Atlantic Health System for $155 million and a 132,000 square foot medical campus 100% leased to HCA for $50 million
– Development leasing:
• Signed a binding term sheet for a 163,000 square foot full-building lease for the Sorrento Gateway life science development in the Sorrento Mesa submarket of San Diego, California
• Signed a 185,000 square foot full-campus lease for the Callan Ridge densification in the Torrey Pines submarket of San Diego, California
• Active life science development pipeline now 73% pre-leased
– Dispositions:
• Closed on an additional $249 million of senior housing sales and $19 million of loan repayments from our May 4, 2021 earnings release through August 1, 2021 and under contract on the remaining sales
• Received $246 million of seller-financing early repayments in June 2021
• Closed on the previously announced sale of Hoag Hospital purchase option, generating proceeds of $226 million
– Balance sheet:
• Completed the previously announced tender offers for $550 million of senior unsecured notes due 2025
• Issued $450 million of 1.35% senior unsecured notes due 2027 in our inaugural green bond offering
• Net debt to adjusted EBITDAre of 4.6x as of June 30, 2021
– The Board of Directors declared a quarterly common stock cash dividend of $0.30 per share to be paid on August 20, 2021, to stockholders of record as of the close of business on August 9, 2021
– Published 10th annual ESG report covering environmental, social and governance initiatives and progress
Return to TOC4Return to TOC
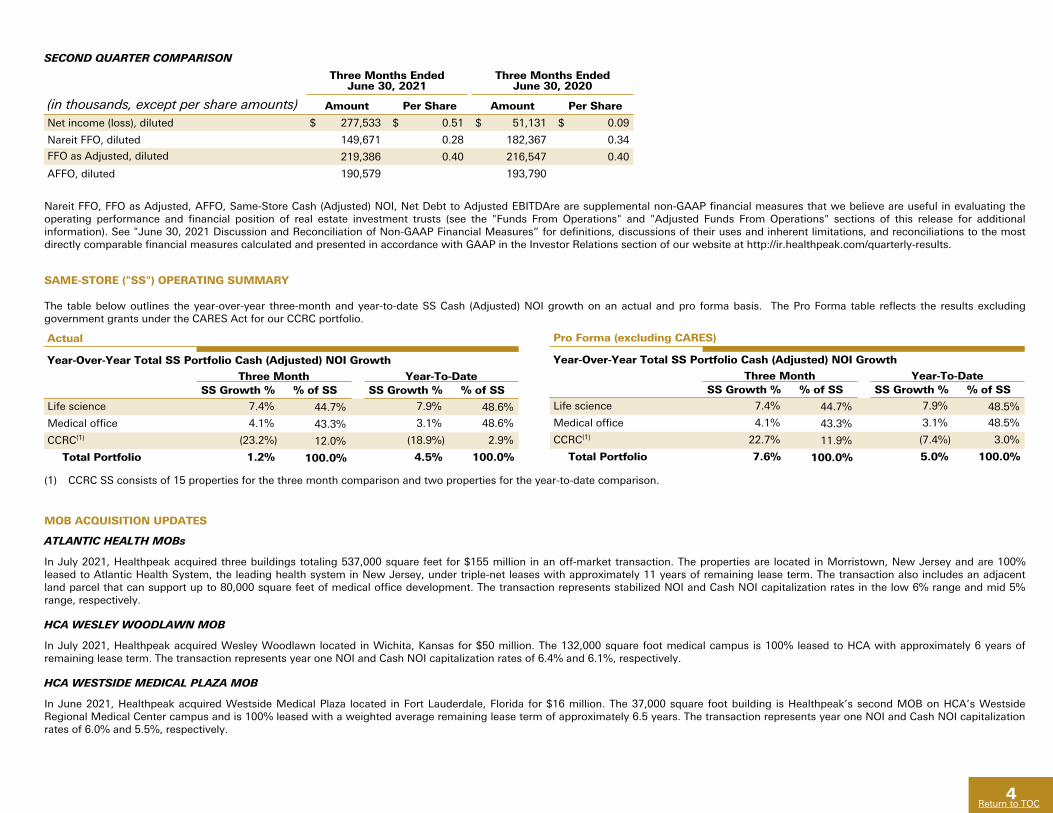
SAME-STORE ("SS") OPERATING SUMMARY
The table below outlines the year-over-year three-month and year-to-date SS Cash (Adjusted) NOI growth on an actual and pro forma basis. The Pro Forma table reflects the results excluding government grants under the CARES Act for our CCRC portfolio.
Actual
Year-Over-Year Total SS Portfolio Cash (Adjusted) NOI Growth
Three Month Year-To-DateSS Growth % % of SS SS Growth % % of SS
Life science 7.4% 44.7% 7.9% 48.6%
Medical office 4.1% 43.3% 3.1% 48.6%
CCRC(1) (23.2%) 12.0% (18.9%) 2.9%
Total Portfolio 1.2% 100.0% 4.5% 100.0%
Nareit FFO, FFO as Adjusted, AFFO, Same-Store Cash (Adjusted) NOI, Net Debt to Adjusted EBITDAre are supplemental non-GAAP financial measures that we believe are useful in evaluating the operating performance and financial position of real estate investment trusts (see the "Funds From Operations" and "Adjusted Funds From Operations" sections of this release for additional information). See "June 30, 2021 Discussion and Reconciliation of Non-GAAP Financial Measures” for definitions, discussions of their uses and inherent limitations, and reconciliations to the most directly comparable financial measures calculated and presented in accordance with GAAP in the Investor Relations section of our website at http://ir.healthpeak.com/quarterly-results.
SECOND QUARTER COMPARISON
Three Months EndedJune 30, 2021
Three Months EndedJune 30, 2020
(in thousands, except per share amounts) Amount Per Share Amount Per Share
Net income (loss), diluted $ 277,533 $ 0.51 $ 51,131 $ 0.09
Nareit FFO, diluted 149,671 0.28 182,367 0.34
FFO as Adjusted, diluted 219,386 0.40 216,547 0.40
AFFO, diluted 190,579 193,790
Pro Forma (excluding CARES)
Year-Over-Year Total SS Portfolio Cash (Adjusted) NOI Growth
Three Month Year-To-DateSS Growth % % of SS SS Growth % % of SS
Life science 7.4% 44.7% 7.9% 48.5%
Medical office 4.1% 43.3% 3.1% 48.5%
CCRC(1) 22.7% 11.9% (7.4%) 3.0%
Total Portfolio 7.6% 100.0% 5.0% 100.0%
(1) CCRC SS consists of 15 properties for the three month comparison and two properties for the year-to-date comparison.
MOB ACQUISITION UPDATES
ATLANTIC HEALTH MOBs
In July 2021, Healthpeak acquired three buildings totaling 537,000 square feet for $155 million in an off-market transaction. The properties are located in Morristown, New Jersey and are 100% leased to Atlantic Health System, the leading health system in New Jersey, under triple-net leases with approximately 11 years of remaining lease term. The transaction also includes an adjacent land parcel that can support up to 80,000 square feet of medical office development. The transaction represents stabilized NOI and Cash NOI capitalization rates in the low 6% range and mid 5% range, respectively.
HCA WESLEY WOODLAWN MOB
In July 2021, Healthpeak acquired Wesley Woodlawn located in Wichita, Kansas for $50 million. The 132,000 square foot medical campus is 100% leased to HCA with approximately 6 years of remaining lease term. The transaction represents year one NOI and Cash NOI capitalization rates of 6.4% and 6.1%, respectively.
HCA WESTSIDE MEDICAL PLAZA MOB
In June 2021, Healthpeak acquired Westside Medical Plaza located in Fort Lauderdale, Florida for $16 million. The 37,000 square foot building is Healthpeak’s second MOB on HCA’s Westside Regional Medical Center campus and is 100% leased with a weighted average remaining lease term of approximately 6.5 years. The transaction represents year one NOI and Cash NOI capitalization rates of 6.0% and 5.5%, respectively.
Return to TOC5Return to TOC
14-PROPERTY MOB PORTFOLIO
As previously announced, in April 2021, Healthpeak acquired a 14-property, 833,000 square foot MOB portfolio for $371 million in an off-market transaction. The portfolio is 89% leased with a weighted average lease term of 6.5 years. 100% of the portfolio is on-campus or affiliated with investment grade health system tenants including Bon Secours Mercy Health, Inova Health System, NorthShore University HealthSystem, Fairview Health Services and PeaceHealth. The portfolio is primarily located in top 25 MSAs including Minneapolis, Chicago, Philadelphia, Washington, D.C., Los Angeles and Dallas. The transaction represents NOI and Cash NOI capitalization rates of approximately 5.6% and 5.2%, respectively, at closing, and low 6% and high 5%, respectively, upon stabilization.
SKY RIDGE CAMPUS MOB
As previously announced, in April 2021, Healthpeak acquired Pinnacle at Ridgegate, a recently developed 80,000 square foot MOB located on HCA's Sky Ridge Medical Center campus (“Sky Ridge”) in Denver, Colorado for $38 million in an off-market transaction. The acquisition brings Healthpeak’s on-campus MOB ownership at Sky Ridge to 420,000 square feet. The transaction represents a year one NOI and Cash NOI capitalization rate of approximately mid 2% and, upon completion of lease-up and stabilization, NOI and Cash NOI capitalization rates of approximately 5.8% and 5.5%, respectively.
LIFE SCIENCE LAND ACQUISITION UPDATE
SOUTH SAN FRANCISCO LAND
As previously announced, in April 2021, Healthpeak closed on the first phase of the acquisition of 12 acres of land in South San Francisco, California for $61 million in an off-market transaction. Healthpeak is under contract to acquire the remaining 7 acres for an additional $67.5 million.
The 12 acre site is adjacent to Healthpeak’s Forbes Research land, and the combination of the two sites, branded as Vantage, forms a contiguous 20 acres, enabling the development of a multi-phase, scalable campus totaling 1 million square feet or more, subject to final entitlements.
DEVELOPMENT LEASING UPDATES
SORRENTO GATEWAY FULL-CAMPUS LEASE
Sorrento Therapeutics, Inc. has executed a binding term sheet for a long-term lease for the entire Sorrento Gateway development project in the Sorrento Mesa submarket of San Diego. The $117 million Class A development will consist of a five-story building totaling approximately 163,000 square feet with an estimated yield on cost in the mid 8% range. Upon expected completion of the development in 2023, Sorrento Therapeutics will lease a total of 374,000 square feet from Healthpeak.
CALLAN RIDGE FULL-CAMPUS LEASE
As previously announced, Turning Point Therapeutics, Inc. has executed a long-term lease for the entire Callan Ridge densification project located in the Torrey Pines submarket of San Diego. The lease is expected to commence in early 2023, upon completion of construction. The $140 million project will more than double the current leasable area by replacing an outmoded 90,000 square foot building with a new Class A two-building campus totaling approximately 185,000 square feet with an estimated yield on cost in the low 9% range.
SENIOR HOUSING DISPOSITIONS
Continued progress on the sale of $4 billion of senior housing assets:
• Cumulative gross proceeds from closed sales of $3.8 billion since July 2020
◦ 116 SHOP assets containing 12,315 units generating gross proceeds of $2.49 billion at a blended 2.6% annualized trailing 3-month cap rate
◦ 50 NNN assets containing 4,812 units generating gross proceeds of $1.13 billion at a blended 7.5% annualized trailing 3-month lease yield and a blended 5.2% annualized trailing 3-month EBITDAR yield
◦ 2 legacy CCRCs owned in a joint venture with, and managed by, Brookdale Senior Living containing 891 units generating gross proceeds of $19 million at share at a blended (5.4%) annualized trailing 3-month cap rate
◦ $157 million from senior housing loan sales and repayments
• Under contract on the remaining sales
Transactions closed subsequent to our May 4, 2021 earnings release:
• $145 million sale of 11 SHOP properties, totaling 1,087 units at a blended (2.3%) annualized trailing 3-month cap rate
• $85 million sale of 3 NNN properties, totaling 317 units at a blended 4.9% annualized trailing 3-month lease yield and a blended 2.0% annualized trailing 3-month EBITDAR yield
• $19 million sale of 2 legacy CCRCs owned in a joint venture with, and managed by, Brookdale Senior Living containing 891 units at a blended (5.4%) annualized trailing 3-month cap rate
• $19 million of loan repayments
Return to TOC6Return to TOC
Previously disclosed transactions closed during the second quarter include:
• $564 million sale of a 12-property SHOP portfolio, totaling 1,043 units, operated by Oakmont Senior Living
• $334 million sale of a 10-property SHOP portfolio, totaling 1,428 units, operated by Discovery Senior Living and the sale of 2 loans and 2 preferred equity investments generating additional proceeds of $21 million
• Through 5 separate transactions, sale of 2 NNN properties totaling 107 units operated by Next Step Senior Care and 8 SHOP properties totaling 794 units generating total proceeds of $116 million. The operators of the SHOP properties include Sonata (5), Milestone, Capital Senior Living and Brookdale Senior Living
Also during the quarter, Healthpeak received $246 million of seller-financing early repayments.
BALANCE SHEET
In July 2021, Healthpeak completed its inaugural green bond issuance, a public offering of $450 million of 1.35% senior unsecured notes due 2027.
In July 2021, we repaid a $250 million unsecured term loan.
As previously announced, during the second quarter, Healthpeak completed its tender offers for a total of $550 million of senior unsecured notes maturing in 2025, with a weighted average coupon of approximately 3.7%. Total debt extinguishment costs were $61 million, of which $53 million represents mark-to-market adjustments.
DIVIDEND
On July 29, Healthpeak announced that its Board declared a quarterly common stock cash dividend of $0.30 per share to be paid on August 20, 2021, to stockholders of record as of the close of business on August 9, 2021.
10th ANNUAL ESG REPORT
In July 2021, Healthpeak published its 10th annual ESG Report, highlighting our environmental, social and governance (ESG) initiatives over the last decade as well as our 2020 performance.
To learn more about Healthpeak's ESG program and view our 2020 ESG Report, please visit www.healthpeak.com/esg or our interactive ESG Report website at esg.healthpeak.com.
2021 GUIDANCE
For full year 2021, we are updating the following guidance ranges:
• Diluted earnings per common share from $0.98 – $1.06 to $0.95 – $1.01
• Diluted Nareit FFO per share from $1.09 – $1.17 to $1.06 – $1.12
• Diluted FFO as Adjusted per share from $1.53 – $1.61 to $1.55 – $1.61
• Blended Total Portfolio Same-Store Cash (Adjusted) NOI growth from 1.75% – 3.25% to 2.25% – 3.75%
COMPANY INFORMATION Healthpeak has scheduled a conference call and webcast for Wednesday, August 4, 2021, at 9:00 a.m. Mountain Time (11:00 a.m. Eastern Time) to present its performance and operating results for the second quarter ended June 30, 2021. The conference call is accessible by dialing (888) 317-6003 (U.S.) or (412) 317-6061 (international). The conference ID number is 5046783. You may also access the conference call via webcast in the Investor Relations section of our website at http://ir.healthpeak.com. An archive of the webcast will be available on Healthpeak's website through August 4, 2022, and a telephonic replay can be accessed through August 18, 2021, by dialing (877) 344-7529 (U.S.) or (412) 317-0088 (international) and entering conference ID number 10158057. Our Supplemental Report for the current period is also available, with this earnings release, in the Investor Relations section of our website.
ABOUT HEALTHPEAK
Healthpeak Properties, Inc. is a fully integrated real estate investment trust (REIT) and S&P 500 company. Healthpeak owns and develops high-quality real estate in the three private-pay healthcare asset classes of Life Science, Medical Office and CCRCs. At Healthpeak, we pair our deep understanding of the healthcare real estate market with a strong vision for long-term growth. For more information regarding Healthpeak, visit www.healthpeak.com.
Return to TOC7Return to TOC
FORWARD-LOOKING STATEMENTS
Statements in this release that are not historical facts are "forward-looking statements" within the meaning of Section 27A of the Securities Act of 1933, as amended, and Section 21E of the Securities Exchange Act of 1934, as amended. Forward-looking statements include, among other things, statements regarding our and our officers' intent, belief or expectation as identified by the use of words such as "may," "will," "project," "expect," "believe," "intend," "anticipate," "seek," "target," "forecast," "plan," "potential," "estimate," "could," "would," "should" and other comparable and derivative terms or the negatives thereof. Examples of forward-looking statements include, among other things: (i) statements regarding timing, outcomes and other details relating to current, pending or contemplated acquisitions, dispositions, transitions, developments, redevelopments, densifications, joint venture transactions, leasing activity and commitments, capital recycling plans, financing activities, or other transactions discussed in this release; (ii) the payment of a quarterly cash dividend; and (iii) the information presented under the heading "2021 Guidance." Pending acquisitions, dispositions, and leasing activity, including those subject to binding agreements, remain subject to closing conditions and may not be completed within the anticipated timeframes or at all. Forward-looking statements reflect our current expectations and views about future events and are subject to risks and uncertainties that could significantly affect our future financial condition and results of operations. While forward-looking statements reflect our good faith belief and assumptions we believe to be reasonable based upon current information, we can give no assurance that our expectations or forecasts will be attained. Further, we cannot guarantee the accuracy of any such forward-looking statement contained in this release, and such forward-looking statements are subject to known and unknown risks and uncertainties that are difficult to predict. These risks and uncertainties include, but are not limited to: the COVID-19 pandemic and health and safety measures intended to reduce its spread, the availability, effectiveness and public usage and acceptance of vaccines, and how quickly and to what extent normal economic and operating conditions can resume within the markets in which we operate; operational risks associated with third party management contracts, including the additional regulation and liabilities of our RIDEA lease structures; the ability of our existing and future tenants, operators and borrowers to conduct their respective businesses in a manner sufficient to maintain or increase their revenues and manage their expenses in order to generate sufficient income to make rent and loan payments to us and our ability to recover investments made, if applicable, in their operations; increased competition, operating costs and market changes affecting our tenants, operators and borrowers; the financial condition of our tenants, operators and borrowers, including potential bankruptcies and downturns in their businesses, and their legal and regulatory proceedings; our concentration of investments in the healthcare property sector, which makes us more vulnerable to a downturn in a specific sector than if we invested in multiple industries; our ability to identify replacement tenants and operators and the potential renovation costs and regulatory approvals associated therewith; our property development and redevelopment activity risks, including costs above original estimates, project delays and lower occupancy rates and rents than expected; changes within the life science industry; high levels of regulation, funding requirements, expense and uncertainty faced by our life science tenants; the ability of the hospitals on whose campuses our MOBs are located and their affiliated healthcare systems to remain competitive or financially viable; our ability to maintain or expand our hospital and health system client relationships; economic and other conditions that negatively affect geographic areas from which we recognize a greater percentage of our revenue; uninsured or underinsured losses, which could result in significant losses and/or performance declines by us or our tenants and operators; our investments in joint ventures and unconsolidated entities, including our lack of sole decision making authority and our reliance on our partners’ financial condition and continued cooperation; our use of contingent rent provisions and/or rent escalators based on the Consumer Price Index; competition for suitable healthcare properties to grow our investment portfolio; our ability to make material acquisitions and successfully integrate them; the potential impact on us and our tenants, operators and borrowers from litigation matters, including rising liability and insurance costs; our ability to foreclose on collateral securing our real estate-related loans; laws or regulations prohibiting eviction of our tenants; the failure of our tenants and operators to comply with federal, state and local laws and regulations, including resident health and safety requirements, as well as licensure, certification and inspection requirements; required regulatory approvals to transfer our healthcare properties; compliance with the Americans with Disabilities Act and fire, safety and other health regulations; the requirements of, or changes to, governmental reimbursement programs such as Medicare or Medicaid; legislation to address federal government operations and administration decisions affecting the Centers for Medicare and Medicaid Services; our participation in the CARES Act Provider Relief Program and other COVID-19 related stimulus and relief programs; volatility or uncertainty in the capital markets, the availability and cost of capital as impacted by interest rates, changes in our credit ratings and the value of our common stock, and other conditions that may adversely impact our ability to fund our obligations or consummate transactions, or reduce the earnings from potential transactions; cash available for distribution to stockholders and our ability to make dividend distributions at expected levels; our ability to manage our indebtedness level and covenants in and changes to the terms of such indebtedness; changes in global, national and local economic and other conditions; provisions of Maryland law and our charter that could prevent a transaction that may otherwise be in the interest of our stockholders; environmental compliance costs and liabilities associated with our real estate investments; our ability to maintain our qualification as a real estate investment trust (“REIT”); changes to U.S. federal income tax laws, and potential deferred and contingent tax liabilities from corporate acquisitions; calculating non-REIT tax earnings and profits; ownership limits in our charter that restrict ownership in our stock; our reliance on information technology systems and the potential impact of system failures, disruptions or breaches; unfavorable litigation resolution or disputes; the loss or limited availability of our key personnel; and other risks and uncertainties described from time to time in our Securities and Exchange Commission filings. Except as required by law, we do not undertake, and hereby disclaim, any obligation to update any forward-looking statements, which speak only as of the date on which they are made.
CALCULATIONS
The estimated capitalization rates and yield ranges included in this release are calculated by dividing projected NOI or Cash (Adjusted) NOI for the applicable properties by the aggregate purchase price or development cost, as applicable, for such properties. Newly acquired operating assets are generally considered stabilized at the earlier of lease-up (typically when the tenant(s) control(s) the physical use of at least 80% of the space) or 12 months from the acquisition date. Newly completed developments are considered stabilized at the earlier of lease-up or 24 months from the date the property is placed in service.
The aggregate NOI or Cash (Adjusted) NOI projections used in calculating the capitalization rates and yield ranges included in this presentation are based on (i) information currently available to us, including, in connection with acquisitions, information made available to us by the seller in the diligence process, and (ii) certain assumptions applied by us related to anticipated occupancy, rental rates, property taxes and other expenses over a specified period of time in the future based on historical data and the Company’s knowledge of and experience with the submarket. Accordingly, the capitalization rates and yield ranges included in this presentation are inherently based on inexact projections that may be incorrect or imprecise and may change as a result of events or factors currently unknown to the Company. The actual capitalization rates for these properties may differ materially and adversely from the estimated stabilized capitalization rates and yield ranges discussed in this release based on numerous factors, including any difficulties achieving assumed occupancy and/or rental rates, development delays, unanticipated expenses not payable by a tenant, tenant defaults, the results of purchase price allocations, as well as the risk factors set forth in the Company’s Annual Report on Form 10-K for the year ended December 31, 2020 and its subsequent filings with the SEC.
CONTACT
Andrew Johns Vice President – Corporate Finance and Investor Relations 720-428-5400
Return to TOC8Return to TOC
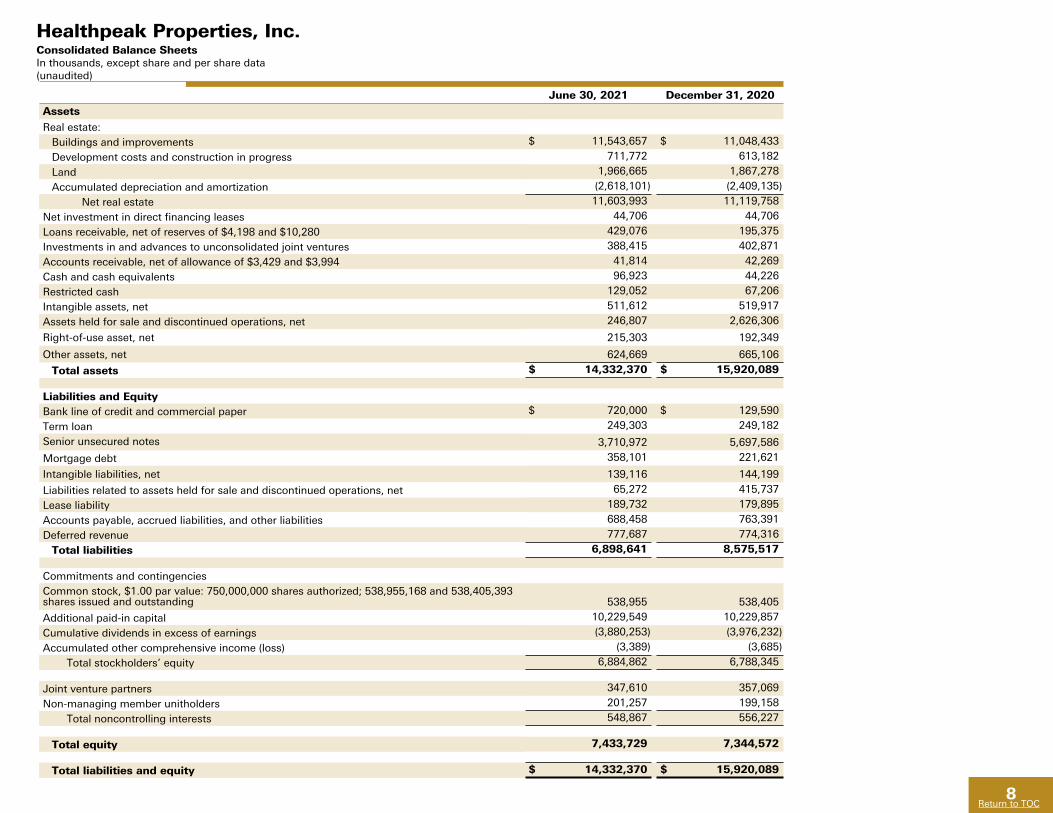
June 30, 2021 December 31, 2020
Assets
Real estate:Buildings and improvements $ 11,543,657 $ 11,048,433
Development costs and construction in progress 711,772 613,182
Land 1,966,665 1,867,278
Accumulated depreciation and amortization (2,618,101) (2,409,135)
Net real estate 11,603,993 11,119,758
Net investment in direct financing leases 44,706 44,706
Loans receivable, net of reserves of $4,198 and $10,280 429,076 195,375
Investments in and advances to unconsolidated joint ventures 388,415 402,871
Accounts receivable, net of allowance of $3,429 and $3,994 41,814 42,269
Cash and cash equivalents 96,923 44,226
Restricted cash 129,052 67,206
Intangible assets, net 511,612 519,917
Assets held for sale and discontinued operations, net 246,807 2,626,306
Right-of-use asset, net 215,303 192,349
Other assets, net 624,669 665,106
Total assets $ 14,332,370 $ 15,920,089
Liabilities and EquityBank line of credit and commercial paper $ 720,000 $ 129,590
Term loan 249,303 249,182
Senior unsecured notes 3,710,972 5,697,586
Mortgage debt 358,101 221,621
Intangible liabilities, net 139,116 144,199
Liabilities related to assets held for sale and discontinued operations, net 65,272 415,737
Lease liability 189,732 179,895
Accounts payable, accrued liabilities, and other liabilities 688,458 763,391
Deferred revenue 777,687 774,316
Total liabilities 6,898,641 8,575,517
Commitments and contingenciesCommon stock, $1.00 par value: 750,000,000 shares authorized; 538,955,168 and 538,405,393 shares issued and outstanding 538,955 538,405
Additional paid-in capital 10,229,549 10,229,857
Cumulative dividends in excess of earnings (3,880,253) (3,976,232)
Accumulated other comprehensive income (loss) (3,389) (3,685)
Total stockholders’ equity 6,884,862 6,788,345
Joint venture partners 347,610 357,069
Non-managing member unitholders 201,257 199,158
Total noncontrolling interests 548,867 556,227
Total equity 7,433,729 7,344,572
Total liabilities and equity $ 14,332,370 $ 15,920,089
Healthpeak Properties, Inc. Consolidated Balance Sheets In thousands, except share and per share data (unaudited)
Return to TOC9Return to TOC
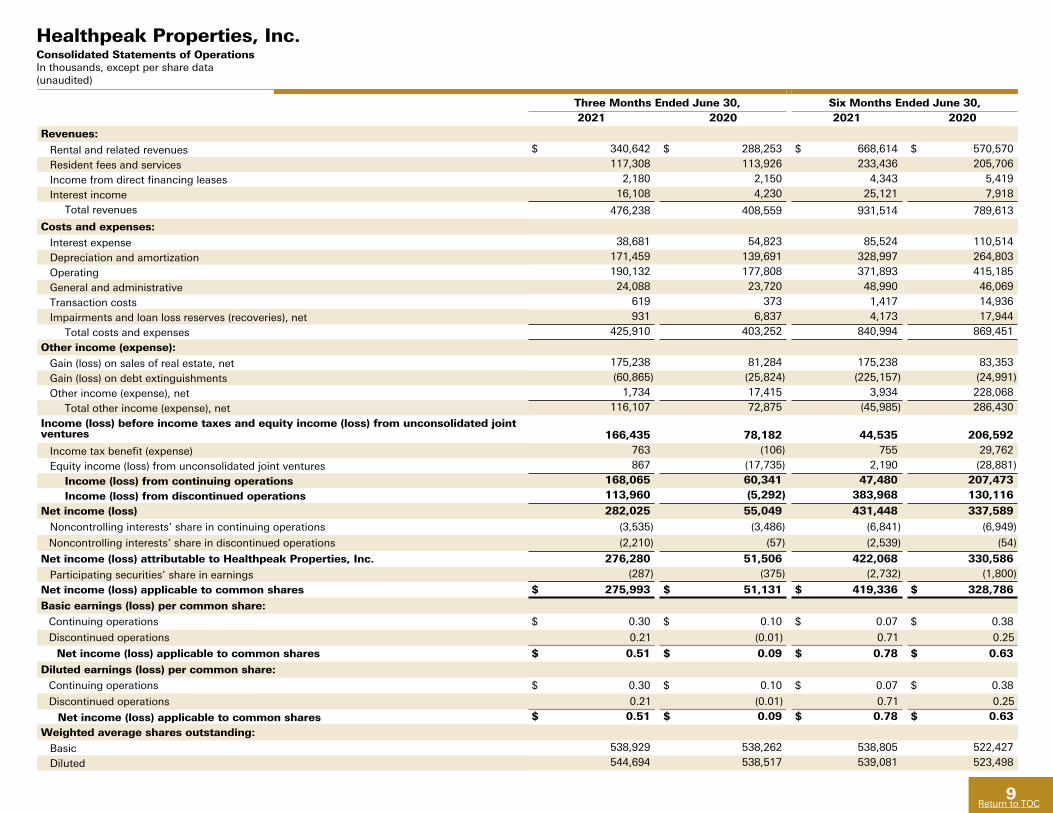
Healthpeak Properties, Inc. Consolidated Statements of Operations In thousands, except per share data(unaudited)
Three Months Ended June 30, Six Months Ended June 30, 2021 2020 2021 2020
Revenues:
Rental and related revenues $ 340,642 $ 288,253 $ 668,614 $ 570,570
Resident fees and services 117,308 113,926 233,436 205,706
Income from direct financing leases 2,180 2,150 4,343 5,419
Interest income 16,108 4,230 25,121 7,918
Total revenues 476,238 408,559 931,514 789,613
Costs and expenses:
Interest expense 38,681 54,823 85,524 110,514
Depreciation and amortization 171,459 139,691 328,997 264,803
Operating 190,132 177,808 371,893 415,185
General and administrative 24,088 23,720 48,990 46,069
Transaction costs 619 373 1,417 14,936
Impairments and loan loss reserves (recoveries), net 931 6,837 4,173 17,944
Total costs and expenses 425,910 403,252 840,994 869,451
Other income (expense):
Gain (loss) on sales of real estate, net 175,238 81,284 175,238 83,353
Gain (loss) on debt extinguishments (60,865) (25,824) (225,157) (24,991)
Other income (expense), net 1,734 17,415 3,934 228,068
Total other income (expense), net 116,107 72,875 (45,985) 286,430
Income (loss) before income taxes and equity income (loss) from unconsolidated joint ventures 166,435 78,182 44,535 206,592
Income tax benefit (expense) 763 (106) 755 29,762
Equity income (loss) from unconsolidated joint ventures 867 (17,735) 2,190 (28,881)
Income (loss) from continuing operations 168,065 60,341 47,480 207,473
Income (loss) from discontinued operations 113,960 (5,292) 383,968 130,116
Net income (loss) 282,025 55,049 431,448 337,589
Noncontrolling interests’ share in continuing operations (3,535) (3,486) (6,841) (6,949)
Noncontrolling interests’ share in discontinued operations (2,210) (57) (2,539) (54)
Net income (loss) attributable to Healthpeak Properties, Inc. 276,280 51,506 422,068 330,586
Participating securities’ share in earnings (287) (375) (2,732) (1,800)
Net income (loss) applicable to common shares $ 275,993 $ 51,131 $ 419,336 $ 328,786
Basic earnings (loss) per common share:Continuing operations $ 0.30 $ 0.10 $ 0.07 $ 0.38
Discontinued operations 0.21 (0.01) 0.71 0.25
Net income (loss) applicable to common shares $ 0.51 $ 0.09 $ 0.78 $ 0.63
Diluted earnings (loss) per common share:Continuing operations $ 0.30 $ 0.10 $ 0.07 $ 0.38
Discontinued operations 0.21 (0.01) 0.71 0.25
Net income (loss) applicable to common shares $ 0.51 $ 0.09 $ 0.78 $ 0.63
Weighted average shares outstanding:
Basic 538,929 538,262 538,805 522,427
Diluted 544,694 538,517 539,081 523,498
Return to TOC10Return to TOC
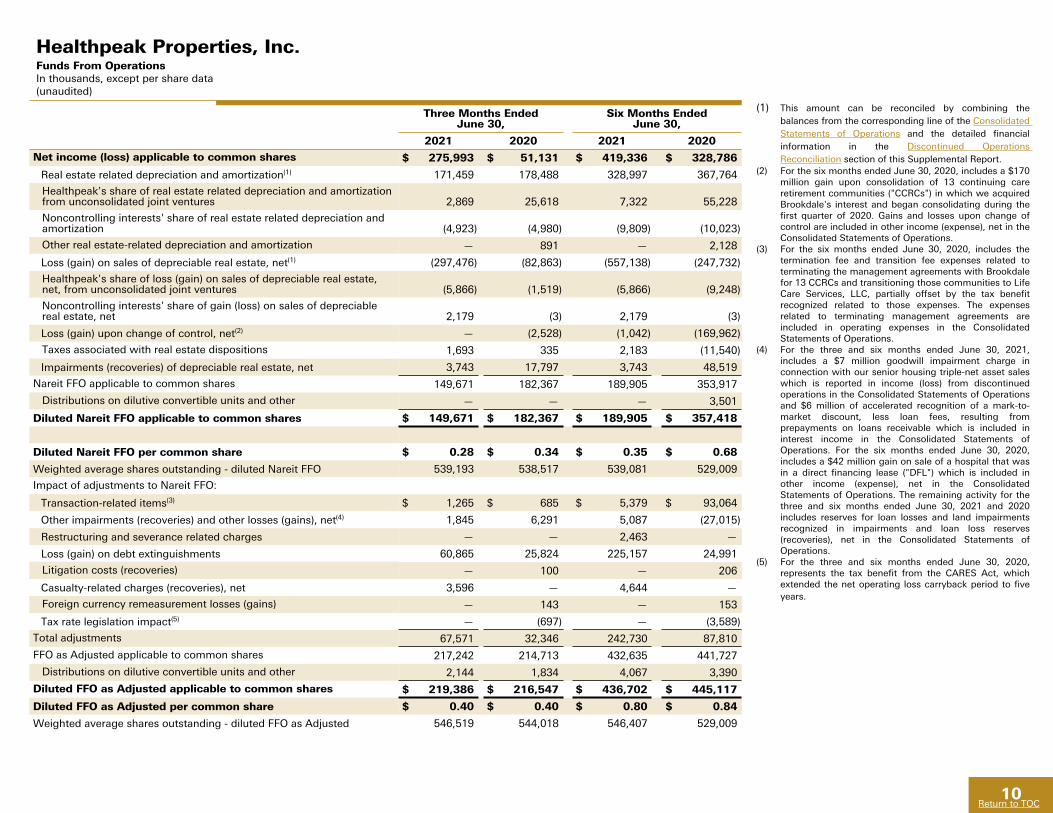
Healthpeak Properties, Inc.
Funds From Operations In thousands, except per share data (unaudited)
Three Months EndedJune 30,
Six Months EndedJune 30,
2021 2020 2021 2020
Net income (loss) applicable to common shares $ 275,993 $ 51,131 $ 419,336 $ 328,786
Real estate related depreciation and amortization(1) 171,459 178,488 328,997 367,764
Healthpeak's share of real estate related depreciation and amortization from unconsolidated joint ventures 2,869 25,618 7,322 55,228
Noncontrolling interests' share of real estate related depreciation and amortization (4,923) (4,980) (9,809) (10,023)
Other real estate-related depreciation and amortization — 891 — 2,128
Loss (gain) on sales of depreciable real estate, net(1) (297,476) (82,863) (557,138) (247,732)
Healthpeak's share of loss (gain) on sales of depreciable real estate, net, from unconsolidated joint ventures (5,866) (1,519) (5,866) (9,248)
Noncontrolling interests' share of gain (loss) on sales of depreciable real estate, net 2,179 (3) 2,179 (3)
Loss (gain) upon change of control, net(2) — (2,528) (1,042) (169,962)
Taxes associated with real estate dispositions 1,693 335 2,183 (11,540)
Impairments (recoveries) of depreciable real estate, net 3,743 17,797 3,743 48,519
Nareit FFO applicable to common shares 149,671 182,367 189,905 353,917
Distributions on dilutive convertible units and other — — — 3,501
Diluted Nareit FFO applicable to common shares $ 149,671 $ 182,367 $ 189,905 $ 357,418
Diluted Nareit FFO per common share $ 0.28 $ 0.34 $ 0.35 $ 0.68
Weighted average shares outstanding - diluted Nareit FFO 539,193 538,517 539,081 529,009
Impact of adjustments to Nareit FFO:
Transaction-related items(3) $ 1,265 $ 685 $ 5,379 $ 93,064
Other impairments (recoveries) and other losses (gains), net(4) 1,845 6,291 5,087 (27,015)
Restructuring and severance related charges — — 2,463 —
Loss (gain) on debt extinguishments 60,865 25,824 225,157 24,991
Litigation costs (recoveries) — 100 — 206
Casualty-related charges (recoveries), net 3,596 — 4,644 —
Foreign currency remeasurement losses (gains) — 143 — 153
Tax rate legislation impact(5) — (697) — (3,589)
Total adjustments 67,571 32,346 242,730 87,810
FFO as Adjusted applicable to common shares 217,242 214,713 432,635 441,727
Distributions on dilutive convertible units and other 2,144 1,834 4,067 3,390
Diluted FFO as Adjusted applicable to common shares $ 219,386 $ 216,547 $ 436,702 $ 445,117
Diluted FFO as Adjusted per common share $ 0.40 $ 0.40 $ 0.80 $ 0.84
Weighted average shares outstanding - diluted FFO as Adjusted 546,519 544,018 546,407 529,009
(1) This amount can be reconciled by combining the balances from the corresponding line of the Consolidated Statements of Operations and the detailed financial information in the Discontinued Operations Reconciliation section of this Supplemental Report.
(2) For the six months ended June 30, 2020, includes a $170 million gain upon consolidation of 13 continuing care retirement communities ("CCRCs") in which we acquired Brookdale's interest and began consolidating during the first quarter of 2020. Gains and losses upon change of control are included in other income (expense), net in the Consolidated Statements of Operations.
(3) For the six months ended June 30, 2020, includes the termination fee and transition fee expenses related to terminating the management agreements with Brookdale for 13 CCRCs and transitioning those communities to Life Care Services, LLC, partially offset by the tax benefit recognized related to those expenses. The expenses related to terminating management agreements are included in operating expenses in the Consolidated Statements of Operations.
(4) For the three and six months ended June 30, 2021, includes a $7 million goodwill impairment charge in connection with our senior housing triple-net asset sales which is reported in income (loss) from discontinued operations in the Consolidated Statements of Operations and $6 million of accelerated recognition of a mark-to-market discount, less loan fees, resulting from prepayments on loans receivable which is included in interest income in the Consolidated Statements of Operations. For the six months ended June 30, 2020, includes a $42 million gain on sale of a hospital that was in a direct financing lease ("DFL") which is included in other income (expense), net in the Consolidated Statements of Operations. The remaining activity for the three and six months ended June 30, 2021 and 2020 includes reserves for loan losses and land impairments recognized in impairments and loan loss reserves (recoveries), net in the Consolidated Statements of Operations.
(5) For the three and six months ended June 30, 2020, represents the tax benefit from the CARES Act, which extended the net operating loss carryback period to five years.
Return to TOC11Return to TOC
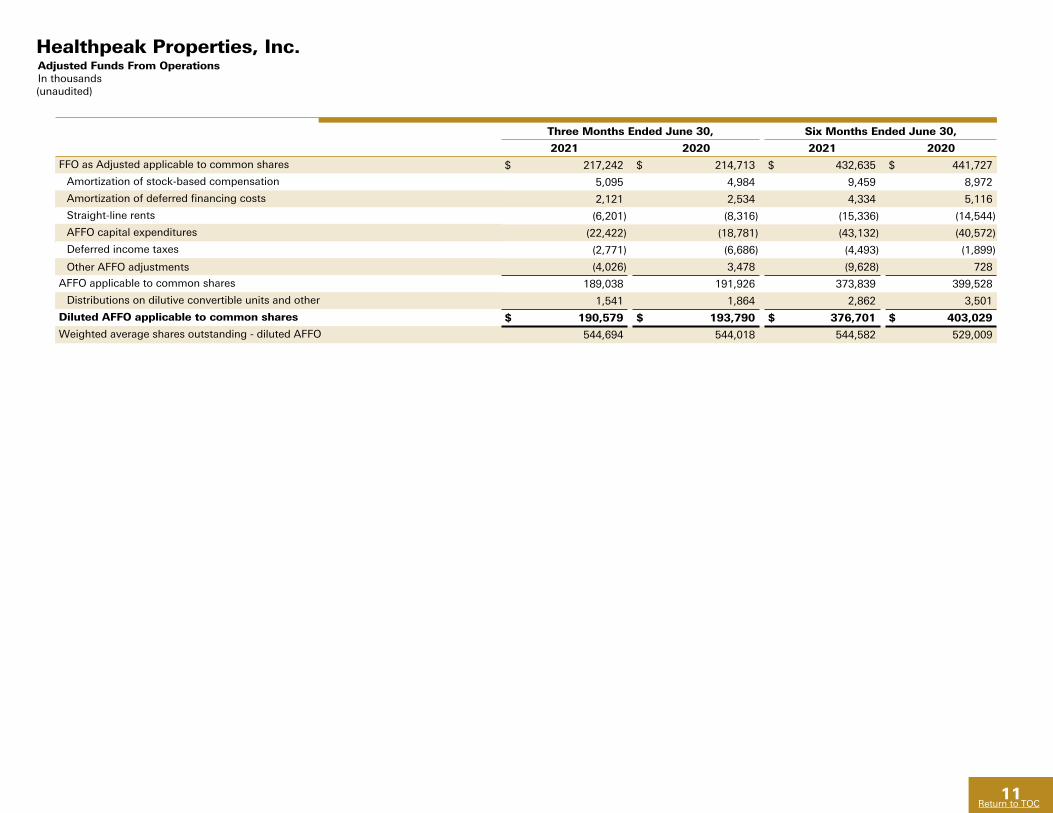
Healthpeak Properties, Inc. Adjusted Funds From Operations In thousands (unaudited)
Three Months Ended June 30, Six Months Ended June 30,
2021 2020 2021 2020
FFO as Adjusted applicable to common shares $ 217,242 $ 214,713 $ 432,635 $ 441,727
Amortization of stock-based compensation 5,095 4,984 9,459 8,972
Amortization of deferred financing costs 2,121 2,534 4,334 5,116
Straight-line rents (6,201) (8,316) (15,336) (14,544)
AFFO capital expenditures (22,422) (18,781) (43,132) (40,572)
Deferred income taxes (2,771) (6,686) (4,493) (1,899)
Other AFFO adjustments (4,026) 3,478 (9,628) 728
AFFO applicable to common shares 189,038 191,926 373,839 399,528
Distributions on dilutive convertible units and other 1,541 1,864 2,862 3,501
Diluted AFFO applicable to common shares $ 190,579 $ 193,790 $ 376,701 $ 403,029
Weighted average shares outstanding - diluted AFFO 544,694 544,018 544,582 529,009
Return to TOC12Return to TOC
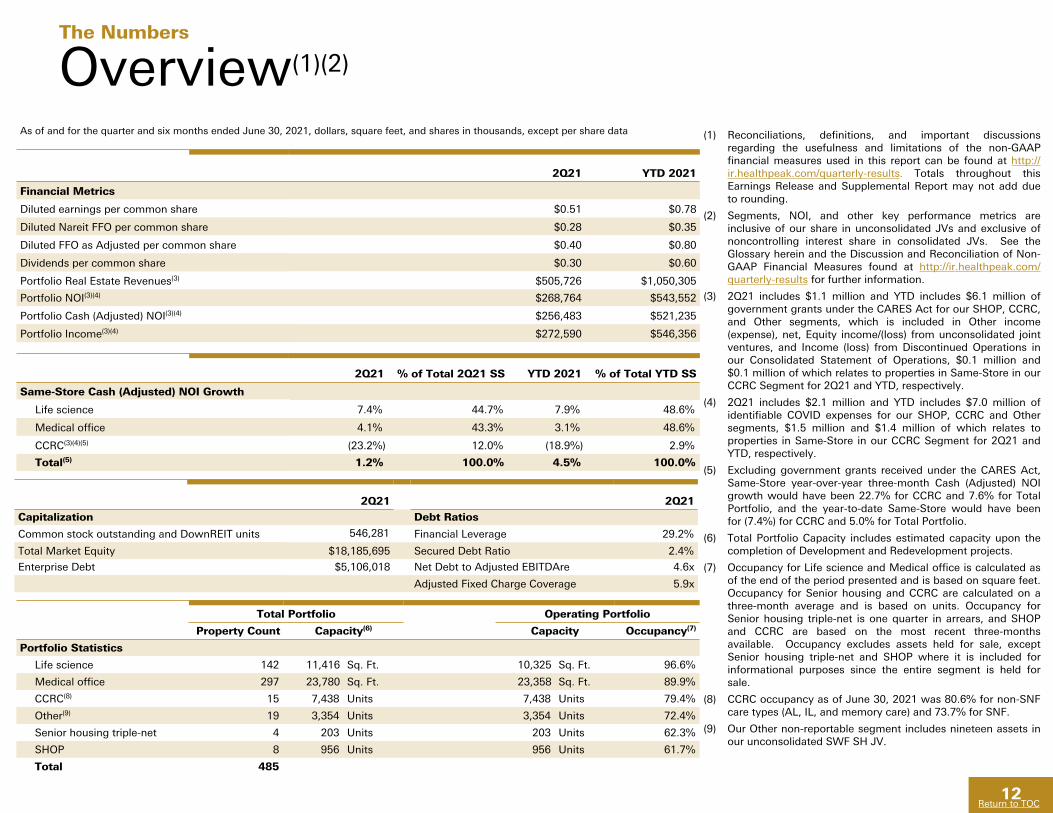
Overview(1)(2)
As of and for the quarter and six months ended June 30, 2021, dollars, square feet, and shares in thousands, except per share data
2Q21 YTD 2021
Financial Metrics
Diluted earnings per common share $0.51 $0.78
Diluted Nareit FFO per common share $0.28 $0.35
Diluted FFO as Adjusted per common share $0.40 $0.80
Dividends per common share $0.30 $0.60
Portfolio Real Estate Revenues(3) $505,726 $1,050,305
Portfolio NOI(3)(4) $268,764 $543,552
Portfolio Cash (Adjusted) NOI(3)(4) $256,483 $521,235
Portfolio Income(3)(4) $272,590 $546,356
2Q21 % of Total 2Q21 SS YTD 2021 % of Total YTD SS
Same-Store Cash (Adjusted) NOI Growth
Life science 7.4% 44.7% 7.9% 48.6%
Medical office 4.1% 43.3% 3.1% 48.6%
CCRC(3)(4)(5) (23.2%) 12.0% (18.9%) 2.9%
Total(5) 1.2% 100.0% 4.5% 100.0%
2Q21 2Q21
Capitalization Debt Ratios
Common stock outstanding and DownREIT units 546,281 Financial Leverage 29.2%
Total Market Equity $18,185,695 Secured Debt Ratio 2.4%
Enterprise Debt $5,106,018 Net Debt to Adjusted EBITDAre 4.6x
Adjusted Fixed Charge Coverage 5.9x
Total Portfolio Operating Portfolio
Property Count Capacity(6) Capacity Occupancy(7)
Portfolio Statistics
Life science 142 11,416 Sq. Ft. 10,325 Sq. Ft. 96.6%
Medical office 297 23,780 Sq. Ft. 23,358 Sq. Ft. 89.9%
CCRC(8) 15 7,438 Units 7,438 Units 79.4%
Other(9) 19 3,354 Units 3,354 Units 72.4%
Senior housing triple-net 4 203 Units 203 Units 62.3%
SHOP 8 956 Units 956 Units 61.7%
Total 485
The Numbers
(1) Reconciliations, definitions, and important discussions regarding the usefulness and limitations of the non-GAAP financial measures used in this report can be found at http://ir.healthpeak.com/quarterly-results. Totals throughout this Earnings Release and Supplemental Report may not add due to rounding.
(2) Segments, NOI, and other key performance metrics are inclusive of our share in unconsolidated JVs and exclusive of noncontrolling interest share in consolidated JVs. See the Glossary herein and the Discussion and Reconciliation of Non-GAAP Financial Measures found at http://ir.healthpeak.com/quarterly-results for further information.
(3) 2Q21 includes $1.1 million and YTD includes $6.1 million of government grants under the CARES Act for our SHOP, CCRC, and Other segments, which is included in Other income (expense), net, Equity income/(loss) from unconsolidated joint ventures, and Income (loss) from Discontinued Operations in our Consolidated Statement of Operations, $0.1 million and $0.1 million of which relates to properties in Same-Store in our CCRC Segment for 2Q21 and YTD, respectively.
(4) 2Q21 includes $2.1 million and YTD includes $7.0 million of identifiable COVID expenses for our SHOP, CCRC and Other segments, $1.5 million and $1.4 million of which relates to properties in Same-Store in our CCRC Segment for 2Q21 and YTD, respectively.
(5) Excluding government grants received under the CARES Act, Same-Store year-over-year three-month Cash (Adjusted) NOI growth would have been 22.7% for CCRC and 7.6% for Total Portfolio, and the year-to-date Same-Store would have been for (7.4%) for CCRC and 5.0% for Total Portfolio.
(6) Total Portfolio Capacity includes estimated capacity upon the completion of Development and Redevelopment projects.
(7) Occupancy for Life science and Medical office is calculated as of the end of the period presented and is based on square feet. Occupancy for Senior housing and CCRC are calculated on a three-month average and is based on units. Occupancy for Senior housing triple-net is one quarter in arrears, and SHOP and CCRC are based on the most recent three-months available. Occupancy excludes assets held for sale, except Senior housing triple-net and SHOP where it is included for informational purposes since the entire segment is held for sale.
(8) CCRC occupancy as of June 30, 2021 was 80.6% for non-SNF care types (AL, IL, and memory care) and 73.7% for SNF.
(9) Our Other non-reportable segment includes nineteen assets in our unconsolidated SWF SH JV.
13
Return to TOC
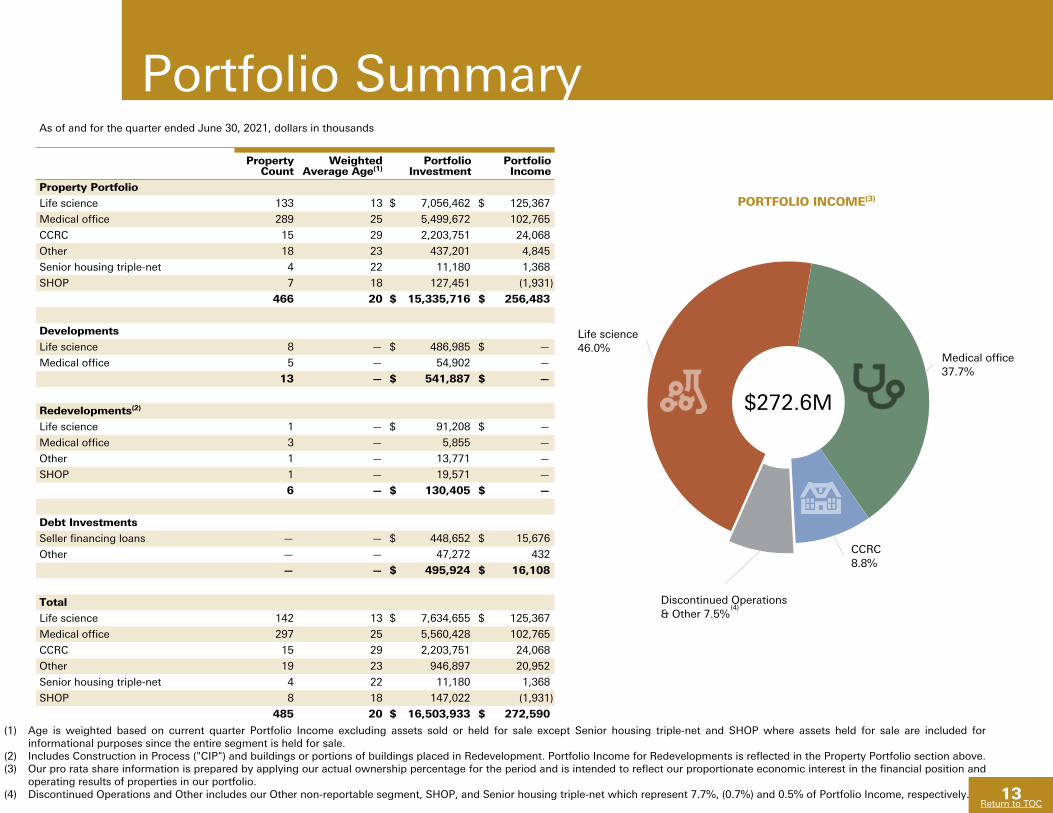
Life science46.0%
Medical office37.7%
CCRC8.8%
Discontinued Operations& Other 7.5%
Portfolio SummaryAs of and for the quarter ended June 30, 2021, dollars in thousands
Property Count
Weighted Average Age(1)
Portfolio Investment
Portfolio Income
Property Portfolio
Life science 133 13 $ 7,056,462 $ 125,367
Medical office 289 25 5,499,672 102,765
CCRC 15 29 2,203,751 24,068
Other 18 23 437,201 4,845
Senior housing triple-net 4 22 11,180 1,368
SHOP 7 18 127,451 (1,931)
466 20 $ 15,335,716 $ 256,483
Developments
Life science 8 — $ 486,985 $ —
Medical office 5 — 54,902 —
13 — $ 541,887 $ —
Redevelopments(2)
Life science 1 — $ 91,208 $ —
Medical office 3 — 5,855 —
Other 1 — 13,771 —
SHOP 1 — 19,571 —
6 — $ 130,405 $ —
Debt Investments
Seller financing loans — — $ 448,652 $ 15,676
Other — — 47,272 432
— — $ 495,924 $ 16,108
Total
Life science 142 13 $ 7,634,655 $ 125,367
Medical office 297 25 5,560,428 102,765
CCRC 15 29 2,203,751 24,068
Other 19 23 946,897 20,952
Senior housing triple-net 4 22 11,180 1,368
SHOP 8 18 147,022 (1,931)
485 20 $ 16,503,933 $ 272,590
(1) Age is weighted based on current quarter Portfolio Income excluding assets sold or held for sale except Senior housing triple-net and SHOP where assets held for sale are included for informational purposes since the entire segment is held for sale.
(2) Includes Construction in Process ("CIP") and buildings or portions of buildings placed in Redevelopment. Portfolio Income for Redevelopments is reflected in the Property Portfolio section above.(3) Our pro rata share information is prepared by applying our actual ownership percentage for the period and is intended to reflect our proportionate economic interest in the financial position and
operating results of properties in our portfolio.(4) Discontinued Operations and Other includes our Other non-reportable segment, SHOP, and Senior housing triple-net which represent 7.7%, (0.7%) and 0.5% of Portfolio Income, respectively.
PORTFOLIO INCOME(3)
$272.6M
(4)
14
Return to TOC
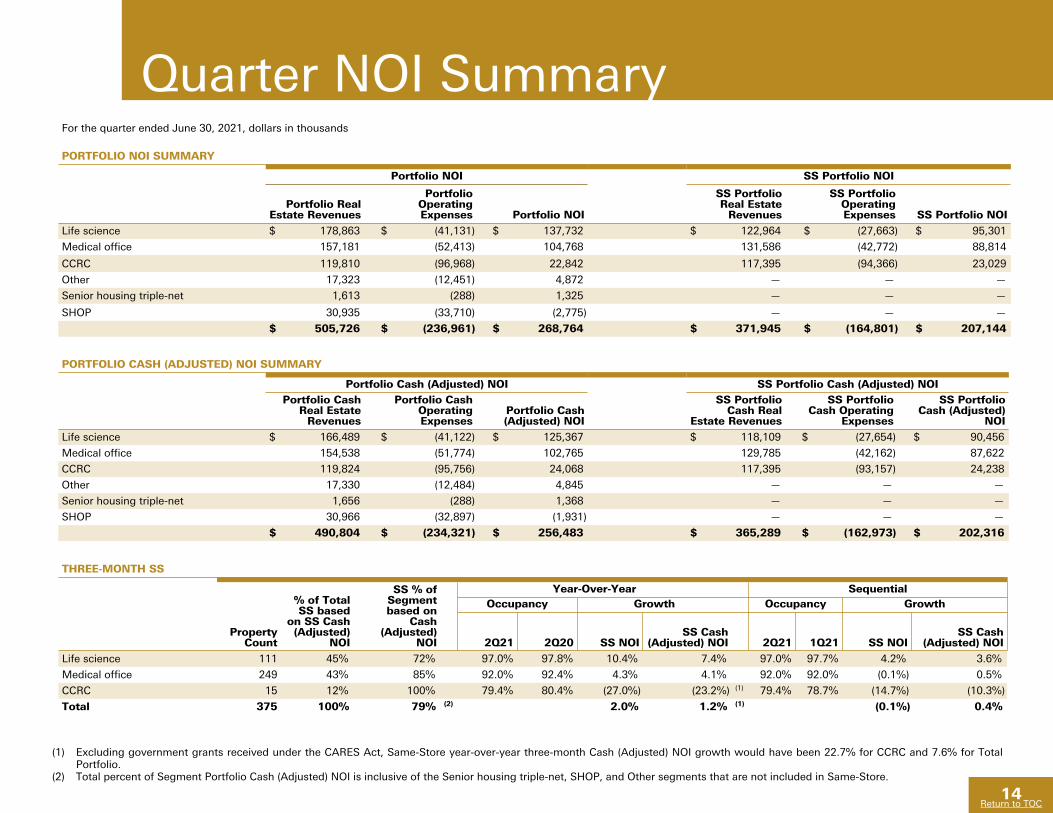
Quarter NOI SummaryFor the quarter ended June 30, 2021, dollars in thousands
PORTFOLIO NOI SUMMARY
Portfolio NOI SS Portfolio NOI
Portfolio Real Estate Revenues
Portfolio Operating Expenses Portfolio NOI
SS Portfolio Real Estate
Revenues
SS Portfolio Operating Expenses SS Portfolio NOI
Life science $ 178,863 $ (41,131) $ 137,732 $ 122,964 $ (27,663) $ 95,301
Medical office 157,181 (52,413) 104,768 131,586 (42,772) 88,814
CCRC 119,810 (96,968) 22,842 117,395 (94,366) 23,029
Other 17,323 (12,451) 4,872 — — —
Senior housing triple-net 1,613 (288) 1,325 — — —
SHOP 30,935 (33,710) (2,775) — — —
$ 505,726 $ (236,961) $ 268,764 $ 371,945 $ (164,801) $ 207,144
PORTFOLIO CASH (ADJUSTED) NOI SUMMARY
Portfolio Cash (Adjusted) NOI SS Portfolio Cash (Adjusted) NOIPortfolio Cash
Real Estate Revenues
Portfolio Cash Operating Expenses
Portfolio Cash (Adjusted) NOI
SS Portfolio Cash Real
Estate Revenues
SS Portfolio Cash Operating
Expenses
SS Portfolio Cash (Adjusted)
NOI
Life science $ 166,489 $ (41,122) $ 125,367 $ 118,109 $ (27,654) $ 90,456
Medical office 154,538 (51,774) 102,765 129,785 (42,162) 87,622
CCRC 119,824 (95,756) 24,068 117,395 (93,157) 24,238
Other 17,330 (12,484) 4,845 — — —
Senior housing triple-net 1,656 (288) 1,368 — — —
SHOP 30,966 (32,897) (1,931) — — —
$ 490,804 $ (234,321) $ 256,483 $ 365,289 $ (162,973) $ 202,316
THREE-MONTH SS
Property Count
% of Total SS based
on SS Cash (Adjusted)
NOI
SS % of Segment based on
Cash (Adjusted)
NOI
Year-Over-Year SequentialOccupancy Growth Occupancy Growth
2Q21 2Q20 SS NOISS Cash
(Adjusted) NOI 2Q21 1Q21 SS NOISS Cash
(Adjusted) NOI
Life science 111 45% 72% 97.0% 97.8% 10.4% 7.4% 97.0% 97.7% 4.2% 3.6%
Medical office 249 43% 85% 92.0% 92.4% 4.3% 4.1% 92.0% 92.0% (0.1%) 0.5%
CCRC 15 12% 100% 79.4% 80.4% (27.0%) (23.2%) (1) 79.4% 78.7% (14.7%) (10.3%)
Total 375 100% 79% (2) 2.0% 1.2% (1) (0.1%) 0.4%
(1) Excluding government grants received under the CARES Act, Same-Store year-over-year three-month Cash (Adjusted) NOI growth would have been 22.7% for CCRC and 7.6% for Total Portfolio.
(2) Total percent of Segment Portfolio Cash (Adjusted) NOI is inclusive of the Senior housing triple-net, SHOP, and Other segments that are not included in Same-Store.
15
Return to TOC
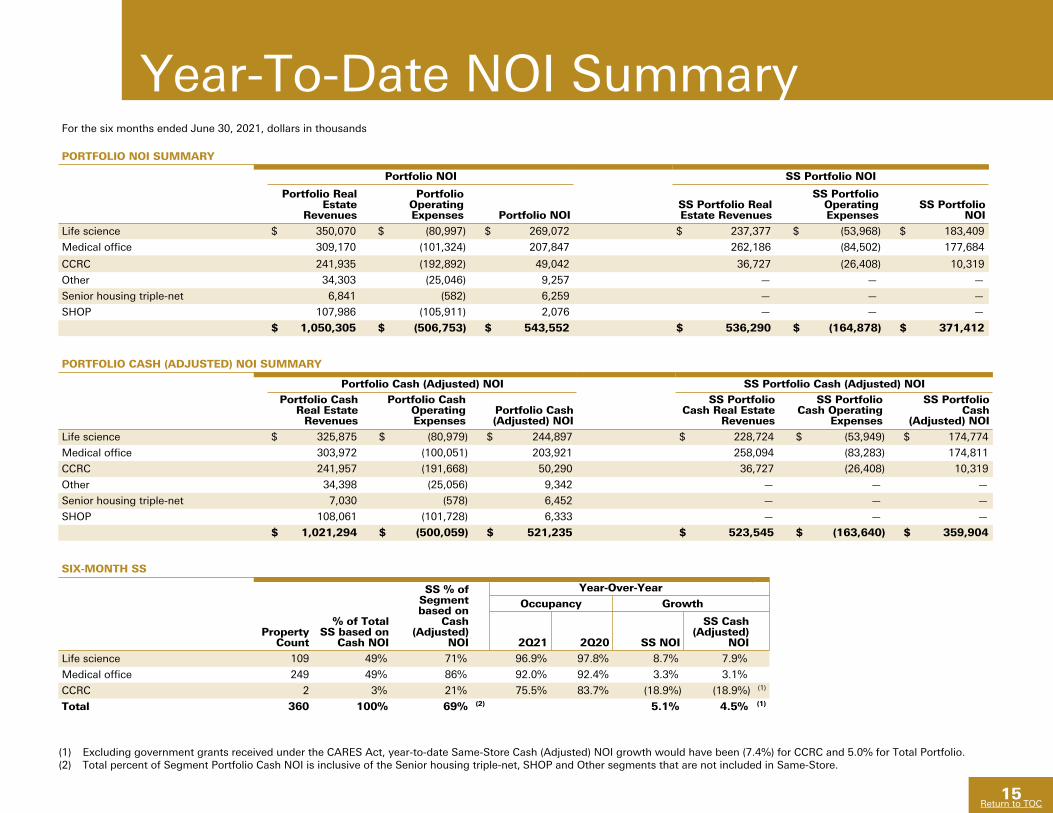
Year-To-Date NOI SummaryFor the six months ended June 30, 2021, dollars in thousands
PORTFOLIO NOI SUMMARY
Portfolio NOI SS Portfolio NOI
Portfolio Real Estate
Revenues
Portfolio Operating Expenses Portfolio NOI
SS Portfolio Real Estate Revenues
SS Portfolio Operating Expenses
SS Portfolio NOI
Life science $ 350,070 $ (80,997) $ 269,072 $ 237,377 $ (53,968) $ 183,409
Medical office 309,170 (101,324) 207,847 262,186 (84,502) 177,684
CCRC 241,935 (192,892) 49,042 36,727 (26,408) 10,319
Other 34,303 (25,046) 9,257 — — —
Senior housing triple-net 6,841 (582) 6,259 — — —
SHOP 107,986 (105,911) 2,076 — — —
$ 1,050,305 $ (506,753) $ 543,552 $ 536,290 $ (164,878) $ 371,412
PORTFOLIO CASH (ADJUSTED) NOI SUMMARY
Portfolio Cash (Adjusted) NOI SS Portfolio Cash (Adjusted) NOIPortfolio Cash
Real Estate Revenues
Portfolio Cash Operating Expenses
Portfolio Cash (Adjusted) NOI
SS Portfolio Cash Real Estate
Revenues
SS Portfolio Cash Operating
Expenses
SS Portfolio Cash
(Adjusted) NOI
Life science $ 325,875 $ (80,979) $ 244,897 $ 228,724 $ (53,949) $ 174,774
Medical office 303,972 (100,051) 203,921 258,094 (83,283) 174,811
CCRC 241,957 (191,668) 50,290 36,727 (26,408) 10,319
Other 34,398 (25,056) 9,342 — — —
Senior housing triple-net 7,030 (578) 6,452 — — —
SHOP 108,061 (101,728) 6,333 — — —
$ 1,021,294 $ (500,059) $ 521,235 $ 523,545 $ (163,640) $ 359,904
SIX-MONTH SS
% of Total SS based on
Cash NOI
SS % of Segment based on
Cash (Adjusted)
NOI
Year-Over-Year
Property Count
Occupancy Growth
2Q21 2Q20 SS NOI
SS Cash (Adjusted)
NOI
Life science 109 49% 71% 96.9% 97.8% 8.7% 7.9%
Medical office 249 49% 86% 92.0% 92.4% 3.3% 3.1%
CCRC 2 3% 21% 75.5% 83.7% (18.9%) (18.9%) (1)
Total 360 100% 69% (2) 5.1% 4.5% (1)
(1) Excluding government grants received under the CARES Act, year-to-date Same-Store Cash (Adjusted) NOI growth would have been (7.4%) for CCRC and 5.0% for Total Portfolio.(2) Total percent of Segment Portfolio Cash NOI is inclusive of the Senior housing triple-net, SHOP and Other segments that are not included in Same-Store.
16
Return to TOC
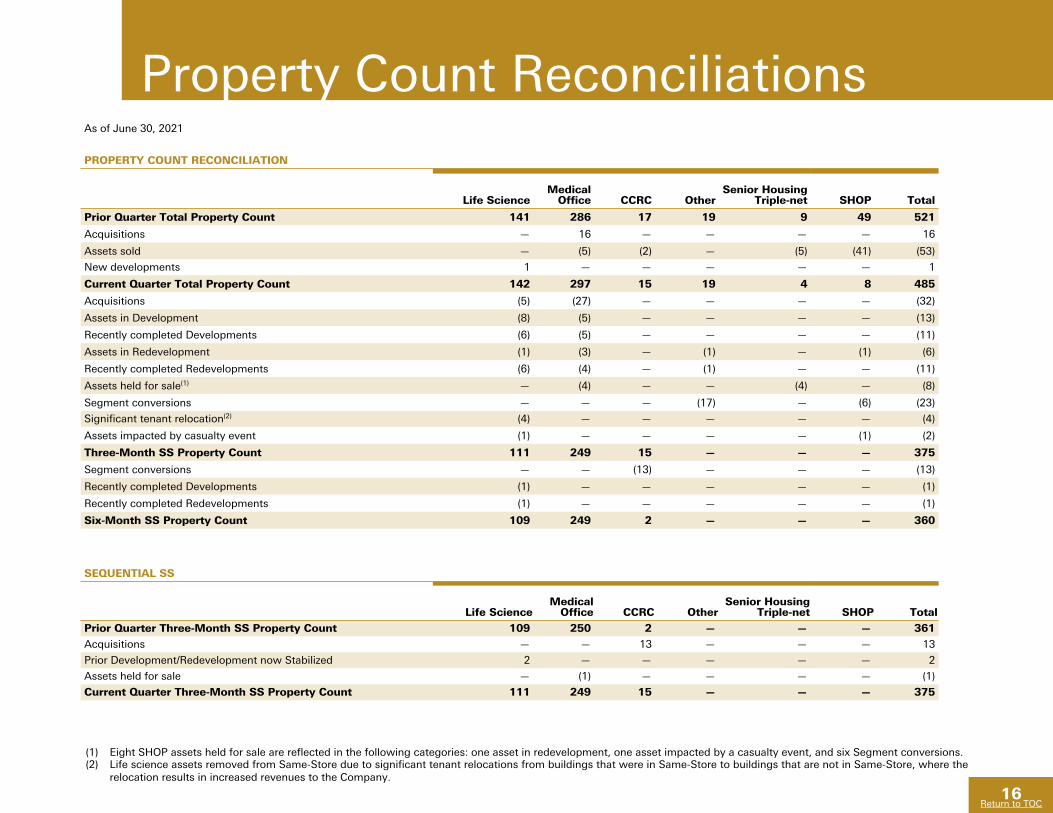
Property Count Reconciliations
SEQUENTIAL SS
Life ScienceMedical
Office CCRC OtherSenior Housing
Triple-net SHOP Total
Prior Quarter Three-Month SS Property Count 109 250 2 — — — 361
Acquisitions — — 13 — — — 13
Prior Development/Redevelopment now Stabilized 2 — — — — — 2
Assets held for sale — (1) — — — — (1)
Current Quarter Three-Month SS Property Count 111 249 15 — — — 375
As of June 30, 2021
PROPERTY COUNT RECONCILIATION
Life ScienceMedical
Office CCRC OtherSenior Housing
Triple-net SHOP Total
Prior Quarter Total Property Count 141 286 17 19 9 49 521
Acquisitions — 16 — — — — 16
Assets sold — (5) (2) — (5) (41) (53)
New developments 1 — — — — — 1
Current Quarter Total Property Count 142 297 15 19 4 8 485
Acquisitions (5) (27) — — — — (32)
Assets in Development (8) (5) — — — — (13)
Recently completed Developments (6) (5) — — — — (11)
Assets in Redevelopment (1) (3) — (1) — (1) (6)
Recently completed Redevelopments (6) (4) — (1) — — (11)
Assets held for sale(1) — (4) — — (4) — (8)
Segment conversions — — — (17) — (6) (23)
Significant tenant relocation(2) (4) — — — — — (4)
Assets impacted by casualty event (1) — — — — (1) (2)
Three-Month SS Property Count 111 249 15 — — — 375
Segment conversions — — (13) — — — (13)
Recently completed Developments (1) — — — — — (1)
Recently completed Redevelopments (1) — — — — — (1)
Six-Month SS Property Count 109 249 2 — — — 360
(1) Eight SHOP assets held for sale are reflected in the following categories: one asset in redevelopment, one asset impacted by a casualty event, and six Segment conversions.(2) Life science assets removed from Same-Store due to significant tenant relocations from buildings that were in Same-Store to buildings that are not in Same-Store, where the
relocation results in increased revenues to the Company.
17
Return to TOC
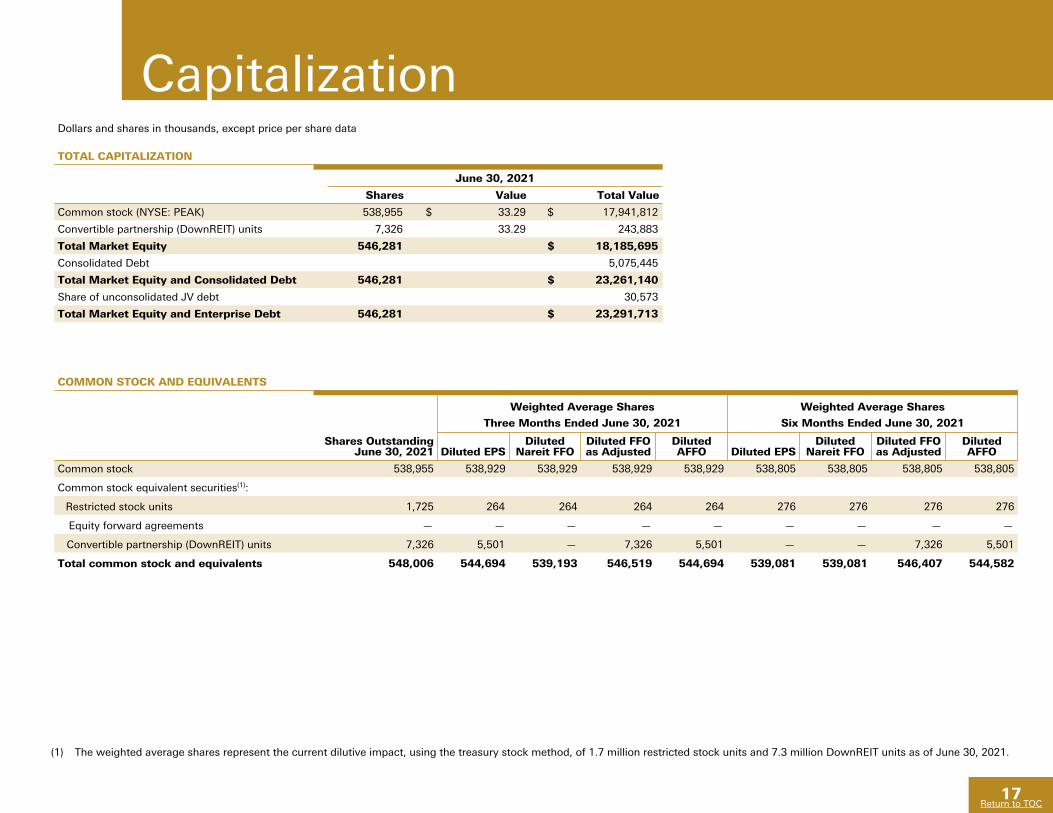
CapitalizationDollars and shares in thousands, except price per share data
TOTAL CAPITALIZATION
June 30, 2021
Shares Value Total Value
Common stock (NYSE: PEAK) 538,955 $ 33.29 $ 17,941,812
Convertible partnership (DownREIT) units 7,326 33.29 243,883
Total Market Equity 546,281 $ 18,185,695
Consolidated Debt 5,075,445
Total Market Equity and Consolidated Debt 546,281 $ 23,261,140
Share of unconsolidated JV debt 30,573
Total Market Equity and Enterprise Debt 546,281 $ 23,291,713
COMMON STOCK AND EQUIVALENTS
Weighted Average Shares Weighted Average Shares
Three Months Ended June 30, 2021 Six Months Ended June 30, 2021
Shares Outstanding June 30, 2021 Diluted EPS
Diluted Nareit FFO
Diluted FFO as Adjusted
Diluted AFFO Diluted EPS
Diluted Nareit FFO
Diluted FFO as Adjusted
Diluted AFFO
Common stock 538,955 538,929 538,929 538,929 538,929 538,805 538,805 538,805 538,805
Common stock equivalent securities(1):
Restricted stock units 1,725 264 264 264 264 276 276 276 276
Equity forward agreements — — — — — — — — —
Convertible partnership (DownREIT) units 7,326 5,501 — 7,326 5,501 — — 7,326 5,501
Total common stock and equivalents 548,006 544,694 539,193 546,519 544,694 539,081 539,081 546,407 544,582
(1) The weighted average shares represent the current dilutive impact, using the treasury stock method, of 1.7 million restricted stock units and 7.3 million DownREIT units as of June 30, 2021.
18
Return to TOC
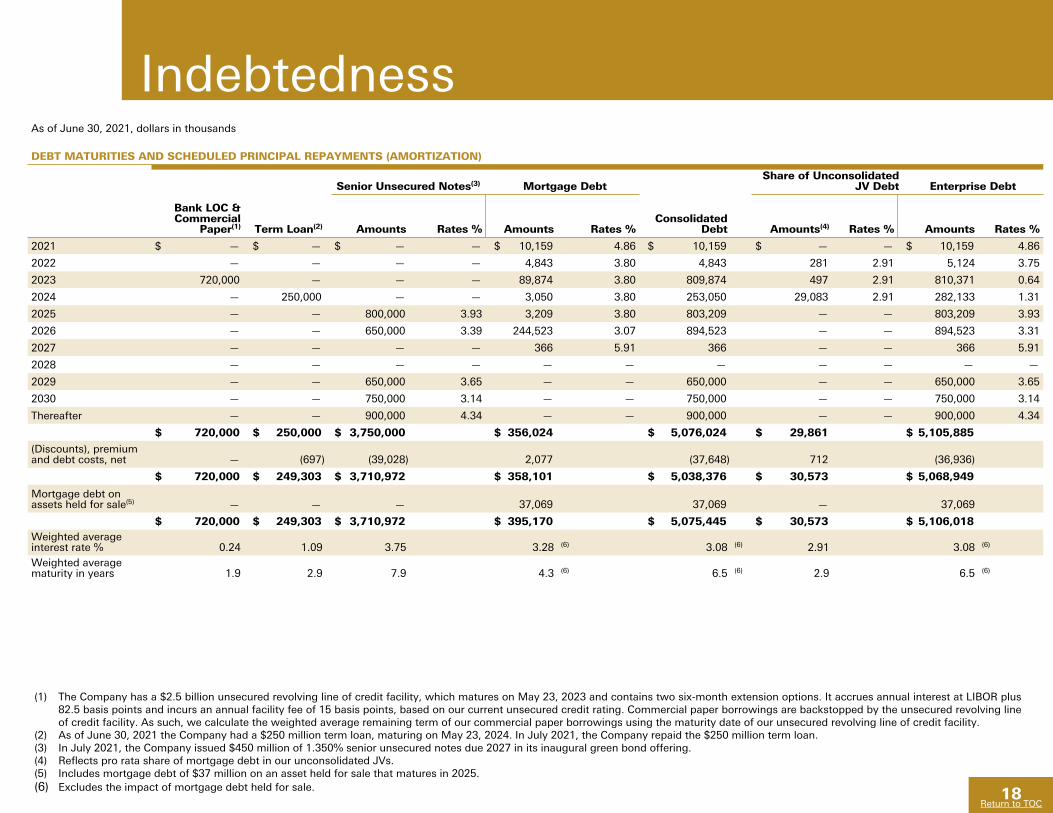
IndebtednessAs of June 30, 2021, dollars in thousands
DEBT MATURITIES AND SCHEDULED PRINCIPAL REPAYMENTS (AMORTIZATION)
Senior Unsecured Notes(3) Mortgage DebtShare of Unconsolidated
JV Debt Enterprise Debt
Bank LOC & Commercial
Paper(1) Term Loan(2) Amounts Rates % Amounts Rates %Consolidated
Debt Amounts(4) Rates % Amounts Rates %
2021 $ — $ — $ — — $ 10,159 4.86 $ 10,159 $ — — $ 10,159 4.86
2022 — — — — 4,843 3.80 4,843 281 2.91 5,124 3.75
2023 720,000 — — — 89,874 3.80 809,874 497 2.91 810,371 0.64
2024 — 250,000 — — 3,050 3.80 253,050 29,083 2.91 282,133 1.31
2025 — — 800,000 3.93 3,209 3.80 803,209 — — 803,209 3.93
2026 — — 650,000 3.39 244,523 3.07 894,523 — — 894,523 3.31
2027 — — — — 366 5.91 366 — — 366 5.91
2028 — — — — — — — — — — —
2029 — — 650,000 3.65 — — 650,000 — — 650,000 3.65
2030 — — 750,000 3.14 — — 750,000 — — 750,000 3.14
Thereafter — — 900,000 4.34 — — 900,000 — — 900,000 4.34
$ 720,000 $ 250,000 $ 3,750,000 $ 356,024 $ 5,076,024 $ 29,861 $ 5,105,885
(Discounts), premium and debt costs, net — (697) (39,028) 2,077 (37,648) 712 (36,936)
$ 720,000 $ 249,303 $ 3,710,972 $ 358,101 $ 5,038,376 $ 30,573 $ 5,068,949
Mortgage debt on assets held for sale(5) — — — 37,069 37,069 — 37,069
$ 720,000 $ 249,303 $ 3,710,972 $ 395,170 $ 5,075,445 $ 30,573 $ 5,106,018 Weighted average interest rate % 0.24 1.09 3.75 3.28 (6) 3.08 (6) 2.91 3.08 (6)
Weighted average maturity in years 1.9 2.9 7.9 4.3 (6) 6.5 (6) 2.9 6.5 (6)
(1) The Company has a $2.5 billion unsecured revolving line of credit facility, which matures on May 23, 2023 and contains two six-month extension options. It accrues annual interest at LIBOR plus 82.5 basis points and incurs an annual facility fee of 15 basis points, based on our current unsecured credit rating. Commercial paper borrowings are backstopped by the unsecured revolving line of credit facility. As such, we calculate the weighted average remaining term of our commercial paper borrowings using the maturity date of our unsecured revolving line of credit facility.
(2) As of June 30, 2021 the Company had a $250 million term loan, maturing on May 23, 2024. In July 2021, the Company repaid the $250 million term loan. (3) In July 2021, the Company issued $450 million of 1.350% senior unsecured notes due 2027 in its inaugural green bond offering. (4) Reflects pro rata share of mortgage debt in our unconsolidated JVs. (5) Includes mortgage debt of $37 million on an asset held for sale that matures in 2025. (6) Excludes the impact of mortgage debt held for sale.
19
Return to TOC
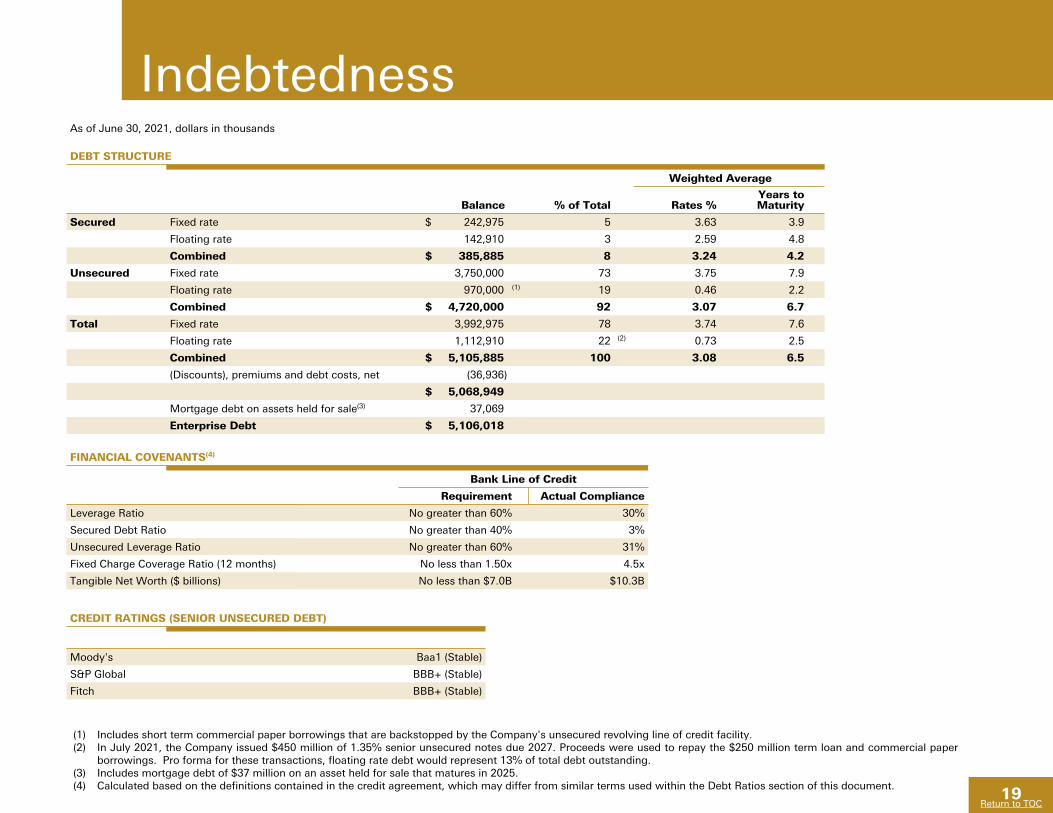
IndebtednessAs of June 30, 2021, dollars in thousands
DEBT STRUCTURE
Weighted Average
Balance % of Total Rates %Years to Maturity
Secured Fixed rate $ 242,975 5 3.63 3.9
Floating rate 142,910 3 2.59 4.8
Combined $ 385,885 8 3.24 4.2
Unsecured Fixed rate 3,750,000 73 3.75 7.9
Floating rate 970,000 (1) 19 0.46 2.2
Combined $ 4,720,000 92 3.07 6.7
Total Fixed rate 3,992,975 78 3.74 7.6
Floating rate 1,112,910 22 (2) 0.73 2.5
Combined $ 5,105,885 100 3.08 6.5
(Discounts), premiums and debt costs, net (36,936)
$ 5,068,949
Mortgage debt on assets held for sale(3) 37,069
Enterprise Debt $ 5,106,018
FINANCIAL COVENANTS(4)
Bank Line of Credit
Requirement Actual Compliance
Leverage Ratio No greater than 60% 30%
Secured Debt Ratio No greater than 40% 3%
Unsecured Leverage Ratio No greater than 60% 31%
Fixed Charge Coverage Ratio (12 months) No less than 1.50x 4.5x
Tangible Net Worth ($ billions) No less than $7.0B $10.3B
CREDIT RATINGS (SENIOR UNSECURED DEBT)
Moody's Baa1 (Stable)
S&P Global BBB+ (Stable)
Fitch BBB+ (Stable)
(1) Includes short term commercial paper borrowings that are backstopped by the Company's unsecured revolving line of credit facility. (2) In July 2021, the Company issued $450 million of 1.35% senior unsecured notes due 2027. Proceeds were used to repay the $250 million term loan and commercial paper
borrowings. Pro forma for these transactions, floating rate debt would represent 13% of total debt outstanding.(3) Includes mortgage debt of $37 million on an asset held for sale that matures in 2025.(4) Calculated based on the definitions contained in the credit agreement, which may differ from similar terms used within the Debt Ratios section of this document.
20
Return to TOC
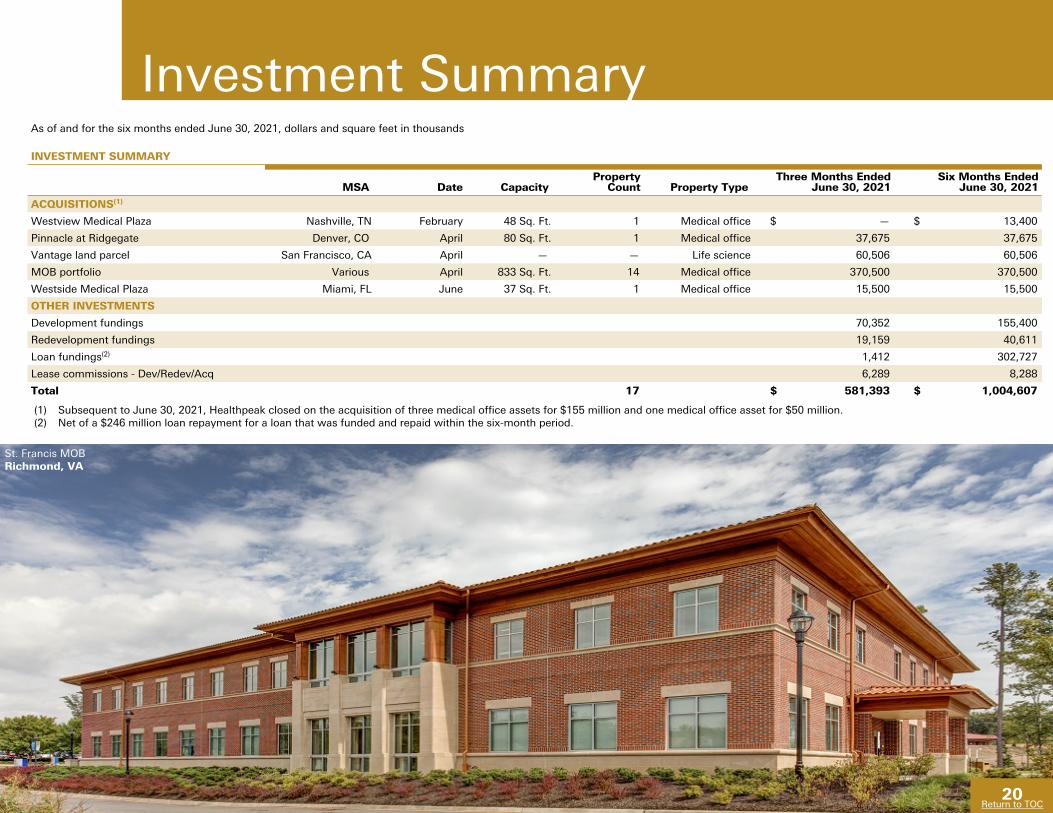
(1) Subsequent to June 30, 2021, Healthpeak closed on the acquisition of three medical office assets for $155 million and one medical office asset for $50 million.(2) Net of a $246 million loan repayment for a loan that was funded and repaid within the six-month period.
Investment SummaryAs of and for the six months ended June 30, 2021, dollars and square feet in thousands
INVESTMENT SUMMARY
MSA Date CapacityProperty
Count Property TypeThree Months Ended
June 30, 2021Six Months Ended
June 30, 2021
ACQUISITIONS(1)
Westview Medical Plaza Nashville, TN February 48 Sq. Ft. 1 Medical office $ — $ 13,400
Pinnacle at Ridgegate Denver, CO April 80 Sq. Ft. 1 Medical office 37,675 37,675
Vantage land parcel San Francisco, CA April — — Life science 60,506 60,506
MOB portfolio Various April 833 Sq. Ft. 14 Medical office 370,500 370,500
Westside Medical Plaza Miami, FL June 37 Sq. Ft. 1 Medical office 15,500 15,500
OTHER INVESTMENTS
Development fundings 70,352 155,400
Redevelopment fundings 19,159 40,611
Loan fundings(2) 1,412 302,727
Lease commissions - Dev/Redev/Acq 6,289 8,288
Total 17 $ 581,393 $ 1,004,607
20Return to TOC
St. Francis MOBRichmond, VA
21
Return to TOC
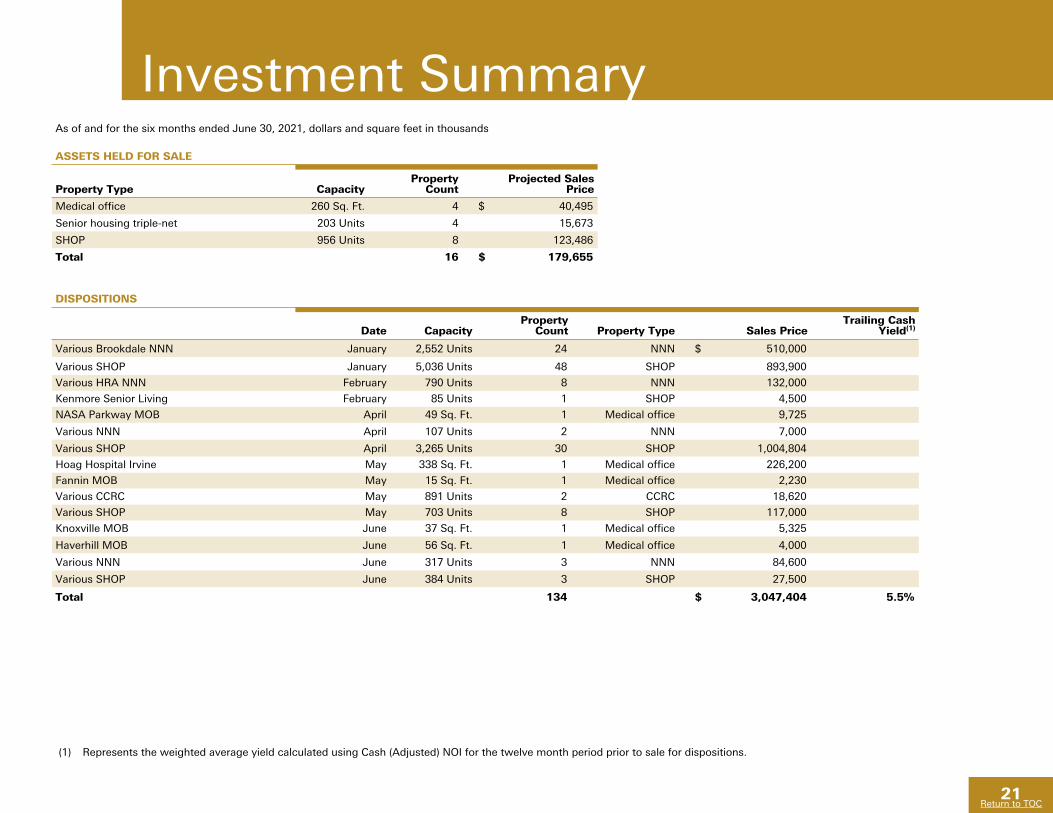
Investment SummaryAs of and for the six months ended June 30, 2021, dollars and square feet in thousands
ASSETS HELD FOR SALE
Property Type CapacityProperty
CountProjected Sales
Price
Medical office 260 Sq. Ft. 4 $ 40,495
Senior housing triple-net 203 Units 4 15,673
SHOP 956 Units 8 123,486
Total 16 $ 179,655
DISPOSITIONS
Date CapacityProperty
Count Property Type Sales PriceTrailing Cash
Yield(1)
Various Brookdale NNN January 2,552 Units 24 NNN $ 510,000
Various SHOP January 5,036 Units 48 SHOP 893,900
Various HRA NNN February 790 Units 8 NNN 132,000
Kenmore Senior Living February 85 Units 1 SHOP 4,500
NASA Parkway MOB April 49 Sq. Ft. 1 Medical office 9,725
Various NNN April 107 Units 2 NNN 7,000
Various SHOP April 3,265 Units 30 SHOP 1,004,804
Hoag Hospital Irvine May 338 Sq. Ft. 1 Medical office 226,200
Fannin MOB May 15 Sq. Ft. 1 Medical office 2,230
Various CCRC May 891 Units 2 CCRC 18,620
Various SHOP May 703 Units 8 SHOP 117,000
Knoxville MOB June 37 Sq. Ft. 1 Medical office 5,325
Haverhill MOB June 56 Sq. Ft. 1 Medical office 4,000
Various NNN June 317 Units 3 NNN 84,600
Various SHOP June 384 Units 3 SHOP 27,500
Total 134 $ 3,047,404 5.5%
(1) Represents the weighted average yield calculated using Cash (Adjusted) NOI for the twelve month period prior to sale for dispositions.
22
Return to TOC
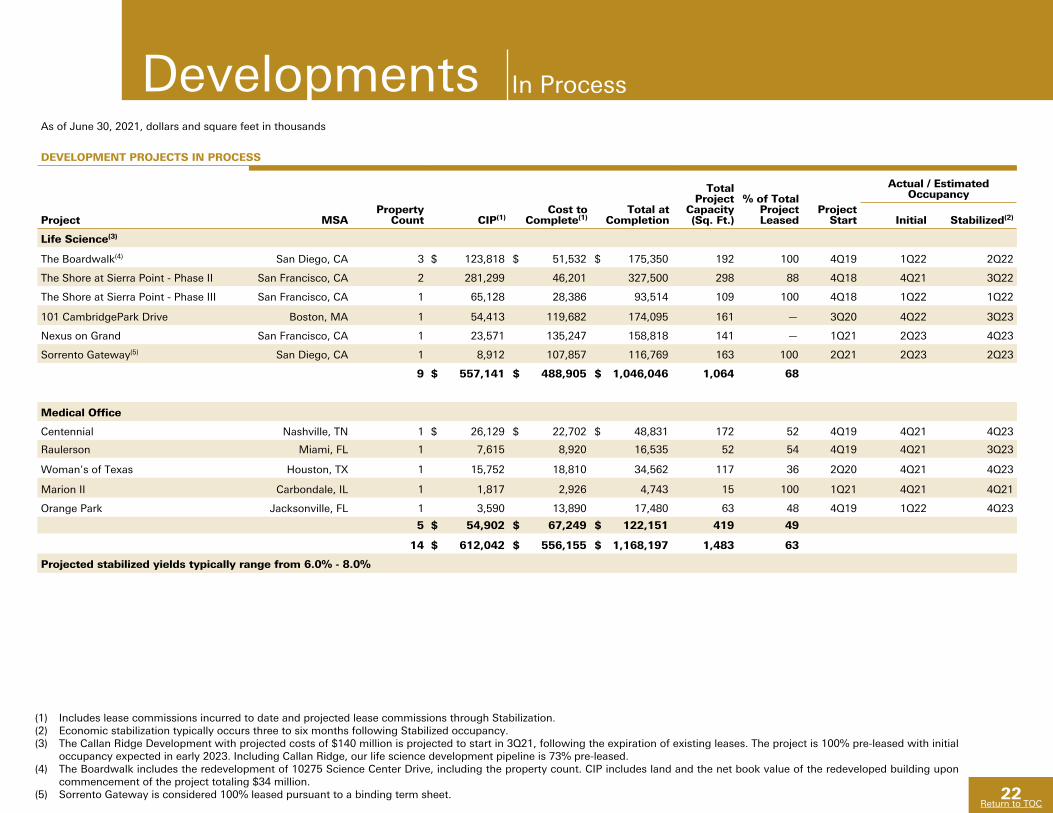
DevelopmentsAs of June 30, 2021, dollars and square feet in thousands
DEVELOPMENT PROJECTS IN PROCESS
Property Count CIP(1)
Cost to Complete(1)
Total at Completion
Total Project
Capacity (Sq. Ft.)
% of Total Project Leased
Project Start
Actual / Estimated Occupancy
Project MSA Initial Stabilized(2)
Life Science(3)
The Boardwalk(4) San Diego, CA 3 $ 123,818 $ 51,532 $ 175,350 192 100 4Q19 1Q22 2Q22
The Shore at Sierra Point - Phase II San Francisco, CA 2 281,299 46,201 327,500 298 88 4Q18 4Q21 3Q22
The Shore at Sierra Point - Phase III San Francisco, CA 1 65,128 28,386 93,514 109 100 4Q18 1Q22 1Q22
101 CambridgePark Drive Boston, MA 1 54,413 119,682 174,095 161 — 3Q20 4Q22 3Q23
Nexus on Grand San Francisco, CA 1 23,571 135,247 158,818 141 — 1Q21 2Q23 4Q23
Sorrento Gateway(5) San Diego, CA 1 8,912 107,857 116,769 163 100 2Q21 2Q23 2Q23
9 $ 557,141 $ 488,905 $ 1,046,046 1,064 68
Medical Office
Centennial Nashville, TN 1 $ 26,129 $ 22,702 $ 48,831 172 52 4Q19 4Q21 4Q23
Raulerson Miami, FL 1 7,615 8,920 16,535 52 54 4Q19 4Q21 3Q23
Woman's of Texas Houston, TX 1 15,752 18,810 34,562 117 36 2Q20 4Q21 4Q23
Marion II Carbondale, IL 1 1,817 2,926 4,743 15 100 1Q21 4Q21 4Q21
Orange Park Jacksonville, FL 1 3,590 13,890 17,480 63 48 4Q19 1Q22 4Q23
5 $ 54,902 $ 67,249 $ 122,151 419 49
14 $ 612,042 $ 556,155 $ 1,168,197 1,483 63
Projected stabilized yields typically range from 6.0% - 8.0%
(1) Includes lease commissions incurred to date and projected lease commissions through Stabilization.(2) Economic stabilization typically occurs three to six months following Stabilized occupancy.(3) The Callan Ridge Development with projected costs of $140 million is projected to start in 3Q21, following the expiration of existing leases. The project is 100% pre-leased with initial
occupancy expected in early 2023. Including Callan Ridge, our life science development pipeline is 73% pre-leased.(4) The Boardwalk includes the redevelopment of 10275 Science Center Drive, including the property count. CIP includes land and the net book value of the redeveloped building upon
commencement of the project totaling $34 million.(5) Sorrento Gateway is considered 100% leased pursuant to a binding term sheet.
In Process
23
Return to TOC
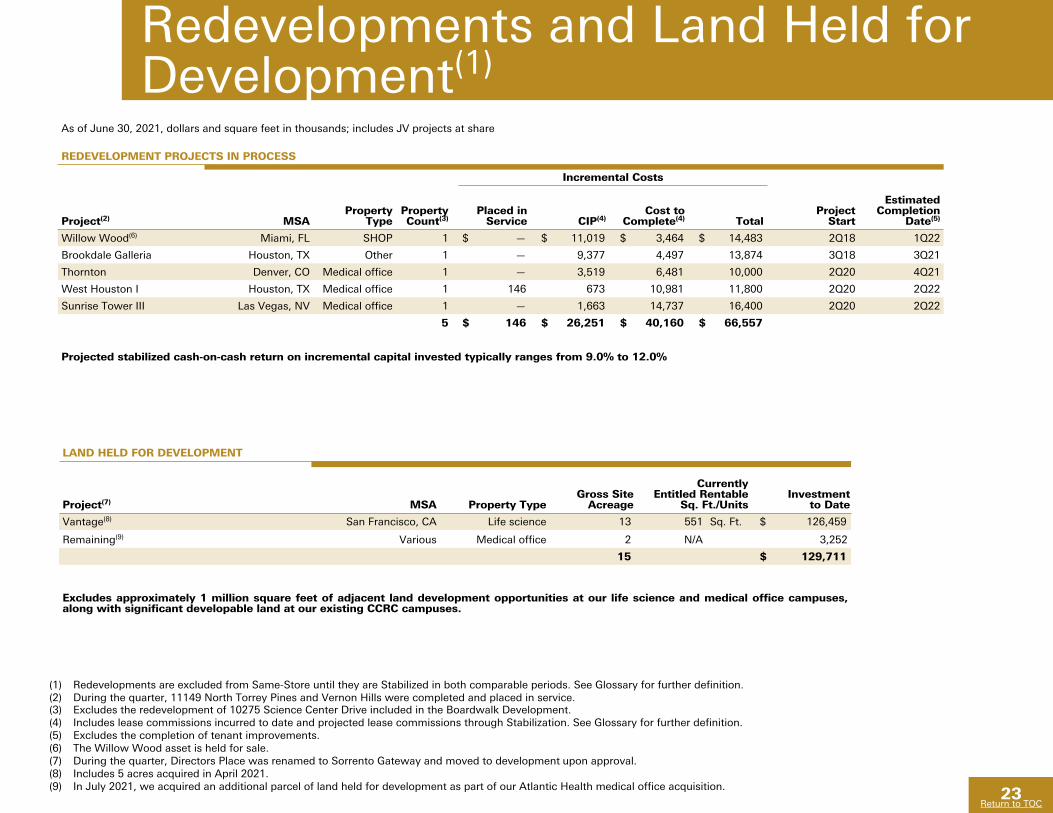
Redevelopments and Land Held for Development(1)
LAND HELD FOR DEVELOPMENT
Project(7) MSA Property TypeGross Site
Acreage
Currently Entitled Rentable
Sq. Ft./UnitsInvestment
to Date
Vantage(8) San Francisco, CA Life science 13 551 Sq. Ft. $ 126,459
Remaining(9) Various Medical office 2 N/A 3,252
15 $ 129,711
Excludes approximately 1 million square feet of adjacent land development opportunities at our life science and medical office campuses, along with significant developable land at our existing CCRC campuses.
(1) Redevelopments are excluded from Same-Store until they are Stabilized in both comparable periods. See Glossary for further definition.(2) During the quarter, 11149 North Torrey Pines and Vernon Hills were completed and placed in service.(3) Excludes the redevelopment of 10275 Science Center Drive included in the Boardwalk Development.(4) Includes lease commissions incurred to date and projected lease commissions through Stabilization. See Glossary for further definition.(5) Excludes the completion of tenant improvements.(6) The Willow Wood asset is held for sale.(7) During the quarter, Directors Place was renamed to Sorrento Gateway and moved to development upon approval.(8) Includes 5 acres acquired in April 2021.(9) In July 2021, we acquired an additional parcel of land held for development as part of our Atlantic Health medical office acquisition.
As of June 30, 2021, dollars and square feet in thousands; includes JV projects at share
REDEVELOPMENT PROJECTS IN PROCESS
Incremental Costs
Project(2) MSAProperty
TypeProperty Count(3)
Placed in Service CIP(4)
Cost to Complete(4) Total
Project Start
Estimated Completion
Date(5)
Willow Wood(6) Miami, FL SHOP 1 $ — $ 11,019 $ 3,464 $ 14,483 2Q18 1Q22
Brookdale Galleria Houston, TX Other 1 — 9,377 4,497 13,874 3Q18 3Q21
Thornton Denver, CO Medical office 1 — 3,519 6,481 10,000 2Q20 4Q21
West Houston I Houston, TX Medical office 1 146 673 10,981 11,800 2Q20 2Q22
Sunrise Tower III Las Vegas, NV Medical office 1 — 1,663 14,737 16,400 2Q20 2Q22
5 $ 146 $ 26,251 $ 40,160 $ 66,557
Projected stabilized cash-on-cash return on incremental capital invested typically ranges from 9.0% to 12.0%
24
Return to TOC
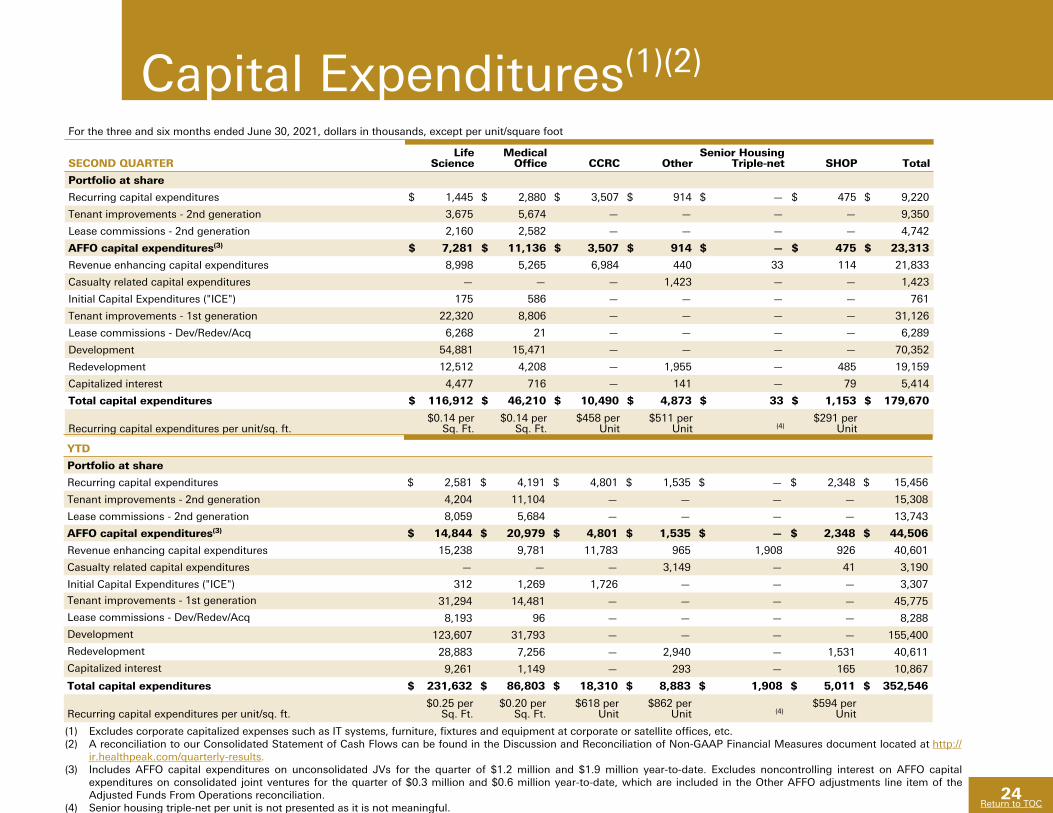
Capital Expenditures(1)(2)
(1) Excludes corporate capitalized expenses such as IT systems, furniture, fixtures and equipment at corporate or satellite offices, etc.(2) A reconciliation to our Consolidated Statement of Cash Flows can be found in the Discussion and Reconciliation of Non-GAAP Financial Measures document located at http://
ir.healthpeak.com/quarterly-results.(3) Includes AFFO capital expenditures on unconsolidated JVs for the quarter of $1.2 million and $1.9 million year-to-date. Excludes noncontrolling interest on AFFO capital
expenditures on consolidated joint ventures for the quarter of $0.3 million and $0.6 million year-to-date, which are included in the Other AFFO adjustments line item of the Adjusted Funds From Operations reconciliation.
(4) Senior housing triple-net per unit is not presented as it is not meaningful.
For the three and six months ended June 30, 2021, dollars in thousands, except per unit/square foot
SECOND QUARTERLife
ScienceMedical
Office CCRC OtherSenior Housing
Triple-net SHOP Total
Portfolio at share
Recurring capital expenditures $ 1,445 $ 2,880 $ 3,507 $ 914 $ — $ 475 $ 9,220
Tenant improvements - 2nd generation 3,675 5,674 — — — — 9,350
Lease commissions - 2nd generation 2,160 2,582 — — — — 4,742
AFFO capital expenditures(3) $ 7,281 $ 11,136 $ 3,507 $ 914 $ — $ 475 $ 23,313
Revenue enhancing capital expenditures 8,998 5,265 6,984 440 33 114 21,833
Casualty related capital expenditures — — — 1,423 — — 1,423
Initial Capital Expenditures ("ICE") 175 586 — — — — 761
Tenant improvements - 1st generation 22,320 8,806 — — — — 31,126
Lease commissions - Dev/Redev/Acq 6,268 21 — — — — 6,289
Development 54,881 15,471 — — — — 70,352
Redevelopment 12,512 4,208 — 1,955 — 485 19,159
Capitalized interest 4,477 716 — 141 — 79 5,414
Total capital expenditures $ 116,912 $ 46,210 $ 10,490 $ 4,873 $ 33 $ 1,153 $ 179,670
Recurring capital expenditures per unit/sq. ft.$0.14 per
Sq. Ft.$0.14 per
Sq. Ft.$458 per
Unit$511 per
Unit (4)$291 per
Unit
YTD
Portfolio at share
Recurring capital expenditures $ 2,581 $ 4,191 $ 4,801 $ 1,535 $ — $ 2,348 $ 15,456
Tenant improvements - 2nd generation 4,204 11,104 — — — — 15,308
Lease commissions - 2nd generation 8,059 5,684 — — — — 13,743
AFFO capital expenditures(3) $ 14,844 $ 20,979 $ 4,801 $ 1,535 $ — $ 2,348 $ 44,506
Revenue enhancing capital expenditures 15,238 9,781 11,783 965 1,908 926 40,601
Casualty related capital expenditures — — — 3,149 — 41 3,190
Initial Capital Expenditures ("ICE") 312 1,269 1,726 — — — 3,307
Tenant improvements - 1st generation 31,294 14,481 — — — — 45,775
Lease commissions - Dev/Redev/Acq 8,193 96 — — — — 8,288
Development 123,607 31,793 — — — — 155,400
Redevelopment 28,883 7,256 — 2,940 — 1,531 40,611
Capitalized interest 9,261 1,149 — 293 — 165 10,867
Total capital expenditures $ 231,632 $ 86,803 $ 18,310 $ 8,883 $ 1,908 $ 5,011 $ 352,546
Recurring capital expenditures per unit/sq. ft.$0.25 per
Sq. Ft.$0.20 per
Sq. Ft.$618 per
Unit$862 per
Unit (4)$594 per
Unit
25
Return to TOC
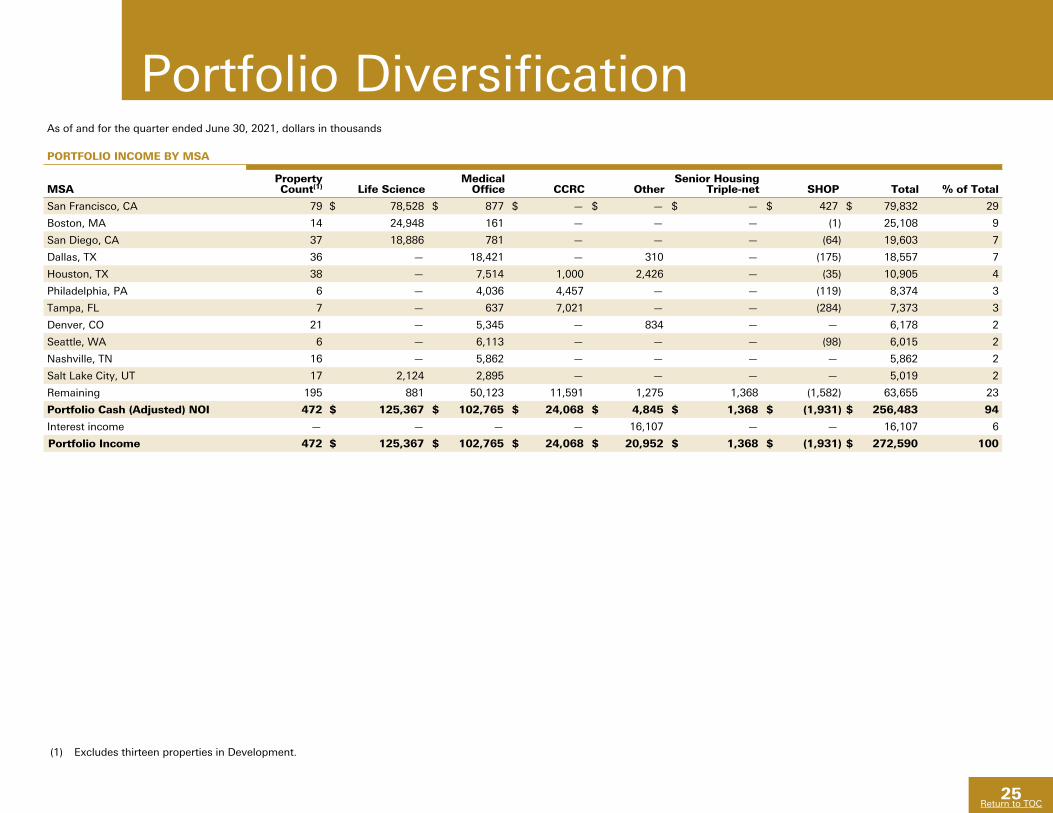
Portfolio DiversificationAs of and for the quarter ended June 30, 2021, dollars in thousands
PORTFOLIO INCOME BY MSA
MSAProperty Count(1) Life Science
Medical Office CCRC Other
Senior Housing Triple-net SHOP Total % of Total
San Francisco, CA 79 $ 78,528 $ 877 $ — $ — $ — $ 427 $ 79,832 29
Boston, MA 14 24,948 161 — — — (1) 25,108 9
San Diego, CA 37 18,886 781 — — — (64) 19,603 7
Dallas, TX 36 — 18,421 — 310 — (175) 18,557 7
Houston, TX 38 — 7,514 1,000 2,426 — (35) 10,905 4
Philadelphia, PA 6 — 4,036 4,457 — — (119) 8,374 3
Tampa, FL 7 — 637 7,021 — — (284) 7,373 3
Denver, CO 21 — 5,345 — 834 — — 6,178 2
Seattle, WA 6 — 6,113 — — — (98) 6,015 2
Nashville, TN 16 — 5,862 — — — — 5,862 2
Salt Lake City, UT 17 2,124 2,895 — — — — 5,019 2
Remaining 195 881 50,123 11,591 1,275 1,368 (1,582) 63,655 23
Portfolio Cash (Adjusted) NOI 472 $ 125,367 $ 102,765 $ 24,068 $ 4,845 $ 1,368 $ (1,931) $ 256,483 94
Interest income — — — — 16,107 — — 16,107 6
Portfolio Income 472 $ 125,367 $ 102,765 $ 24,068 $ 20,952 $ 1,368 $ (1,931) $ 272,590 100
(1) Excludes thirteen properties in Development.
26
Return to TOC
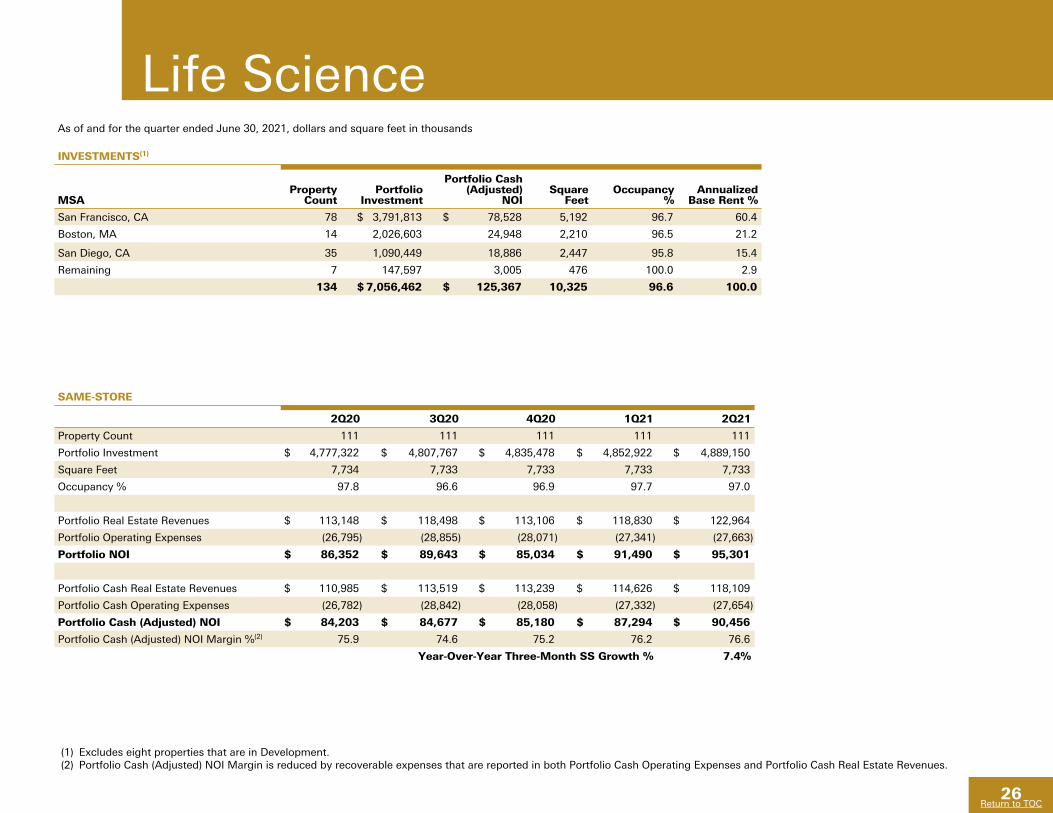
Life ScienceAs of and for the quarter ended June 30, 2021, dollars and square feet in thousands
INVESTMENTS(1)
MSAProperty
CountPortfolio
Investment
Portfolio Cash (Adjusted)
NOISquare
FeetOccupancy
%Annualized
Base Rent %
San Francisco, CA 78 $ 3,791,813 $ 78,528 5,192 96.7 60.4
Boston, MA 14 2,026,603 24,948 2,210 96.5 21.2
San Diego, CA 35 1,090,449 18,886 2,447 95.8 15.4
Remaining 7 147,597 3,005 476 100.0 2.9
134 $ 7,056,462 $ 125,367 10,325 96.6 100.0
SAME-STORE
2Q20 3Q20 4Q20 1Q21 2Q21
Property Count 111 111 111 111 111
Portfolio Investment $ 4,777,322 $ 4,807,767 $ 4,835,478 $ 4,852,922 $ 4,889,150
Square Feet 7,734 7,733 7,733 7,733 7,733
Occupancy % 97.8 96.6 96.9 97.7 97.0
Portfolio Real Estate Revenues $ 113,148 $ 118,498 $ 113,106 $ 118,830 $ 122,964
Portfolio Operating Expenses (26,795) (28,855) (28,071) (27,341) (27,663)
Portfolio NOI $ 86,352 $ 89,643 $ 85,034 $ 91,490 $ 95,301
Portfolio Cash Real Estate Revenues $ 110,985 $ 113,519 $ 113,239 $ 114,626 $ 118,109
Portfolio Cash Operating Expenses (26,782) (28,842) (28,058) (27,332) (27,654)
Portfolio Cash (Adjusted) NOI $ 84,203 $ 84,677 $ 85,180 $ 87,294 $ 90,456
Portfolio Cash (Adjusted) NOI Margin %(2) 75.9 74.6 75.2 76.2 76.6
Year-Over-Year Three-Month SS Growth % 7.4%
(1) Excludes eight properties that are in Development.(2) Portfolio Cash (Adjusted) NOI Margin is reduced by recoverable expenses that are reported in both Portfolio Cash Operating Expenses and Portfolio Cash Real Estate Revenues.
27
Return to TOC
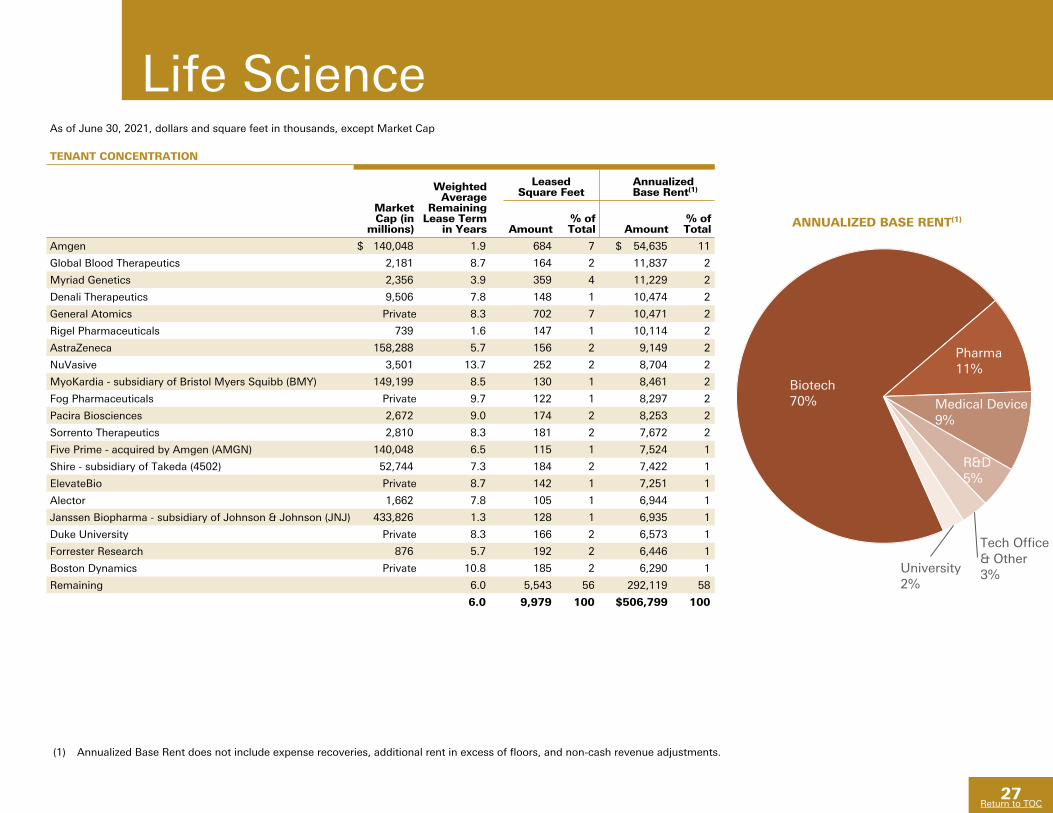
Life ScienceAs of June 30, 2021, dollars and square feet in thousands, except Market Cap
TENANT CONCENTRATION
Weighted Average
Remaining Lease Term
in Years
Leased Square Feet
Annualized Base Rent(1)
Market Cap (in
millions) Amount% of Total Amount
% of Total
Amgen $ 140,048 1.9 684 7 $ 54,635 11
Global Blood Therapeutics 2,181 8.7 164 2 11,837 2
Myriad Genetics 2,356 3.9 359 4 11,229 2
Denali Therapeutics 9,506 7.8 148 1 10,474 2
General Atomics Private 8.3 702 7 10,471 2
Rigel Pharmaceuticals 739 1.6 147 1 10,114 2
AstraZeneca 158,288 5.7 156 2 9,149 2
NuVasive 3,501 13.7 252 2 8,704 2
MyoKardia - subsidiary of Bristol Myers Squibb (BMY) 149,199 8.5 130 1 8,461 2
Fog Pharmaceuticals Private 9.7 122 1 8,297 2
Pacira Biosciences 2,672 9.0 174 2 8,253 2
Sorrento Therapeutics 2,810 8.3 181 2 7,672 2
Five Prime - acquired by Amgen (AMGN) 140,048 6.5 115 1 7,524 1
Shire - subsidiary of Takeda (4502) 52,744 7.3 184 2 7,422 1
ElevateBio Private 8.7 142 1 7,251 1
Alector 1,662 7.8 105 1 6,944 1
Janssen Biopharma - subsidiary of Johnson & Johnson (JNJ) 433,826 1.3 128 1 6,935 1
Duke University Private 8.3 166 2 6,573 1
Forrester Research 876 5.7 192 2 6,446 1
Boston Dynamics Private 10.8 185 2 6,290 1
Remaining 6.0 5,543 56 292,119 58
6.0 9,979 100 $ 506,799 100
ANNUALIZED BASE RENT(1)
(1) Annualized Base Rent does not include expense recoveries, additional rent in excess of floors, and non-cash revenue adjustments.
Biotech70%
Pharma11%
Medical Device9%
R&D5%
Tech Office& Other3%University
2%
28
Return to TOC
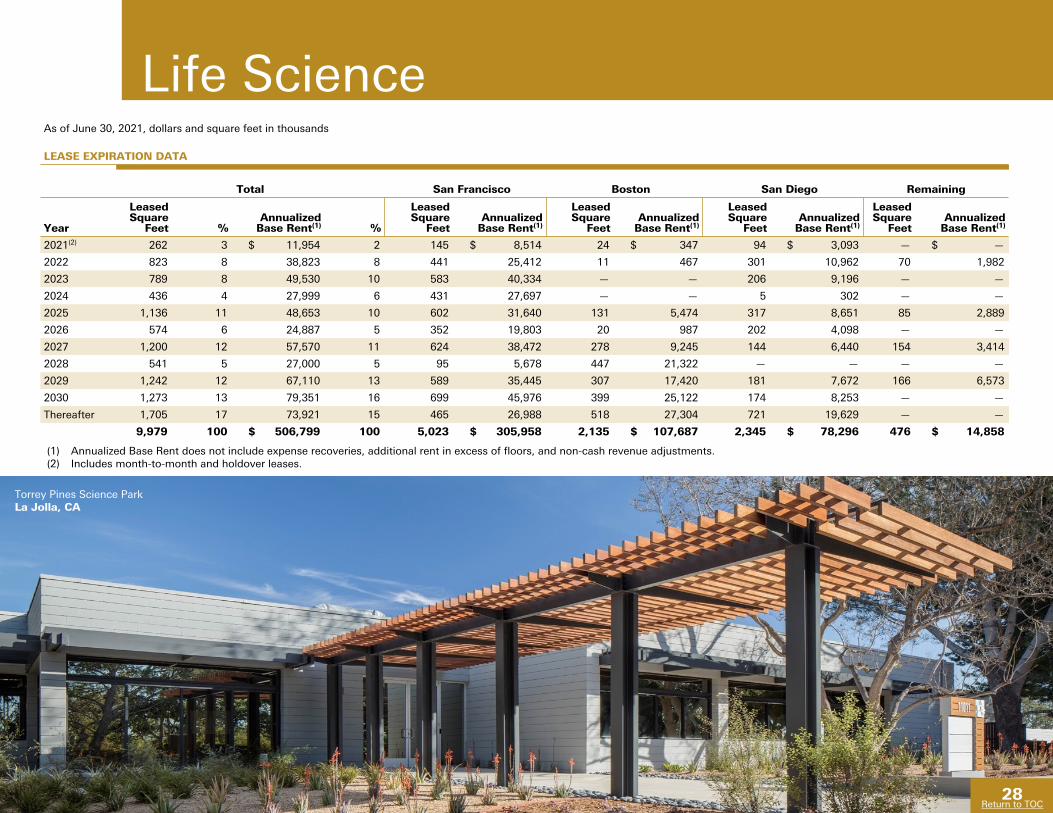
Life ScienceAs of June 30, 2021, dollars and square feet in thousands
LEASE EXPIRATION DATA
Total San Francisco Boston San Diego Remaining
Year
Leased Square
Feet %Annualized
Base Rent(1) %
Leased Square
FeetAnnualized
Base Rent(1)
Leased Square
FeetAnnualized
Base Rent(1)
Leased Square
FeetAnnualized
Base Rent(1)
Leased Square
FeetAnnualized
Base Rent(1)
2021(2) 262 3 $ 11,954 2 145 $ 8,514 24 $ 347 94 $ 3,093 — $ —
2022 823 8 38,823 8 441 25,412 11 467 301 10,962 70 1,982
2023 789 8 49,530 10 583 40,334 — — 206 9,196 — —
2024 436 4 27,999 6 431 27,697 — — 5 302 — —
2025 1,136 11 48,653 10 602 31,640 131 5,474 317 8,651 85 2,889
2026 574 6 24,887 5 352 19,803 20 987 202 4,098 — —
2027 1,200 12 57,570 11 624 38,472 278 9,245 144 6,440 154 3,414
2028 541 5 27,000 5 95 5,678 447 21,322 — — — —
2029 1,242 12 67,110 13 589 35,445 307 17,420 181 7,672 166 6,573
2030 1,273 13 79,351 16 699 45,976 399 25,122 174 8,253 — —
Thereafter 1,705 17 73,921 15 465 26,988 518 27,304 721 19,629 — —
9,979 100 $ 506,799 100 5,023 $ 305,958 2,135 $ 107,687 2,345 $ 78,296 476 $ 14,858
(1) Annualized Base Rent does not include expense recoveries, additional rent in excess of floors, and non-cash revenue adjustments. (2) Includes month-to-month and holdover leases.
Torrey Pines Science ParkLa Jolla, CA
28Return to TOC
29
Return to TOC
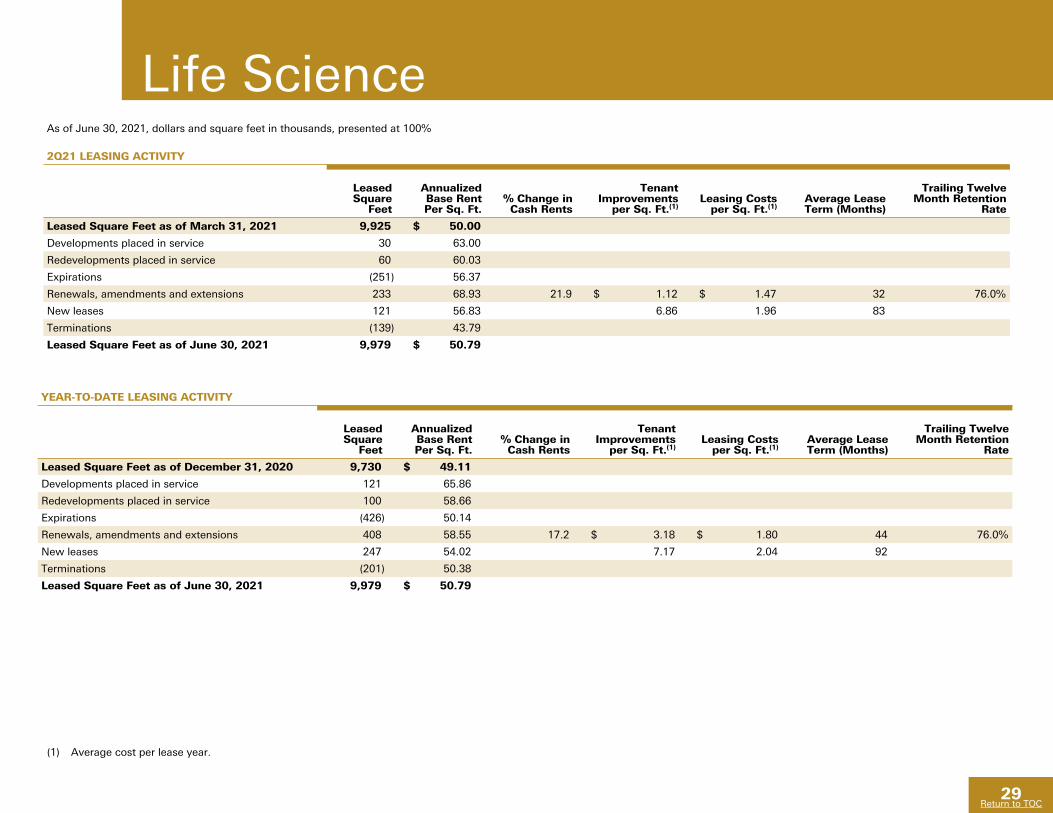
(1) Average cost per lease year.
As of June 30, 2021, dollars and square feet in thousands, presented at 100%
2Q21 LEASING ACTIVITY
Leased Square
Feet
Annualized Base Rent Per Sq. Ft.
% Change in Cash Rents
Tenant Improvements
per Sq. Ft.(1)Leasing Costs
per Sq. Ft.(1)Average Lease Term (Months)
Trailing Twelve Month Retention
Rate
Leased Square Feet as of March 31, 2021 9,925 $ 50.00
Developments placed in service 30 63.00
Redevelopments placed in service 60 60.03
Expirations (251) 56.37
Renewals, amendments and extensions 233 68.93 21.9 $ 1.12 $ 1.47 32 76.0%
New leases 121 56.83 6.86 1.96 83
Terminations (139) 43.79
Leased Square Feet as of June 30, 2021 9,979 $ 50.79
YEAR-TO-DATE LEASING ACTIVITY
Leased Square
Feet
Annualized Base Rent Per Sq. Ft.
% Change in Cash Rents
Tenant Improvements
per Sq. Ft.(1)Leasing Costs
per Sq. Ft.(1)Average Lease Term (Months)
Trailing Twelve Month Retention
Rate
Leased Square Feet as of December 31, 2020 9,730 $ 49.11
Developments placed in service 121 65.86
Redevelopments placed in service 100 58.66
Expirations (426) 50.14
Renewals, amendments and extensions 408 58.55 17.2 $ 3.18 $ 1.80 44 76.0%
New leases 247 54.02 7.17 2.04 92
Terminations (201) 50.38
Leased Square Feet as of June 30, 2021 9,979 $ 50.79
Life Science
30
Return to TOC
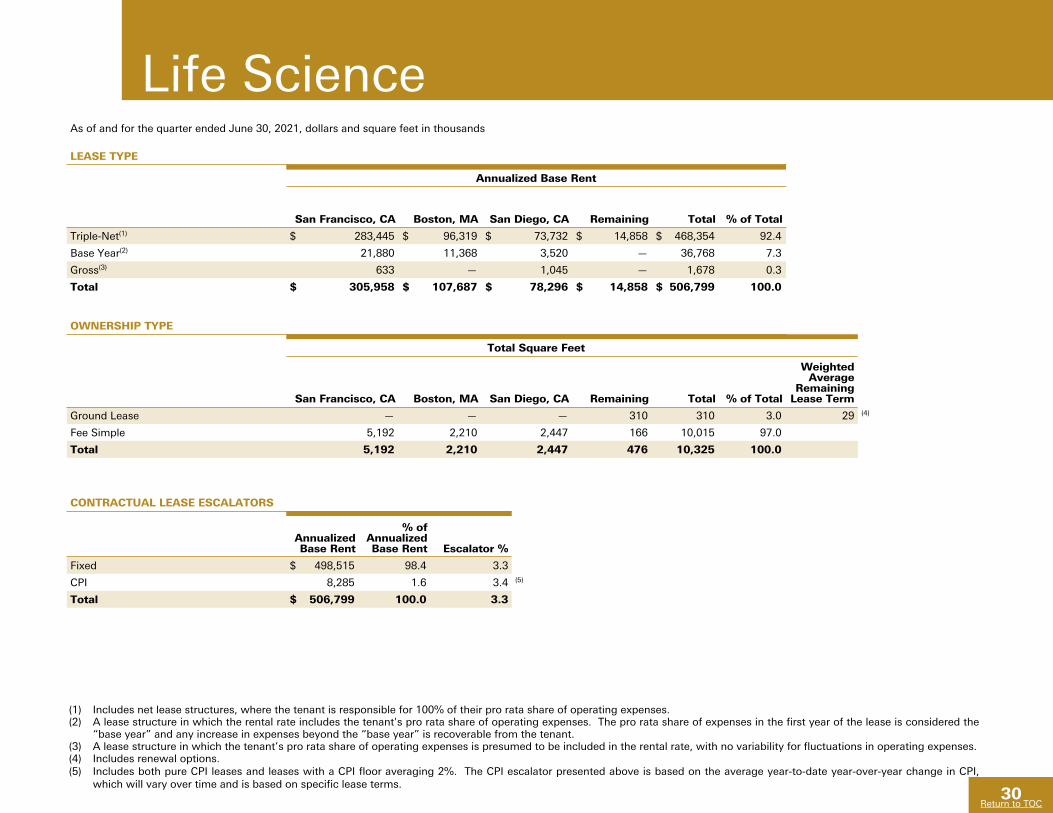
As of and for the quarter ended June 30, 2021, dollars and square feet in thousands
LEASE TYPE
Annualized Base Rent
San Francisco, CA Boston, MA San Diego, CA Remaining Total % of Total
Triple-Net(1) $ 283,445 $ 96,319 $ 73,732 $ 14,858 $ 468,354 92.4
Base Year(2) 21,880 11,368 3,520 — 36,768 7.3
Gross(3) 633 — 1,045 — 1,678 0.3
Total $ 305,958 $ 107,687 $ 78,296 $ 14,858 $ 506,799 100.0
OWNERSHIP TYPE
Total Square Feet
San Francisco, CA Boston, MA San Diego, CA Remaining Total % of Total
Weighted Average
Remaining Lease Term
Ground Lease — — — 310 310 3.0 29 (4)
Fee Simple 5,192 2,210 2,447 166 10,015 97.0
Total 5,192 2,210 2,447 476 10,325 100.0
CONTRACTUAL LEASE ESCALATORS
Annualized Base Rent
% of Annualized Base Rent Escalator %
Fixed $ 498,515 98.4 3.3
CPI 8,285 1.6 3.4 (5)
Total $ 506,799 100.0 3.3
Life Science
(1) Includes net lease structures, where the tenant is responsible for 100% of their pro rata share of operating expenses.(2) A lease structure in which the rental rate includes the tenant's pro rata share of operating expenses. The pro rata share of expenses in the first year of the lease is considered the
“base year” and any increase in expenses beyond the “base year” is recoverable from the tenant.(3) A lease structure in which the tenant’s pro rata share of operating expenses is presumed to be included in the rental rate, with no variability for fluctuations in operating expenses.(4) Includes renewal options.(5) Includes both pure CPI leases and leases with a CPI floor averaging 2%. The CPI escalator presented above is based on the average year-to-date year-over-year change in CPI,
which will vary over time and is based on specific lease terms.
31
Return to TOC
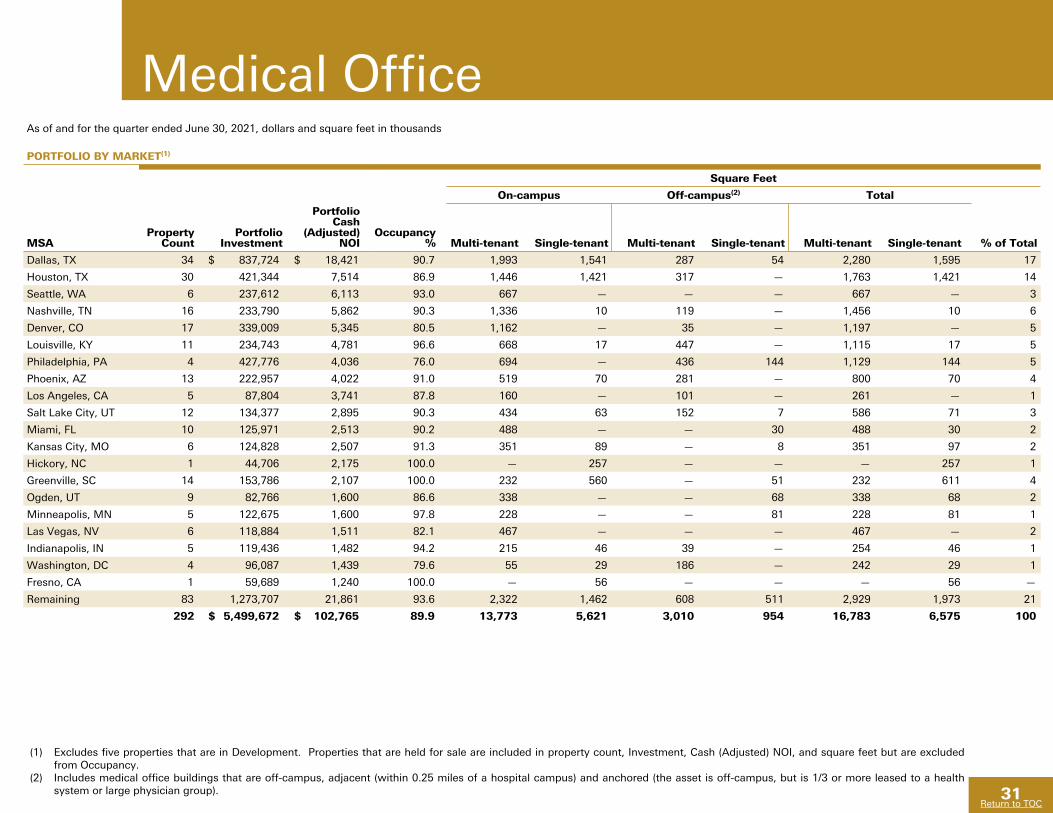
Medical OfficeAs of and for the quarter ended June 30, 2021, dollars and square feet in thousands
PORTFOLIO BY MARKET(1)
Square Feet
On-campus Off-campus(2) Total
MSAProperty
CountPortfolio
Investment
Portfolio Cash
(Adjusted) NOI
Occupancy % Multi-tenant Single-tenant Multi-tenant Single-tenant Multi-tenant Single-tenant % of Total
Dallas, TX 34 $ 837,724 $ 18,421 90.7 1,993 1,541 287 54 2,280 1,595 17
Houston, TX 30 421,344 7,514 86.9 1,446 1,421 317 — 1,763 1,421 14
Seattle, WA 6 237,612 6,113 93.0 667 — — — 667 — 3
Nashville, TN 16 233,790 5,862 90.3 1,336 10 119 — 1,456 10 6
Denver, CO 17 339,009 5,345 80.5 1,162 — 35 — 1,197 — 5
Louisville, KY 11 234,743 4,781 96.6 668 17 447 — 1,115 17 5
Philadelphia, PA 4 427,776 4,036 76.0 694 — 436 144 1,129 144 5
Phoenix, AZ 13 222,957 4,022 91.0 519 70 281 — 800 70 4
Los Angeles, CA 5 87,804 3,741 87.8 160 — 101 — 261 — 1
Salt Lake City, UT 12 134,377 2,895 90.3 434 63 152 7 586 71 3
Miami, FL 10 125,971 2,513 90.2 488 — — 30 488 30 2
Kansas City, MO 6 124,828 2,507 91.3 351 89 — 8 351 97 2
Hickory, NC 1 44,706 2,175 100.0 — 257 — — — 257 1
Greenville, SC 14 153,786 2,107 100.0 232 560 — 51 232 611 4
Ogden, UT 9 82,766 1,600 86.6 338 — — 68 338 68 2
Minneapolis, MN 5 122,675 1,600 97.8 228 — — 81 228 81 1
Las Vegas, NV 6 118,884 1,511 82.1 467 — — — 467 — 2
Indianapolis, IN 5 119,436 1,482 94.2 215 46 39 — 254 46 1
Washington, DC 4 96,087 1,439 79.6 55 29 186 — 242 29 1
Fresno, CA 1 59,689 1,240 100.0 — 56 — — — 56 —
Remaining 83 1,273,707 21,861 93.6 2,322 1,462 608 511 2,929 1,973 21
292 $ 5,499,672 $ 102,765 89.9 13,773 5,621 3,010 954 16,783 6,575 100
(1) Excludes five properties that are in Development. Properties that are held for sale are included in property count, Investment, Cash (Adjusted) NOI, and square feet but are excluded from Occupancy.
(2) Includes medical office buildings that are off-campus, adjacent (within 0.25 miles of a hospital campus) and anchored (the asset is off-campus, but is 1/3 or more leased to a health system or large physician group).
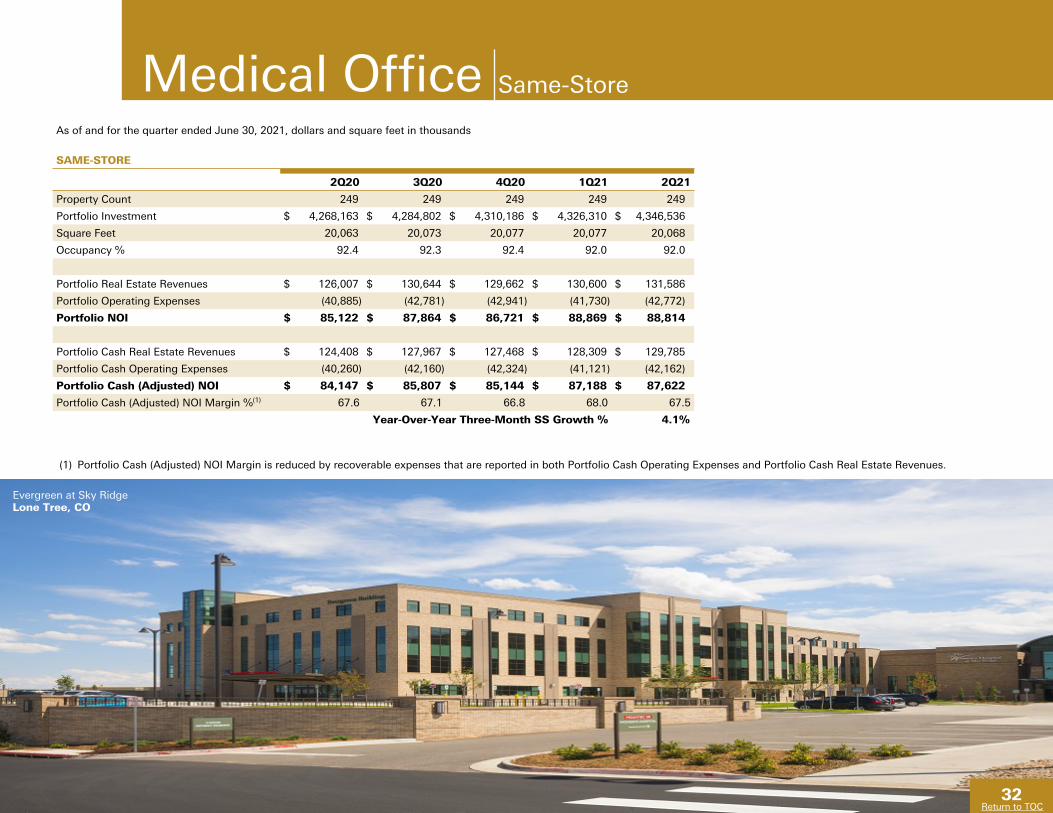
32
Return to TOC
Medical Office Same-Store
As of and for the quarter ended June 30, 2021, dollars and square feet in thousands
SAME-STORE
2Q20 3Q20 4Q20 1Q21 2Q21
Property Count 249 249 249 249 249
Portfolio Investment $ 4,268,163 $ 4,284,802 $ 4,310,186 $ 4,326,310 $ 4,346,536
Square Feet 20,063 20,073 20,077 20,077 20,068
Occupancy % 92.4 92.3 92.4 92.0 92.0
Portfolio Real Estate Revenues $ 126,007 $ 130,644 $ 129,662 $ 130,600 $ 131,586
Portfolio Operating Expenses (40,885) (42,781) (42,941) (41,730) (42,772)
Portfolio NOI $ 85,122 $ 87,864 $ 86,721 $ 88,869 $ 88,814
Portfolio Cash Real Estate Revenues $ 124,408 $ 127,967 $ 127,468 $ 128,309 $ 129,785
Portfolio Cash Operating Expenses (40,260) (42,160) (42,324) (41,121) (42,162)
Portfolio Cash (Adjusted) NOI $ 84,147 $ 85,807 $ 85,144 $ 87,188 $ 87,622
Portfolio Cash (Adjusted) NOI Margin %(1) 67.6 67.1 66.8 68.0 67.5
Year-Over-Year Three-Month SS Growth % 4.1%
(1) Portfolio Cash (Adjusted) NOI Margin is reduced by recoverable expenses that are reported in both Portfolio Cash Operating Expenses and Portfolio Cash Real Estate Revenues.
32Return to TOC
Evergreen at Sky RidgeLone Tree, CO
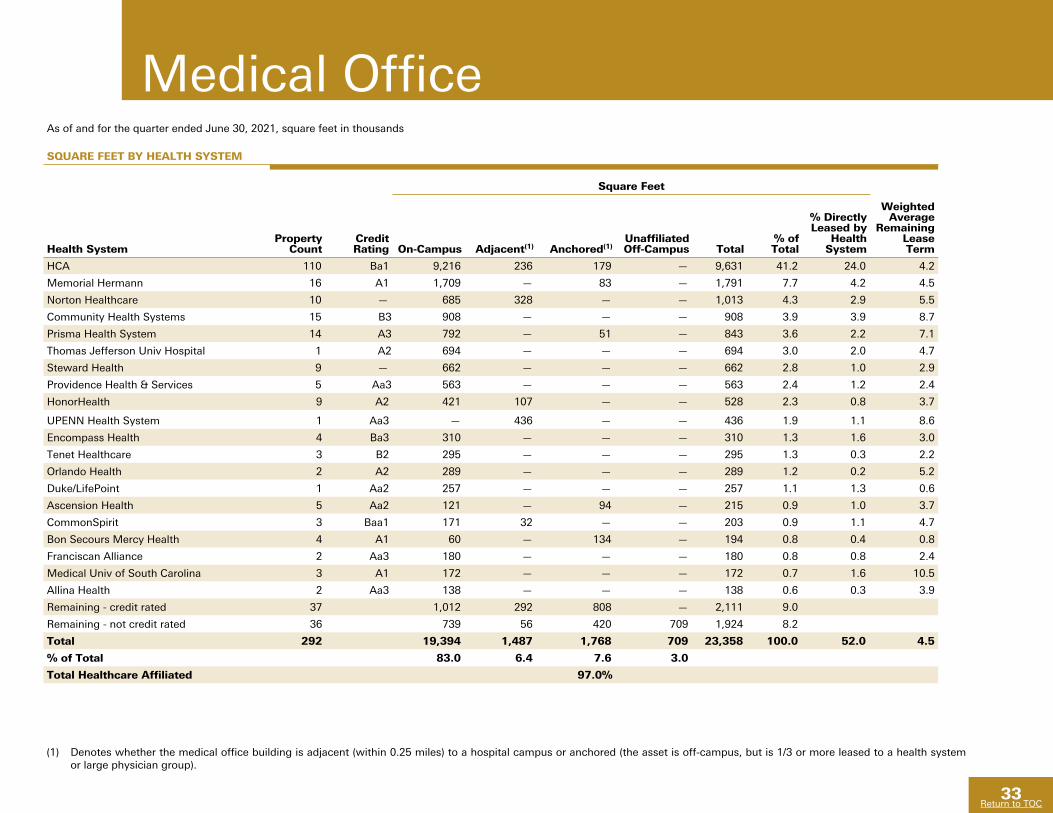
33
Return to TOC
Medical OfficeAs of and for the quarter ended June 30, 2021, square feet in thousands
SQUARE FEET BY HEALTH SYSTEM
Square Feet
Health SystemProperty
CountCredit Rating On-Campus Adjacent(1) Anchored(1)
Unaffiliated Off-Campus Total
% of Total
% Directly Leased by
Health System
Weighted Average
Remaining Lease Term
HCA 110 Ba1 9,216 236 179 — 9,631 41.2 24.0 4.2
Memorial Hermann 16 A1 1,709 — 83 — 1,791 7.7 4.2 4.5
Norton Healthcare 10 — 685 328 — — 1,013 4.3 2.9 5.5
Community Health Systems 15 B3 908 — — — 908 3.9 3.9 8.7
Prisma Health System 14 A3 792 — 51 — 843 3.6 2.2 7.1
Thomas Jefferson Univ Hospital 1 A2 694 — — — 694 3.0 2.0 4.7
Steward Health 9 — 662 — — — 662 2.8 1.0 2.9
Providence Health & Services 5 Aa3 563 — — — 563 2.4 1.2 2.4
HonorHealth 9 A2 421 107 — — 528 2.3 0.8 3.7
UPENN Health System 1 Aa3 — 436 — — 436 1.9 1.1 8.6
Encompass Health 4 Ba3 310 — — — 310 1.3 1.6 3.0
Tenet Healthcare 3 B2 295 — — — 295 1.3 0.3 2.2
Orlando Health 2 A2 289 — — — 289 1.2 0.2 5.2
Duke/LifePoint 1 Aa2 257 — — — 257 1.1 1.3 0.6
Ascension Health 5 Aa2 121 — 94 — 215 0.9 1.0 3.7
CommonSpirit 3 Baa1 171 32 — — 203 0.9 1.1 4.7
Bon Secours Mercy Health 4 A1 60 — 134 — 194 0.8 0.4 0.8
Franciscan Alliance 2 Aa3 180 — — — 180 0.8 0.8 2.4
Medical Univ of South Carolina 3 A1 172 — — — 172 0.7 1.6 10.5
Allina Health 2 Aa3 138 — — — 138 0.6 0.3 3.9
Remaining - credit rated 37 1,012 292 808 — 2,111 9.0
Remaining - not credit rated 36 739 56 420 709 1,924 8.2
Total 292 19,394 1,487 1,768 709 23,358 100.0 52.0 4.5
% of Total 83.0 6.4 7.6 3.0
Total Healthcare Affiliated 97.0%
(1) Denotes whether the medical office building is adjacent (within 0.25 miles) to a hospital campus or anchored (the asset is off-campus, but is 1/3 or more leased to a health system or large physician group).
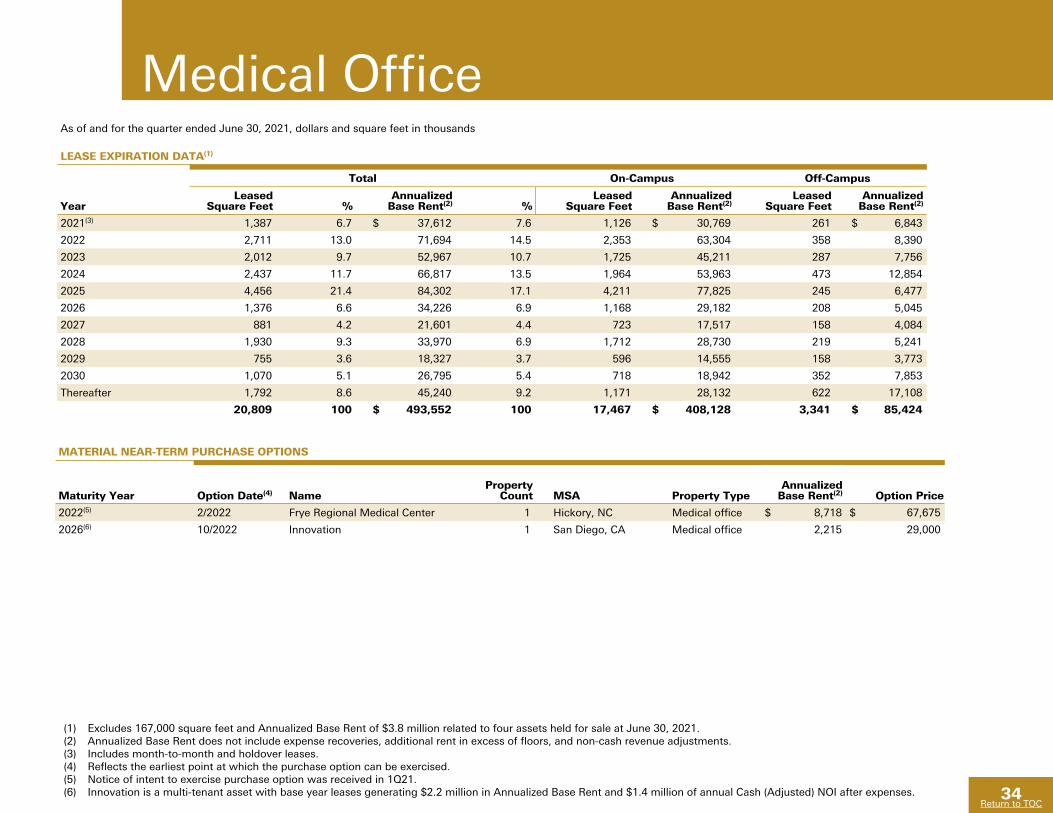
34
Return to TOC
Medical OfficeAs of and for the quarter ended June 30, 2021, dollars and square feet in thousands
LEASE EXPIRATION DATA(1)
Total On-Campus Off-Campus
YearLeased
Square Feet %Annualized
Base Rent(2) %Leased
Square FeetAnnualized
Base Rent(2)Leased
Square FeetAnnualized
Base Rent(2)
2021(3) 1,387 6.7 $ 37,612 7.6 1,126 $ 30,769 261 $ 6,843
2022 2,711 13.0 71,694 14.5 2,353 63,304 358 8,390
2023 2,012 9.7 52,967 10.7 1,725 45,211 287 7,756
2024 2,437 11.7 66,817 13.5 1,964 53,963 473 12,854
2025 4,456 21.4 84,302 17.1 4,211 77,825 245 6,477
2026 1,376 6.6 34,226 6.9 1,168 29,182 208 5,045
2027 881 4.2 21,601 4.4 723 17,517 158 4,084
2028 1,930 9.3 33,970 6.9 1,712 28,730 219 5,241
2029 755 3.6 18,327 3.7 596 14,555 158 3,773
2030 1,070 5.1 26,795 5.4 718 18,942 352 7,853
Thereafter 1,792 8.6 45,240 9.2 1,171 28,132 622 17,108
20,809 100 $ 493,552 100 17,467 $ 408,128 3,341 $ 85,424
(1) Excludes 167,000 square feet and Annualized Base Rent of $3.8 million related to four assets held for sale at June 30, 2021.(2) Annualized Base Rent does not include expense recoveries, additional rent in excess of floors, and non-cash revenue adjustments. (3) Includes month-to-month and holdover leases.(4) Reflects the earliest point at which the purchase option can be exercised.(5) Notice of intent to exercise purchase option was received in 1Q21.(6) Innovation is a multi-tenant asset with base year leases generating $2.2 million in Annualized Base Rent and $1.4 million of annual Cash (Adjusted) NOI after expenses.
MATERIAL NEAR-TERM PURCHASE OPTIONS
Maturity Year Option Date(4) NameProperty
Count MSA Property TypeAnnualized
Base Rent(2) Option Price
2022(5) 2/2022 Frye Regional Medical Center 1 Hickory, NC Medical office $ 8,718 $ 67,675
2026(6) 10/2022 Innovation 1 San Diego, CA Medical office 2,215 29,000
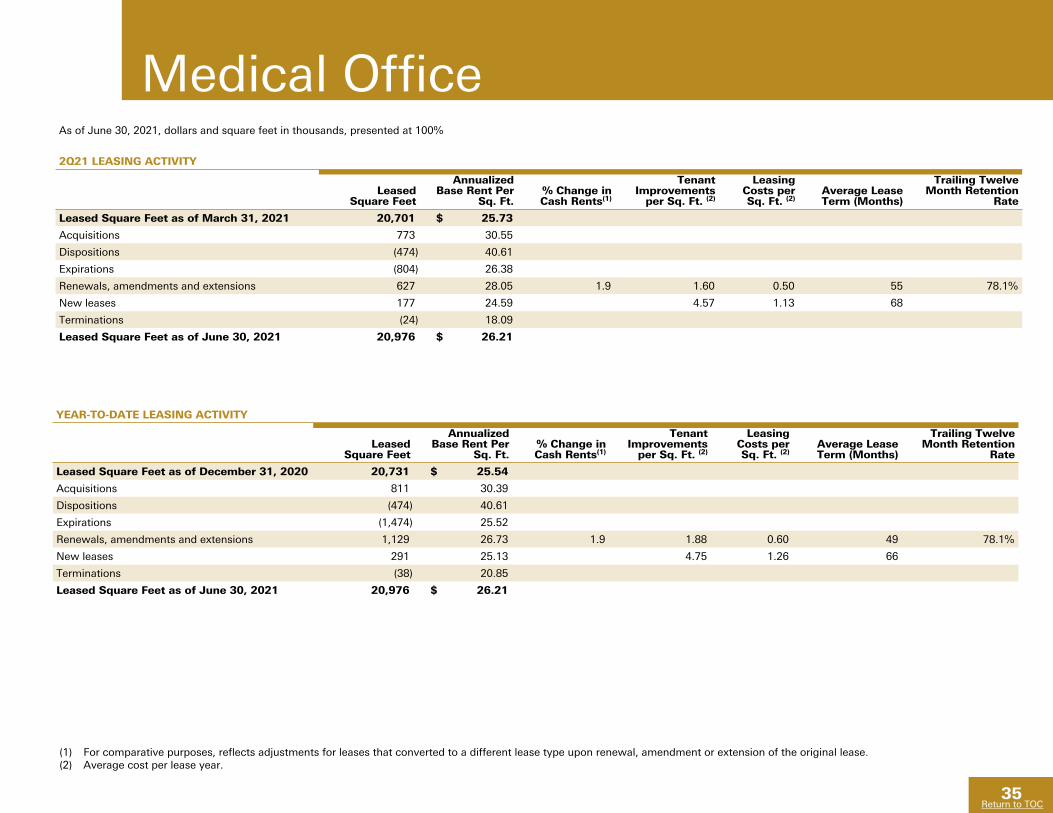
35
Return to TOC
Medical OfficeAs of June 30, 2021, dollars and square feet in thousands, presented at 100%
2Q21 LEASING ACTIVITY
Leased Square Feet
Annualized Base Rent Per
Sq. Ft.% Change in Cash Rents(1)
Tenant Improvements
per Sq. Ft. (2)
Leasing Costs per Sq. Ft. (2)
Average Lease Term (Months)
Trailing Twelve Month Retention
Rate
Leased Square Feet as of March 31, 2021 20,701 $ 25.73
Acquisitions 773 30.55
Dispositions (474) 40.61
Expirations (804) 26.38
Renewals, amendments and extensions 627 28.05 1.9 1.60 0.50 55 78.1%
New leases 177 24.59 4.57 1.13 68
Terminations (24) 18.09
Leased Square Feet as of June 30, 2021 20,976 $ 26.21
(1) For comparative purposes, reflects adjustments for leases that converted to a different lease type upon renewal, amendment or extension of the original lease.(2) Average cost per lease year.
35Return to TOC
YEAR-TO-DATE LEASING ACTIVITY
Leased Square Feet
Annualized Base Rent Per
Sq. Ft.% Change in Cash Rents(1)
Tenant Improvements
per Sq. Ft. (2)
Leasing Costs per Sq. Ft. (2)
Average Lease Term (Months)
Trailing Twelve Month Retention
Rate
Leased Square Feet as of December 31, 2020 20,731 $ 25.54
Acquisitions 811 30.39
Dispositions (474) 40.61
Expirations (1,474) 25.52
Renewals, amendments and extensions 1,129 26.73 1.9 1.88 0.60 49 78.1%
New leases 291 25.13 4.75 1.26 66
Terminations (38) 20.85
Leased Square Feet as of June 30, 2021 20,976 $ 26.21
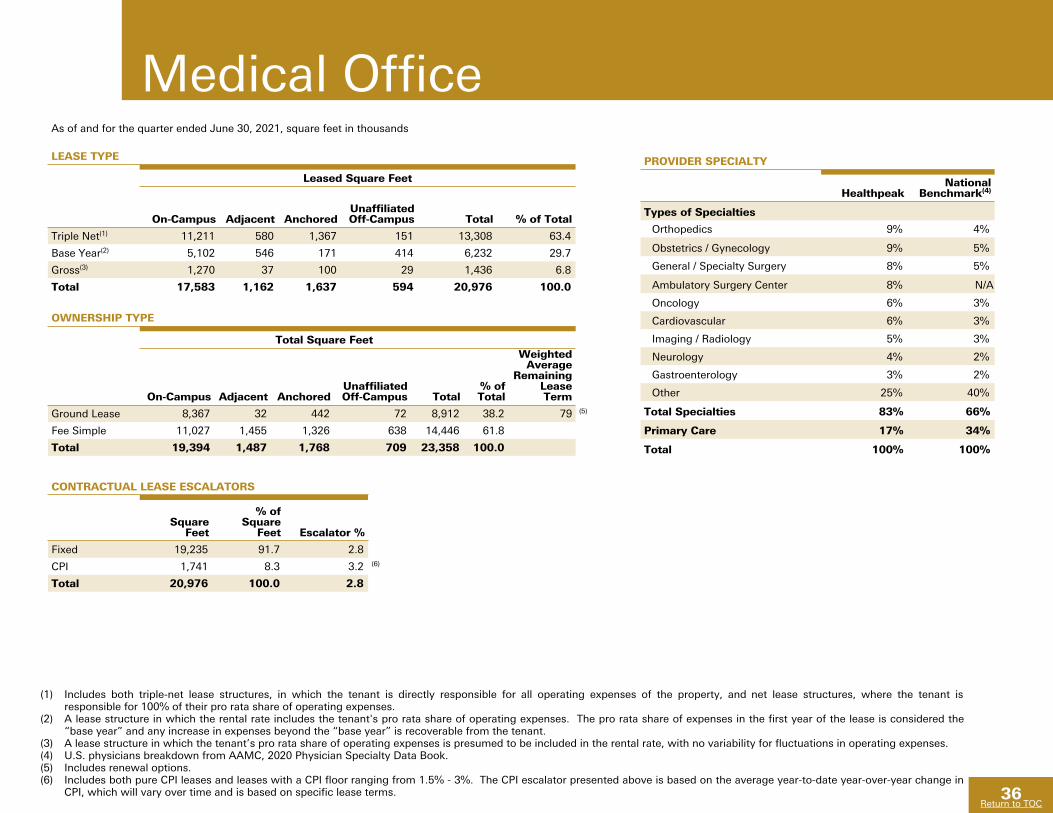
36
Return to TOC
Medical Office
PROVIDER SPECIALTY
HealthpeakNational
Benchmark(4)
Types of Specialties
Orthopedics 9% 4%
Obstetrics / Gynecology 9% 5%
General / Specialty Surgery 8% 5%
Ambulatory Surgery Center 8% N/A
Oncology 6% 3%
Cardiovascular 6% 3%
Imaging / Radiology 5% 3%
Neurology 4% 2%
Gastroenterology 3% 2%
Other 25% 40%
Total Specialties 83% 66%
Primary Care 17% 34%
Total 100% 100%
As of and for the quarter ended June 30, 2021, square feet in thousands
LEASE TYPE
Leased Square Feet
On-Campus Adjacent AnchoredUnaffiliated Off-Campus Total % of Total
Triple Net(1) 11,211 580 1,367 151 13,308 63.4
Base Year(2) 5,102 546 171 414 6,232 29.7
Gross(3) 1,270 37 100 29 1,436 6.8
Total 17,583 1,162 1,637 594 20,976 100.0
OWNERSHIP TYPE
Total Square Feet
On-Campus Adjacent AnchoredUnaffiliated Off-Campus Total
% of Total
Weighted Average
Remaining Lease Term
Ground Lease 8,367 32 442 72 8,912 38.2 79 (5)
Fee Simple 11,027 1,455 1,326 638 14,446 61.8
Total 19,394 1,487 1,768 709 23,358 100.0
CONTRACTUAL LEASE ESCALATORS
Square Feet
% of Square
Feet Escalator %
Fixed 19,235 91.7 2.8
CPI 1,741 8.3 3.2 (6)
Total 20,976 100.0 2.8
(1) Includes both triple-net lease structures, in which the tenant is directly responsible for all operating expenses of the property, and net lease structures, where the tenant is responsible for 100% of their pro rata share of operating expenses.
(2) A lease structure in which the rental rate includes the tenant's pro rata share of operating expenses. The pro rata share of expenses in the first year of the lease is considered the “base year” and any increase in expenses beyond the “base year” is recoverable from the tenant.
(3) A lease structure in which the tenant’s pro rata share of operating expenses is presumed to be included in the rental rate, with no variability for fluctuations in operating expenses.(4) U.S. physicians breakdown from AAMC, 2020 Physician Specialty Data Book.(5) Includes renewal options.(6) Includes both pure CPI leases and leases with a CPI floor ranging from 1.5% - 3%. The CPI escalator presented above is based on the average year-to-date year-over-year change in
CPI, which will vary over time and is based on specific lease terms.
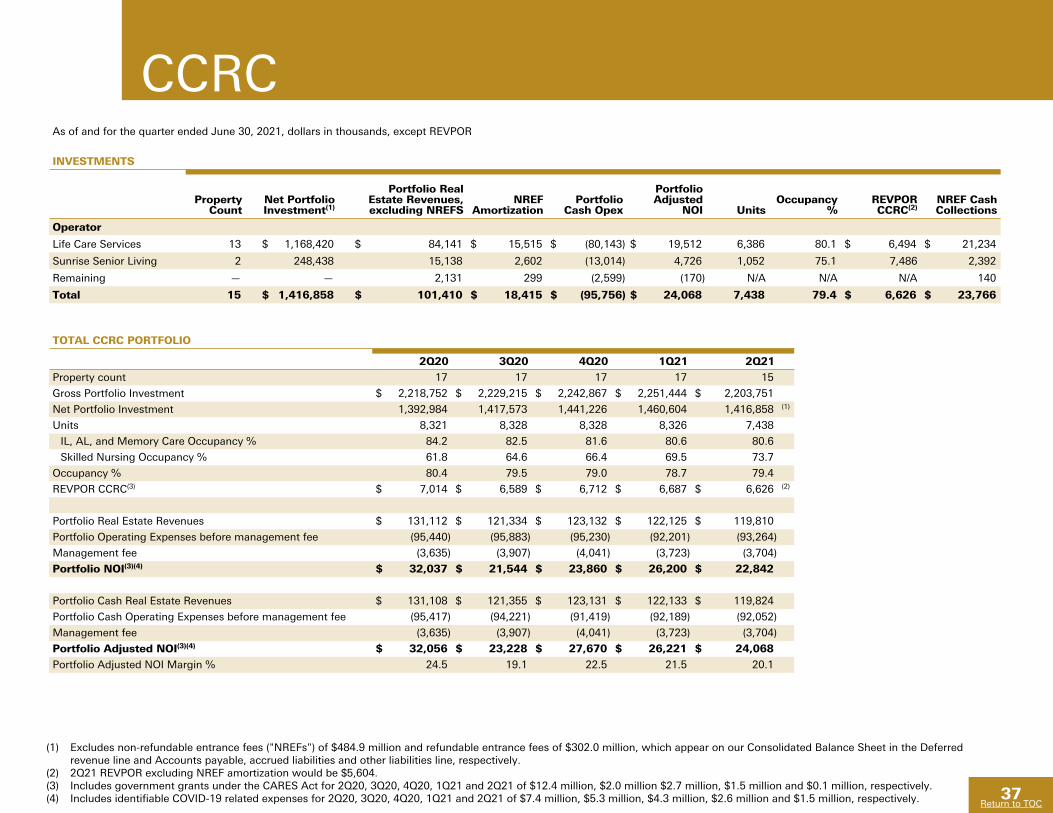
37
Return to TOC
CCRCAs of and for the quarter ended June 30, 2021, dollars in thousands, except REVPOR
INVESTMENTS
Property Count
Net Portfolio Investment(1)
Portfolio Real Estate Revenues, excluding NREFS
NREF Amortization
Portfolio Cash Opex
Portfolio Adjusted
NOI UnitsOccupancy
%REVPOR CCRC(2)
NREF Cash Collections
Operator
Life Care Services 13 $ 1,168,420 $ 84,141 $ 15,515 $ (80,143) $ 19,512 6,386 80.1 $ 6,494 $ 21,234
Sunrise Senior Living 2 248,438 15,138 2,602 (13,014) 4,726 1,052 75.1 7,486 2,392
Remaining — — 2,131 299 (2,599) (170) N/A N/A N/A 140
Total 15 $ 1,416,858 $ 101,410 $ 18,415 $ (95,756) $ 24,068 7,438 79.4 $ 6,626 $ 23,766
(1) Excludes non-refundable entrance fees ("NREFs") of $484.9 million and refundable entrance fees of $302.0 million, which appear on our Consolidated Balance Sheet in the Deferred revenue line and Accounts payable, accrued liabilities and other liabilities line, respectively.
(2) 2Q21 REVPOR excluding NREF amortization would be $5,604.(3) Includes government grants under the CARES Act for 2Q20, 3Q20, 4Q20, 1Q21 and 2Q21 of $12.4 million, $2.0 million $2.7 million, $1.5 million and $0.1 million, respectively.(4) Includes identifiable COVID-19 related expenses for 2Q20, 3Q20, 4Q20, 1Q21 and 2Q21 of $7.4 million, $5.3 million, $4.3 million, $2.6 million and $1.5 million, respectively.
TOTAL CCRC PORTFOLIO
2Q20 3Q20 4Q20 1Q21 2Q21
Property count 17 17 17 17 15
Gross Portfolio Investment $ 2,218,752 $ 2,229,215 $ 2,242,867 $ 2,251,444 $ 2,203,751
Net Portfolio Investment 1,392,984 1,417,573 1,441,226 1,460,604 1,416,858 (1)
Units 8,321 8,328 8,328 8,326 7,438
IL, AL, and Memory Care Occupancy % 84.2 82.5 81.6 80.6 80.6
Skilled Nursing Occupancy % 61.8 64.6 66.4 69.5 73.7
Occupancy % 80.4 79.5 79.0 78.7 79.4
REVPOR CCRC(3) $ 7,014 $ 6,589 $ 6,712 $ 6,687 $ 6,626 (2)
Portfolio Real Estate Revenues $ 131,112 $ 121,334 $ 123,132 $ 122,125 $ 119,810
Portfolio Operating Expenses before management fee (95,440) (95,883) (95,230) (92,201) (93,264)
Management fee (3,635) (3,907) (4,041) (3,723) (3,704)
Portfolio NOI(3)(4) $ 32,037 $ 21,544 $ 23,860 $ 26,200 $ 22,842
Portfolio Cash Real Estate Revenues $ 131,108 $ 121,355 $ 123,131 $ 122,133 $ 119,824
Portfolio Cash Operating Expenses before management fee (95,417) (94,221) (91,419) (92,189) (92,052)
Management fee (3,635) (3,907) (4,041) (3,723) (3,704)
Portfolio Adjusted NOI(3)(4) $ 32,056 $ 23,228 $ 27,670 $ 26,221 $ 24,068
Portfolio Adjusted NOI Margin % 24.5 19.1 22.5 21.5 20.1
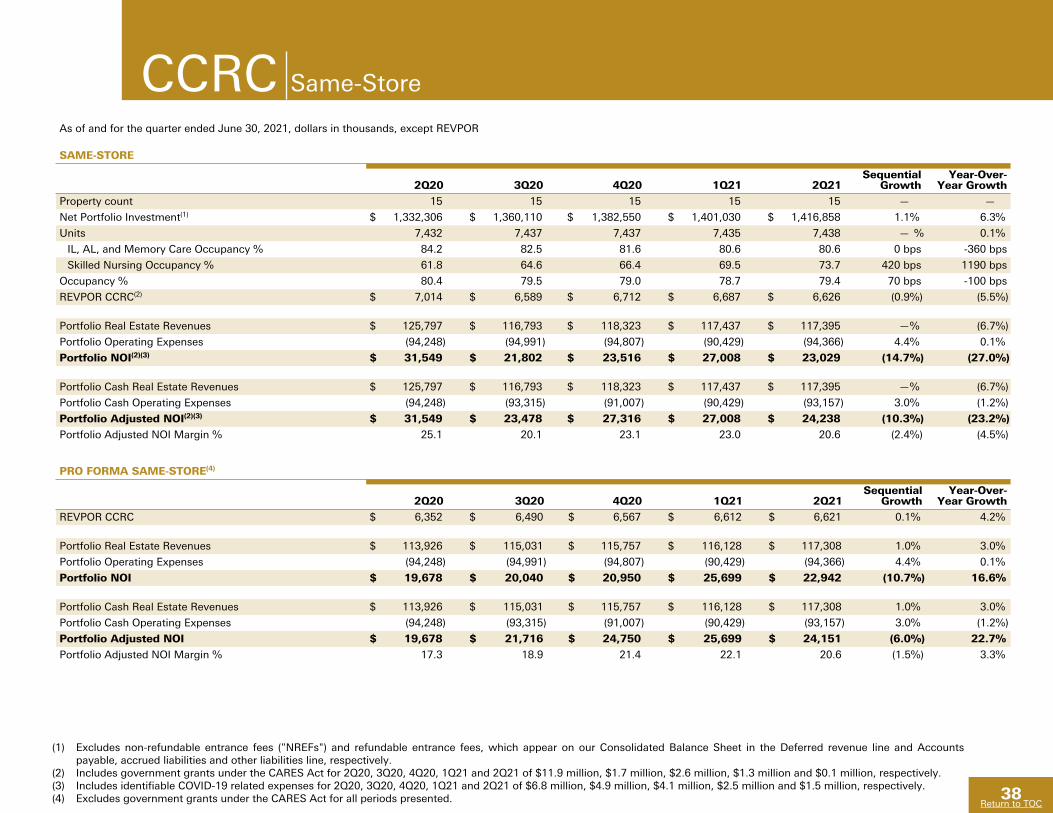
38
Return to TOC
CCRCAs of and for the quarter ended June 30, 2021, dollars in thousands, except REVPOR
SAME-STORE
2Q20 3Q20 4Q20 1Q21 2Q21Sequential
GrowthYear-Over-
Year Growth
Property count 15 15 15 15 15 — —
Net Portfolio Investment(1) $ 1,332,306 $ 1,360,110 $ 1,382,550 $ 1,401,030 $ 1,416,858 1.1% 6.3%
Units 7,432 7,437 7,437 7,435 7,438 — % 0.1%
IL, AL, and Memory Care Occupancy % 84.2 82.5 81.6 80.6 80.6 0 bps -360 bps
Skilled Nursing Occupancy % 61.8 64.6 66.4 69.5 73.7 420 bps 1190 bps
Occupancy % 80.4 79.5 79.0 78.7 79.4 70 bps -100 bps
REVPOR CCRC(2) $ 7,014 $ 6,589 $ 6,712 $ 6,687 $ 6,626 (0.9%) (5.5%)
Portfolio Real Estate Revenues $ 125,797 $ 116,793 $ 118,323 $ 117,437 $ 117,395 —% (6.7%)
Portfolio Operating Expenses (94,248) (94,991) (94,807) (90,429) (94,366) 4.4% 0.1%
Portfolio NOI(2)(3) $ 31,549 $ 21,802 $ 23,516 $ 27,008 $ 23,029 (14.7%) (27.0%)
Portfolio Cash Real Estate Revenues $ 125,797 $ 116,793 $ 118,323 $ 117,437 $ 117,395 —% (6.7%)
Portfolio Cash Operating Expenses (94,248) (93,315) (91,007) (90,429) (93,157) 3.0% (1.2%)
Portfolio Adjusted NOI(2)(3) $ 31,549 $ 23,478 $ 27,316 $ 27,008 $ 24,238 (10.3%) (23.2%)
Portfolio Adjusted NOI Margin % 25.1 20.1 23.1 23.0 20.6 (2.4%) (4.5%)
Same-Store
PRO FORMA SAME-STORE(4)
2Q20 3Q20 4Q20 1Q21 2Q21Sequential
GrowthYear-Over-
Year Growth
REVPOR CCRC $ 6,352 $ 6,490 $ 6,567 $ 6,612 $ 6,621 0.1% 4.2%
Portfolio Real Estate Revenues $ 113,926 $ 115,031 $ 115,757 $ 116,128 $ 117,308 1.0% 3.0%
Portfolio Operating Expenses (94,248) (94,991) (94,807) (90,429) (94,366) 4.4% 0.1%
Portfolio NOI $ 19,678 $ 20,040 $ 20,950 $ 25,699 $ 22,942 (10.7%) 16.6%
Portfolio Cash Real Estate Revenues $ 113,926 $ 115,031 $ 115,757 $ 116,128 $ 117,308 1.0% 3.0%
Portfolio Cash Operating Expenses (94,248) (93,315) (91,007) (90,429) (93,157) 3.0% (1.2%)
Portfolio Adjusted NOI $ 19,678 $ 21,716 $ 24,750 $ 25,699 $ 24,151 (6.0%) 22.7%
Portfolio Adjusted NOI Margin % 17.3 18.9 21.4 22.1 20.6 (1.5%) 3.3%
(1) Excludes non-refundable entrance fees ("NREFs") and refundable entrance fees, which appear on our Consolidated Balance Sheet in the Deferred revenue line and Accounts payable, accrued liabilities and other liabilities line, respectively.
(2) Includes government grants under the CARES Act for 2Q20, 3Q20, 4Q20, 1Q21 and 2Q21 of $11.9 million, $1.7 million, $2.6 million, $1.3 million and $0.1 million, respectively.(3) Includes identifiable COVID-19 related expenses for 2Q20, 3Q20, 4Q20, 1Q21 and 2Q21 of $6.8 million, $4.9 million, $4.1 million, $2.5 million and $1.5 million, respectively. (4) Excludes government grants under the CARES Act for all periods presented.

39
Return to TOC
(1) Includes identifiable COVID-19 related expenses for 2Q20, 3Q20, 4Q20 1Q21 and 2Q21 of $1.0 million, $0.3 million, $0.5 million, $0.3 million, and $0.2 million, respectively.(2) Includes government grants under the CARES Act for 2Q20, 1Q21 and 2Q21 of $0.3 million, $0.2 million, and $0.6 million, respectively.(3) Excludes $15.5 million of estimated reserves for loan losses under the current expected credit losses accounting standard in accordance with ASC 326, and resident loans on CCRC of
$22 million.(4) Interest income includes the accelerated amortization of loan discounts of $6.8 million in Seller financing less loan fees of $0.5 million in Other due to early prepayments of loans, which
is excluded from full year interest income in our Guidance.(5) Weighted average maturity in years is based on initial maturity and excludes any extension options.
Other
DEBT INVESTMENTS
Weighted Average
Investment(3) Interest Income(4) Yield Maturity in Years(5)
Seller financing loans $ 448,652 $ 15,676 5.3% 2.0
Other 47,272 432 6.9% 1.2
Total Debt Investments $ 495,924 $ 16,107 5.4% 1.9
As of and for the quarter ended June 30, 2021, dollars in thousands, except REVPOR
SOVEREIGN WEALTH FUND SENIOR HOUSING JV AT SHARE
2Q20 3Q20 4Q20 1Q21 2Q21
Property count 19 19 19 19 19
Investment $ 419,821 $ 419,000 $ 420,699 $ 421,567 $ 437,201
Units 3,317 3,317 3,317 3,317 3,354
Occupancy % 82.6 79.5 76.8 72.7 72.4
REVPOR Other $ 3,993 $ 3,997 $ 3,983 $ 4,117 $ 4,186
Portfolio Real Estate Revenues $ 18,953 $ 17,902 $ 17,334 $ 16,980 $ 17,323
Portfolio Operating Expenses before management fee (12,784) (12,629) (12,506) (11,794) (11,650)
Management fee (896) (856) (829) (801) (801)
Portfolio NOI(1)(2) $ 5,273 $ 4,417 $ 3,999 $ 4,385 $ 4,872
Portfolio Cash Real Estate Revenues $ 18,991 $ 17,946 $ 17,339 $ 17,068 $ 17,330
Portfolio Cash Operating Expenses before management fee (12,724) (12,610) (12,194) (11,770) (11,683)
Management fee (896) (856) (829) (801) (801)
Portfolio Cash (Adjusted) NOI(1)(2) $ 5,371 $ 4,480 $ 4,316 $ 4,497 $ 4,845
Portfolio Cash (Adjusted) NOI Margin % 28.3 25.0 24.9 26.3 28.0
WHOLLY-OWNED
2Q20 3Q20 4Q20 1Q21 2Q21
Property count 1 — — — —
Investment $ 813 $ — $ — $ — $ —
Portfolio Cash (Adjusted) NOI $ 61 $ 9 $ — $ — $ —
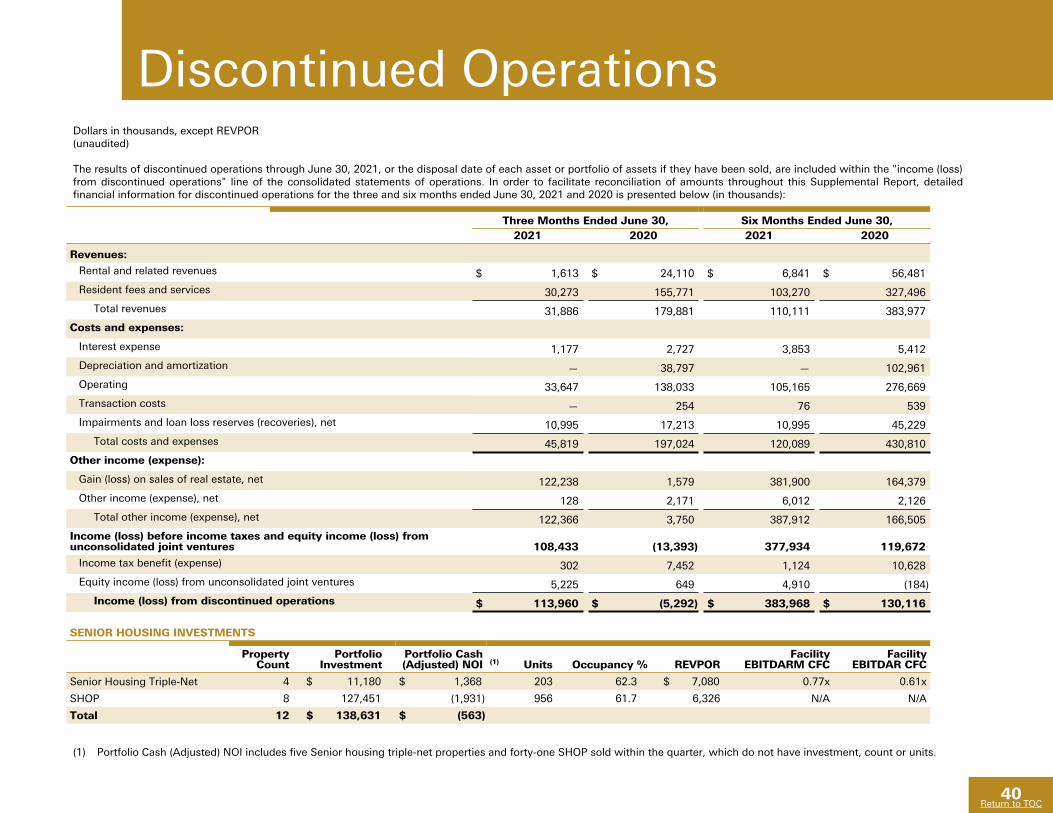
40
Return to TOC
Three Months Ended June 30, Six Months Ended June 30, 2021 2020 2021 2020
Revenues:
Rental and related revenues $ 1,613 $ 24,110 $ 6,841 $ 56,481
Resident fees and services 30,273 155,771 103,270 327,496
Total revenues 31,886 179,881 110,111 383,977
Costs and expenses:
Interest expense 1,177 2,727 3,853 5,412
Depreciation and amortization — 38,797 — 102,961
Operating 33,647 138,033 105,165 276,669
Transaction costs — 254 76 539
Impairments and loan loss reserves (recoveries), net 10,995 17,213 10,995 45,229
Total costs and expenses 45,819 197,024 120,089 430,810
Other income (expense):
Gain (loss) on sales of real estate, net 122,238 1,579 381,900 164,379
Other income (expense), net 128 2,171 6,012 2,126
Total other income (expense), net 122,366 3,750 387,912 166,505
Income (loss) before income taxes and equity income (loss) from unconsolidated joint ventures 108,433 (13,393) 377,934 119,672
Income tax benefit (expense) 302 7,452 1,124 10,628
Equity income (loss) from unconsolidated joint ventures 5,225 649 4,910 (184)
Income (loss) from discontinued operations $ 113,960 $ (5,292) $ 383,968 $ 130,116
Discontinued OperationsDollars in thousands, except REVPOR(unaudited)
The results of discontinued operations through June 30, 2021, or the disposal date of each asset or portfolio of assets if they have been sold, are included within the "income (loss) from discontinued operations" line of the consolidated statements of operations. In order to facilitate reconciliation of amounts throughout this Supplemental Report, detailed financial information for discontinued operations for the three and six months ended June 30, 2021 and 2020 is presented below (in thousands):
(1) Portfolio Cash (Adjusted) NOI includes five Senior housing triple-net properties and forty-one SHOP sold within the quarter, which do not have investment, count or units.
SENIOR HOUSING INVESTMENTS
Property Count
Portfolio Investment
Portfolio Cash (Adjusted) NOI (1) Units Occupancy % REVPOR
Facility EBITDARM CFC
Facility EBITDAR CFC
Senior Housing Triple-Net 4 $ 11,180 $ 1,368 203 62.3 $ 7,080 0.77x 0.61x
SHOP 8 127,451 (1,931) 956 61.7 6,326 N/A N/A
Total 12 $ 138,631 $ (563)
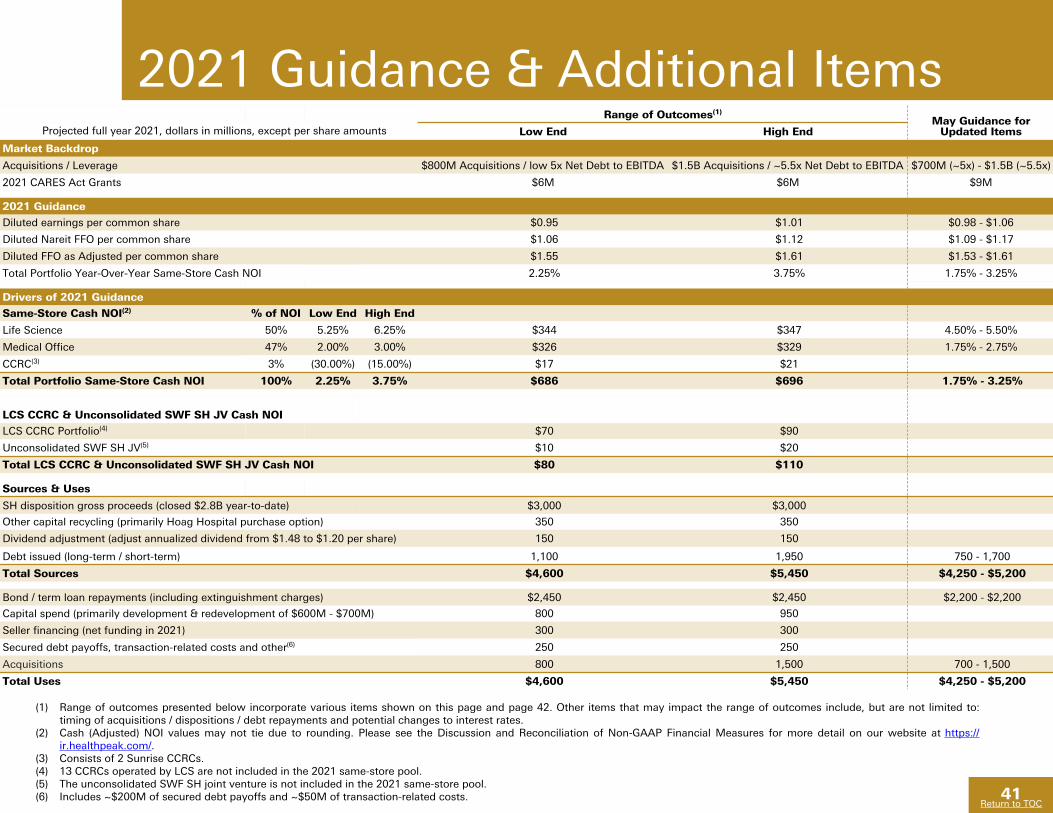
41
Return to TOC
Range of Outcomes(1)May Guidance for
Updated ItemsLow End High End
Market Backdrop
Acquisitions / Leverage $800M Acquisitions / low 5x Net Debt to EBITDA $1.5B Acquisitions / ~5.5x Net Debt to EBITDA $700M (~5x) - $1.5B (~5.5x)
2021 CARES Act Grants $6M $6M $9M
2021 Guidance
Diluted earnings per common share $0.95 $1.01 $0.98 - $1.06
Diluted Nareit FFO per common share $1.06 $1.12 $1.09 - $1.17
Diluted FFO as Adjusted per common share $1.55 $1.61 $1.53 - $1.61
Total Portfolio Year-Over-Year Same-Store Cash NOI 2.25% 3.75% 1.75% - 3.25%
Drivers of 2021 Guidance
Same-Store Cash NOI(2) % of NOI Low End High End
Life Science 50% 5.25% 6.25% $344 $347 4.50% - 5.50%
Medical Office 47% 2.00% 3.00% $326 $329 1.75% - 2.75%
CCRC(3) 3% (30.00%) (15.00%) $17 $21
Total Portfolio Same-Store Cash NOI 100% 2.25% 3.75% $686 $696 1.75% - 3.25%
LCS CCRC & Unconsolidated SWF SH JV Cash NOI
LCS CCRC Portfolio(4) $70 $90
Unconsolidated SWF SH JV(5) $10 $20
Total LCS CCRC & Unconsolidated SWF SH JV Cash NOI $80 $110
Sources & Uses
SH disposition gross proceeds (closed $2.8B year-to-date) $3,000 $3,000
Other capital recycling (primarily Hoag Hospital purchase option) 350 350
Dividend adjustment (adjust annualized dividend from $1.48 to $1.20 per share) 150 150
Debt issued (long-term / short-term) 1,100 1,950 750 - 1,700
Total Sources $4,600 $5,450 $4,250 - $5,200
Bond / term loan repayments (including extinguishment charges) $2,450 $2,450 $2,200 - $2,200
Capital spend (primarily development & redevelopment of $600M - $700M) 800 950
Seller financing (net funding in 2021) 300 300
Secured debt payoffs, transaction-related costs and other(6) 250 250
Acquisitions 800 1,500 700 - 1,500
Total Uses $4,600 $5,450 $4,250 - $5,200
Projected full year 2021, dollars in millions, except per share amounts
2021 Guidance & Additional Items
(1) Range of outcomes presented below incorporate various items shown on this page and page 42. Other items that may impact the range of outcomes include, but are not limited to: timing of acquisitions / dispositions / debt repayments and potential changes to interest rates.
(2) Cash (Adjusted) NOI values may not tie due to rounding. Please see the Discussion and Reconciliation of Non-GAAP Financial Measures for more detail on our website at https://ir.healthpeak.com/.
(3) Consists of 2 Sunrise CCRCs.(4) 13 CCRCs operated by LCS are not included in the 2021 same-store pool.(5) The unconsolidated SWF SH joint venture is not included in the 2021 same-store pool.(6) Includes ~$200M of secured debt payoffs and ~$50M of transaction-related costs.
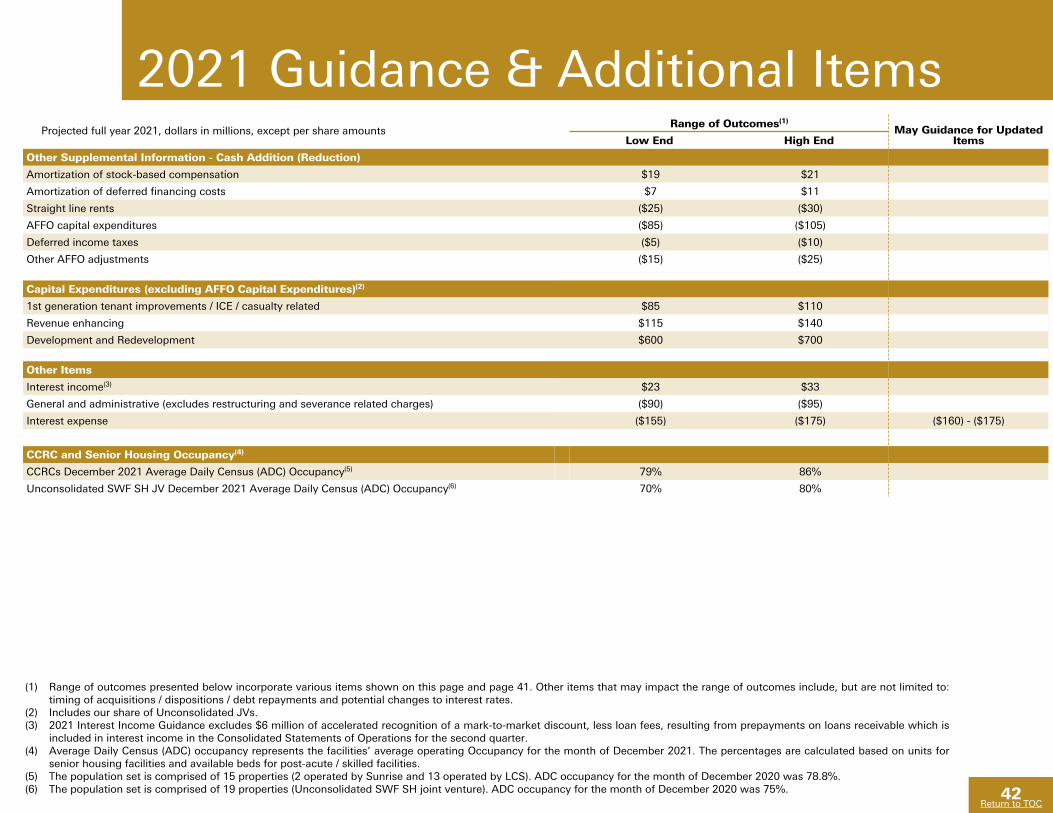
42
Return to TOC
Projected full year 2021, dollars in millions, except per share amounts
(1) Range of outcomes presented below incorporate various items shown on this page and page 41. Other items that may impact the range of outcomes include, but are not limited to: timing of acquisitions / dispositions / debt repayments and potential changes to interest rates.
(2) Includes our share of Unconsolidated JVs. (3) 2021 Interest Income Guidance excludes $6 million of accelerated recognition of a mark-to-market discount, less loan fees, resulting from prepayments on loans receivable which is
included in interest income in the Consolidated Statements of Operations for the second quarter.(4) Average Daily Census (ADC) occupancy represents the facilities’ average operating Occupancy for the month of December 2021. The percentages are calculated based on units for
senior housing facilities and available beds for post-acute / skilled facilities.(5) The population set is comprised of 15 properties (2 operated by Sunrise and 13 operated by LCS). ADC occupancy for the month of December 2020 was 78.8%.(6) The population set is comprised of 19 properties (Unconsolidated SWF SH joint venture). ADC occupancy for the month of December 2020 was 75%.
Range of Outcomes(1)May Guidance for Updated
ItemsLow End High End
Other Supplemental Information - Cash Addition (Reduction)
Amortization of stock-based compensation $19 $21
Amortization of deferred financing costs $7 $11
Straight line rents ($25) ($30)
AFFO capital expenditures ($85) ($105)
Deferred income taxes ($5) ($10)
Other AFFO adjustments ($15) ($25)
Capital Expenditures (excluding AFFO Capital Expenditures)(2)
1st generation tenant improvements / ICE / casualty related $85 $110
Revenue enhancing $115 $140
Development and Redevelopment $600 $700
Other Items
Interest income(3) $23 $33
General and administrative (excludes restructuring and severance related charges) ($90) ($95)
Interest expense ($155) ($175) ($160) - ($175)
CCRC and Senior Housing Occupancy(4)
CCRCs December 2021 Average Daily Census (ADC) Occupancy(5) 79% 86%
Unconsolidated SWF SH JV December 2021 Average Daily Census (ADC) Occupancy(6) 70% 80%
2021 Guidance & Additional Items
Return to TOC43Return to TOC
GlossaryAdjusted Fixed Charge Coverage* Adjusted EBITDAre divided by Fixed Charges. Adjusted Fixed Charge Coverage is a supplemental measure of liquidity and our ability to meet interest payments on our outstanding debt and pay dividends to our preferred stockholders, if applicable. Our various debt agreements contain covenants that require us to maintain ratios similar to Adjusted Fixed Charge Coverage and credit rating agencies utilize similar ratios in evaluating and determining the credit rating on certain of our debt instruments. Adjusted Fixed Charge Coverage is subject to the same limitations and qualifications as Adjusted EBITDAre and Fixed Charges.
Adjusted Funds From Operations (“AFFO”)* See the “Adjusted Funds From Operations” definition included in the accompanying Discussion and Reconciliations of Non-GAAP Financial Measures for information regarding AFFO.
Annualized Base Rent The most recent month’s (or subsequent month’s if acquired in the most recent month) base rent including additional rent floors, cash income from DFLs, and/or interest income annualized for 12 months. Annualized Base Rent includes the Company's share of unconsolidated JVs calculated on the same basis and excludes properties in our SHOP and CCRC segments, properties sold or held for sale during the quarter, and noncontrolling interests' share of consolidated JVs calculated on the same basis. Further, Annualized Base Rent does not include expense recoveries, additional rents in excess of floors, and non-cash revenue adjustments (i.e., straight-line rents, amortization of market lease intangibles, DFL non-cash interest and deferred revenues). We use Annualized Base Rent for the purpose of determining Lease Expirations and Debt Investment Maturities.
Cash Flow Coverage (“CFC”)* Facility EBITDAR or Facility EBITDARM divided by the aggregate of base rent and any additional rent due to us for the trailing 12-month period one quarter in arrears from the period presented. CFC is a supplemental measure of a property’s ability to generate cash flows for the operator/tenant (not the Company) to meet the operator’s/tenant’s related rent and other obligations to us. However, CFC is subject to the same limitations and qualifications as Facility EBITDAR or Facility EBITDARM. CFC is not presented for: (i) properties operated under a RIDEA structure or (ii) newly completed facilities under lease-up, facilities acquired or transitioned to new operators during the relevant trailing 12-month period, vacant facilities, facilities that are held for sale, facilities for which an agreement has been reached to change reporting structure, and facilities for which data is not available or meaningful.
Completion Date - Development/RedevelopmentFor Developments, management’s estimate of the period the core and shell structure improvements are expected to be or have been completed. For Redevelopments, management’s estimate of the period in which major construction activity in relation to the scope of the project has been or will be substantially completed and excludes the completion of tenant improvements.
Consolidated Debt The carrying amount of bank line of credit, commercial paper, term loans, senior unsecured notes, and mortgage debt, as reported in our consolidated financial statements.
Consolidated Gross Assets* The carrying amount of total assets, excluding investments in and advances to our unconsolidated JVs, after adding back accumulated depreciation and amortization, as reported in our consolidated financial statements. Consolidated Gross Assets is a supplemental measure of our financial position, which, when used in conjunction with debt-related measures, enables both management and investors to analyze our leverage and to compare our leverage to that of other companies.
Consolidated Secured Debt Mortgage and other debt secured by real estate, as reported in our consolidated financial statements.
Continuing Care Retirement Community (“CCRC”) A senior housing facility which provides at least three levels of care (i.e., independent living, assisted living and skilled nursing).
Debt Investments Loans secured by a direct interest in real estate and mezzanine loans.
Development Includes ground-up construction. Newly completed developments, are considered Stabilized at the earlier of lease-up (typically when the tenant(s) controls the physical use of 80% of the space) or 24 months from the date the property is placed in service.
Direct Financing Lease (“DFL”) Lease for which future minimum lease payments are recorded as a receivable and the difference between the future minimum lease payments and the estimated residual values less the cost of the properties is recorded as unearned income. Unearned income is deferred and amortized to income over the lease terms to provide a constant yield.
EBITDAre and Adjusted EBITDAre* EBITDAre, or EBITDA for Real Estate, is a supplemental performance measure defined by the National Association of Real Estate Investment Trusts (“Nareit”) and intended for real estate companies. It represents earnings before interest expense, income taxes, depreciation and amortization, gains or losses from sales of depreciable property (including gains or losses on change in control), and impairment charges (recoveries) related to depreciable property. Adjusted EBITDAre is defined as EBITDAre excluding impairments (recoveries) related to non-depreciable assets, transaction-related items, prepayment costs (benefits) associated with early retirement or payment of debt, severance and related charges, litigation costs (recoveries), casualty-related charges (recoveries), stock compensation expense, and foreign currency remeasurement losses (gains). EBITDAre and Adjusted EBITDAre include our pro rata share of our unconsolidated JVs presented on the same basis.
Enterprise Debt* Consolidated Debt plus our pro rata share of total debt from our unconsolidated JVs. Enterprise Debt is a supplemental measure of our financial position, which enables both management and investors to analyze our leverage and to compare our leverage to that of other companies. Our pro rata share of total debt from our unconsolidated JVs is not intended to reflect our actual liability or ability to access assets should there be a default under any or all such loans or a liquidation of the JVs.
Enterprise Gross Assets* Consolidated Gross Assets plus our pro rata share of total gross assets from our unconsolidated JVs, after adding back accumulated depreciation and amortization. Enterprise Gross Assets is a supplemental measure of our financial position, which, when used in conjunction with debt-related measures, enables both management and investors to analyze our leverage and to compare our leverage to that of other companies.
Return to TOC44Return to TOC
GlossaryFixed Charges* Total interest expense plus capitalized interest plus preferred stock dividends (if applicable). Fixed Charges also includes our pro rata share of the interest expense plus capitalized interest plus preferred stock dividends (if applicable) of our unconsolidated JVs. Fixed Charges is a supplemental measure of our interest payments on outstanding debt and dividends to preferred stockholders for purposes of presenting Fixed Charge Coverage and Adjusted Fixed Charge Coverage. Fixed Charges is subject to limitations and qualifications, as, among other things, it does not include all contractual obligations.
Funds From Operations (“Nareit FFO”) and FFO as Adjusted* See the “Funds From Operations” definition included in the accompanying Discussion and Reconciliations of Non-GAAP Financial Measures for information regarding Nareit FFO and FFO as Adjusted.
Healthcare Affiliated Represents properties that are on-campus or adjacent to a healthcare system and properties that are leased 1/3 or more to a health system or physician group.
Initial Capital Expenditures (“ICE”) Expenditures required to bring a newly acquired property up to standard. The expenditures are typically identified during underwriting and incurred within the first year of ownership.
Investment and Portfolio Investment* Represents: (i) the carrying amount of real estate assets and intangibles, after adding back accumulated depreciation and amortization and (ii) the carrying amount of DFLs and Debt Investments. Portfolio Investment also includes our pro rata share of the real estate assets and intangibles held in our unconsolidated JVs, presented on the same basis as Investment, and excludes noncontrolling interests' pro rata share of the real estate assets and intangibles held in our consolidated JVs, presented on the same basis. Investment and Portfolio Investment exclude land held for development.
Metropolitan Statistical Areas (“MSA”) Metropolitan Statistical Areas are geographic entities delineated by the Office of Management and Budget for use by Federal Statistical agencies in collecting, tabulating, and publishing Federal statistics. A metro area contains a core urban area of 50,000 or more population, consists of one or more counties and includes the counties containing the core urban area, as well as any adjacent counties that have a high degree of social and economic integration (as measured by commuting to work) with the urban core.
Net Debt*Enterprise Debt less the carrying amount of cash and cash equivalents as reported in our consolidated financial statements and our pro rata share of cash and cash equivalents from our unconsolidated JVs. Net Debt is a supplemental measure of our financial position, which enables both management and investors to analyze our leverage and to compare our leverage to that of other companies.
Enterprise Secured Debt* Consolidated Secured Debt plus our pro rata share of mortgage debt from our unconsolidated JVs. Enterprise Secured Debt is a supplemental measure of our financial position, which enables both management and investors to analyze our leverage and to compare our leverage to that of other companies. Our pro rata share of Enterprise Secured Debt from our unconsolidated JVs is not intended to reflect our actual liability or ability to access assets should there be a default under any or all such loans or a liquidation of the JVs.
Entrance Fees Certain of our communities have residency agreements which require the resident to pay an upfront entrance fee prior to taking occupancy at the community. For net income, NOI, Adjusted NOI, Nareit FFO, FFO as Adjusted, and AFFO, the non-refundable portion of the entrance fee is recorded as deferred entrance fee revenue and amortized over the estimated stay of the resident based on an actuarial valuation. The refundable portion of a resident’s entrance fee is generally refundable within a certain number of months or days following contract termination or upon the sale of the unit. All refundable amounts due to residents at any time in the future are classified as liabilities.
Facility EBITDAR and Facility EBITDARM* Earnings before interest, taxes, depreciation, amortization and rent (and management fees), as applicable, for a particular facility accruing to the operator/tenant of the property (the Company as lessor), for the trailing 12 months and one quarter in arrears from the date reported. We use Facility EBITDAR or Facility EBITDARM in determining CFC and as a supplemental measure of the ability of the property to generate sufficient liquidity to meet related obligations to us. Facility EBITDAR includes: (i) contractual management fees; (ii) an imputed management fee of 5% of revenues for senior housing facilities and post-acute/skilled facilities, or (iii) an imputed management fee of 2% of revenues for hospitals. All facility financial performance data was derived solely from information provided by operators/tenants without independent verification by us. Facility EBITDAR and Facility EBITDARM are subject to the same limitations and qualifications as EBITDA. In addition, Facility EBITDAR and Facility EBITDARM do not represent a borrower’s net income or cash flow from operations and should not be considered alternatives to those indicators. Facility EBITDAR and Facility EBITDARM are not presented for: (i) properties operated under a RIDEA structure; or (ii) newly completed facilities under lease-up, facilities acquired or transitioned to new operators during the relevant trailing 12-month period, vacant facilities, facilities that are held for sale, facilities for which an agreement has been reached to change reporting structure, and facilities for which data is not available or meaningful.
Financial Leverage* Enterprise Debt divided by Enterprise Gross Assets. Financial Leverage is a supplemental measure of our financial position, which enables both management and investors to analyze our leverage and to compare our leverage to that of other companies.
Return to TOC45Return to TOC
GlossaryNet Debt to Adjusted EBITDAre*Net Debt divided by Adjusted EBITDAre is a supplemental measure of our ability to decrease our debt. Because we may not be able to use our cash to reduce our debt on a dollar-for-dollar basis, this measure may have material limitations.
Net Operating Income (“NOI”) and Cash (Adjusted) NOI* NOI is defined as real estate revenues (inclusive of rental and related revenues, resident fees and services, income from direct financing leases, and government grant income and exclusive of interest income), less property level operating expenses (which exclude transition costs); NOI excludes all other financial statement amounts included in net income (loss). Cash (Adjusted) NOI is calculated as NOI after eliminating the effects of straight-line rents, DFL non-cash interest, amortization of market lease intangibles, termination fees, actuarial reserves for insurance claims that have been incurred but not reported, and the impact of deferred community fee income and expense. NOI and Cash (Adjusted) NOI include the Company's pro rata share of NOI and Cash (Adjusted) NOI from its unconsolidated JVs and exclude noncontrolling interests’ pro rata share of NOI and Cash (Adjusted) NOI from consolidated joint ventures.
Occupancy For life science facilities and medical office buildings, Occupancy represents the percentage of total rentable square feet leased where rental payments have commenced, including month-to-month leases, as of the end of the period reported. For senior housing triple-net facilities, post-acute/skilled facilities and hospitals, Occupancy represents the facilities’ average operating Occupancy for the trailing three-month period ended one quarter in arrears from the date reported. For SHOP properties, Occupancy represents the facilities’ average operating Occupancy for the most recent calendar quarter (year-to-date for year-to-date SS) available. The percentages are calculated based on units for senior housing facilities and available beds for post-acute/skilled facilities and hospitals. The percentages shown are weighted to reflect our share and exclude newly completed facilities under lease-up, facilities acquired or transitioned to new operators during the relevant period, vacant facilities, facilities held for sale, facilities for which agreement has been reached to change reporting structure, and facilities for which data is not available or meaningful. All facility financial performance data was derived solely from information provided by operators/tenants/borrowers without independent verification by us.
Portfolio Adjusted NOIPortfolio Adjusted NOI is Portfolio Cash Real Estate Revenues less Portfolio Cash Operating Expenses.
Portfolio Cash Operating Expenses* Consolidated cash operating expenses plus the Company's pro rata share of cash operating expenses from its unconsolidated JVs less noncontrolling interests' pro rata share of cash operating expenses from consolidated JVs. Portfolio Cash Operating Expenses represent property level operating expenses (which exclude transition costs) after eliminating the effects of straight-line rents, lease termination fees, actuarial reserves for insurance claims that have been incurred but not reported, and the impact of deferred community fee expense.
Portfolio Income*Cash (Adjusted) NOI plus interest income plus our pro rata share of Cash (Adjusted) NOI from our unconsolidated JVs less noncontrolling interests' pro rata share of Cash (Adjusted) NOI from consolidated JVs.
Portfolio Real Estate Revenues* and Portfolio Cash Real Estate Revenues* Portfolio Real Estate Revenues include rental related revenues, resident fees and services, income from DFLs, and government grant income which is included in Other income (expense), net in our Consolidated Statement of Operations. Portfolio Real Estate Revenues include the Company's pro rata share from unconsolidated JVs presented on the same basis and exclude noncontrolling interests' pro rata share from consolidated JVs presented on the same basis. Portfolio Cash Real Estate Revenues include Portfolio Real Estate Revenues after eliminating the effects of straight-line rents, DFL non-cash interest, amortization of market lease intangibles, lease termination fees, and the impact of deferred community fee income.
Redevelopment Properties that incur major capital expenditures to significantly improve, change the use, or reposition the property pursuant to a formal redevelopment plan. Newly completed redevelopments, are considered Stabilized at the earlier of lease-up (typically when the tenant(s) controls the physical use of 80% of the space) or 24 months from the date the property is placed in service.
Retention Rate The ratio of total renewed square feet to the total square feet expiring and available for lease, excluding the square feet for tenant leases terminated for default or buy-out prior to the expiration of the lease and leases in assets designated as Held for Sale.
REVPOR CCRC*The 3-month average Cash Real Estate Revenues per occupied unit excluding Cash NREFs for the most recent period available. REVPOR CCRC excludes newly completed assets under lease-up, assets sold, acquired or converted to a new operating structure (such as triple-net to SHOP) during the relevant period, assets in redevelopment, assets that are held for sale, and assets that experienced a casualty event that significantly impacted operations. REVPOR cannot be derived from the information presented for the CCRC portfolio as units reflect 100% of the unit capacities for unconsolidated JVs and revenue is at the Company's pro rata share.
REVPOR Other*The 3-month average Cash Real Estate Revenues per occupied unit for the most recent period available. REVPOR Other excludes newly completed assets under lease-up, assets sold, acquired or converted to a new operating structure during the relevant period, assets in redevelopment, assets that are held for sale, and assets that experienced a casualty event that significantly impacted operations. REVPOR cannot be derived from the information presented for the Other portfolio as units reflect 100% of the unit capacities for unconsolidated JVs and revenue is at the Company's pro rata share.
REVPOR SHOP*The 3-month average Cash Real Estate Revenues per occupied unit for the most recent period available. REVPOR SHOP excludes newly completed assets under lease-up, assets sold, acquired or converted to a new operating structure (such as triple-net to SHOP) during the relevant period, assets in redevelopment, assets that are held for sale, and assets that experienced a casualty event that significantly impacted operations. REVPOR cannot be derived from the information presented for the SHOP portfolio as units reflect 100% of the unit capacities for unconsolidated JVs and revenue is at the Company's pro rata share.
Return to TOC46Return to TOC
GlossaryREVPOR Triple-netThe 3-month average facility revenue per occupied unit, one quarter in arrears from the period presented. Facility revenue consists primarily of resident rents generated at triple-net communities, which are not included in our financial results. Facility revenues are derived solely from information provided by operators/tenants without independent verification by us. REVPOR Triple-net excludes vacant facilities, newly completed assets under lease-up, assets sold, acquired or converted to a new operating structure (such as triple-net to SHOP) during the relevant period, assets that are held for sale, and assets for which agreement has been reached to change reporting structure.
RIDEA A structure whereby a taxable REIT subsidiary is permitted to rent a healthcare facility from its parent REIT and hire an independent contractor to operate the facility.
Same-Store (“SS”)* Same-Store NOI and Cash (Adjusted) NOI information allows us to evaluate the performance of our property portfolio under a consistent population by eliminating changes in the composition of our consolidated portfolio of properties. Same-Store Adjusted NOI excludes amortization of deferred revenue from tenant-funded improvements and certain non-property specific operating expenses that are allocated to each operating segment on a consolidated basis. Properties are included in Same-Store once they are stabilized for the full period in both comparison periods. Newly acquired operating assets are generally considered stabilized at the earlier of lease-up (typically when the tenant(s) control(s) the physical use of at least 80% of the space) or 12 months from the acquisition date. Newly completed developments and redevelopments are considered stabilized at the earlier of lease-up or 24 months from the date the property is placed in service. Properties that experience a change in reporting structure, such as a conversion from a triple-net lease to a RIDEA reporting structure, are considered stabilized after 12 months in operations under a consistent reporting structure. A property is removed from Same-Store when it is classified as held for sale, sold, placed into redevelopment, experiences a casualty event that significantly impacts operations, a change in reporting structure or operator transition has been agreed to, or a significant tenant relocates from a Same-Store property to a non Same-Store property and that change results in a corresponding increase in revenue. We do not report Same-Store metrics for our other non-reportable segments.
Secured Debt Ratio* Enterprise Secured Debt divided by Enterprise Gross Assets. Secured Debt Ratio is a supplemental measure of our financial position, which enables both management and investors to analyze our leverage and to compare our leverage to that of other companies.
* Non-GAAP Supplemental MeasuresReconciliations, definitions, and important discussions regarding the usefulness and limitations of the Non-GAAP Financial Measures used in this report can be found at http://ir.healthpeak.com/quarterly-results.
Share of Consolidated Joint VenturesNoncontrolling interests' pro rata share information is prepared by applying noncontrolling interests' actual ownership percentage for the period and is intended to reflect noncontrolling interests' proportionate economic interest in the financial position and operating results of properties in our portfolio.
Share of Unconsolidated Joint Ventures ("JVs") Our pro rata share information is prepared by applying our actual ownership percentage for the period and is intended to reflect our proportionate economic interest in the financial position and operating results of properties in our portfolio.
Stabilized / StabilizationNewly acquired operating assets are generally considered Stabilized at the earlier of lease-up (typically when the tenant(s) control(s) the physical use of at least 80% of the space) or 12 months from the acquisition date. Newly completed developments and redevelopments are considered Stabilized at the earlier of lease-up or 24 months from the date the property is placed in service. Properties that experience a change in reporting structure, such as a conversion from a triple-net lease to a RIDEA reporting structure, are considered stabilized after 12 months in operations under a consistent reporting structure.
Total Market Equity The total number of outstanding shares of our common stock multiplied by the closing price per share of our common stock on the New York Stock Exchange as of period end, plus the total number of convertible partnership units multiplied by the closing price per share of our common stock on the New York Stock Exchange as of period end (adjusted for stock splits).
Units/Square Feet/Beds/CapacitySenior housing facilities are measured in available units (e.g., studio, one or two bedroom units). Life science facilities and medical office buildings are measured in square feet, excluding square footage for development or square footage removed from service for redevelopment properties prior to completion. Capacities are presented at 100% ownership share.
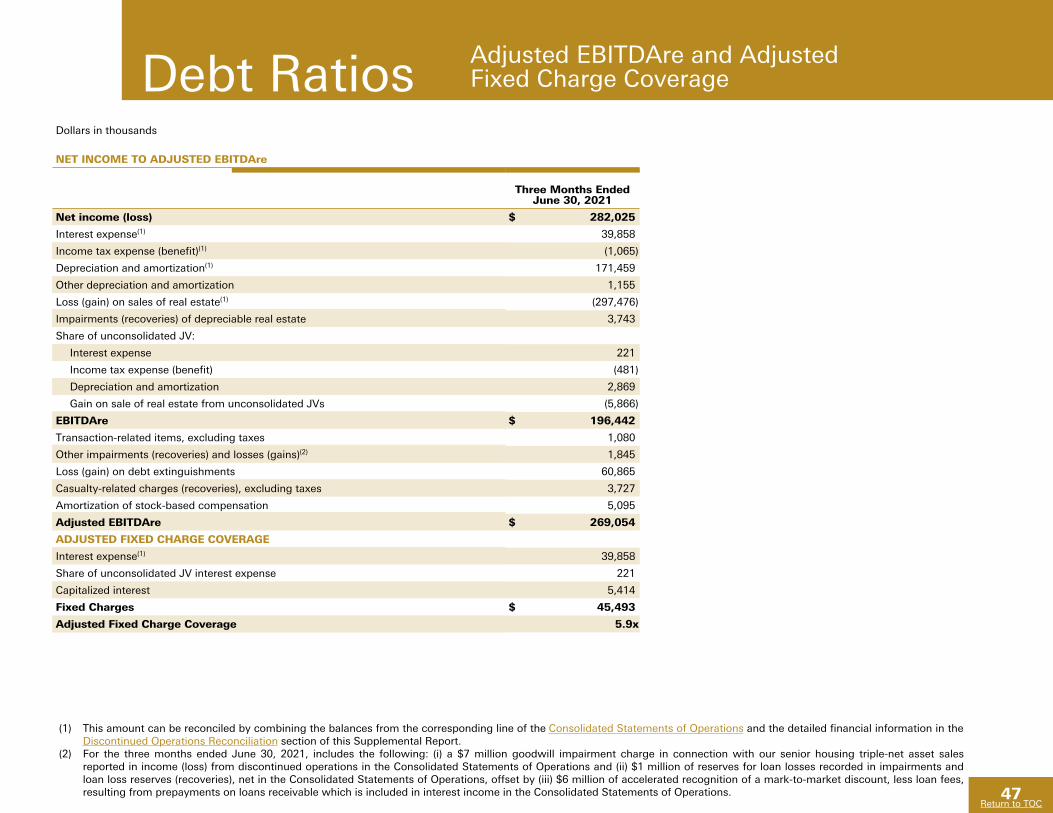
47
Return to TOC
(1) This amount can be reconciled by combining the balances from the corresponding line of the Consolidated Statements of Operations and the detailed financial information in the Discontinued Operations Reconciliation section of this Supplemental Report.
(2) For the three months ended June 30, 2021, includes the following: (i) a $7 million goodwill impairment charge in connection with our senior housing triple-net asset sales reported in income (loss) from discontinued operations in the Consolidated Statements of Operations and (ii) $1 million of reserves for loan losses recorded in impairments and loan loss reserves (recoveries), net in the Consolidated Statements of Operations, offset by (iii) $6 million of accelerated recognition of a mark-to-market discount, less loan fees, resulting from prepayments on loans receivable which is included in interest income in the Consolidated Statements of Operations.
Debt Ratios Adjusted EBITDAre and AdjustedFixed Charge Coverage
Dollars in thousands
NET INCOME TO ADJUSTED EBITDAre
Three Months Ended June 30, 2021
Net income (loss) $ 282,025
Interest expense(1) 39,858
Income tax expense (benefit)(1) (1,065)
Depreciation and amortization(1) 171,459
Other depreciation and amortization 1,155
Loss (gain) on sales of real estate(1) (297,476)
Impairments (recoveries) of depreciable real estate 3,743
Share of unconsolidated JV:
Interest expense 221
Income tax expense (benefit) (481)
Depreciation and amortization 2,869
Gain on sale of real estate from unconsolidated JVs (5,866)
EBITDAre $ 196,442
Transaction-related items, excluding taxes 1,080
Other impairments (recoveries) and losses (gains)(2) 1,845
Loss (gain) on debt extinguishments 60,865
Casualty-related charges (recoveries), excluding taxes 3,727
Amortization of stock-based compensation 5,095
Adjusted EBITDAre $ 269,054
ADJUSTED FIXED CHARGE COVERAGE
Interest expense(1) 39,858
Share of unconsolidated JV interest expense 221
Capitalized interest 5,414
Fixed Charges $ 45,493
Adjusted Fixed Charge Coverage 5.9x
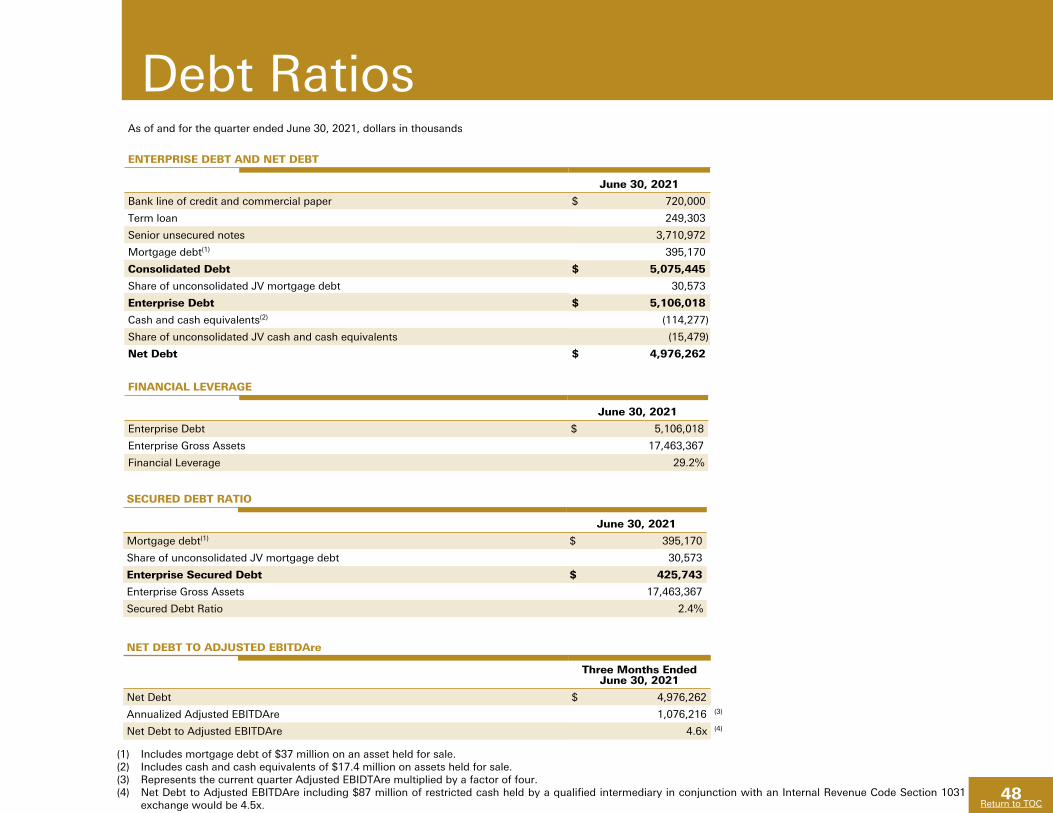
48
Return to TOC
Debt RatiosAs of and for the quarter ended June 30, 2021, dollars in thousands
ENTERPRISE DEBT AND NET DEBT
June 30, 2021
Bank line of credit and commercial paper $ 720,000
Term loan 249,303
Senior unsecured notes 3,710,972
Mortgage debt(1) 395,170
Consolidated Debt $ 5,075,445
Share of unconsolidated JV mortgage debt 30,573
Enterprise Debt $ 5,106,018
Cash and cash equivalents(2) (114,277)
Share of unconsolidated JV cash and cash equivalents (15,479)
Net Debt $ 4,976,262
(1) Includes mortgage debt of $37 million on an asset held for sale. (2) Includes cash and cash equivalents of $17.4 million on assets held for sale. (3) Represents the current quarter Adjusted EBIDTAre multiplied by a factor of four.(4) Net Debt to Adjusted EBITDAre including $87 million of restricted cash held by a qualified intermediary in conjunction with an Internal Revenue Code Section 1031
exchange would be 4.5x.
FINANCIAL LEVERAGE
June 30, 2021
Enterprise Debt $ 5,106,018
Enterprise Gross Assets 17,463,367
Financial Leverage 29.2%
SECURED DEBT RATIO
June 30, 2021
Mortgage debt(1) $ 395,170
Share of unconsolidated JV mortgage debt 30,573
Enterprise Secured Debt $ 425,743
Enterprise Gross Assets 17,463,367
Secured Debt Ratio 2.4%
NET DEBT TO ADJUSTED EBITDAre
Three Months Ended June 30, 2021
Net Debt $ 4,976,262
Annualized Adjusted EBITDAre 1,076,216 (3)
Net Debt to Adjusted EBITDAre 4.6x (4)

Return to TOC49Return to TOC
COMPANY
Information
BOARD OF DIRECTORSBRIAN G. CARTWRIGHTChairman of the Board, Healthpeak Properties, Inc.Former General Counsel, U.S. Securities and Exchange Commission
THOMAS M. HERZOGChief Executive Officer, Healthpeak Properties, Inc.
CHRISTINE N. GARVEYFormer Global Head of CorporateReal Estate Services, Deutsche Bank AG R. KENT GRIFFIN, JR.Managing Director, PHICAS InvestorsFormer President, BioMed Realty Trust, Inc.
EXECUTIVE MANAGEMENTTHOMAS M. HERZOGChief Executive Officer
SCOTT M. BRINKERPresidentChief Investment Officer
THOMAS M. KLARITCHChief Operating Officer
TROY E. MCHENRYChief Legal OfficerGeneral Counsel
DAVID B. HENRYFormer Vice Chairman and Chief Executive Officer,Kimco Realty Corporation
LYDIA H. KENNARDPresident and Chief Executive Officer, KDG Construction Consulting
SARA GROOTWASSINK LEWISFounder and Chief Executive Officer,Lewis Corporate Advisors, LLC
KATHERINE M. SANDSTROMFormer Senior Managing Director,Heitman LLC
PETER A. SCOTTChief Financial Officer
SHAWN G. JOHNSTONExecutive Vice President Chief Accounting Officer
JEFFREY H. MILLERExecutive Vice PresidentDevelopment & CCRC
LISA A. ALONSOExecutive Vice PresidentChief Human Resources Officer

Return to TOC50Return to TOC
Forward-Looking Statements& Risk Factors
Statements contained in this supplemental report that are not historical facts are "forward-looking statements" within the meaning of Section 27A of the Securities Act of 1933, as amended, and Section 21E of the Securities Exchange Act of 1934, as amended. Forward-looking statements include, among other things, statements regarding our and our officers’ intent, belief or expectation as identified by the use of words such as “may,” “will,” “project,” “expect,” “believe,” “intend,” “anticipate,” “seek,” “target,” “forecast,” “plan,” “potential,” “estimate,” “could,” “would,” “should” and other comparable and derivative terms or the negatives thereof. Examples of forward-looking statements include, among other things: (i) statements regarding timing, outcomes and other details relating to current, pending or contemplated acquisitions, dispositions, transitions, developments, redevelopments, densifications, joint venture transactions, leasing activity and commitments, capital recycling plans, financing activities, or other transactions; and (ii) the information presented in the section titled "2021 Guidance and Additional Items." Pending acquisitions, dispositions, and leasing activity including those subject to binding agreements, remain subject to closing conditions and may not be completed within the anticipated timeframes or at all. Forward-looking statements reflect our current expectations and views about future events and are subject to risks and uncertainties that could significantly affect our future financial condition and results of operations. While forward-looking statements reflect our good faith belief and assumptions we believe to be reasonable based upon current information, we can give no assurance that our expectations or forecasts will be attained. Further, we cannot guarantee the accuracy of any such forward-looking statement contained in this supplemental report, and such forward-looking statements are subject to known and unknown risks and uncertainties that are difficult to predict. These risks and uncertainties include, but are not limited to: the COVID-19 pandemic and health and safety measures intended to reduce its spread, the availability, effectiveness and public usage and acceptance of vaccines, and how quickly and to what extent normal economic and operating conditions can resume within the markets in which we operate; operational risks associated with third party management contracts, including the additional regulation and liabilities of our RIDEA lease structures; the ability of our existing and future tenants, operators and borrowers to conduct their respective businesses in a manner sufficient to maintain or increase their revenues and manage their expenses in order to generate sufficient income to make rent and loan payments to us and our ability to recover investments made, if applicable, in their operations; increased competition, operating costs and market changes affecting our tenants, operators and borrowers; the financial condition of our tenants, operators and borrowers, including potential bankruptcies and downturns in their businesses, and their legal and regulatory proceedings; our concentration of investments in the healthcare property sector, which makes us more vulnerable to a downturn in a specific sector than if we invested in multiple industries; our ability to identify replacement tenants and operators and the potential renovation costs and regulatory approvals associated therewith; our property development and redevelopment activity risks, including costs above original estimates, project delays and lower occupancy rates and rents than expected; changes within the life science industry; high levels of regulation, funding requirements, expense and uncertainty faced by our life science tenants; the ability of the hospitals on whose campuses our MOBs are located and their affiliated healthcare systems to remain competitive or financially viable; our ability to maintain or expand our hospital and health system client relationships; economic and other conditions that negatively affect geographic areas from which we recognize a greater percentage of our revenue; uninsured or underinsured losses, which could result in significant losses and/or performance declines by us or our tenants and operators; our investments in joint ventures and unconsolidated entities, including our lack of sole decision making authority and our reliance on our partners’ financial condition and continued cooperation; our use of contingent rent provisions and/or rent escalators based on the Consumer Price Index; competition for suitable healthcare properties to grow our investment portfolio; our ability to make material acquisitions and successfully integrate them; the potential impact on us and our tenants, operators and borrowers from litigation matters, including rising liability and insurance costs; our ability to foreclose on collateral securing our real estate-related loans; laws or regulations prohibiting eviction of our tenants; the failure of our tenants and operators to comply with federal, state and local laws and regulations, including resident health and safety requirements, as well as licensure, certification and inspection requirements; required regulatory approvals to transfer our healthcare properties; compliance with the Americans with Disabilities Act and fire, safety and other health regulations; the requirements of, or changes to, governmental reimbursement programs such as Medicare or Medicaid; legislation to address federal government operations and administration decisions affecting the Centers for Medicare and Medicaid Services; our participation in the CARES Act Provider Relief Program and other COVID-19 related stimulus and relief programs; volatility or uncertainty in the capital markets, the availability and cost of capital as impacted by interest rates, changes in our credit ratings and the value of our common stock, and other conditions that may adversely impact our ability to fund our obligations or consummate transactions, or reduce the earnings
Continued
50Return to TOC
Cambridge ParkBoston, MA
Return to TOC51Return to TOC
from potential transactions; cash available for distribution to stockholders and our ability to make dividend distributions at expected levels; our ability to manage our indebtedness level and covenants in and changes to the terms of such indebtedness; changes in global, national and local economic and other conditions; provisions of Maryland law and our charter that could prevent a transaction that may otherwise be in the interest of our stockholders; environmental compliance costs and liabilities associated with our real estate investments; our ability to maintain our qualification as a real estate investment trust (“REIT”); changes to U.S. federal income tax laws, and potential deferred and contingent tax liabilities from corporate acquisitions; calculating non-REIT tax earnings and profits; ownership limits in our charter that restrict ownership in our stock; our reliance on information technology systems and the potential impact of system failures, disruptions or breaches; unfavorable litigation resolution or disputes; the loss or limited availability of our key personnel; and other risks and uncertainties described from time to time in our Securities and Exchange Commission (SEC) filings. Except as required by law, we do not undertake, and hereby disclaim, any obligation to update any forward-looking statements, which speak only as of the date on which they are made.
The information in this supplemental report should be read in conjunction with our Annual Report on Form 10-K, Quarterly Reports on Form 10-Q, Current Reports on Form 8-K, and other information filed with the SEC. The Reporting Definitions (and Reconciliations of Non-GAAP Financial Measures) are an integral part of the information presented herein. You can access these documents on our website, www.healthpeak.com, free of charge, as well as amendments to those reports filed or furnished pursuant to Section 13(a) or 15(d) of the Exchange Act, as soon as reasonably practicable after such material is electronically filed with, or furnished to, the SEC. The information contained on our website is not incorporated by reference into, and should not be considered a part of, this supplemental report.
In addition, the SEC maintains a website that contains reports, proxy and information statements, and other information regarding issuers, including the Company, that file electronically with the SEC at www.sec.gov.
This supplemental report also includes market and industry data that the Company has obtained from market research, publicly available information and industry publications. The accuracy and completeness of such information are not guaranteed. The market and industry data is often based on industry surveys and preparers’ experience in the industry. Similarly, although the Company believes that the surveys and market research that others have performed are reliable, such surveys and market research are subject to assumptions, estimates and other uncertainties and the Company has not independently verified this information.
For more information, contact Andrew Johns, Vice President - Corporate Finance and Investor Relations, at (720) 428-5050.
Forward-Looking Statements& Risk Factors (concluded)
51Return to TOC
65 Hayden AvenueBoston, MA
healthpeak.com
________________________________________________________
Irvine, CA
1920 Main Street, Suite 1200Irvine, CA 92614
_______________________________________________________
Nashville, TN
3000 Meridian Boulevard, Suite 200Franklin, TN 37067
_________________________________________________________
Corporate HQ, Denver, CO
5050 South Syracuse Street, Suite 800Denver, CO 80237(720) 428 - 5050