EARNINGS PRESSURE AND COMPETITIVE BEHAVIOR: EVIDENCE …
27
EARNINGS PRESSURE AND COMPETITIVE BEHAVIOR: EVIDENCE FROM THE U.S. ELECTRICITY INDUSTRY YU ZHANG University of California, Irvine JAVIER GIMENO INSEAD This study examines the effect of pressure felt by management to meet or beat analysts’ earnings forecasts on firms’ behavior in oligopolistic output competition. We argue that firms under such earnings pressure strive to increase current profits by exploiting market power opportunities and tightening output, even though these acts could encourage rival output expansion. Using data from the U.S. electricity generation industry, we found that firms facing earnings pressure tended to restrict output in markets in which market structure and competitor characteristics were favorable for the exercise of market power, but their competitors tended to increase output in those markets. Agency theorists have traditionally interpreted the performance expectations set by capital mar- kets as efficient mechanisms for shareholder mon- itoring (Jensen, 1986; Jensen & Meckling, 1976). Yet, dissenting work in strategy and finance has emerged, expressing concern about the likely ef- fects of such capital market pressures on long-term strategy (Jensen, 2005; Porter, 1992; Stein, 1989). Managers often complain that capital market ex- pectations shift their focus toward current earnings and away from long-term strategic commitments. For instance, Ted Turner, founder of CNN, com- mented: “When all companies are quarterly earn- ings– obsessed, the market starts punishing compa- nies that aren’t yielding an instant return. This not only creates a big incentive for bogus accounting, but also it inhibits the kind of investment that builds economic value” (Turner, 2005: 229). In a recent worldwide survey by McKinsey & Company (2006), 42 percent of respondents (managers and board members of publicly traded firms) strongly agreed that issuing earnings guidance and trying to meet earnings expectations from equity analysts led their firms to focus more on short-term earn- ings. Another survey, by Graham, Harvey, and Ra- jgopal (2005), indicated that 80 percent of respon- dents (chief financial officers [CFOs] and financial executives) would decrease discretionary spending on R&D, advertising, or maintenance to meet an earnings target, and 60 percent would avoid initi- ating a positive net present value (NPV) project if it meant falling short of analysts’ consensual earnings forecasts. This strong contrast between theory and practice highlights the importance of examining the impact of earnings pressure on firms’ behaviors and the types of actions firms choose to deal with such pressure. We define earnings pressure as the ten- sion felt by management about meeting or beating analysts’ earnings forecasts (Levitt, 1998). Graham et al.’s (2005) survey suggested that CFOs viewed earnings as the most important performance mea- sure reported to outsiders. Seventy-three percent of respondents considered analyst consensus fore- casts as an important benchmark, and over 80 per- cent believed that meeting earnings benchmarks helped to build credibility in the capital market and to maintain or increase their firm’s stock price. In general, a management can respond to earn- ings pressure in multiple ways, such as ignoring it (King, 2004), managing expectations (earnings guidance) by communicating more effectively with capital market agents (Bernhardt & Campello, We appreciate feedback from Raffi Amit, Mary Benner, Weiru Chen, James Constantini, Parthiban David, Gary Dushnitsky, Douglas Frank, Igal Hendel, Dawn Matsu- moto, Steven Monahan, Vicente Salas Fuma ´s, Peter Zem- sky, and seminar participants at the Academy of Man- agement 2007 annual meeting, Copenhagen Business School, HEC Paris, IESE, INSEAD, London Business School, National University of Singapore, Singapore Management University, Wharton School, University of California at Irvine, University of Michigan, University of North Carolina, and University of Zaragoza. We also ap- preciate the help given by Kenneth McClevey, Glenn McGrath, Robert Schnapp, Antoine Smith, Howard Stone, Sharon Sutton, and Channele Wirman at the En- ergy Information Administration, who provided access to and knowledge about the databases. Academy of Management Journal 2010, Vol. 53, No. 4, 743–768. 743 Copyright of the Academy of Management, all rights reserved. Contents may not be copied, emailed, posted to a listserv, or otherwise transmitted without the copyright holder’s express written permission. Users may print, download or email articles for individual use only.
Transcript of EARNINGS PRESSURE AND COMPETITIVE BEHAVIOR: EVIDENCE …

EARNINGS PRESSURE AND COMPETITIVE BEHAVIOR:EVIDENCE FROM THE U.S. ELECTRICITY INDUSTRY
YU ZHANGUniversity of California, Irvine
JAVIER GIMENOINSEAD
This study examines the effect of pressure felt by management to meet or beat analysts’earnings forecasts on firms’ behavior in oligopolistic output competition. We arguethat firms under such earnings pressure strive to increase current profits by exploitingmarket power opportunities and tightening output, even though these acts couldencourage rival output expansion. Using data from the U.S. electricity generationindustry, we found that firms facing earnings pressure tended to restrict output inmarkets in which market structure and competitor characteristics were favorable forthe exercise of market power, but their competitors tended to increase output inthose markets.
Agency theorists have traditionally interpretedthe performance expectations set by capital mar-kets as efficient mechanisms for shareholder mon-itoring (Jensen, 1986; Jensen & Meckling, 1976).Yet, dissenting work in strategy and finance hasemerged, expressing concern about the likely ef-fects of such capital market pressures on long-termstrategy (Jensen, 2005; Porter, 1992; Stein, 1989).Managers often complain that capital market ex-pectations shift their focus toward current earningsand away from long-term strategic commitments.For instance, Ted Turner, founder of CNN, com-mented: “When all companies are quarterly earn-ings–obsessed, the market starts punishing compa-nies that aren’t yielding an instant return. This notonly creates a big incentive for bogus accounting,but also it inhibits the kind of investment thatbuilds economic value” (Turner, 2005: 229). In a
recent worldwide survey by McKinsey & Company(2006), 42 percent of respondents (managers andboard members of publicly traded firms) stronglyagreed that issuing earnings guidance and trying tomeet earnings expectations from equity analystsled their firms to focus more on short-term earn-ings. Another survey, by Graham, Harvey, and Ra-jgopal (2005), indicated that 80 percent of respon-dents (chief financial officers [CFOs] and financialexecutives) would decrease discretionary spendingon R&D, advertising, or maintenance to meet anearnings target, and 60 percent would avoid initi-ating a positive net present value (NPV) project if itmeant falling short of analysts’ consensual earningsforecasts.
This strong contrast between theory and practicehighlights the importance of examining the impactof earnings pressure on firms’ behaviors and thetypes of actions firms choose to deal with suchpressure. We define earnings pressure as the ten-sion felt by management about meeting or beatinganalysts’ earnings forecasts (Levitt, 1998). Grahamet al.’s (2005) survey suggested that CFOs viewedearnings as the most important performance mea-sure reported to outsiders. Seventy-three percent ofrespondents considered analyst consensus fore-casts as an important benchmark, and over 80 per-cent believed that meeting earnings benchmarkshelped to build credibility in the capital marketand to maintain or increase their firm’s stock price.
In general, a management can respond to earn-ings pressure in multiple ways, such as ignoringit (King, 2004), managing expectations (earningsguidance) by communicating more effectively withcapital market agents (Bernhardt & Campello,
We appreciate feedback from Raffi Amit, Mary Benner,Weiru Chen, James Constantini, Parthiban David, GaryDushnitsky, Douglas Frank, Igal Hendel, Dawn Matsu-moto, Steven Monahan, Vicente Salas Fumas, Peter Zem-sky, and seminar participants at the Academy of Man-agement 2007 annual meeting, Copenhagen BusinessSchool, HEC Paris, IESE, INSEAD, London BusinessSchool, National University of Singapore, SingaporeManagement University, Wharton School, University ofCalifornia at Irvine, University of Michigan, University ofNorth Carolina, and University of Zaragoza. We also ap-preciate the help given by Kenneth McClevey, GlennMcGrath, Robert Schnapp, Antoine Smith, HowardStone, Sharon Sutton, and Channele Wirman at the En-ergy Information Administration, who provided access toand knowledge about the databases.
� Academy of Management Journal2010, Vol. 53, No. 4, 743–768.
743
Copyright of the Academy of Management, all rights reserved. Contents may not be copied, emailed, posted to a listserv, or otherwise transmitted without the copyright holder’s expresswritten permission. Users may print, download or email articles for individual use only.

2007), engaging in “creative accounting” (such ascapitalizing rather than expensing some costs, ormanaging discretionary accruals) (Degeorge, Patel,& Zeckhauser, 1999), or making business decisionsto accommodate the pressure (Graham et al., 2005).Researchers in accounting and finance have ex-plored how earnings pressure may affect financialcommunications and accounting manipulations(Burgstahler & Eames, 2006) and have revealed dra-matic stock reactions when firms miss earningsforecasts (Skinner & Sloan, 2002). Yet an importantquestion for strategic management scholars andpractitioners is whether firms make substantivechanges in business actions (such as competitivebehaviors, tangible or intangible investments, entryor exit into markets) in response to earnings pres-sure, and if so, whether these changes are beneficialor detrimental for long-term competitiveness.
This study focuses on the impact of earningspressure on product-market competitive behaviorin oligopolistic markets. Competitive behavior inoligopolistic industries involves managing trade-offs between current earnings and future competi-tiveness, particularly in regulating the exercise ofmarket power when firms have powerful positions.In oligopolistic industries, firms have varying de-grees of market power, depending on the marketstructure in which they function, their extent ofdominance in the market, and the extent of theircompetitors’ motivation and ability to respond ag-gressively. In industries with differentiated prod-ucts, firms with market power may increase prices,with the expectation that demand will not reduceexcessively. In commodity industries, firms withmarket power may influence prices and currentearnings by restraining the output supplied to themarket (Jacquemin & Slade, 1989). However, exer-cising market power (by restricting output or in-creasing prices) may hinder future competitivenessby inciting competitive expansions by rivals or en-trants that could have been preempted by moreaggressive competitive behavior (Caves, Fortunato,& Ghemawat, 1984; Kamien & Schwartz, 1975). Sofirms with market power experience an intertem-poral trade-off between generating current earningsby exercising their potential market power, andmaintaining long-term competitiveness by pre-empting competitors’ expansions.
Earnings pressure, we argue, affects how firmsregulate their competitive behavior and resolve thatcompetitive intertemporal trade-off. Here, we ex-amined the effect of earnings pressure on compet-itive behavior in the U.S. electricity generation in-dustry. This is a commodity industry in whichcompetition intensity is based on available outputrelative to demand. We argue that earnings pres-
sure encourages dominant firms to exercise marketpower by restricting output so as to increase pricesand current earnings, even though such behaviormay encourage output expansion by competitorsand undermine competitiveness. Consequently, weexplore contingencies that regulate the incentivesto exercise market power. We also examine howearnings pressure influences competitive interac-tion and the competitive behavior of rivals.
To our knowledge, this is the first study to exam-ine the effect of earnings pressure on competitivestrategy decisions. It contributes to a small butgrowing literature on how capital markets and fi-nancial conditions affect firms’ competitive deci-sions. Prior work in this stream has focused mainlyon the role of financial leverage on competitivedecisions (Chevalier, 1995a, 1995b; Phillips, 1995),whereby cash flow requirements to cover interestpayments impose a short-term constraint on com-petitive decisions. Our study shifts attention from“hard” constraints imposed by capital structure,such as debt covenants, to “soft” constraints asso-ciated with the management of capital market ex-pectations. In addition, though leverage representsa constraint on short-term cash flows, earningspressure influences the trade-off between currentand future earnings. Our study shows that pres-sures from capital markets may shift the emphasistoward current earnings generation, affecting thecompetitive behavior of firms and the competitiveinteractions in oligopolistic competitive environ-ments (Porter, 1992; Stein, 1989). It adds to emerg-ing understanding of the impact of investment an-alysts and capital markets on firm behavior andperformance (Benner, 2007; Moreton & Zenger,2005; Zuckerman, 1999, 2000).
THEORY AND HYPOTHESES
Earnings Pressure: Antecedents and Effects
Earnings pressure results from the complex dy-namic interactions between investors, investmentanalysts, and managers, in a context characterizedby uncertainty, asymmetric information, imperfectobservability of managerial actions, and potentialconflicts of interest. Given consistent operating andaccounting practices, managements develop inter-nal expectations about their firms’ future perfor-mance that are based on historical performance,comparisons with peer firms (Cyert & March, 1963;Greve, 2003), and estimates about internal and ex-ternal changes (Chen, 2008; Gavetti & Levinthal,2000). Managers experience attainment discrepancywhen, for a given future or ongoing period of activity(year or quarter), the consensus of external analysts’
744 AugustAcademy of Management Journal

earnings forecasts is above the internal expectationsof management about future company earnings(Wiseman & Bromiley, 1996). Earnings pressure mayresult from the confluence of two intertwined condi-tions: (1) divergence between analysts’ and manage-ment’s earnings expectations and (2) the large actualand perceived market penalties for a company miss-ing earnings forecast consensus.
The role of investment analysts is not to provideperformance targets for management, but to evalu-ate a number of stocks and provide buy, hold, orsell recommendations to investors. As part of thejustification for their recommendations, analystsforecast future company earnings in their reports.For their forecasts, analysts do not limit themselvesto using historical information or stock market in-formation, but also use information disclosed bymanagers about a company’s past performance andfuture prospects, external information about thecompany and its environment, and their own re-search and professional judgment (Schipper, 1991).There is evidence that analysts with greater forecastaccuracy benefit from improved reputation and bet-ter career promotions (Stickel, 1992). However, de-spite the overarching objective of accuracy, ana-lysts are exposed to diverse organizational andcareer incentives that may cause systematic biasesin their forecasts. First, there is substantial evi-dence of optimism bias in analysts’ forecasts andrecommendations (Chopra, 1998; Dreman & Berry,1995). This optimism bias has been associated withconflicts of interests, such as the incentives tomaintain underwriting relationships with a cov-ered firm (Dechow, Hutton, & Sloan, 1999a; Dugar& Nathan, 1995; Lin & McNichols, 1998; Michaely& Womack, 1999) or to generate sales and tradingcommissions for the employer brokerage house(Cowen, Groysberg, & Healy, 2006). Hong and Ku-bik (2003) found that, controlling for relative fore-cast accuracy, analysts with greater optimism biasexperienced superior career progressions. Second,analysts also exhibit a herding bias as a result ofcareer and reputation concerns. Inexperienced an-alysts who deviate from the consensus others havearrived at are more likely to be terminated (Hong,Kubik, & Solomon, 2000). Consequently, analyststend to release forecasts similar to those previouslyannounced by other analysts, even when their in-formation does not justify doing so (Trueman,1994). Therefore, although analysts provide richand informative individual forecasts, in aggregatethese forecasts may exhibit excessive consensustoward optimistic earnings projections.
Firms’ managements can influence the formationof analysts’ forecasts by the public disclosure ofinternal information and objectives, or “public
earnings guidance” (Cotter, Tuna, & Wysocki,2006). Because of the perceived penalties for miss-ing earnings forecasts, managements may use pub-lic guidance to “talk down” the analysts’ forecastsso that they are easier to meet or beat. Offeringguidance, however, is costly in terms of manage-ment attention, and risky for a firm’s reputation forcredibility. Chen (2004) showed that stock marketreactions to negative earnings surprises were moredrastic if a firm failed to meet its own guidance. Asa consequence, public guidance releases tend to beinfrequent and overly conservative, as firms seek to“under-promise and over-deliver” (Graham et al.,2005: 42). Cotter et al. (2006) found that firms is-sued guidance for only about 22 percent of reportedearnings and that guidance was disproportionallyused when analysts’ forecasts were perceived asoverly optimistic. Most management guidancetends to be pessimistic, not only relative to ana-lysts’ forecasts, but also relative to the earningsactually reported (Chen, 2004). In fact, CFOs tendto publicly announce targets that are below theirfirms’ internal expectations so as to maximizechances of a positive surprise (Graham et al., 2005:42). Although analysts adjust their forecasts to newguidance, most analysts anticipate a conservativebias in guidance and do not fully match it in theirforecasts (Cotter et al., 2006). In consequence, theinteractions between analysts and management inthe formation of earnings forecasts might be viewedas a negotiation process (with analysts taking anoptimistic stance and management taking a morepessimistic position in public guidance), whichmay explain the divergence between consensualforecasts and internal management expectations.
The second factor contributing to earnings pres-sure is the large perceived and actual stock pricedecline suffered by a company that fails to meet anearnings forecast consensus. For example, Skinnerand Sloan (2002) found that unexpectedly missingearnings forecasts by 1 percent could lead to anegative abnormal stock market return of 15 per-cent for growth stocks and 5 percent for valuestocks. This stock price reduction can have a largeimpact on managers’ stock options compensation(Hall & Liebman, 1998). Failing to meet analysts’earnings forecasts is also a strong predictor of CEOturnover (Puffer & Weintrop, 1991).
In principle, it is not obvious why management,rather than analysts, should be penalized whenreported earnings differ from analysts’ forecasts(Dechow & Skinner, 2000). One reason for the stockmarket penalty is that investors use analysts’ fore-casts to form their valuation of stocks and thereforeupdate their expectations of future earnings levelsand growth rates when those forecasts are not met.
2010 745Zhang and Gimeno
Because investors have limited cognitive capabilityto process available information, and informationsearch costs are high, they are willing to use ana-lysts’ forecasts to help them infer a firm’s perfor-mance (Degeorge et al., 1999). Recent research hasshown that although some (more sophisticated) in-vestors were aware of possible biases in certainanalysts’ forecasts and tried to correct for it (Mal-mendier & Shanthikumar, 2007; Mikhail, Walther,& Willis, 2007), the overall market was not able tofully correct for such biases (Hayes & Levine, 2000).When a negative earnings surprise happens, inves-tors must determine how much to update theirprior beliefs about future earnings. Two sources ofasymmetric information between investors andmanagement contribute to a large negative updat-ing of expectations. First, investors lack detailedinformation about the management actions andbusiness fundamentals that impact future earnings,and they therefore rely heavily on inferences fromcurrent earnings to assess long-term value (De-chow, Hutton, & Sloan, 1999b). An earnings sur-prise therefore leads to a quick update of expecta-tions about future earnings levels and growth rates(Skinner & Sloan, 2002). Second, investors lackinformation about the credibility of a firm’s re-ported earnings but are aware of management in-centives to meet earnings forecasts and understandthat management has some discretion to smooth ormanipulate reported earnings to meet forecasts (bymanaging accounting accruals, deferral or capitali-zation of expenses, delay of investments, or otherchanges in business decisions). Therefore, the in-ability to meet earnings forecasts is perceived as acue about more serious underlying problems(Stein, 1989). Both reasons lead investors to heavilydiscount a stock after a negative earnings surprise(Graham et al., 2005: 30). The intensity of the stockmarket response and the negative personal conse-quences for managers’ incomes and careers rein-force the strong incentive for managers to meetearnings expectations.
Because both analysts’ forecasts and potentialearnings are updated via additional informationand ongoing interactions between analysts andmanagement, earnings pressure is a dynamic phe-nomenon. In this article, we focus on the effects ofearnings pressure during a period of business ac-tivity. To avoid reverse causation, we examinedearnings pressure at the beginning of that period.Managers had various means to manage earningspressure during the period. One approach, as de-scribed above, is to disclose additional informationduring the period or prior to earnings announce-ments to guide analysts’ forecasts downward to-ward achievable levels (Bernhardt & Campello,
2007). Another approach, typically taken at thetime of earnings announcement (i.e., after the clos-ing of accounts), is to use “creative” accounting tomeet earnings expectations, such as capitalizingexpenditures and managing discretionary accruals(Degeorge et al., 1999), or to use symbolic languageto reduce the negative impact when reporting earn-ings below analysts’ consensual expectations(Pozner & Zajac, 2005). Finally, managers maychange real business decisions affecting revenuesor expenses during a period in order to increasecurrent earnings (Graham et al., 2005). Our studyfocuses on this third mechanism.
From a strategic management perspective, a ma-jor concern is whether earnings pressure leads tochanges in business decisions and whether thosechanges have a beneficial or detrimental effect onfuture performance. So far, the debate has mainlybuilt on anecdotal evidence (Abegglen & Stalk, 1985;Porter, 1992; Useem, 1996), interviews or surveyswith managers (Graham et al., 2005; McKinsey &Company, 2006), classroom experiments (Bhojraj &Libby, 2005), or indirect inference from financialstatements (Roychowdhury, 2006). There is no sys-tematic direct evidence of the consequences of earn-ings pressure for firms’ behavior and performance.
The effect of earnings pressure on long-term per-formance hinges on whether firms face a bindingintertemporal trade-off between current and futureearnings (i.e., whether increasing current earningswould reduce future earnings), and the nature ofthat trade-off. Previous research on myopic corpo-rate behavior has tended to focus on intertemporaltrade-offs due to long-term investments, particularlyif those investments involve current (i.e., noncapital-ized) expenses, such as discretionary R&D and mar-keting expenses, that reduce current earnings whilecreating future intangible assets that are difficult forinvestors to measure (Stein, 1989). In these situations,myopic firms can easily increase current earnings byreducing investment in intangible assets (e.g.,Bushee, 1998; David, Hitt, & Gimeno, 2001; Hoskis-son, Hitt, Johnson, & Grossman, 2002).
Another source of intertemporal trade-offs iscompetitive interactions. Firms’ current competi-tive decisions, such as pricing or output decisions,influence not only current earnings, but also futurecompetitive reactions and long-term competitive-ness. For example, firms with aggressive behaviorin output competition may discourage output ex-pansion by competitors and preempt future entry(Ghemawat, 1984; Lieberman, 1987). Firms that re-spond in an aggressive (rather than accommodat-ing) way to new entry or rival expansion may buildreputations for toughness that deter similar expan-sions in the future (Milgrom & Roberts, 1982).
746 AugustAcademy of Management Journal
Therefore, it is important to examine the impact ofearnings pressure on firms’ competitive behavior inoligopolistic contexts.
Competitive Behavior under Earnings Pressure
We define competitive behavior as decisions oractions that improve a firm’s market position rela-tive to its competitors (Grimm, Lee, & Smith, 2006:22). In a general context, competitive behavior mayinclude decisions that provide superior customervalue (either by increasing the customers’ willing-ness to pay for the firm’s products relative to rivalofferings, or by reducing the price), or that preemptmarket space from competitors. Two trade-offs typ-ically determine the intensity of competitive be-havior: a static trade-off between margins and vol-umes, which determines current earnings, and adynamic, or intertemporal, trade-off between cur-rent and future earnings. In the static trade-off,aggressive competitive behavior (decreasing price,increasing marketing expenses, expanding output)can reduce unit margins and will only be effectiveif it results in sufficient volume increase to com-pensate for the lower unit margins. In particular,firms with market power (firms with dominantmarket shares in concentrated markets and withrivals that are unwilling or unable to challengethem) can expand current profits by reducing theaggressiveness of their competitive behavior (in-creasing prices, tightening supply), since the in-crease of margins over a large volume will compen-sate for some moderate reduction in volumes.However, the short-term exercise of market powercan hamper future competitiveness and profitabil-ity, creating an intertemporal trade-off betweencurrent and future earnings (Caves et al., 1984).
In commodity industries, the main competitivedecisions firms make concern capacity invest-ments, which are difficult to adjust in the shortterm, and output decisions, which are limited bycapacity and determine market-clearing prices (theprice at which supply equals demand) and compet-itive intensity. Because earnings pressure takesplace over a short period (a quarter or a year), wefocus on its effect on determining output relative toavailable capacity, also known as capacity utiliza-tion. Output decisions in oligopolistic competitionare highly interactive, since firms’ output decisionsaffect market-clearing prices and competitors’ out-put decisions. This mutual adjustment of outputdecisions, and the equilibrium outcomes, are cap-tured in simplified form in the Cournot oligopolymodel (Cournot, 1838), whereby firms make simul-taneous interdependent output decisions that de-termine market-clearing prices and profits.
Capacity utilization is first determined by thestatic trade-off between volume and margin. Facingthis trade-off, firms acting as price takers (e.g., firmsin fragmented markets or with low market shares)generally seek capacity utilization that is as high aspossible (thereby spreading fixed costs over greatervolume), as they face technical and economic lim-itations, such as demand volatility and variation inthe relative cost efficiency of their different produc-tion units. However, when firms have marketpower and sufficient capacity and output share toinfluence market-clearing prices, they recognizethat increasing capacity utilization in marginalunits may decrease market-clearing prices and mar-gins for other units. Absent intertemporal trade-offs, the tension between reducing average costs byincreasing utilization versus increasing prices byrestricting output determines capacity utilization.1
Intertemporal trade-offs between current and fu-ture earnings may also influence capacity utiliza-tion. Research in industrial economics has sug-gested that both capacity and output levels affectthe development of attractive future competitivepositions. Capacity and output competition repre-sent competition in “strategic substitutes,” whereinone party’s competitive action level leads to a re-duction of the other party’s action level (Fudenberg& Tirole, 1984). Building and maintaining excesscapacity may provide a credible commitment todeter entry or rival expansion (Ghemawat, 1984;Lieberman, 1987; Spence, 1977). In addition, for agiven level of installed capacity, greater output lev-els (i.e., greater capacity utilization) reduce resid-ual demand for competitors, reduce market-clear-ing prices, and generally discourage outputexpansion by rivals and potential entrants. Thisbehavior, known as “limit pricing” in the econom-ics literature (Bain, 1949; Lieberman, 1987), sug-gests that higher output and capacity utilization byincumbents (and therefore lower prices) preventoutput and capacity expansion by rivals and poten-
1 In an oligopolistic competition market, the optimal static
output decision is determined by MC(qi) � MR(qi) � P�1 �
si
��� � P, where MC is marginal cost, MR is marginal reve-
nue, P is market price, si is firm i’s market share, � is thedemand elasticity, and � is a “competitive conduct pa-rameter” that measures how a firm’s decreased outputaffects total market output (including the output fromcompetitors) (Bresnahan, 1989). Therefore, output reduc-tion associated with exercising market power will begreater when market share is high and elasticity is low,and when competitor output expansions will not under-mine a firm’s output reduction.
2010 747Zhang and Gimeno
tial entrants and encourage the exit of marginal rivals.These mechanisms have been empirically supportedin several industries (Masson & Shaanan, 1986).Limit pricing represents a sacrifice of short-termprofits relative to the potential profits from fullexercise of pricing power, but a potential enhance-ment of future performance. For firms with marketpower, this tension constitutes an intertemporaltrade-off between maximizing current earnings andmaintaining strong competitive positions for thefuture (Caves et al., 1984).
We argue that earnings pressure shifts the bal-ance between short-term exercise of pricing powerand future competitive preemption. Companieswhose management is not facing earnings pressureare more likely to sacrifice some potential earningsto preempt entry and rival expansion. Given theirexisting capacity, their level of capacity utilizationshould be higher than the level that would maxi-mize current earnings by exploiting the availablemarket power (Kamien & Schwartz, 1975). In con-trast, firms whose managements face earnings pres-sure (abbreviated hereafter to “firms facing earn-ings pressure”) need to meet current earningsexpectations and are more likely to exercise theshort-term pricing power available to them, even ifthat encouraged rival expansion or entry (Caveset al., 1984). This logic suggests the following:
Hypothesis 1. Firms facing greater earningspressure have lower capacity utilization rela-tive to available capacity, other things beingconstant.
The Role of Market Structure andCompetitive Environment
Hypothesis 1 is proposed as a main effect ofearnings pressure on capacity utilization levels.However, our theory suggests that the presence andintensity of this effect depend on structural contin-gencies, and particularly the extent to which a firmhas pricing power. If a firm has little or no pricingpower, a reduction of capacity utilization, as pro-posed above, could be self-defeating, since the firmwould sacrifice volume to spread fixed costs with-out gaining any additional margin per unit. There-fore, variables that reflect the extent of pricingpower should moderate the relationship betweenearnings pressure and capacity utilization. Marketpower implies that a firm has sufficient output andcapacity position to influence market-clearingprices and that its competitors are unwilling orunable to quickly expand output to make up for ashortage it creates as the dominant firm. In partic-ular, we focus on four general dimensions: the capac-
ity share dominance of a firm within a particularmarket, market concentration among the remainingincumbents, goal heterogeneity among incumbents,and competitors’ capacity constraints.2
Dominant capacity share. When a firm with adominant capacity share restricts output, it createsa price “umbrella” that benefits its remaining out-put in the market. Therefore, the loss of volume iscompensated for by the gain in margin over itsremaining output. Moreover, because this firm hasa dominant share of capacity, it can restrict enoughof its capacity to meaningfully influence prices. Incontrast, firms with lower shares of capacity haveneither the ability nor the motivation to act as pricemakers. Given their limited capacity, restrictingoutput may not be sufficient to generate the desiredincrease in market prices. Even if they can affectprices, the gain on margins will affect a smallerremaining output, and the benefit will be lower.Therefore, in general, firms with significant capac-ity share are more motivated to act as price makersand to restrain capacity utilization to maintainprices and margins (Chen & Hambrick, 1995; Jac-quemin & Slade, 1989), even though this may resultin future market share erosion (Caves et al., 1984;Ferrier, Smith, & Grimm, 1999). Firms with limitedcapacity share tend to act as price takers and tofree-ride on the price umbrella created by the dom-inant firms.
If earnings pressure puts an emphasis on currentearnings generation, we would expect its negativeeffect on capacity utilization to be particularlyprevalent among firms with dominant capacityshare rather than those with limited capacity share.For firms with limited share, decreasing capacityutilization will fail to increase prices and thereforewill not help the firms meet their current earningstargets (in fact, it will reduce earnings). For domi-nant firms, however, for a given available capacitythis restriction on capacity utilization will allowthem to increase current earnings, albeit at the riskof encouraging rival output expansion.
Hypothesis 2a. The effect of earnings pressureon capacity utilization level is more negativewhen firms have larger capacity shares.
Market concentration. A firm’s ability to act as aprice maker depends on the likely responses by
2 These dimensions are linked to the general formula
for marginal revenue �MR � P�1 �si
���� in footnote 1 as
well, since market share is a factor in the model (si), andmarket concentration, goal heterogeneity, and competi-tors’ capacity constraints are linked to the competitiveconduct parameter (�).
748 AugustAcademy of Management Journal
other incumbents. If the firm faces a fragmentedmarket structure with many competitors, this couldreduce the short-term benefit of restraining output,since these competitors are likely to expand outputaccordingly. On the other hand, if the rest of themarket is concentrated in a few incumbents withlarger shares, these incumbents will be aware oftheir oligopolistic interdependence and will recog-nize the collective benefits of exercising marketpower. Under these conditions, the expected returnfrom a short-term exercise of pricing power will begreater, since other incumbents are more likely toalso maintain output discipline to benefit fromhigher prices. Therefore, in general, we expect afirm to be more likely to restrict capacity utiliza-tion, for a given available capacity, if it is in aconcentrated market than if it is not in a concen-trated market (Stigler, 1964). Earnings pressure fur-ther enhances that effect, since it shifts the inter-temporal trade-off in favor of current earnings. Wetherefore propose that the restriction of capacityutilization by firms facing earnings pressure will bestronger if the firms are in concentrated markets.
Hypothesis 2b. The effect of earnings pressureon capacity utilization level is more negativewhen firms are in more concentrated markets.
Goal heterogeneity among competitors. In someindustries and markets, competitors have heteroge-neous governance and strategic objectives. For ex-ample, for-profit banks compete with credit unioncooperatives, for-profit insurance companies com-pete with mutuals, and private hospitals competewith public and not-for-profit hospitals. This het-erogeneity of objectives is believed to complicateoligopolistic coordination and therefore increasecompetition (Newman, 1978). In the electricity in-dustry, as in other deregulated industries, investorownership is often complemented by other forms ofasset ownership (e.g., federal or state governments,municipal authorities, cooperatives, etc.). The ob-jectives of these non-investor-owned generatorsdiffer markedly from those of investor-owned gen-erators, since their prime objective tends to be wel-fare maximization subject to a constraint of self-financing, rather than profit maximization. Inparticular, reducing output to increase prices isantithetical to the nature of these non-investor-owned generators. Therefore, they have vastly dif-ferent objectives that lead them to act in a way thatdisrupts investor-owned generators’ ability to exer-cise pricing power. Restricting capacity utilizationto increase market price is likely to be counterpro-ductive in markets in which non-investor-ownedgenerators hold a significant share. For companiesexperiencing earnings pressure, we expect to see
restrictions in capacity utilization, relative to avail-able capacity, in markets that are dominated by for-profit competitors (investor-owned generators), butwe expect to see less such restriction in markets withsignificant penetration by not-for-profit competitors.
Hypothesis 2c. The effect of earnings pressureon capacity utilization level is more negativewhen firms are in markets with more for-profitcompetitors.
Competitors’ capacity constraints. A firm’s abil-ity to exercise market power is limited if its com-petitors can easily and quickly expand capacityutilization to take advantage of the resulting resid-ual demand. A dominant firm’s restriction of ca-pacity utilization, given its available capacity, in-creases the residual demand available to rivals. Ifthese rivals have excess capacity in relatively effi-cient plants, they can meet the increased residualdemand while incurring only the marginal costs ofthe marginal plant in operation. In that situation, areduction of output by the focal firm simply shiftsoutput to its competitors, without necessarily in-creasing market prices. However, when competi-tors are capacity constrained, they are unable tomeet the increased residual demand. A reduction ofcapacity utilization by a focal firm will more likelyresult in increased prices and margins. Therefore,firms facing earnings pressure can exercise marketpower more effectively if competitors are capacityconstrained. Accordingly, we argue that:
Hypothesis 2d. The effect of earnings pressureon capacity utilization level is more negativewhen firms face competitors with tighter ca-pacity constraints.
Competitive Interactions by Firms FacingEarnings Pressure
The previous hypotheses suggest that dominantfirms facing earnings pressure seek to increase cur-rent earnings by restricting capacity utilization,given their available capacity. However, the perfor-mance consequences of earnings pressure criticallydepend on the nature of competitive interactionswith rivals. Since output decisions in oligopolisticcompetition are interdependent, we expect earn-ings pressure by dominant firms to affect not onlythe competitive behavior of these firms, but also thecompetitive behavior of their competitors. In par-ticular, we argue that firms intensify their compet-itive behavior when their dominant competitorsface earnings pressure. These cross-rival effectspartially undermine the intended performance ben-
2010 749Zhang and Gimeno

efits of output restrictions, since rivals benefit byexpanding their output.
Output and capacity utilization decisions arepart of the common repertoire of competitive ac-tions in output-based industries, and therefore thelikelihood of competitive interaction is high (Chen,Smith, & Grimm, 1992). As represented in theCournot model, output decisions by oligopolisticcompetitors are “strategic substitutes” (Fudenberg& Tirole, 1984): lower output by one competitormotivates higher output by its rivals, and viceversa. In our context, dominant competitors facingearnings pressure will lower capacity utilization(as stated in the previous hypotheses). Other thingsbeing constant, this output reduction causes an in-crease in market-clearing prices and encourageshigher capacity utilization by other firms in themarket. A higher price umbrella will allow firms toincrease utilization of marginal plants with lowerproductivity or higher unit costs.
Theoretically, the cross-rival effect of earningspressure may occur through two causal processes.The first, and most likely, is an indirect causalpath: dominant competitors facing earnings pres-sure reduce their capacity utilization, and this re-duction triggers greater capacity utilization by ri-vals. In that path, firms do not need to be aware ofthe earnings pressure on their rivals, but they reactto their rivals’ realized competitive behaviors. An-other possible, but far less likely, causal path is adirect one: firms recognize their dominant competi-tors are suffering from earnings pressure and act ag-gressively in anticipation of a soft, accommodatingresponse. However, this path would require commonknowledge about earnings pressure on rivals, whichmay be a limiting assumption in many contexts.
Empirically, capacity utilization decisions amongcompetitors in commodity industries do not occurdiscretely and in sequence but happen interactivelyover time. For example, electricity generators ad-just output for daily and hourly intervals of de-mand. In those cases, competitors’ capacity utiliza-tion levels are mutually interdependent, as each firmadapts its output to the actual or expected output ofcompetitors. When dominant firms in a market faceearnings pressure, the mutual adjustment would shifttoward lower capacity utilization by the dominantfirms and consequently greater capacity utilization bytheir competitors. Therefore, we propose:
Hypothesis 3. Firms have higher capacity uti-lization relative to available capacity whentheir dominant competitors face higher earn-ings pressure.
In summary, we propose that firms experiencingearnings pressure shift their focus toward generating
current earnings by exercising market power (tryingto increase prices by restricting output), the more sowhen structural conditions favor this effort. Yet earn-ings pressure may also affect competitive interac-tions, since it may encourage expansion by competi-tors. Our hypotheses provide a model of howearnings pressure interacts with competitive contextin determining competitive behavior.
DATA AND METHODS
Data and Sample
Since competitive interaction patterns vary acrossindustries, depending on economic and institu-tional conditions, it was helpful to focus on a singleindustry in hypothesis testing. After consideringseveral contexts, we selected the U.S. electricitygeneration industry, as its characteristics made it asuitable setting in which to test the effect of earn-ings pressure on competitive behavior in commod-ity markets. Electricity is the quintessential homo-geneous product: electricity produced by onegenerator is indistinguishable from that producedby another. Typically, generators supply output fordifferent daily and hourly periods, and the totaloutput supplied in the market and the demandduring those periods determine the price of thatelectricity. Economic researchers have found theCournot model of output competition to be a goodapproximation of the competitive interactions inthis industry (Borenstein & Bushnell, 1999). Thepassage of the Energy Policy Act in 1992 opened thewholesale electricity market (for transactions be-tween generators and distributors) to competition byeligible generators, even before the opening of theretail market. For the purposes of wholesale electric-ity competition, the United States was divided into12 wholesale markets, or North American ElectricReliability Council (NERC) regions, as described inAppendix A. This feature provided heterogeneity ofcompetitive structures in different markets.
Despite the deregulation of the wholesale market,there is concern as well as evidence that thesemarkets have developed oligopolistic structures inwhich a few large generators dominate. The aggre-gate demand for electricity is very inelastic, whichfurther enables incumbents to exercise pricingpower. Economic research on deregulated electricitymarkets has shown that dominant firms in concen-trated electricity markets perform “strategic with-holding” of output at periods of peak demand tomanipulate spot prices (Fabra & Toro, 2005; Joskow &Kahn, 2002; Sweeting, 2007). In particular, strategicoutput withholding was extensively studied and de-bated after the California electricity crisis in 2000.
750 AugustAcademy of Management Journal
During that period, it emerged that electricity gener-ators used artificial power plant outages to createsupply shortages in order to raise market prices andincrease their profit (McLean & Elkind, 2003).
The COMPUSTAT database listed about 124publicly traded firms for which electricity genera-tion and distribution was the principal business(under SIC codes 4911 and 4931), and analystsconstantly followed 70–80 of them (Besanko,D’Souza, & Thiagarajan, 2001). Consistently withour previous discussion, investors tended to reactsensitively to earnings forecasts and earnings sur-prises. For example, when American ElectricPower missed analysts’ consensus of $1.44 by onlya penny on October 23, 2001, its stock price fellfrom $44.19 to $42.24 within the following week(Dow Jones News Service, 2001).
Data were obtained from several sources. First,the U.S. Department of Energy’s Electricity Infor-mation Administration (EIA) provided the EIA-860database, a census of generating units (i.e., tur-bines) in power plants owned and operated by elec-tricity generators. From there, we obtained the totalcapacity that a firm held in operation or standby(still in operation but out of service for more thanthree months) in each wholesale region (market) ineach year, as well as the share of capacity in themarket. Second, the EIA-906 and EIA-920 data-bases provided annual data on electricity genera-tion at the power plant level. From there, we cal-culated the total output produced by the generatorin each market and year, as well as its averagecapacity utilization rate over the year. Finally,earnings forecasts and historical company earningswere obtained from the Institutional Broker Esti-mates System (I/B/E/S) database offered by Thom-son Financial/First Call. Our sample period wasfrom 1993, right after the deregulation, to 2005,when the latest data were published. For all firmswith more than 1 percent capacity share in anystudied market-year, we combined I/B/E/S earn-ings data and EIA capacity and output data bymatching the generator names and their I/B/E/S“tickers” and cross-checked this information by re-ferring to industry and company historical pro-files.3 We created a panel data set of 62 generation
companies,4 14 among them present in more thanone market, followed over 13 years. Despite thegeographical expansion of generators, multimarketcontact was negligible, with only 2 companiesmeeting in two or more markets.
Methods
We used panel data methods, with the unit ofanalysis being the firm-market-year. Our focus wason understanding the determinants of capacity uti-lization, given available capacity, which constrainsoutput. Moreover, because of the seasonality, cycli-cality, and volatility of electricity demand, genera-tors often maintain sufficient available capacity toserve peak demand, and average capacity utiliza-tion rates are generally low (about 52 percent in oursample). Increasing capacity utilization is not easy,however. Firms typically develop diverse portfo-lios of plants with different technologies and dif-ferent cost structures. Plants serving peak demandtend to have higher variable costs. Capacity utiliza-tion rates may not be easily comparable across gen-erators, since utilization depends on firms’ plantportfolio choices on such matters as scale and tech-nology. We constructed a model of capacity uti-lization (qimt/Kimt) that allowed it to be influ-enced by a firm’s available capacity (Kimt) in agiven market, other independent (Ximt) and con-
3 The EIA data are reported at the level of the “utilitycode” representing a single operational unit. We aggre-gated total capacity and output at the parent firm level,excluding those of “captive plants” held by verticallyintegrated industrial users (e.g., metal or chemical pro-ducers). We started with 738 utility codes with more than1 percent of capacity share in any market-year. Amongthose, 205 were privately held, 125 were public utilities
(either government-owned or cooperatives), and 356were associated with 89 publicly traded companies inCOMPUSTAT and matched to 76 I/B/E/S tickers. For theremaining 52 utility codes, we couldn’t identify owner-ship; we assumed them to be privately held, but theresults were robust to alternative classifications.
4 The NERC region excluded is Alaska, which hadonly one publicly traded electric utility in the market.For the regression analysis we excluded firm-market-years that had less than a 1 percent market share ina year, and we required firm-markets to have at least fiveyearly observations during the sample period. We alsodropped firm-years when fewer than three analysts pro-vided earnings forecasts. Our sample of publicly tradedutilities covered by analysts showed that these firmswere larger and had higher capacity utilization than theother, nonpublicly traded (not-for-profit, state, or pri-vate), utilities (p � .001 for Kolmogorov-Smirnov tests).The analyst-covered firms were also larger and hadhigher capacity utilization than other publicly tradedfirms listed in COMPUSTAT but not covered by analysts(p � .001). These results suggested that ownership typesand analyst coverage were not random. Since we definedour target population as publicly traded utilities withanalyst coverage, we did not interpret these differencesas representing a bias in our sample, but as reflectingdifferences between populations.
2010 751Zhang and Gimeno
trol variables (Zimt), and some unobserved hetero-geneity, as follows:
qimt/Kimt � � � log(Kimt) � � � Ximt � � Zimt
� im � �t � �imt.
The model included fixed effects for firm-marketcombinations (im), since firms’ positions and ca-pacity portfolios across markets are highly hetero-geneous.5 In addition, we included fixed effects foreach year (�t), as longitudinal trends in demand andinput costs (e.g., economic growth, oil prices) caninfluence capacity utilization. The results of aHausman test (p � .01) comparing the model to arandom-effects specification supported use of fixedeffects to model firm-market heterogeneity.
Since the hypotheses involve the evaluation ofinteraction effects between earnings pressure andmarket structure variables, we centered the compo-nents of these interactions around their samplemeans prior to calculating the interactions (Aiken,West, & Reno, 1991). These changes allow the in-terpretation of main effects as the effects of a vari-able at the mean level of the moderator variable. Weestimated models using Stata 10.
Dependent Variable
Capacity utilization. The capacity utilizationrate of a firm in a certain market and year wascalculated as the ratio of its net annual output inthe market (in megawatt hours [MWh]), divided bythe number of hours per year (365 � 24 � 8,760)and the total summer capacity (in megawatts). Netgeneration output equaled gross output minus in-ternal electricity use and pumping energy. Thismeasure represents average capacity utilizationover the year, although output decisions are madecontinuously.
Independent Variables
Earnings pressure. The key independent vari-able was earnings pressure. Because we were inter-ested in its effect on competitive decisions, wemeasured earnings pressure at the beginning ofeach period of activity, before the competitive de-cisions took place. Theoretically, earnings pressurerepresents the gap between the consensus of ana-
lysts’ earnings forecasts and management expecta-tions about potential company earnings understeady management and accounting practices.
Despite the popularity of the term “earnings pres-sure” in the news media, few studies have at-tempted to operationally define this construct. Thislack of a measure is partly a consequence of thedifficulty of developing an independent estimate ofmanagement expectations of potential companyearnings.6 Management public guidance is not fea-sible because of its low frequency and pessimisticbias, as discussed in the theory section. Forecasts ofpotential earnings based on historical time series ofearnings have some predictive power (Lobo & Nair,1991), but they do not take into account new infor-mation available to management that may affect fu-ture earnings. Management expectations are likely tobe shaped by past performance, but also by new in-formation and by the performance of industry peers.
In this study, we adopted a method developed byMatsumoto (2002) to measure “estimated fore-casts,” or the earnings that a firm can realize, ametric now well accepted in the accounting litera-ture (e.g., Burgstahler & Eames, 2006) as a way tocalculate a firm’s potential earnings. Since the cal-culation is technical, we present additional detailsin Appendix B. The method combines informationabout the trends in a firm’s historical performancewith information about recent stock market returns(which convey information about earnings-relevantnews that would not be reflected in historical earn-ings, such as industry changes and social perfor-mance expectations). We calibrated the predic-tive effect of these two performance indicators onpotential earnings using regression parametersfrom a sample of other industry peers, excludingthe focal firm.
5 The use of fixed effects implies modeling longitudi-nal covariation (over years) between levels of indepen-dent and dependent variables for a given firm-marketcombination. The model controlled cross-sectional het-erogeneity in firm-market combinations.
6 Previous research in finance and accounting hadused the gap between earnings forecast consensus andthe premanaged earnings—where premanaged earningswere calculated as the reported earnings minus discre-tionary accruals—to measure the pressure to meet earn-ings forecast consensus (Jones, 1991; Payne & Robb,2000). Although this measure may be appropriate toidentify accounting manipulations to meet earnings con-sensus, it was not appropriate for our application. Ourfocus was to measure earnings pressure at the beginningof a period of activity (i.e., ex ante), but this measurecould only be calculated after earnings were announced(i.e., ex post). Moreover, since exercise of market powerand managing accounting accruals are alternative waysto meet earnings pressure, and these mechanisms takeplace at different points in the period, the Jones measurewould capture earnings pressure that could not be metthrough changes in competitive actions.
752 AugustAcademy of Management Journal
Specifically, the earnings pressure experiencedby firm i during year t was defined as the differencebetween the analysts’ earnings per share (EPS) fore-cast consensus for year t, measured at the beginningof the year, minus the potential EPS (the Matsumo-to’s measure at the beginning of the year), standard-ized by the firm’s stock price at the beginning ofyear t (e.g., Skinner & Sloan, 2002):7
Earnings pressureit
� (analyst forecast consensus
� potential EPS)/share price.
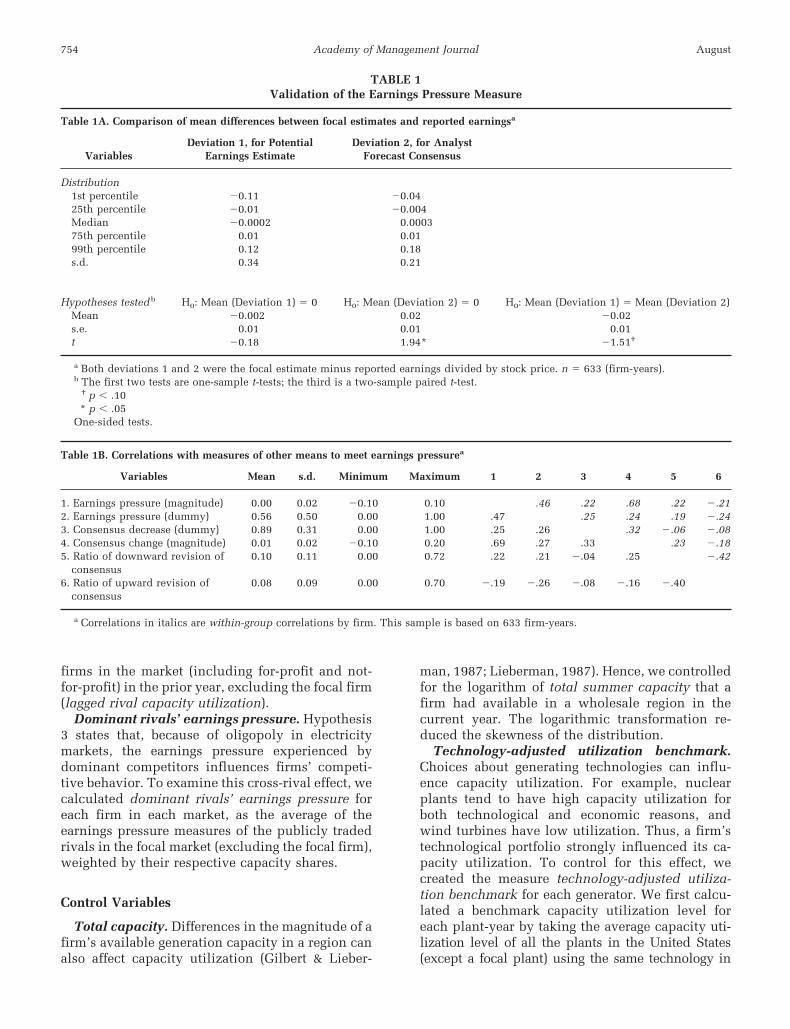
To avoid excessive reliance on a single analyst’sforecast, we selected firms that received forecastsfrom at least three different analysts. However, theresults didn’t change if we included consensus pro-vided by at least one analyst or by at least fiveanalysts. Because this measure was novel, wechecked its validity in two ways. First, we com-pared the accuracy of the potential earnings mea-sure with that of the analyst forecast consensus inpredicting reported earnings for a given year. AsTable 1A shows, the mean difference between theMatsumoto potential earnings estimate and re-ported earnings was significantly smaller than themean difference between analyst forecast consen-sus and reported earnings (paired t-test: p � 0.1).The distribution of analyst forecast consensus atthe beginning of the year was skewed toward over-estimating reported earnings (with a mean differ-ence significantly above 0), as is consistent withprior findings that analysts’ forecasts are optimisti-cally biased. In comparison, the mean differencebetween Matsumoto’s potential earnings estimatesand reported earnings was not significantly differ-ent from 0 (i.e., the measure is unbiased). On theother hand, the difference between analyst forecastconsensus and reported earnings had a lower stan-dard deviation, suggesting that the rich informationused by analysts allowed them to avoid large fore-cast errors. Thus, analyst forecasts are valuable,even if they appear to be biased.
Second, we also tested whether the earningspressure measure at the beginning of a year wasassociated with other means that managers may useto meet earnings pressure during the year. Bern-
hardt and Campello (2007) found that managersfacing earnings pressure tried to “talk down” ana-lysts’ forecasts so that they would be easier to meet.Although we could not find consistent informationabout public earnings guidance (which tends to beinfrequent), we could trace the evolution of ana-lysts’ earnings forecasts during a year for firms withpositive earnings pressure at the beginning of theyear, which can be viewed as partly the result ofmanagers’ talking down analyst forecasts. Results,presented in Table 1B, showed that positive earn-ings pressure was positively correlated with boththe incidence and magnitude of downward revi-sion of analysts’ forecast consensus. At the individ-ual analyst level, positive earnings pressure wasalso positively correlated with the frequency ofdownward revisions of analysts’ forecasts, and neg-atively correlated with the ratio of upward todownward revisions. All these results suggestedthat the Matsumoto’s (2002) method was a promis-ing means for estimating management expectationsof potential earnings based on historical and socialperformance references as well as estimates of fu-ture changes, and it therefore provided an objectivebenchmark to compare with analysts’ forecasts.
Other Independent Variables
Market structure and competitive environmentvariables. To reduce concerns about endogeneityand reverse causality, we calculated the marketstructure variables on the basis of capacity levelsrather than output levels, and lagged rather thancurrent levels. To test Hypothesis 2a, we definedlagged capacity share as a generator’s share, in itsNERC regional market, of summer capacity in aprior year. To test Hypothesis 2b, we created aHerfindahl market concentration index based onthe summer capacity of all other rivals (for-profitand not-for-profit utilities) in the wholesale marketin the prior year (lagged rival Herfindahl), exclud-ing a focal firm. Excluding the focal firm reducedthe collinearity between its dominant share andmarket concentration and was helpful for distin-guishing firm-specific from structural marketpower (Cool, Dierickx, & Jemison, 1989). However,the results using the common Herfindahl index,including the focal firm’s share, were not qualita-tively different. For Hypothesis 2c, we measuredthe market presence of for-profit competitors by thetotal capacity share in the market of all other for-profit firms (publicly traded or privately owned) inthe prior year, excluding the focal firm (lagged for-profit rival share). Finally, to test Hypothesis 2d,we measured competitors’ capacity constraints bythe average capacity utilization level of all other
7 To limit the impact of observations with extremevalues, we capped earnings pressure to be positive ornegative 0.1 if the difference between the analysts’ EPSforecast consensus and the potential EPS estimate wasmore than 10 percent of the stock price. The resultsremained qualitatively the same if we excluded those 14observations from the analyses.
2010 753Zhang and Gimeno
firms in the market (including for-profit and not-for-profit) in the prior year, excluding the focal firm(lagged rival capacity utilization).
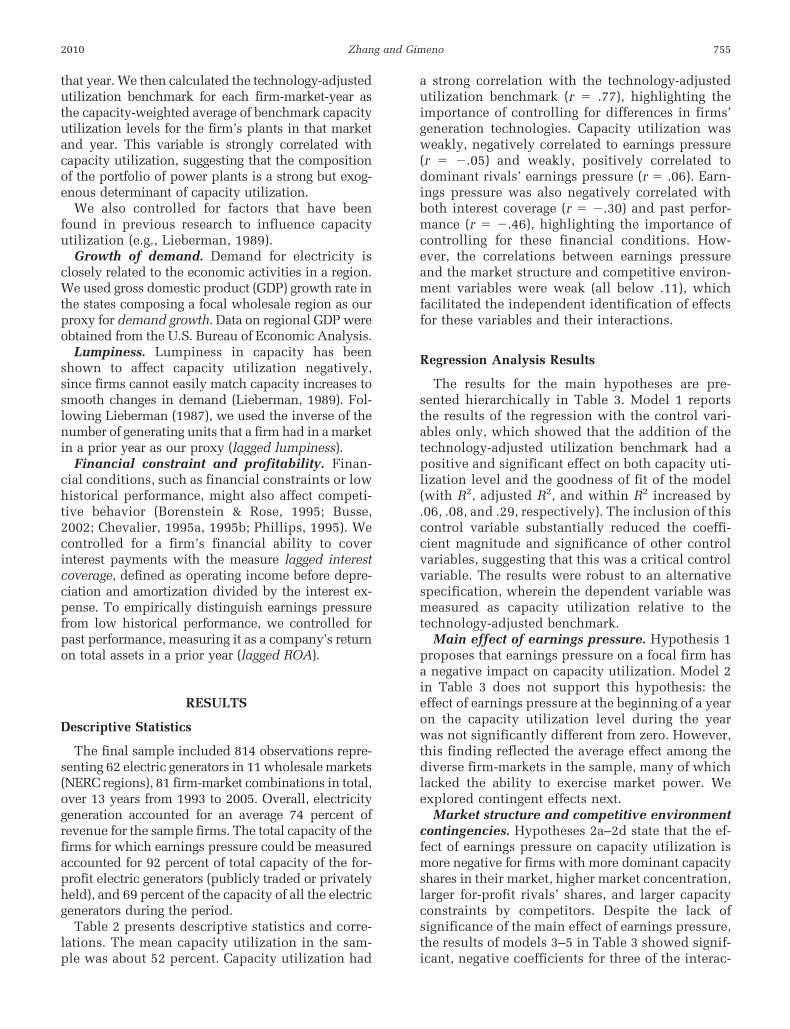
Dominant rivals’ earnings pressure. Hypothesis3 states that, because of oligopoly in electricitymarkets, the earnings pressure experienced bydominant competitors influences firms’ competi-tive behavior. To examine this cross-rival effect, wecalculated dominant rivals’ earnings pressure foreach firm in each market, as the average of theearnings pressure measures of the publicly tradedrivals in the focal market (excluding the focal firm),weighted by their respective capacity shares.
Control Variables
Total capacity. Differences in the magnitude of afirm’s available generation capacity in a region canalso affect capacity utilization (Gilbert & Lieber-
man, 1987; Lieberman, 1987). Hence, we controlledfor the logarithm of total summer capacity that afirm had available in a wholesale region in thecurrent year. The logarithmic transformation re-duced the skewness of the distribution.
Technology-adjusted utilization benchmark.Choices about generating technologies can influ-ence capacity utilization. For example, nuclearplants tend to have high capacity utilization forboth technological and economic reasons, andwind turbines have low utilization. Thus, a firm’stechnological portfolio strongly influenced its ca-pacity utilization. To control for this effect, wecreated the measure technology-adjusted utiliza-tion benchmark for each generator. We first calcu-lated a benchmark capacity utilization level foreach plant-year by taking the average capacity uti-lization level of all the plants in the United States(except a focal plant) using the same technology in
TABLE 1Validation of the Earnings Pressure Measure
Table 1A. Comparison of mean differences between focal estimates and reported earningsa
VariablesDeviation 1, for Potential
Earnings EstimateDeviation 2, for Analyst
Forecast Consensus
Distribution1st percentile �0.11 �0.0425th percentile �0.01 �0.004Median �0.0002 0.000375th percentile 0.01 0.0199th percentile 0.12 0.18s.d. 0.34 0.21
Hypotheses tested b H0: Mean (Deviation 1) � 0 H0: Mean (Deviation 2) � 0 H0: Mean (Deviation 1) � Mean (Deviation 2)Mean �0.002 0.02 �0.02s.e. 0.01 0.01 0.01t �0.18 1.94* �1.51†
a Both deviations 1 and 2 were the focal estimate minus reported earnings divided by stock price. n � 633 (firm-years).b The first two tests are one-sample t-tests; the third is a two-sample paired t-test.
† p � .10* p � .05
One-sided tests.
Table 1B. Correlations with measures of other means to meet earnings pressurea
Variables Mean s.d. Minimum Maximum 1 2 3 4 5 6
1. Earnings pressure (magnitude) 0.00 0.02 �0.10 0.10 .46 .22 .68 .22 �.212. Earnings pressure (dummy) 0.56 0.50 0.00 1.00 .47 .25 .24 .19 �.243. Consensus decrease (dummy) 0.89 0.31 0.00 1.00 .25 .26 .32 �.06 �.084. Consensus change (magnitude) 0.01 0.02 �0.10 0.20 .69 .27 .33 .23 �.185. Ratio of downward revision of
consensus0.10 0.11 0.00 0.72 .22 .21 �.04 .25 �.42
6. Ratio of upward revision ofconsensus
0.08 0.09 0.00 0.70 �.19 �.26 �.08 �.16 �.40
a Correlations in italics are within-group correlations by firm. This sample is based on 633 firm-years.
754 AugustAcademy of Management Journal
that year. We then calculated the technology-adjustedutilization benchmark for each firm-market-year asthe capacity-weighted average of benchmark capacityutilization levels for the firm’s plants in that marketand year. This variable is strongly correlated withcapacity utilization, suggesting that the compositionof the portfolio of power plants is a strong but exog-enous determinant of capacity utilization.
We also controlled for factors that have beenfound in previous research to influence capacityutilization (e.g., Lieberman, 1989).
Growth of demand. Demand for electricity isclosely related to the economic activities in a region.We used gross domestic product (GDP) growth rate inthe states composing a focal wholesale region as ourproxy for demand growth. Data on regional GDP wereobtained from the U.S. Bureau of Economic Analysis.
Lumpiness. Lumpiness in capacity has beenshown to affect capacity utilization negatively,since firms cannot easily match capacity increases tosmooth changes in demand (Lieberman, 1989). Fol-lowing Lieberman (1987), we used the inverse of thenumber of generating units that a firm had in a marketin a prior year as our proxy (lagged lumpiness).
Financial constraint and profitability. Finan-cial conditions, such as financial constraints or lowhistorical performance, might also affect competi-tive behavior (Borenstein & Rose, 1995; Busse,2002; Chevalier, 1995a, 1995b; Phillips, 1995). Wecontrolled for a firm’s financial ability to coverinterest payments with the measure lagged interestcoverage, defined as operating income before depre-ciation and amortization divided by the interest ex-pense. To empirically distinguish earnings pressurefrom low historical performance, we controlled forpast performance, measuring it as a company’s returnon total assets in a prior year (lagged ROA).
RESULTS
Descriptive Statistics
The final sample included 814 observations repre-senting 62 electric generators in 11 wholesale markets(NERC regions), 81 firm-market combinations in total,over 13 years from 1993 to 2005. Overall, electricitygeneration accounted for an average 74 percent ofrevenue for the sample firms. The total capacity of thefirms for which earnings pressure could be measuredaccounted for 92 percent of total capacity of the for-profit electric generators (publicly traded or privatelyheld), and 69 percent of the capacity of all the electricgenerators during the period.
Table 2 presents descriptive statistics and corre-lations. The mean capacity utilization in the sam-ple was about 52 percent. Capacity utilization had
a strong correlation with the technology-adjustedutilization benchmark (r � .77), highlighting theimportance of controlling for differences in firms’generation technologies. Capacity utilization wasweakly, negatively correlated to earnings pressure(r � �.05) and weakly, positively correlated todominant rivals’ earnings pressure (r � .06). Earn-ings pressure was also negatively correlated withboth interest coverage (r � �.30) and past perfor-mance (r � �.46), highlighting the importance ofcontrolling for these financial conditions. How-ever, the correlations between earnings pressureand the market structure and competitive environ-ment variables were weak (all below .11), whichfacilitated the independent identification of effectsfor these variables and their interactions.
Regression Analysis Results
The results for the main hypotheses are pre-sented hierarchically in Table 3. Model 1 reportsthe results of the regression with the control vari-ables only, which showed that the addition of thetechnology-adjusted utilization benchmark had apositive and significant effect on both capacity uti-lization level and the goodness of fit of the model(with R2, adjusted R2, and within R2 increased by.06, .08, and .29, respectively). The inclusion of thiscontrol variable substantially reduced the coeffi-cient magnitude and significance of other controlvariables, suggesting that this was a critical controlvariable. The results were robust to an alternativespecification, wherein the dependent variable wasmeasured as capacity utilization relative to thetechnology-adjusted benchmark.
Main effect of earnings pressure. Hypothesis 1proposes that earnings pressure on a focal firm hasa negative impact on capacity utilization. Model 2in Table 3 does not support this hypothesis: theeffect of earnings pressure at the beginning of a yearon the capacity utilization level during the yearwas not significantly different from zero. However,this finding reflected the average effect among thediverse firm-markets in the sample, many of whichlacked the ability to exercise market power. Weexplored contingent effects next.
Market structure and competitive environmentcontingencies. Hypotheses 2a–2d state that the ef-fect of earnings pressure on capacity utilization ismore negative for firms with more dominant capacityshares in their market, higher market concentration,larger for-profit rivals’ shares, and larger capacityconstraints by competitors. Despite the lack ofsignificance of the main effect of earnings pressure,the results of models 3–5 in Table 3 showed signif-icant, negative coefficients for three of the interac-
2010 755Zhang and Gimeno

TA
BL
E2
Des
crip
tive
Sta
tist
ics
and
Cor
rela
tion
sa
Var
iabl
esM
ean
s.d
.M
inim
um
Max
imu
m1
23
45
67
89
1011
1213
1.C
apac
ity
uti
liza
tion
b0.
520.
160.
080.
98.6
5�
.004
.06
�.2
4.0
5.2
0.1
1.0
4�
.36
.08
.09
.06
2.T
ech
nol
ogy-
adju
sted
uti
liza
tion
ben
chm
ark
0.52
0.14
0.19
0.91
.77
�.0
02.0
4�
.16
.04
.13
.07
.03
�.2
3.0
5.0
6.0
43.
Ear
nin
gsp
ress
ure
0.00
30.
02�
0.10
0.10
�.0
5�
.03
�.0
1.0
4�
.01
�.1
3.0
5�
.07
.06
�.0
2�
.29
�.4
44.
Dom
inan
tri
vals
’ea
rnin
gsp
ress
ure
0.00
20.
01�
0.03
0.04
.06
.04
�.0
5.0
8.1
4�
.08
.17
�.1
5.0
1.0
4.0
2.0
75.
Lag
ged
cap
acit
ysh
are
0.10
0.09
0.01
0.45
.01
.04
�.0
5�
.01
.17
�.4
4.1
6.1
4.6
0�
.22
.12
.09
6.L
agge
dri
val
Her
fin
dah
l0.
100.
060.
030.
34.0
1.0
3�
.04
.10
.01
.40
.00
.28
�.1
2.1
1.2
7.2
37.
Lag
ged
for-
pro
fit
riva
lsh
are
0.68
0.17
0.12
0.95
�.0
5.1
2.0
4.0
7�
.34
.15
�.1
6.1
7�
.43
.16
.17
.21
8.L
agge
dri
val
cap
acit
yu
tili
zati
on0.
510.
050.
400.
62.1
7.3
2.0
2.1
1�
.09
.08
.17
.03
�.0
5.0
2.1
3.0
99.
Dem
and
grow
th0.
030.
02�
0.02
0.09
.06
.01
�.0
8�
.18
.08
.14
�.1
6.0
2�
.05
.08
.26
.12
10.
Tot
alsu
mm
erca
pac
ity
7,10
16,
737
4742
,152
.12
.18
�.0
6�
.05
.71
�.0
9�
.27
.16
.05
�.1
5.0
3�
.03
11.
Lag
ged
lum
pin
ess
0.04
0.06
0.00
1.1
0.0
1�
.02
.06
�.3
1.0
5.0
0�
.13
.00
�.3
3�
.01
.03
12.
Lag
ged
inte
rest
cove
rage
4.10
1.49
�7.
448.
83.1
0.1
5�
.30
.03
.19
.13
.03
.07
.22
.12
�.1
0.6
813
.L
agge
dR
OA
0.03
0.02
�0.
190.
11.0
8.1
2�
.46
.06
.11
.13
.07
.08
.14
.07
�.0
6.7
1
aC
orre
lati
ons
init
alic
sar
ew
ith
in-g
rou
pco
rrel
atio
ns
byfi
rm.
Th
issa
mp
leis
base
don
814
firm
-mar
ket-
year
s.b
Cap
acit
yis
inM
Ws.

TA
BL
E3
Res
ult
sof
Fix
ed-E
ffec
tsR
egre
ssio
nA
nal
ysis
for
Cap
acit
yU
tili
zati
ona
Var
iabl
esM
odel
1M
odel
2M
odel
3M
odel
4M
odel
5M
odel
6M
odel
7M
odel
8M
odel
9
Ear
nin
gsp
ress
ure
�0.
04(0
.15)
�0.
29†
†(0
.17)
�0.
28†
(0.1
7)�
0.04
(0.1
5)�
0.05
(0.1
6)�
0.31
†(0
.19)
0.03
(0.1
6)E
arn
ings
pre
ssu
re�
lagg
edca
pac
ity
shar
e�
7.15
††
†(2
.41)
�4.
62††
(2.4
8)
Ear
nin
gsp
ress
ure
�la
gged
riva
lH
erfi
nd
ahl
�9.
44†
††
(3.2
5)�
7.15
††
(3.3
9)
Ear
nin
gsp
ress
ure
�la
gged
for-
pro
fit
riva
lsh
are
�3.
61†
††
(0.8
9)�
3.25
††
†(0
.92)
Ear
nin
gsp
ress
ure
�la
gged
riva
lca
pac
ity
uti
liza
tion
�0.
45(3
.02)
3.79
(3.1
0)
Dom
inan
tri
vals
’ea
rnin
gsp
ress
ure
0.72
††
(0.4
3)0.
74†
†(0
.44)
Tec
hn
olog
y-ad
just
edu
tili
zati
onbe
nch
mar
k0.
82**
*(0
.04)
0.82
***
(0.0
4)0.
81**
*(0
.04)
0.82
***
(0.0
4)0.
82**
*(0
.04)
0.82
***
(0.0
4)0.
82**
*(0
.04)
0.82
***
(0.0
4)0.
82**
*(0
.04)
Lag
ged
cap
acit
ysh
are
0.06
(0.1
4)0.
06(0
.14)
0.07
(0.1
4)0.
07(0
.14)
0.08
(0.1
4)0.
06(0
.14)
0.08
(0.1
4)0.
03(0
.14)
0.03
(0.1
4)L
agge
dri
val
Her
fin
dah
l0.
19(0
.13)
0.20
(0.1
3)0.
20(0
.13)
0.17
(0.1
3)0.
19(0
.13)
0.20
(0.1
3)0.
18(0
.13)
0.15
(0.1
3)0.
15(0
.14)
Lag
ged
for-
pro
fit
riva
lsh
are
0.36
***
(0.1
0)0.
36**
*(0
.10)
0.36
***
(0.1
0)0.
36**
*(0
.10)
0.38
***
(0.1
0)0.
36**
*(0
.10)
0.37
***
(0.1
0)0.
38**
*(0
.10)
0.38
***
(0.1
0)L
agge
dri
val
cap
acit
yu
tili
zati
on0.
07(0
.12)
0.07
(0.1
2)0.
07(0
.12)
0.02
(0.1
2)0.
07(0
.12)
0.07
(0.1
2)0.
04(0
.12)
0.11
(0.1
2)0.
11(0
.12)
Dem
and
grow
th0.
04(0
.17)
0.04
(0.1
7)0.
05(0
.17)
0.03
(0.1
7)0.
04(0
.17)
0.04
(0.1
7)0.
04(0
.17)
0.06
(0.1
7)0.
06(0
.17)
Tot
alsu
mm
erca
pac
ity
(log
)�
0.02
(0.0
1)�
0.02
(0.0
1)�
0.02
(0.0
1)�
0.02
(0.0
1)�
0.02
(0.0
1)�
0.02
(0.0
1)�
0.02
*(0
.01)
�0.
02(0
.01)
�0.
02(0
.01)
Lag
ged
lum
pin
ess
�0.
01(0
.07)
�0.
01(0
.07)
�0.
01(0
.07)
�0.
02(0
.07)
�0.
004
(0.0
7)�
0.01
(0.0
7)�
0.00
2(0
.07)
�0.
01(0
.07)
�0.
01(0
.07)
Lag
ged
inte
rest
cove
rage
0.00
0(0
.00)
0.00
0(0
.00)
�0.
001
(0.0
0)0.
000
(0.0
0)0.
000
(0.0
0)0.
000
(0.0
0)0.
000
(0.0
0)0.
000
(0.0
0)0.
000
(0.0
0)L
agge
dR
OA
�0.
03(0
.16)
�0.
05(0
.17)
0.00
1(0
.17)
�0.
06(0
.17)
�0.
06(0
.17)
�0.
05(0
.17)
�0.
03(0
.17)
�0.
04(0
.16)
�0.
03(0
.17)
Con
stan
t0.
24**
(0.1
0)0.
24**
(0.1
0)0.
25**
(0.1
0)0.
24**
(0.1
0)0.
24**
(0.1
0)0.
24**
(0.1
0)0.
25**
(0.1
0)0.
21**
(0.1
0)0.
21**
(0.1
0)
Fir
m-m
arke
tfi
xed
effe
cts
(81
leve
ls)
Yes
Yes
Yes
Yes
Yes
Yes
Yes
Yes
Yes
Yea
rfi
xed
effe
cts
(13
leve
ls)
Yes
Yes
Yes
Yes
Yes
Yes
Yes
Yes
Yes
R2
0.88
0.88
0.88
0.88
0.89
0.88
0.89
0.88
0.88
Ad
just
edR
20.
870.
870.
870.
870.
870.
870.
870.
870.
87W
ith
inR
20.
470.
470.
480.
480.
480.
470.
490.
470.
47M
odel
df
102
103
104
104
104
104
107
103
104
F0.
068.
80†
††
8.45
††
†16
.61†
††
0.03
6.10
††
†2.
89†
2.82
†
Rel
ativ
eto
mod
el2
33
33
41
2T
est
df
11
11
13
11
an
�81
4.S
tan
dar
der
rors
are
inp
aren
thes
es.
*p
�.1
0**
p�
.05
***
p�
.01
Tw
o-si
ded
test
s.†
p�
.10
††
p�
.05
†††
p�
.01
On
e-si
ded
test
s.

tions between earnings pressure and contingencies:capacity share (b � �7.15, p � 0.01), market con-centration (b � �9.44, p � 0.01), and for-profitrivals’ capacity share (b � �3.60, p � 0.01). Theinteraction of earnings pressure and rivals’ capacityconstraints was not significantly different fromzero (model 6). Because some of the contingencyvariables were correlated, we also tested the inter-action effects jointly in model 7. The resultsshowed that the interaction coefficients remainednegative and significant, suggesting that the contin-gencies captured noncollinear effects.
Figure 1 presents graphs of the interaction effectsfollowing the method described by Aiken et al.(1991). Specifically, for firms with a high capacityshare (one standard deviation above the mean), onestandard deviation greater earnings pressure (a gapbetween forecast and potential earnings equivalentto 1.84 percent of stock price) was associated with3.2 percent lower capacity utilization. For firmswith low capacity share (one standard deviation be-low the mean), the same change in earnings pressurewas associated with 1.2 percent higher capacity uti-lization. The effect on capacity utilization of a onestandard deviation increase in earnings pressure was�2.8 percent when market concentration was high,
but 0.9 percent when concentration was low (onestandard deviation above and below the mean, re-spectively). Finally, earnings pressure reduced thecapacity utilization level by 2.0 percent when for-profit rivals’ capacity share was high, but increased itby 2.2 percent when it was low. The results reportedin Table 3 indicate that effect of earnings pressure oncapacity utilization become negative and statisticallysignificant at the .05 level when capacity share ishigher than 9.65 percent, when rivals’ market concen-tration is higher than 0.10, or when for-profit rivals’capacity share is higher than 73.80 percent.8
Dominant rivals’ earnings pressure. Hypothesis3 states that a firm has higher capacity utilizationwhen its dominant competitors face higher earn-ings pressure. Model 8 in Table 3 shows that earn-ings pressure by dominant competitors (weightedby their capacity share) at the beginning of a yearhad a positive and significant effect on a focal
8 A sizable number of observations were above thesethresholds. Respectively, there were 37.1, 28.1, and 44.4percent of observations above the capacity share, rivals’market concentration, and for-profit rivals’ capacity sharethresholds.
FIGURE 1Contingency Effects of Earnings Pressure on Capacity Utilizationa
(1A) Lagged Capacity Share
–15%
–10%
–5%
0%
5%
10%
15%
–6% –4% –2% 0% 2% 4% 6%
Earnings Pressure
Changes inCapacity
Utilization
Low lagged capacityshare
High lagged capacityshare
(1B) Lagged Rival Herfindahl
–15%
–10%
–5%
0%
5%
10%
15%
–6% –4% –2% 0% 2% 4% 6%Earnings Pressure
Changes inCapacity
Utilization
Low lagged rivalHerfindahl
High lagged rivalHerfindahl
(1C) Lagged For-Profit Rival Share
–15%
–10%
–5%
0%
5%
10%
15%
–6% –4% –2% 0% 2% 4% 6%
Earnings Pressure
Changes inCapacity
Utilization (%)
Low lagged for-profitrival share
High lagged for-profitrival share
a Earnings pressure is expressed as a percentage of stock price.
758 AugustAcademy of Management Journal

firm’s capacity utilization level during that year(b � 0.72, p � .05). This significance still heldwhen we added a focal firm’s earnings pressure inmodel 9 (b � 0.74, p �.05). The results indicate thatone standard deviation higher earnings pressure bydominant rivals (0.69 percent of stock price) isassociated with 0.49 percent higher capacity utili-zation by a focal firm.
Robustness Checks
To examine the robustness of our findings inmore detail, we conducted several post hoc checksto determine whether (1) common market-levelshocks that affected both analysts’ forecasts andfirm output decisions drove the results for earningspressure; (2) the results were a consequence of lowperformance rather than high expectations; and (3)the results were symmetric to positive and negativeearnings pressure.
The first potential concern was related to thepossibility of an omitted variable bias: that someomitted market-level factor (e.g., demand and ca-pacity cycles, deregulation, competitive entry)could affect both earnings pressure at the beginningof a year (through an effect on analysts’ forecasts)and capacity utilization decisions during the year.The use of the Matsumoto measure of potentialearnings limited that concern, since earnings pres-sure would only be affected by omitted factors thatwere anticipated by analysts but not by the stockmarket. Since analysts’ forecasts were public infor-mation, this condition was not easily met. The find-ing that earnings pressure had opposite effects on afocal firm and its competitors also reduced con-cerns that the effect was due to correlation withmarket-wide omitted variables. Finally, we con-ducted a post hoc test using market-year fixed ef-fects instead of year fixed effects to capture anyunobserved effects varying by market and year. De-spite the large loss of degrees of freedom, the re-sults did not substantially change in direction orsignificance. Hence, we feel confident that our re-sults were not caused by omitted market-levelshocks.
The second concern was related to the interpre-tation of the earnings pressure effect. Although ourtheory suggested that a gap between forecasted andpotential earnings drove our effects, the individualcomponents of earnings pressure (high analyst fore-casts, low potential earnings) could also have af-fected competitive behavior. Behavioral theorymodels suggest that firms facing low performancemay make risky behavioral responses (Cyert &March, 1963; Kahneman & Tversky, 1979), al-though it is not clear that a behavioral model would
predict a reduction of capacity utilization. Control-ling for both components simultaneously was sta-tistically impossible, since earnings pressure was alinear combination of these components and wouldresult in perfect collinearity. Alternatively, wedeveloped models in which one of the compo-nents (analyst forecasts or potential earnings)was included, together with interactions with therelevant contingency variables. The resultsshowed that the interactions between earningspressure and the contingency variables presentedearlier remained significant after the inclusion ofthese other controls. Thus, the results are not dueto high analysts’ forecasts alone, or to low poten-tial earnings alone, but to the gap between thesetwo components.
Finally, we checked whether positive and nega-tive earnings pressure had symmetric effects oncompetitive behavior. The theory proposed sug-gests some output restraint when earnings pressurebecomes more positive (analyst forecasts are abovepotential earnings), but not necessarily an outputexpansion when earnings pressure becomes morenegative (analyst forecasts are below potential earn-ings). To test this intuition, we created a splinetransformation of earnings pressure into two sub-variables: positive pressure (positive earnings pres-sure values, or zero otherwise) and negative pres-sure (negative earnings pressure values, or zerootherwise). Positive earnings pressure was presentin 56.5 percent of the observations. The main ef-fects of the two submeasures were not significantlydifferent from zero, similarly to the main effect ofearnings pressure in the base model. However, theinteractions of market structure and competitiveenvironment variables with positive earnings pres-sure were negative and significant (as expected),and the interactions with negative pressure weremostly not significantly different from zero. Theseresults implied that restrictions of capacity utiliza-tion took place when dominant firms faced positiveearnings pressure only. Negative earnings pressuredid not lead to modifications of capacity utiliza-tion. This pattern of findings was consistent withour interpretation that attempts to raise currentearnings to meet analysts’ forecast consensuscaused capacity utilization reductions by dominantfirms.
Auxiliary Analyses
Our results showed that earnings pressure couldresult in reductions in capacity utilization for dom-inant firms and increases in capacity utilization fortheir competitors. However, to better understandthe performance consequences of these changes in
2010 759Zhang and Gimeno

capacity utilization, we performed auxiliary analy-ses to explore the consequences of capacity utiliza-tion for market-level pricing and future capacityexpansion.
Our theory implied that restricting capacity uti-lization would help dominant electricity generatorsincrease the wholesale price and therefore obtaingreater margins for their remaining output. To eval-uate whether dominant firms could benefit fromrestricting capacity utilization, we assessed the ef-fect of capacity utilization by dominant firms (firmswith the leading capacity share in a market) on themarket’s average wholesale electricity price. Table4 presents a fixed-effects regression analysis of av-erage wholesale electricity price in a market (priceinformation is not available at the firm level) andyear. The power of this regression was limited,since there were only 119 firm-market-year obser-vations, and we controlled for firm-market and yearfixed effects, as well as for lagged wholesale priceand demand (GDP) growth. However, model 2 ofTable 4 shows that capacity utilization by domi-nant firms in a market had a negative and signifi-cant effect (b � �3.52, p � 0.05) on the averagewholesale price in the market-year. Specifically, 1percent of capacity utilization restriction by theleading firm boosts wholesale price by 0.035 cents(which was 0.85 percent of the average wholesaleprice in the sample). Since the relationship be-tween capacity utilization and price may be recip-rocal (a demand shock that would increase priceswould also increase capacity utilization), we also
performed an instrumental variable panel regres-sion using the prediction from model 8 of Table 3as the instrument for capacity utilization. The evi-dence, which is consistent across models, suggeststhat lower capacity utilization by the dominantfirms in a market had a tangible effect on market-clearing prices, even though they may have simul-taneously triggered higher utilization levels byother competitors.
Changes in capacity utilization may also havelong-term performance consequences if they affectfuture capacity expansion. To evaluate this possi-bility, we evaluated the effect of capacity utiliza-tion on a firm’s net capacity change in a followingyear. Net capacity change was calculated as thepercentage change in operational and planned ca-pacity relative to the prior year. Planned capacitywas obtained from the “proposed new generators”file in the EIA-860 database. Model 2 in Table 5shows that capacity utilization had a positive effecton the net capacity change (b � 0.38, p �.001).Specifically, 1 percent of capacity utilization by asample firm would lead to a 0.38 percent increasein the net change of its capacity. This effect per-sisted when we controlled for market-wide factorsthat might impact a firm’s net capacity change,such as lagged market total capacity (model 3), netcapacity change by the rest of the market (model 4),and both of them (model 5). This evidence suggeststhat short-term consequences of earnings pressurein terms of lower capacity utilization by dominantfirms and higher capacity utilization by competi-
TABLE 4Effect of Capacity Share Leader’s Capacity Utilization on Average Market Pricea
Average Market Price Model 1 Model 2 Model 3
Capacity utilization �3.53†† (1.62)Capacity utilization (instrumented) �4.63†† (2.07)Lagged average market price 0.08 (0.11) 0.07 (0.10) 0.07 (0.10)Demand growth 1.58 (8.27) 3.10 (8.12) 3.57 (8.17)Constant 3.27*** (0.54) 5.05*** (0.98) 5.61*** (1.17)Firm-market fixed effects (18 levels) Yes Yes YesYear fixed effects (13 levels) Yes Yes Yes
R2 0.68 0.70 0.70Adjusted R2 0.57 0.59 0.58Within R2 0.55 0.57 0.57Model df 31 32 33F 4.80†† 2.13
Relative to model 1 1Test df 1 2
a n � 119. Capacity utilization was instrumented using the predicted capacity utilization from model 7 in Table 3. Standard errors arein parentheses.
*** p � .01Two-sided test.
†† p � .05One-sided test.
760 AugustAcademy of Management Journal
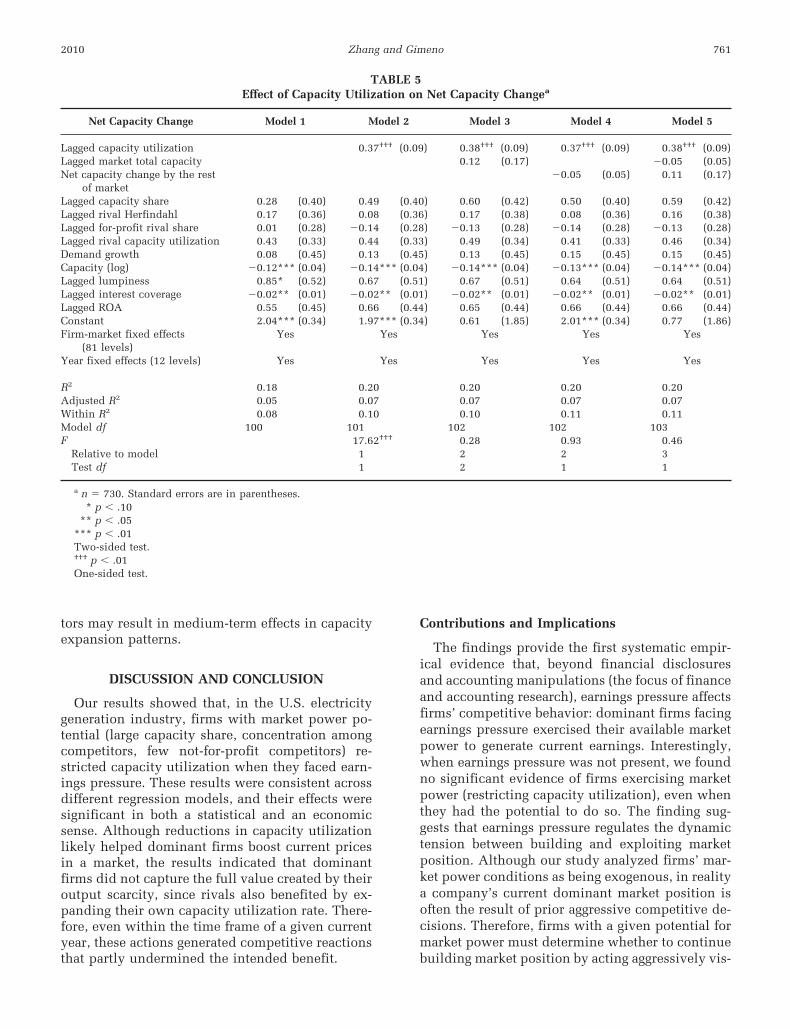
tors may result in medium-term effects in capacityexpansion patterns.
DISCUSSION AND CONCLUSION
Our results showed that, in the U.S. electricitygeneration industry, firms with market power po-tential (large capacity share, concentration amongcompetitors, few not-for-profit competitors) re-stricted capacity utilization when they faced earn-ings pressure. These results were consistent acrossdifferent regression models, and their effects weresignificant in both a statistical and an economicsense. Although reductions in capacity utilizationlikely helped dominant firms boost current pricesin a market, the results indicated that dominantfirms did not capture the full value created by theiroutput scarcity, since rivals also benefited by ex-panding their own capacity utilization rate. There-fore, even within the time frame of a given currentyear, these actions generated competitive reactionsthat partly undermined the intended benefit.
Contributions and Implications
The findings provide the first systematic empir-ical evidence that, beyond financial disclosuresand accounting manipulations (the focus of financeand accounting research), earnings pressure affectsfirms’ competitive behavior: dominant firms facingearnings pressure exercised their available marketpower to generate current earnings. Interestingly,when earnings pressure was not present, we foundno significant evidence of firms exercising marketpower (restricting capacity utilization), even whenthey had the potential to do so. The finding sug-gests that earnings pressure regulates the dynamictension between building and exploiting marketposition. Although our study analyzed firms’ mar-ket power conditions as being exogenous, in realitya company’s current dominant market position isoften the result of prior aggressive competitive de-cisions. Therefore, firms with a given potential formarket power must determine whether to continuebuilding market position by acting aggressively vis-
TABLE 5Effect of Capacity Utilization on Net Capacity Changea
Net Capacity Change Model 1 Model 2 Model 3 Model 4 Model 5
Lagged capacity utilization 0.37††† (0.09) 0.38††† (0.09) 0.37††† (0.09) 0.38††† (0.09)Lagged market total capacity 0.12 (0.17) �0.05 (0.05)Net capacity change by the rest
of market�0.05 (0.05) 0.11 (0.17)
Lagged capacity share 0.28 (0.40) 0.49 (0.40) 0.60 (0.42) 0.50 (0.40) 0.59 (0.42)Lagged rival Herfindahl 0.17 (0.36) 0.08 (0.36) 0.17 (0.38) 0.08 (0.36) 0.16 (0.38)Lagged for-profit rival share 0.01 (0.28) �0.14 (0.28) �0.13 (0.28) �0.14 (0.28) �0.13 (0.28)Lagged rival capacity utilization 0.43 (0.33) 0.44 (0.33) 0.49 (0.34) 0.41 (0.33) 0.46 (0.34)Demand growth 0.08 (0.45) 0.13 (0.45) 0.13 (0.45) 0.15 (0.45) 0.15 (0.45)Capacity (log) �0.12*** (0.04) �0.14*** (0.04) �0.14*** (0.04) �0.13*** (0.04) �0.14*** (0.04)Lagged lumpiness 0.85* (0.52) 0.67 (0.51) 0.67 (0.51) 0.64 (0.51) 0.64 (0.51)Lagged interest coverage �0.02** (0.01) �0.02** (0.01) �0.02** (0.01) �0.02** (0.01) �0.02** (0.01)Lagged ROA 0.55 (0.45) 0.66 (0.44) 0.65 (0.44) 0.66 (0.44) 0.66 (0.44)Constant 2.04*** (0.34) 1.97*** (0.34) 0.61 (1.85) 2.01*** (0.34) 0.77 (1.86)Firm-market fixed effects
(81 levels)Yes Yes Yes Yes Yes
Year fixed effects (12 levels) Yes Yes Yes Yes Yes
R2 0.18 0.20 0.20 0.20 0.20Adjusted R2 0.05 0.07 0.07 0.07 0.07Within R2 0.08 0.10 0.10 0.11 0.11Model df 100 101 102 102 103F 17.62††† 0.28 0.93 0.46
Relative to model 1 2 2 3Test df 1 2 1 1
a n � 730. Standard errors are in parentheses.* p � .10
** p � .05*** p � .01Two-sided test.††† p � .01One-sided test.
2010 761Zhang and Gimeno

a-vis competitors and potential entrants or to“milk” the position by exploiting market power.The findings suggest that earnings pressure tips thebalance toward milking market position and couldcontribute to the decline of dominant firms (Caveset al., 1984). Such an interpretation paints a grimpicture of the consequences of earnings pressurefor long-term value.
A different interpretation of the results, one thatis consistent with the views of agency theory advo-cates (Jensen, 1986), could be that earnings pres-sure curtails managers’ “empire-building” tenden-cies. Agency theorists have argued that managersmay have “an excessive taste for running large com-panies, as opposed to simply profitable ones”(Stein, 2003: 121), and this may lead companies toexcessive investment and excessive focus on reve-nues and market share. Without capital marketmonitoring, managers may be willing to sacrificecurrent earnings in pursuit of dominant market po-sitions of questionable future value. In this view,earnings pressure disciplines managers to generatecurrent earnings by de-escalating the pursuit ofmarket position. Therefore, our finding that domi-nant firms facing earnings pressure reduced capac-ity utilization is also consistent with this agency-theoretic view. The normative interpretation of thatview, however, would be more favorable about thelong-term effect of earnings pressure.
In both interpretations, dominant firms facingearnings pressure would increase current earningsat the risk of reducing future market position. Themain point of disagreement is their divergent as-sumptions about the rate of return of intertemporalinvestments in market position. Those concernedabout negative long-term effects of earnings pres-sure assume that the return on those competitiveinvestments is higher than the cost of capital andtherefore that shareholder value is destroyed whenfirms exploit market position to generate currentearnings. Yet this assumption would be incorrect inan environment in which the future value of marketposition was low, or if managers had a systematictendency to overinvest. For example, it might beoptimal to exploit market power aggressively, at therisk of milking market positions, in situations inwhich the position itself was unsustainable or oflimited future value owing to market decline ortechnological substitution. Although this is a theo-retical possibility, we doubt that it applies in thecontext of the electricity generation industry,which is a mature (but not declining) industry withrelatively stable technologies and market structure.In this context, future market positions should bestrategically and financially valuable.
Earnings pressure may also be good for long-term
shareholder value if empire-building managershave a systematic tendency to overinvest in marketposition when not facing earnings pressure. Posthoc analysis of the asymmetric effect of positiveand negative earnings pressure provided some rel-evant evidence on this point. If earnings pressurerepresented a discipline against empire-buildingbehavior, then firms would increasingly exploitmarket power when pressure was positive, but theywould opportunistically pursue market position byincreasing capacity utilization when earnings pres-sure was negative. On the other hand, if earningspressure represented a short-term distraction froma long-term strategic pursuit, then we would expecta change in behavior only when earnings pressurewas positive, but no deviations when it was nega-tive. The post hoc analysis indicated that capacityutilization decreased with positive levels of earn-ings pressure, but it did not increase when earningspressure was negative. In our view, the evidence ismore consistent with the interpretation that earn-ings pressure represents a distraction from long-term strategic pursuits. However, further evidenceis needed to clarify this point.
Our findings suggest important implications formanagers, investors, and policy makers. For man-agers faced with earnings pressure, it is importantto anticipate how competitive decisions intendedto increase current earnings may be counterproduc-tive in the long term. First, competitive reactionsmay make these benefits short-lived and even un-dermine long-term competitiveness. Second, meet-ing analysts’ expectations may encourage evenhigher earnings expectations in the future (whatmanagers often refer to as the “earnings treadmill”)and make a situation untenable. Therefore, compet-itive actions such as restricting capacity utilization,even if effective in generating current earnings,postpone but do not solve the underlying problem.It is impossible for firms to continuously meet earn-ings expectations by exploiting market power.Managers can help reduce the negative impact ofearnings pressure by effectively developing andcommunicating multidimensional performancescorecards that reflect the long-term value of intan-gible assets such as market positions, R&D capabil-ities, brand equity, and so forth (Palter & Rehm,2009). Such leading indicator measures will helpinvestors assess whether performance improve-ments are generated by improved efficiency or byreductions in intangible investments and wouldalign investor expectations with long-term strategy.Yet this mechanism will be costly when increasedinvestor disclosure may encourage competitive im-itation. For investors, the study highlights the dif-ficulty of providing effective capital market moni-
762 AugustAcademy of Management Journal
toring in the context of publicly traded firms andalso highlights the risk that, given high informationasymmetry between managers and investors, a cap-ital market focus on earnings targets may paradox-ically result in long-term value destruction. Inves-tors aware of this problem may seek alternativegovernance approaches (e.g., block holding, privateownership) that provide medium- and long-termmonitoring and control. But taking firms privatemay not be enough. Corporate strategy research hasshown that firms relying on internal financial con-trols of business units tend to commit less to stra-tegic investments (e.g., R&D investments) thanthose using strategic controls (Hitt, Hoskisson,Johnson, & Moesel, 1996). Therefore, resolvingproblems of “short-termism” may require moresubtle changes in control systems. Finally, for pol-icy makers, the study encourages the developmentof corporate governance structures that are condu-cive to long-term value creation. In the currentcontext of accounting and corporate governancereform, investor and accounting regulatory bodiesshould consider the unintended consequences ofregulations on managerial behavior, strategy, andperformance. For example, if earnings pressure re-mains high, but accounting standards become in-creasingly stringent, there is a risk that managersseeking to fulfill earnings expectations may increas-ingly turn from accounting manipulations towardmore substantive and potentially damaging changesin strategic decisions (Cohen, Dey, & Lys, 2008; Os-wald & Zarowin, 2005; Roychowdhury, 2006).
Limitations and Extensions
Since the data used in this study were limited toa single industry, the generalizability of the resultsshould be examined in other contexts. Several fea-tures of the electricity wholesale market made it anideal context for this study, such as the nearlyperfect commodity nature of the product, the exis-tence of different regional markets with differentstructures, the diversity of ownership forms, andthe availability of rigorous data on capacity, output,and price. Yet other features may limit generaliz-ability. For example, whereas competition inwholesale electricity markets was fully deregu-lated, other parts of the electricity value chain (e.g.,retail competition) remained regulated for most ofthe period under study. Since our theory does notrely on industry-specific factors, we believe thatthe theoretical predictions should be generalizableto other output-based commodity industries inwhich competitive decisions are strategic substi-tutes and market concentration and dominance aresubstantial.
Several extensions appear worth exploring in fu-ture research. First, it would be interesting to studythe effects of earnings pressure in a context inwhich competitive behaviors are “strategic comple-ments” (e.g., price competition among differenti-ated offers), since in those situations earnings pres-sure may have strategically beneficial effects for afirm and its industry by reducing the intensity ofrivalry (by encouraging accommodating rather thanaggressive responses among rivals). Moreover, fu-ture research could analyze other types of compet-itive actions beyond output and pricing decisions,to provide broader insights into which types ofcompetitive behaviors are affected by earningspressure. Second, future studies could use moresophisticated structural methods to estimate theeffect of earnings pressure on competitive interac-tions. Our study used a reduced-form approach toestimate the effects of earnings pressure on a focalfirm and its competitors, but future research coulduse the structural methods of the “new empiricalindustrial organization” (Bresnahan, 1989) to pro-vide stronger causal inference. Third, future re-search could examine the medium- and long-termcompetitive responses and performance conse-quences of market power exploitation resultingfrom earnings pressure. Our study showed thatcompetitive reactions occurred within single years:when dominant firms experienced earnings pres-sure at the beginning of a year, their rivals ended upincreasing capacity utilization during that year.Thus, in a relatively brief window, competitive out-put expansions already partially undermined thescarcity value created when earnings-pressureddominant firms tightened supply. Yet we foundsuggestive evidence that reductions in capacity uti-lization can send price signals to competitors andpotential entrants that lead to rival capacity expan-sion over the medium and the long term and un-dermine market dominance. Fourth, future re-search could explore the process by which capitalmarket pressures, typically observed by CEOs andCFOs, are diffused in organizations to the business-unit managers who formulate and implement com-petitive actions.
Earnings pressure has received much attention inthe business press and in academic theoretical de-bates, but there is little systematic empirical evi-dence on its consequences for firms’ strategic be-havior. Our study was a first step showing a linkbetween earnings pressure and changes in compet-itive behaviors intended to increase current earn-ings by exercising market power. More research isneeded to explore other strategic consequences ofearnings pressure, particularly those that might
2010 763Zhang and Gimeno

generate delayed negative effects on future perfor-mance. Moreover, research is needed to evaluatealternative approaches for companies’ managementof earnings pressure. Should companies providebetter guidance, so that analysts can measure andproperly value leading indicators of competitive-ness? Or should they withdraw earnings guidancecompletely, as some large companies have donein recent years? Does “going private” help solvethe problem? These interactions between capitalmarket pressures and competitive and strategicdecisions provide a rich pasture for futureresearch.
REFERENCES
Abegglen, J., & Stalk, G., Jr. 1985. Kaisha, the Japanesecorporation. New York: Basic Books.
Aiken, L. S., West, S. G., & Reno, R. R. 1991. Multipleregression: Testing and interpreting interactions.Newbury Park, CA: Sage.
Bain, J. S. 1949. A note on pricing in monopoly andoligopoly. American Economic Review, 39: 448–464.
Benner, M. J. 2007. The incumbent discount: Stock mar-ket categories and response to radical technologicalchange. Academy of Management Review, 32: 703–720.
Bernhardt, D., & Campello, M. 2007. The dynamics ofearnings forecast management. Review of Finance,11: 287–324.
Besanko, D., D’Souza, J., & Thiagarajan, S. R. 2001. Theeffect of wholesale market deregulation on share-holder wealth in the electric power industry. Jour-nal of Law and Economics, 44: 65–88.
Bhojraj, S., & Libby, R. 2005. Capital market pressure,disclosure frequency-induced earnings/cash flowconflict, and managerial myopia. Accounting Re-view, 80: 1–20.
Borenstein, S., & Bushnell, J. 1999. An empirical analysisof the potential for market power in California’s elec-tricity industry. Journal of Industrial Economics,47: 285–323.
Borenstein, S., & Rose, N. L. 1995. Bankruptcy and pric-ing behavior in U.S. airline markets. American Eco-nomic Review, 85: 397–402.
Bresnahan, T. 1989. Empirical studies of industries withmarket power. In R. Schmalensee & R. Willig (Eds.),Handbook of industrial organization, vol. 1: 415–473. Oxford, U.K.: Elsevier.
Burgstahler, D., & Eames, M. 2006. Management of earn-ings and analysts’ forecasts to achieve zero and smallpositive earnings surprises. Journal of Business Fi-nance and Accounting, 33: 633–652.
Bushee, B. J. 1998. The influence of institutional inves-
tors in myopic R&D investment behavior. Account-ing Review, 73: 305–333.
Busse, M. 2002. Firm financial condition and airlineprice wars. RAND Journal of Economics, 33: 298–318.
Caves, R. E., Fortunato, M., & Ghemawat, P. 1984. Thedecline of dominant firms, 1905–1929. QuarterlyJournal of Economics, 99: 523–546.
Chen, M.-J., & Hambrick, D. C. 1995. Speed, stealth, andselective attack: How small firms differ from largefirms in competitive behavior. Academy of Man-agement Journal, 38: 453–482.
Chen, M.-J., Smith, K. G., & Grimm, C. M. 1992. Actioncharacteristics as predictors of competitive re-sponses. Management Science, 38: 439–455.
Chen, S. 2004. Why do managers fail to meet their ownforecasts? Paper presented at the 14th Annual Con-ference on Financial Economics and Accounting,http://ssrn.com/abstract�490562.
Chen, W. 2008. Determinants of firms’ backward- andforward-looking R&D search behavior. OrganizationScience, 19: 609–622.
Chevalier, J. A. 1995a. Capital structure and product-market competition: Empirical evidence from thesupermarket industry. American Economic Review,85: 415–435.
Chevalier, J. A. 1995b. Do LBO supermarkets chargemore? An empirical analysis of the effects of LBOson supermarket. Journal of Finance, 50: 1095–1112.
Chopra, V. K. 1998. Why so much error in analysts’earnings forecasts? Financial Analysts Journal,54(6): 35–42.
Cohen, D. A., Dey, A., & Lys, T. Z. 2008. Real and accrual-based earnings management in the pre- and post-Sarbanes-Oxley periods. Accounting Review, 83:757–787.
Cool, K., Dierickx, I., & Jemison, D. 1989. Business strat-egy, market structure and risk-return relationships:A structural approach. Strategic Management Jour-nal, 10: 507–522.
Cotter, J., Tuna, I., & Wysocki, P. D. 2006. Expectationsmanagement and beatable targets: How do analystsreact to explicit earnings guidance? ContemporaryAccounting Research, 23: 593–624.
Cournot, A. 1838. Recherches sur les principes math-ematiques de la theorie des richesses [Researchinto the mathematical principles of the theory ofwealth]. Paris: Hachette.
Cowen, A., Groysberg, B., & Healy, P. 2006. Which typesof analyst firms are more optimistic? Journal of Ac-counting and Economics, 41: 119–146.
Cyert, R. M., & March, J. G. 1963. A behavioral theory ofthe firm. Malden, MA: Blackwell.
David, P., Hitt, M. A., & Gimeno, J. 2001. The influence of
764 AugustAcademy of Management Journal
activism by institutional investors on R&D. Acad-emy of Management Journal, 44: 144–157.
Dechow, P. M., Hutton, A. P., & Sloan, R. G. 1999a. Therelation between analysts’ forecasts of long-termearnings growth and stock price performance follow-ing equity offerings. Contemporary Accounting Re-search, 17: 1–32.
Dechow, P. M., Hutton, A. P., & Sloan, R. G. 1999b. Anempirical assessment of the residual income valua-tion model. Journal of Accounting and Economics,26: 1–34.
Dechow, P. M., and Skinner, D. J. 2000. Earnings man-agement: Reconciling the views of accounting ac-ademics, practitioners, and regulators. Available athttp://ssrn.com/abstract�218959.
Degeorge, F., Patel, J., & Zeckhauser, R. 1999. Earningsmanagement to exceed thresholds. Journal of Busi-ness, 72(1): 1–33.
Dreman, D. N., & Berry, M. A. 1995. Analyst forecastingerrors and their implications for security analysis.Financial Analysts Journal, 51(3): 30–41.
Dow Jones News Service. 2001. American ElectricPower 3Q ongoing EPS $1.43 Vs $1.274. http://www.factiva.com. Accessed October 23.
Dugar, A., & Nathan, S. 1995. The effect of investmentbanking relationships on financial analysts’ earningsforecasts and investment recommendations. Con-temporary Accounting Research, 12: 131–160.
EIA. 2000. The changing structure of the electric powerindustry 2000: An update. Accessed at http://www.eia.doe.gov/cneaf/electricity/chg_stru_update/update2000.html.
EIA. 2008. Electric power industry overview. Accessedat http://www.eia.doe.gov/cneaf/electricity/page/prim2/toc2.html#netw.
Fabra, N., & Toro, J. 2005. Price wars and collusion in theSpanish electricity market. International Journal ofIndustrial Organization, 23(3/4): 155–181.
Ferrier, W. J., Smith, K. G., & Grimm, C. M. 1999. The roleof competitive action in market share erosion andindustry dethronement: A study of industry leadersand challengers. Academy of Management Journal,42: 372–388.
Fudenberg, D., & Tirole, J. 1984. The fat-cat effect, thepuppy-dog ploy, and the lean and hungry look.American Economic Review, 74: 361–366.
Gavetti, G., & Levinthal, D. 2000. Looking forward andlooking backward: Cognitive and experientialsearch. Administrative Science Quarterly, 45: 113–137.
Ghemawat, P. 1984. Capacity expansion in the titaniumdioxide industry. Journal of Industrial Economics,33: 145–163.
Gilbert, R. J., & Lieberman, M. 1987. Investment and
coordination in oligopolistic industries. RAND Jour-nal of Economics, 18: 17–33.
Graham, J. R., Harvey, C. R., & Rajgopal, S. 2005. Theeconomic implications of corporate financial report-ing. Journal of Accounting and Economics, 40:3–73.
Greve, H. R. 2003. Organizational learning from per-formance feedback: A behavioral perspective oninnovation and change. Cambridge, U.K.: Cam-bridge University Press.
Grimm, C. M., Lee, H., & Smith, K. G. 2006. Strategy asaction: Competitive dynamics and competitiveadvantage. Oxford, U.K.: Oxford University Press.
Hall, B. J., & Liebman, J. B. 1998. Are CEOs really paidlike bureaucrats? Quarterly Journal of Economics,113: 653–691.
Hayes, R. M., & Levine, C. B. 2000. An approach to adjust-ing analysts’ consensus forecasts for selection bias.Contemporary Accounting Research, 17(1): 61–83.
Hitt, M. A., Hoskisson, R. E., Johnson, R. A., & Moesel,D. D. 1996. The market for corporate control and firminnovation. Academy of Management Journal, 39:1084–1119.
Hong, H., & Kubik, J. D. 2003. Analyzing the analysts:Career concerns and biased earnings forecasts. Jour-nal of Finance, 58: 313–351.
Hong, H., Kubik, J. D., & Solomon, A. 2000. Securityanalysts’ career concerns and herding of earningsforecasts. RAND Journal of Economics, 31: 121–144.
Hoskisson, R. E., Hitt, M. A., Johnson, R. A., & Gross-man, W. 2002. Conflicting voices: The effects ofinstitutional ownership heterogeneity and internalgovernance on corporate innovation strategies.Academy of Management Journal, 45: 697–716.
Jacquemin, A., & Slade, M. E. 1989. Cartels, collusion,and horizontal merger. In R. Schmalensee & R. Willig(Eds.), Handbook of industrial organization vol. 1:415–473. Oxford, U.K.: Elsevier.
Jensen, M. C. 1986. Agency costs of free cash flow, cor-porate finance, and takeovers. American EconomicReview, 76: 323–329.
Jensen, M. C. 2005. Agency costs of overvalued equity.Financial Management, 34(1): 5–19.
Jensen, M. C., & Meckling, W. H. 1976. Theory of thefirm: Managerial behavior, agency costs and owner-ship structure. Journal of Financial Economics, 3:305–360.
Jones, J. J. 1991. Earnings management during importrelief investigations. Journal of Accounting Re-search, 29(2): 193–228.
Joskow, P. L., & Kahn, E. 2002. A quantitative analysis ofpricing behavior in California’s wholesale electricitymarket during summer 2000. Energy Journal, 23(4):1–35.
Kahneman, D., & Tversky, A. 1979. Prospect theory: An
2010 765Zhang and Gimeno
analysis of decision under risk. Econometrica, 47:263–291.
Kamien, M. I., & Schwartz, N. L. 1975. Cournot oligopolywith uncertain entry. Review of Economic Studies,42(129): 125–131.
King, T. 2004. Making financial goals and reporting pol-icies serve corporate strategy: The case of progres-sive insurance. Journal of Applied Corporate Fi-nance, 16(4): 17–27.
Levitt, A. 1998. The numbers game. Speech delivered atthe NYU Center for Law and Business, New York,September 28. http://www.sec.gov/news/speech/speecharchive/1998/spch220.txt.
Lieberman, M. B. 1987. Excess capacity as a barrier toentry: An empirical appraisal. Journal of IndustrialEconomics, 35: 607–627.
Lieberman, M. B. 1989. Capacity utilization: Theoreticalmodels and empirical tests. European Journal ofOperational Research, 40(2): 155–168.
Lin, H., & McNichols, M. F. 1998. Underwriting relation-ships, analysts’ earnings forecasts and investmentrecommendations. Journal of Accounting and Eco-nomics, 25: 101–127.
Lobo, G. J., & Nair, R. D. 1991. Analysts’ utilization ofhistorical earnings information. Managerial andDecision Economics, 12: 383–393.
Malmendier, U., & Shanthikumar, D. 2007. Are smallinvestors naive about incentives? Journal of Finan-cial Economics, 85: 457–489.
Masson, R. T., & Shaanan, J. 1986. Excess capacity andlimit pricing: An empirical test. Economica, 53:365–378.
Matsumoto, D. 2002. Management’s incentives to avoidnegative earnings surprises. Accounting Review, 77:285–316.
McKinsey & Company. 2006. Weighing the pros andcons of earnings guidance: A McKinsey survey.www.mckinseyquarterly.com/links/21063, March.
McLean, B., & Elkind, P. 2003. The smartest guys in theroom: The amazing rise and scandalous fall of En-ron. New York: Portfolio.
Michaely, R., & Womack, K. L. 1999. Conflict of interestand the credibility of underwriter analyst recom-mendations. Review of Financial Studies, 12: 635–686.
Mikhail, M. B., Walther, B. R., & Willis, R. H. 2007. Whensecurity analysts talk, who listens? Accounting Re-view, 82: 1227–1253.
Milgrom, P., & Roberts, J. 1982. Predation, reputation andentry deterrence. Journal of Economic Theory, 27:280–312.
Moreton, P., & Zenger, T. 2005. Corporate strategy, an-alyst coverage, and the uniqueness discount.Working paper, Washington University in St. Louis.
Newman, H. H. 1978. Strategic groups and the structure-performance relationship. Review of Economicsand Statistics, 60: 417–427.
Oswald, D. R., & Zarowin, P. 2005. Capitalization vs.expensing of R&D and earnings management.Working paper, London Business School.
Palter, R. N., & Rehm, W. 2009. Opening up to investors.McKinsey Quarterly, www.mckinseyquarterly.com/links/21063, January.
Payne, J. L., & Robb, S. W. G. 2000. Earnings manage-ment: The effect of ex ante earnings expectations.Journal of Accounting, Auditing and Finance, 15:371–392.
Phillips, G. M. 1995. Increased debt and industry productmarkets: An empirical analysis. Journal of Finan-cial Economics, 37: 189–238.
Porter, M. E. 1992. Capital disadvantage: America’s fail-ing capital investment system. Harvard BusinessReview, 70(5): 65–82.
Pozner, J., & Zajac, E. 2005. Explaining firm perfor-mance: The symbolic management of quarterlyearnings announcements. Working paper, North-western University, Evanston, IL.
Puffer, S. M., & Weintrop, J. B. 1991. Corporate perfor-mance and CEO turnover: The role of performanceexpectations. Administrative Science Quarterly,36: 1–19.
Roychowdhury, S. 2006. Earnings management throughreal activities manipulation. Journal of Accountingand Economics, 42: 335–370.
Schipper, K. 1991. Analysts’ forecasts. Accounting Hori-zons, 5(4): 105–121.
Skinner, D. J., & Sloan, R. G. 2002. Earnings surprises,growth expectations, and stock returns or don’t letan earnings torpedo sink your portfolio. Review ofAccounting Studies, 7: 289–312.
Spence, A. M. 1977. Entry, capacity, investment andoligopolistic pricing. Bell Journal of Economics, 8:534–544.
Stein, J. 2003. Agency information and corporate invest-ment. In G. Constantinides, M. Harris, & R. M. Stulz(Eds.), Handbook of the economics of finance, vol.1: 111–165. Oxford, U.K.: Elsevier.
Stein, J. C. 1989. Efficient capital markets, inefficientfirms: A model of myopic corporate behavior. Quar-terly Journal of Economics, 104: 655–669.
Stickel, S. E. 1992. Reputation and performance amongsecurity analysts. Journal of Finance, 47: 1811–1836.
Stigler, G. J. 1964. A theory of oligopoly. Journal ofPolitical Economy, 1(72): 44–61.
Sweeting, A. 2007. Market power in the England andWales wholesale electricity market 1995–2000. Eco-nomic Journal, 117: 654–685.
766 AugustAcademy of Management Journal

Trueman, B. 1994. Analyst forecasts and herding behav-ior. Review of Financial Studies, 7: 97–124.
Turner, T. 2005. My beef with big media: How govern-ment protects big media—and shuts out upstarts likeme. Federal Communications Law Journal, vol. 57:223–234.
Useem, M. 1996. Investor capitalism: How money man-agers are changing the face of corporate America.New York: Basic Books.
Wiseman, R. M., & Bromiley, P. 1996. Toward a model ofrisk in declining organizations: An empirical exam-ination of risk, performance and decline. Organiza-tion Science, 7: 524–543.
Zuckerman, E. W. 1999. The categorical imperative: Se-curities analysts and the illegitimacy discount.American Journal of Sociology, 104: 1398–1438.
Zuckerman, E. W. 2000. Focusing the corporate product:Securities analysts and de-diversification. Adminis-trative Science Quarterly, 45: 591–619.
APPENDIX A
U.S. Electricity Wholesale Market
The 1992 Energy Policy Act divided the U.S. elec-tricity wholesale market into 12 wholesale markets, orNERC regions. Three major interconnection networkshelped to balance the supply and demand across theregions (EIA, 2000). However, almost all wholesaletrade was initially within NERC regions, although util-
ities are expanding wholesale trade beyond those tra-ditional boundaries (EIA, 2008). Figure A1 shows theseNERC regions and interconnections, and detailed in-formation about market structure appears in Table A1.
APPENDIX B
Calculation of Potential Earnings Variable
Matsumoto (2002) developed a measure to estimate theexpected portion of analysts’ forecasts, or “estimatedforecasts,” to compare analysts’ forecast consensus withthe earnings per share (EPS) that a firm can realize.Estimated forecasts is calculated as the sum of expectedchanges in EPS and EPS from the same quarter in theprior year:
E�Fijtq� � EPSijtq � 4 � E��EPSijtq�.
Expected change in EPS, E[�EPSijtq], is calculated by:
E��EPSijtq� � �jt � 1 � �1jt � 1(�EPSijtq � 1/Pijtq � 5)
� �2jt � 1CRETijtq� � Pijtq � 4.
The parameter estimates are obtained from the regressionof all the other firms in the prior firm-year, as in:
�EPSijtq/Pijtq�4 � jt � �1jt(�EPSijtq�1/Pijtq�5)
� �2jtCRETijtq � �ijtq,
where �EPSijtq is earnings per share for firm i in four-digit SIC code j in quarter q of year t, less EPS for the
FIGURE A1NERC Regions and Interconnection Networksa
a Source: EIA(2000). White space in the figure delimits the three major interconnection networks.
2010 767Zhang and Gimeno
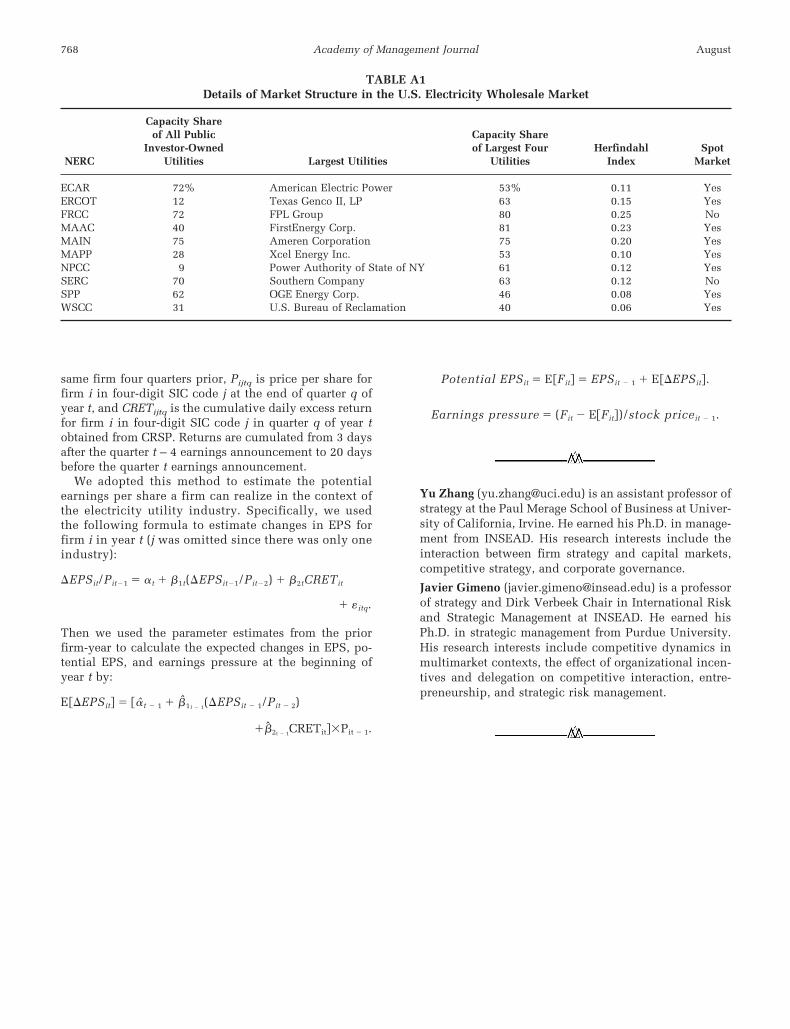
same firm four quarters prior, Pijtq is price per share forfirm i in four-digit SIC code j at the end of quarter q ofyear t, and CRETijtq is the cumulative daily excess returnfor firm i in four-digit SIC code j in quarter q of year tobtained from CRSP. Returns are cumulated from 3 daysafter the quarter t – 4 earnings announcement to 20 daysbefore the quarter t earnings announcement.
We adopted this method to estimate the potentialearnings per share a firm can realize in the context ofthe electricity utility industry. Specifically, we usedthe following formula to estimate changes in EPS forfirm i in year t (j was omitted since there was only oneindustry):
�EPSit/Pit�1 � t � �1t(�EPSit�1/Pit�2) � �2tCRETit
� �itq.
Then we used the parameter estimates from the priorfirm-year to calculate the expected changes in EPS, po-tential EPS, and earnings pressure at the beginning ofyear t by:
E��EPSit� � �t � 1 � �1t � 1(�EPSit � 1/Pit � 2)
��2t � 1CRETit��Pit � 1.
Potential EPSit � E�Fit� � EPSit � 1 � E��EPSit�.
Earnings pressure � (Fit � E�Fit�)/stock priceit � 1.
Yu Zhang ([email protected]) is an assistant professor ofstrategy at the Paul Merage School of Business at Univer-sity of California, Irvine. He earned his Ph.D. in manage-ment from INSEAD. His research interests include theinteraction between firm strategy and capital markets,competitive strategy, and corporate governance.
Javier Gimeno ([email protected]) is a professorof strategy and Dirk Verbeek Chair in International Riskand Strategic Management at INSEAD. He earned hisPh.D. in strategic management from Purdue University.His research interests include competitive dynamics inmultimarket contexts, the effect of organizational incen-tives and delegation on competitive interaction, entre-preneurship, and strategic risk management.
TABLE A1Details of Market Structure in the U.S. Electricity Wholesale Market
NERC
Capacity Shareof All Public
Investor-OwnedUtilities Largest Utilities
Capacity Shareof Largest Four
UtilitiesHerfindahl
IndexSpot
Market
ECAR 72% American Electric Power 53% 0.11 YesERCOT 12 Texas Genco II, LP 63 0.15 YesFRCC 72 FPL Group 80 0.25 NoMAAC 40 FirstEnergy Corp. 81 0.23 YesMAIN 75 Ameren Corporation 75 0.20 YesMAPP 28 Xcel Energy Inc. 53 0.10 YesNPCC 9 Power Authority of State of NY 61 0.12 YesSERC 70 Southern Company 63 0.12 NoSPP 62 OGE Energy Corp. 46 0.08 YesWSCC 31 U.S. Bureau of Reclamation 40 0.06 Yes
768 AugustAcademy of Management Journal

Copyright of Academy of Management Journal is the property of Academy of Management and its content may
not be copied or emailed to multiple sites or posted to a listserv without the copyright holder's express written
permission. However, users may print, download, or email articles for individual use.