Earnings Presentation 1HFY19 - sunshineholdings.lk · Group Financial Highlights 1H 1H Growth 2Q 2Q...
22
-
Upload
truongliem -
Category
Documents
-
view
216 -
download
0
Transcript of Earnings Presentation 1HFY19 - sunshineholdings.lk · Group Financial Highlights 1H 1H Growth 2Q 2Q...


Earnings Presentation 1HFY19
08th November 2018

Group Performance
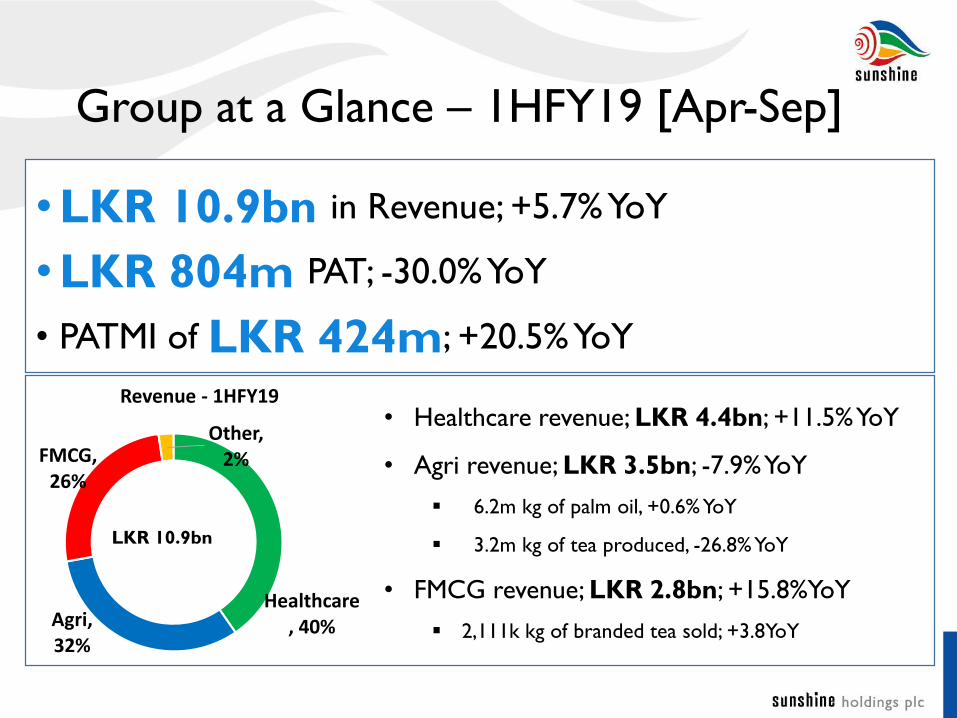
Group at a Glance – 1HFY19 [Apr-Sep]
•LKR 10.9bn in Revenue; +5.7% YoY
•LKR 804m PAT; -30.0% YoY
• PATMI of LKR 424m; +20.5% YoY
• Healthcare revenue; LKR 4.4bn; +11.5%YoY
• Agri revenue; LKR 3.5bn; -7.9%YoY
▪ 6.2m kg of palm oil, +0.6%YoY
▪ 3.2m kg of tea produced, -26.8%YoY
• FMCG revenue; LKR 2.8bn; +15.8%YoY
▪ 2,111k kg of branded tea sold; +3.8YoY
Healthcare, 40%Agri,
32%
FMCG, 26%
Other, 2%
Revenue - 1HFY19
LKR 10.9bn
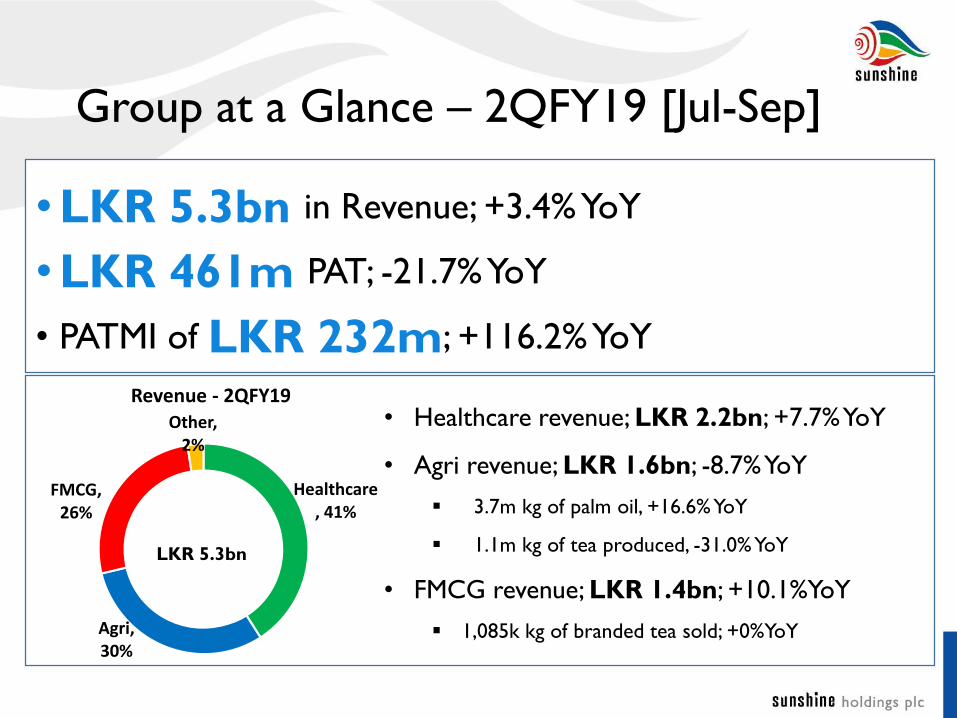
Group at a Glance – 2QFY19 [Jul-Sep]
•LKR 5.3bn in Revenue; +3.4% YoY
•LKR 461m PAT; -21.7% YoY
• PATMI of LKR 232m; +116.2% YoY
• Healthcare revenue; LKR 2.2bn; +7.7%YoY
• Agri revenue; LKR 1.6bn; -8.7%YoY
▪ 3.7m kg of palm oil, +16.6%YoY
▪ 1.1m kg of tea produced, -31.0%YoY
• FMCG revenue; LKR 1.4bn; +10.1%YoY
▪ 1,085k kg of branded tea sold; +0%YoY
Healthcare, 41%
Agri, 30%
FMCG, 26%
Other, 2%
Revenue - 2QFY19
LKR 5.3bn

Group Financial Highlights1H 1H Growth 2Q 2Q Growth
FY19 FY18 % FY19 FY18 %
Revenue 10,915 10,328 5.7% 5,337 5,164 3.4%
EBIT 1,298 1,292 0.5% 699 606 15.3%
EBIT Margin 11.9% 12.5% 13.1% 11.7%
PAT 804 1,149 -30.0% 461 588 -21.7%
PAT Margin 7.4% 11.1% 8.6% 11.4%
PATMI 424 352 20.5% 232 107 116.2%
EPS (LKR) 3.02 2.45 23.3% 1.66 0.77 116.2%
Adj. PAT* 804 1,022 -21.3% 461 461 -0.1%
Adjusted EPS (LKR)* 3.02 1.60 88.6% 1.66 (0.14) N/A
LKR m
*Adjusted for one off gain/loss

4,166 4,341
4,864 5,164 5,337
19%
4%
12%
6%
3%
0
0.05
0.1
0.15
0.2
0.25
-
1,000
2,000
3,000
4,000
5,000
6,000
2QFY15 2QFY16 2QFY17 2QFY18 2QFY19
Revenue Revenue Growth
2Q Revenue Growth Trend
• 5 Year CAGR of 6%
5 Yr CAGR: 6%
LK
R m
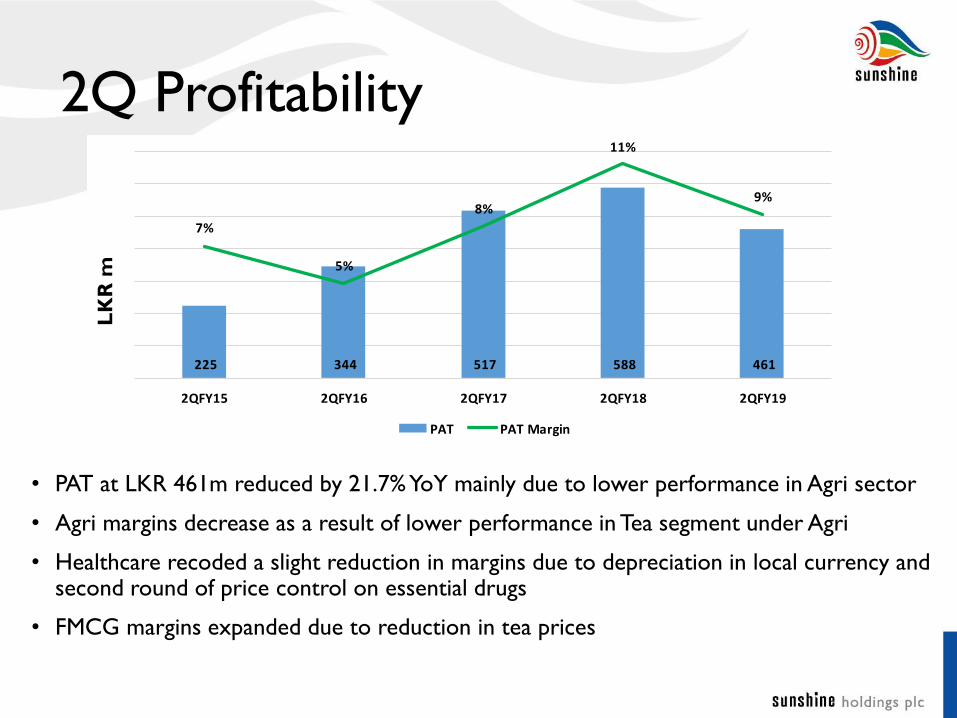
225 344 517 588 461
7%
5%
8%
11%
9%
0
0.02
0.04
0.06
0.08
0.1
0.12
-
100
200
300
400
500
600
700
2QFY15 2QFY16 2QFY17 2QFY18 2QFY19
PAT PAT Margin
2Q Profitability
• PAT at LKR 461m reduced by 21.7% YoY mainly due to lower performance in Agri sector
• Agri margins decrease as a result of lower performance in Tea segment under Agri
• Healthcare recoded a slight reduction in margins due to depreciation in local currency and second round of price control on essential drugs
• FMCG margins expanded due to reduction in tea prices
LK
R m

Healthcare, 24%
Agri, 43%
FMCG, 35%
Other, -2%
PATMI - 2QFY19
Healthcare, 14%
Agri, 54%
FMCG, 32%
Other, 0%
PAT - 2QFY19
Earnings Contribution 2QFY19
LKR 461m LKR 232m

Segment Performance

Healthcare
Highlights
• 2QFY19 Revenue up by 7.7% YoY due to higher sales volume in pharma sub-sector
and footfall growth in Retail sub-sector
• EBIT margin contraction in 2QFY19 due to;
• Depreciation of the local currency eroding GP margins
• Second round of price controlling on the essential drugs
• Acquisition of Hayleys Pharma agencies and Erba Lachema agency
1H 1H Growth 2Q 2Q Growth
FY19 FY18 % FY19 FY18 %
Revenue 4,417 3,960 11.5% 2,181 2,025 7.7%
EBIT 237 245 -3.2% 90 109 -17.9%
EBIT Margin 5.4% 6.2% 4.1% 5.4%
PAT 154 155 -1.2% 66 71 -6.6%
PAT Margin 3.5% 3.9% 3.0% 3.5%
LKR m
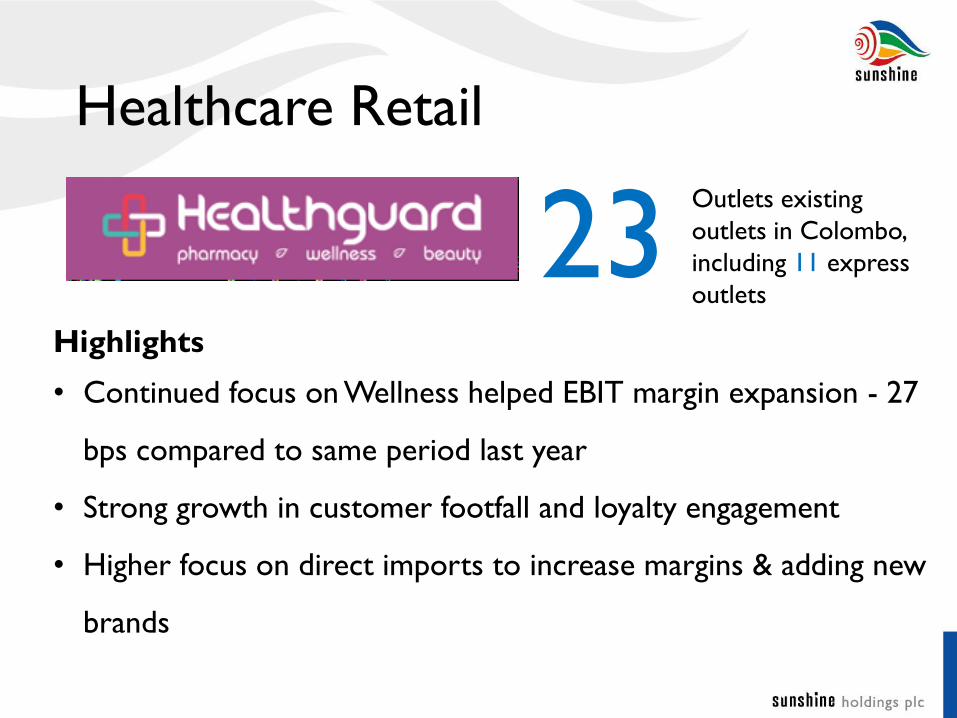
Healthcare Retail
23Outlets existing
outlets in Colombo,
including 11 express
outlets
Highlights
• Continued focus on Wellness helped EBIT margin expansion - 27
bps compared to same period last year
• Strong growth in customer footfall and loyalty engagement
• Higher focus on direct imports to increase margins & adding new
brands
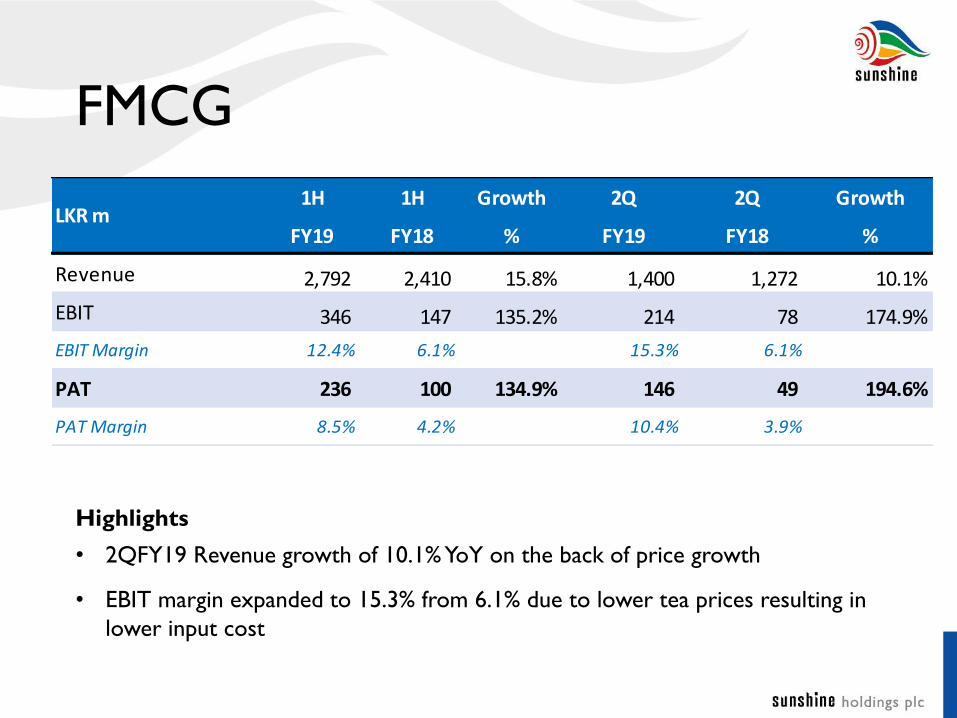
FMCG
Highlights
• 2QFY19 Revenue growth of 10.1% YoY on the back of price growth
• EBIT margin expanded to 15.3% from 6.1% due to lower tea prices resulting in
lower input cost
1H 1H Growth 2Q 2Q Growth
FY19 FY18 % FY19 FY18 %
Revenue 2,792 2,410 15.8% 1,400 1,272 10.1%
EBIT 346 147 135.2% 214 78 174.9%
EBIT Margin 12.4% 6.1% 15.3% 6.1%
PAT 236 100 134.9% 146 49 194.6%
PAT Margin 8.5% 4.2% 10.4% 3.9%
LKR m

Agri –Sector Results
Highlights
• Revenue contracted by 8.7% YoY due to lower yield in tea sub segment
• 31.0% decrease in Tea crop due to unfavorable weather conditions
• Tea NSA lower 5.5% YoY due to lower demand
• Oil palm NSA increased 12.6% compared to last year 2Q
• Current herd in the Dairy Farm reached to 1,536 animals, of which 991 are milking.
1H 1H Growth 2Q 2Q Growth
FY19 FY18 % FY19 FY18 %
Revenue 3,467 3,766 -7.9% 1,623 1,778 -8.7%
EBIT 639 743 -13.9% 353 300 17.5%
EBIT Margin 18.4% 19.7% 21.7% 16.9%
PAT 453 743 -39.0% 249 366 -32.0%
PAT Margin 13.1% 19.7% 15.4% 20.6%
LKR m
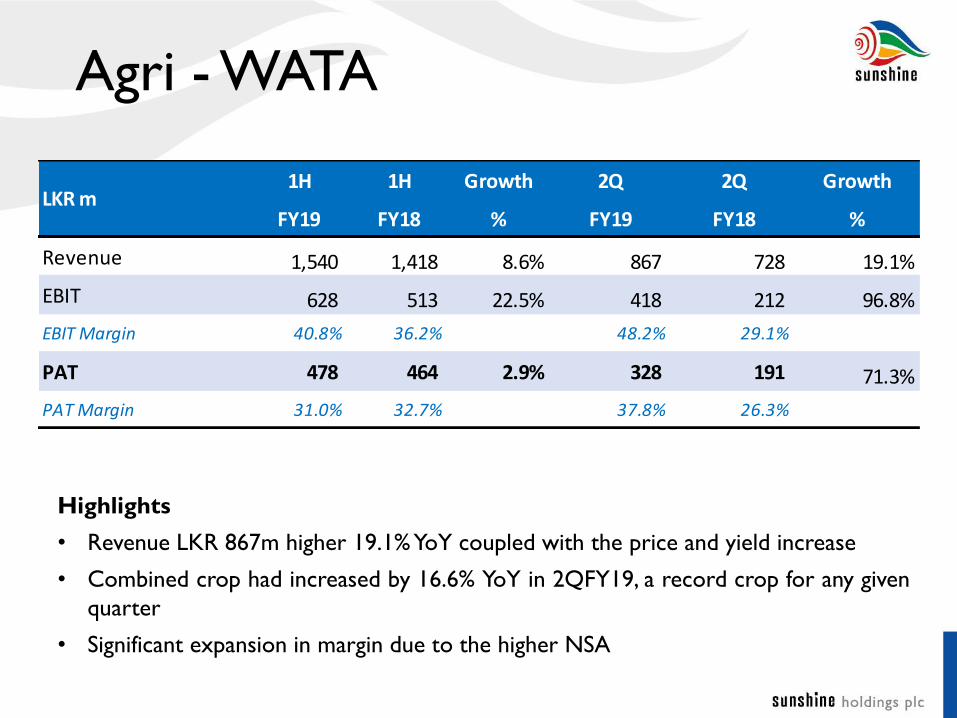
Agri - WATA
Highlights
• Revenue LKR 867m higher 19.1%YoY coupled with the price and yield increase
• Combined crop had increased by 16.6% YoY in 2QFY19, a record crop for any given
quarter
• Significant expansion in margin due to the higher NSA
1H 1H Growth 2Q 2Q Growth
FY19 FY18 % FY19 FY18 %
Revenue 1,540 1,418 8.6% 867 728 19.1%
EBIT 628 513 22.5% 418 212 96.8%
EBIT Margin 40.8% 36.2% 48.2% 29.1%
PAT 478 464 2.9% 328 191 71.3%
PAT Margin 31.0% 32.7% 37.8% 26.3%
LKR m

Agri - HPL
Highlights
• Revenue reduced by 28.0%YoY for 2Q mainly due low crop & low NSA
• 31.0%YoY decrease in crop due to unfavorable weather conditions
• Tea NSA slightly below 5.5%YoY due to lower demand
1H 1H Growth 2Q 2Q Growth
FY19 FY18 % FY19 FY18 %
Revenue 1,927 2,348 -17.9% 756 1,050 -28.0%
EBIT 11 230 -95.2% (65) 88 -173.9%
EBIT Margin 0.6% 9.8% -8.6% 8.4%
PAT (24) 279 -108.8% (79) 175 -145.1%
PAT Margin -1.3% 11.9% -10.4% 16.7%
LKR m

Energy
Highlights
• Revenue increased by 67.6% is mainly due to heavy rainfall in catchment areas
• Elgin Plant under construction & will be commissioned in end November 2018,
construction was delayed due to higher rain falls
• Installation of the first rooftop solar started at the sunshine Tea Kelaniya premises
1H 1H Growth 2Q 2Q Growth
FY19 FY18 % FY19 FY18 %
Revenue 197 104 89.4% 105 63 67.6%
EBIT 121 45 168.9% 66 32 104.0%
EBIT Margin 61.4% 43.3% 62.9% 51.6%
PAT 102 15 593.9% 58 12 380.0%
PAT Margin 51.8% 14.1% 55.1% 19.3%
LKR m

Additional data for analysts
LKR m2Q
FY15
3Q
FY15
4Q
FY15
1Q
FY16
2Q
FY16
3Q
FY16
4Q
FY17
1Q
FY17
2Q
FY17
3Q
FY17
4Q
FY17
1Q
FY18
2Q
FY18
3Q
FY18
4Q
FY18
1Q
FY19
2Q
FY19
Revenue 4,166 4,072 4,105 4,179 4,341 4,288 4,615 4,621 4,864 4,425 5,115 5,164 5,128 5,235 5,673 5,578 5,337
PAT 225 289 207 314 344 391 169 408 517 403 283 561 465 489 165 343 461
PATMI 158 104 76 162 171 175 78 207 227 13 126 244 286 190 120 192 232
Volumes
2Q
FY15
3Q
FY15
4Q
FY15
1Q
FY16
2Q
FY16
3Q
FY16
4Q
FY17
1Q
FY17
2Q
FY17
3Q
FY17
4Q
FY17
1Q
FY18
2Q
FY18
3Q
FY18
4Q
FY18
1Q
FY19
2Q
FY19
Branded Tea (kg
'000) 838 809 863 703 948 1,016 997 798 1100 987 1,062 950 1,085 1,178 1,181 1,026 1,085
Tea (kg 'mn) 1.9 2.6 2.5 2.6 2.1 2.5 2.2 2.5 1.4 2.0 1.5 2.4 1.6 1.8 2.1 2.1 1.1
Palm Oil (kg 'mn) 2.5 2.3 1.9 2.8 2.5 1.8 1.9 2.7 3.4 2.4 2.2 3.0 3.2 2.3 2.3 2.5 3.7

Outlook

Outlook for 3Q FY19
Healthcare
• Rupee depreciation to impact
margins
• Higher volumes growth for
molecules under price control
• Focus on Beauty & Wellness
brands to increase margins with
higher brand loyalty
FMCG
• Continue to invest in Brands
• Tea prices expected to increase
Agri
• Increase in Tea NSA due to lower
supply
• Palm Oil NSA to increased with
the depreciation of Rupee
Energy
• Higher rainfall to continue
• Construction of Elgin plant to be
completed end November 2018
• Complete the first rooftop solar
installation by Dec 2018

Forward Looking Statements
This presentation contains forward-looking statements that are based on management’s current expectations andassumptions. Forward-looking statements include predictions of future results or activities and may contain thewords “expects,” “believes,” “should,” “will,” “anticipates,” “projects,” “estimates,” “implies,” “can,” or words orphrases of similar meaning. These forward-looking statements are subject to certain risks and uncertainties thatcould cause actual results to differ materially from the potential results discussed in the forward-lookingstatements. Our predictions could be affected by a variety of factors, including: competitive dynamics and themarkets for our products, including new product introductions, advertising activities, pricing actions andpromotional activities of our competitors; economic conditions, including changes in inflation rates, interest rates,tax rates, or the availability of capital; product development and innovation; consumer acceptance of newproducts and product improvements; consumer reaction to pricing actions and changes in promotion levels;acquisitions or dispositions of businesses or assets; changes in capital structure; changes in laws and regulations,including labeling and advertising regulations; impairments in the carrying value of intangible assets, or otherlong-lived assets, or changes in the useful lives of other intangible assets; changes in accounting standards and theimpact of significant accounting estimates; product quality and safety issues, including recalls and product liability;changes in consumer demand for our products; effectiveness of advertising, marketing and promotional programs;changes in consumer behavior, trends and preferences, including weight loss trends; consumer perception ofhealth-related issues; consolidation in the retail environment; changes in purchasing and inventory levels ofsignificant customers; fluctuations in the cost and availability of supply chain resources, including raw materials,packaging and energy; disruptions or inefficiencies in the supply chain; benefit plan expenses due to changes inplan asset values and discount rates used to determine plan liabilities; failure or breach of our informationtechnology systems; foreign economic conditions, including currency rate fluctuations; and political unrest inforeign markets and economic uncertainty due to terrorism or war.
The company undertakes no obligation to publicly revise any forward-looking statements to reflect any futureevents or circumstances.
Thank you
For more information, Please visit our Investor Relations page
http://www.sunshineholdings.lk/investor%20relations/index.php


![Financial Results 2019/4-9 · 3〜4Q (8.8%) FY16 FY17 FY18 FY19 FY20F FY16 FY17 FY18 FY19 FY20F FY16 FY17 FY18 FY19 FY20F [Bil.Yen] ( )Ratio to Revenue 15 < >Ratio to](https://static.fdocuments.in/doc/165x107/5eb9e8ccd5eebf23057398c7/financial-results-20194-9-3oe4q-i88i-fy16-fy17-fy18-fy19-fy20f-fy16-fy17.jpg)