Earnings Based Valuations
25
Earnings Based Valuations Dr. Mangold California State University, East Bay
-
Upload
alyssa-mclean -
Category
Documents
-
view
44 -
download
0
description
Earnings Based Valuations. Dr. Mangold California State University, East Bay. Dividend capitalization model: P 0 = One of these dividends is the expected liquidating dividend: P 0 =. Cash Flows to the Firm: P 0 = - PowerPoint PPT Presentation
Transcript of Earnings Based Valuations

Earnings Based Valuations
Dr. Mangold
California State University, East Bay

Dividend capitalization model:
P0 =
One of these dividends is the expected liquidating dividend:
P0 =
n
tt
t
r
DividendExpected
1 )1(
nn
n
tt
t
r
DivgliquidatinExpected
r
DividendExpected
)1()1(
1
1

Cash Flows to the Firm:
P0 =
When expected leveraged free cash flows are projected to remain constant into perpetuity:
P0 =
When expected free cash flows are projected to grow at a constant rate equal to g:
P0 = Expected Cash Flowt=1 *
n
tt
t
r
FlowsCashExpected
1 )1(
r
FlowCashExpected t 1
gr 1

Expected Earnings:
Substitute a firm’s expected earnings for its expected leveraged free cash flows in the formulation of market price:
P0 =
Firm’s earnings constant: P0 =
Firm’s earnings to grow at a constant rate g: P0 = Expected Earningst=1 *
n
ttr
EarningsExpected
1 )1(
r
EarningsExpected t 1
gr 1

Actual Earnings:
Substitute actual earnings of the most recent period for expected permanent earnings:
P0 =
Steady growth rate g:
P0 = Actual Earningst-1 *
r
EarningsActual t 1
gr
g
1

Market Price = PV of Future Dividends to Shareholders ↓ = PV of Future Leveraged Free Cash Flows of the Firm ↓ = Capitalized Value of Future Earnings of the Firm ↓ = Capitalized Value of Current Earnings of the Firm

Theoretical Model (P/E ratios): No Growth Firm:
rEarningsActual
P
t
1
1
0 rEarningsActual
P
t
1
1
0

Example 1: No growth
Earnings = 700
Cost of Equity Capital = 0.14
PE Ratio = 1/0.14 = = 7.14
P = 700x (1/0.14) = 5000

Constant Growth Firm:
gr
g
EarningsActual
P
t
1
1
0

Example 2
Earnings = 700Cost of Equity Capital = 0.14g = 0.05PE Ratio =(1+0.05)/(0.14-0.05) = 11.67 P = 700*11.67 = $8,167

Example 3
Earnings = 700Cost of Equity Capital = 0.14g= 0.06PE Ratio = (1+0.06)/(0.14-0.06) = 13.25 P = 700*13.25 = $9,275

Let’s now apply the theoretical P-E Model (growth version) to Coke.
Market Price per Share (Dec. 31, Year 7) $52.63Earnings per Share (Year 7) $1.40Market Beta 0.97Cost of Equity Capital 12.8% *
Five-year Compound Annual Growth Rate in Earnings 16.7%Risk-free Interest Rate 6.0%Market Risk Premium 7.0%
[*12.8% = 6.0% +0.97(7%)]
SolutionP-E ratio = 37.6 = $52.63/$1.40Cost of Equity Capital = 19.8% when the Growth Rate in Earnings is 16.7%∵37.6 = 1.167/(x – 0.167) x = 0.198∴
Implied Growth Rate in Earnings = 9.9%∵37.6 = (1 + g)/(0.128 – g) g = 0.099∴

The difference between Actual P/E and Theoretical P/E:
Actual < Theoretical Buy or Sell
Actual > Theoretical Buy or Sell
1. Actual earnings of the current period is a poor predictor of expected earnings.
2. Impact of accounting principles: Industry - Use conservative accounting principles - Technology – expense R&D - LIFO - Lower earnings - Higher P/E ratios
E
P
E
P
E
P
E
P

P/E ratios:
1. Risk.2. Growth.3. Difference between current and expected future
(permanent) earnings.4. Alternative accounting principles.

Price to Book value Ratios:
P0 =
P0 =
n
tt
t
r
EarningsExpected
1 )1(
n
tt
tt
r
BVROCEExpected
1 )1(

In Equilibrium, ROCE = r, P = BV, P/BV = 1
P0 = BV0 +
n
tt
tt
r
BVrROCEExpected
1 )1(
))((
0
1
0
0 )1(
))((
1BV
r
BVrROCEExpected
BV
P
n
tt
tt

If firm can generate excess returns forever, n → ∞ infinity,
gr
rROCEExpected
BV
P t
1
0
0 1

P-BV Ratio
• A function of• The expected level of profitability relative to the
required rate of return• Growth in the book value of common
shareholders’ equity– Growth in book value is a function of
– Earnings generated each period in excess of dividends paid plus additional capital contributions by shareholders

Example
Earnings = 700Cost of Equity Capital = 0.14t0 = $4,375
Expected ROCEt=1 = 16% = 700/4,375
Assume ROCEt=2 = 15% and thereafter is 14%, then
P0 = $4,375 + (0.16-0.14)(4,375)/(1.14)1 + (0.15-0.14)*
(4,375+700)/(1.14)2
= $4,375 + $76.75 + $39.05 = $4,490.80
The P-BV Ratio at t0 =
P0/BV0 =1 + (76.75+39.05)/4,375
= 1+ 0.0265 = 1.0265
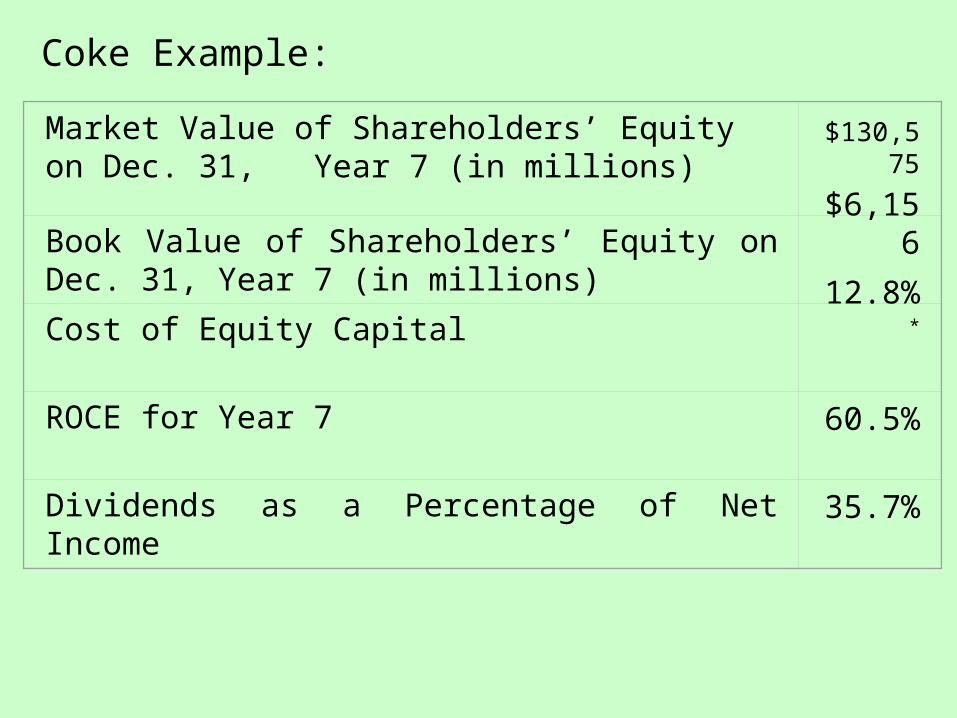
Coke Example:
Market Value of Shareholders’ Equity on Dec. 31, Year 7 (in millions) $130,575
Book Value of Shareholders’ Equity on Dec. 31, Year 7 (in millions)
$6,156
Cost of Equity Capital 12.8%*
ROCE for Year 7 60.5%
Dividends as a Percentage of Net Income 35.7%

Assume that Coke is expected to generate an ROCE of 60.5% for five years, and then the ROCE reverts to 12.8%. The P-BV ratio is calculated as follows:
= 1 + [(2603 + 3206 + 3947 + 4861 +5989)/ 6156 = 4.437
156,6$
)128.1(
)042,25)($128.0605.0(
)128.1(
)498,16)($128.0605.0(
)128.1(
)877,11)($128.0605.0(
)128.1(
)551,8)($128.0605.0(
)128.1(
)156,6)($128.0605.0(
1
5
43
21
BV
P

Shareholders’ Equity grows each year by the amount of earnings and decreases by the amount of dividends. For example, the calculation of shareholders’ equity at the end of Year 8 is as follows: Shareholders’ Equity, Dec 31 Year 7 $6,156Net Income for Year 8: 0.605 × $6,156 3,724Less Dividends: 0.357 × $3,724 (1,329)Shareholders Equity, Dec 31 Year 8 $8,551
The actual P-BV ratio = 21.2 = $130,575/$6,156

Differences between Actual and Theoretical Levels of P-BV ratios
• Errors in estimating the level or sustainability of ROCE
• Errors in measuring the cost of equity capital• Errors in measuring the growth in common
shareholders’ equity• Using an actual ROCE that includes transitory
earnings• Using an actual ROCE that incorporates biases
caused by alternative accounting principles

Using P/E ratios and P/BV ratios of Comparable Firms: •Analysts can use •P-E and P-BV ratios of comparable firms •to assess the corresponding ratios of publicly traded firms.

Valuation Approaches:
1. PV of projected cash flows. 2. a). Price – earnings ratios using theoretical models. b). Multiples for comparable companies. 3. a). P-BV ratios using theoretical models. b). Multiples for comparable companies.