
Epic research malaysia daily klse report for 21st august 2015

EARNINGS ANNOUNCEMENTS OF KLSE STOCKS:
IMPACT OF TYPE OF NEWS, FIRM SIZE, AND
OWNERSHIP STRUCTURE ON
PRICE BEHAVIOR
by
CHEAH WENG HONG
Research report in partial fulfillment of the requirements for the degree of
Master of Business Administration
May 2003

ii
ACKNOWLEDGEMENTS
It is with a deep sense of gratitude that I wish to acknowledge Dr. Zamri Ahmad for
his invaluable guidance and dedication toward completion of this research project. I
also wish to thank my family for their enduring acceptance and patient support during
the course of my study. Lastly, I am also indebted to fellow colleagues from my
company and fellow MBA classmates from the university who provided much needed
support.

iii
TABLE OF CONTENTS
Page
ACKNOWLEDGEMENTS ii
TABLE OF CONTENTS iii
LIST OF TABLES vii
LIST OF FIGURES viii
ABSTRAK ix
ABSTRACT x
Chapter 1: INTRODUCTION 1
1.1 Introduction 1
1.2 KLSE Overview 1
1.3 Problem Statement 2
1.4 Research Objective and Research Questions 3
1.5 Significance of the Study 4
1.6 Organization of the Report 5
Chapter 2: LITERATURE REVIEW 6
2.1 Introduction 6
2.2 Efficient Market Hypothesis 6
2.3 Earnings Announcements and Competing Information 8
2.4 Earnings Announcements and Trading Price and Volume
Change 8
2.5 Earnings Announcements and Type of News 10

iv
2.6 Earnings Announcements and Firm Size 11
2.7 Earnings Announcements and Institutional Ownership 12
2.8 Earnings Announcements and Foreign Ownership 13
2.9 Summary 14
Chapter 3: METHODOLOGY 16
3.1 Introduction 16
3.2 Overview of Event Study 16
3.3 Research Methodology 17
3.4 Research Framework 21
3.5 Adjustment for Thin Trading 22
3.6 Unit of Analysis and Sampling Design 22
3.7 Variables 23
3.7.1 Type of News 23
3.7.2 Firm Size 24
3.7.3 Level of Institutional Ownership 24
3.7.4 Level of Foreign Ownership 25
3.8 Hypotheses 27
3.9 Data Set and Data Collection Procedures 30
3.10 Analytical Methods 32
Chapter 4: RESULTS 34
4.1 Introduction 34
4.2 Good News versus Bad News 34
4.3 Main Board versus Second Board 36

v
4.4 Level of Institutional Ownership 38
4.5 Level of Foreign Ownership 39
4.6 Summary of the Findings 40
Chapter 5: DISCUSSION AND CONCLUSION 43
5.1 Introduction 43
5.2 Recapitulation 43
5.3 Summary of Results and Comparison with the Findings of
Other Researches 44
5.3.1 Summary of Results 44
5.3.2 Type of News 44
5.3.3 Firm Size 45
5.3.4 Level of Institutional Ownership 46
5.3.5 Level of Foreign Ownership 46
5.3.6 Post Earnings Announcements and market
efficiency 47
5.4 Implications of the Study 48
5.5 Limitations of the Study 48
5.6 Directions for Future Research 50
5.7 Conclusion 50
REFERENCES 52
APPENDICES 55
Appendix 1 Sampled Firms with AAR 55

vi
Appendix 2 AAR by Event Date 65
Appendix 3 CAR by Event Date 67
Appendix 4 Descriptive Statistics 69
Appendix 5 Normality Tests 71
Appendix 6 Mann-Whitney Tests 75
Appendix 7 Wilcoxon Sign Ranked Test – AAR 78
Appendix 8 Wilcoxon Sign Ranked Test – CAR 80

vii
LIST OF TABLES
Table 3.1 Main Board and Second Board Capitalization 24
Table 3.2 Classification of Main Board and Second Board by Sector 31
Table 4.1 Type of News – AAR Price Behavior 34
Table 4.2 Type of News – AAR Post Earnings Announcements 35
Table 4.3 Type of News – CAR Post Earnings Announcements 35
Table 4.4 Firm Size – AAR Price Behavior 36
Table 4.5 Firm Size – AAR Post Earnings Announcements 37
Table 4.6 Firm Size – CAR Post Earnings Announcements 37
Table 4.7 Institutional Ownership – AAR Price 38
Table 4.8 Institutional Ownership – AAR Post Earnings Announcements 38
Table 4.9 Institutional Ownership – CAR Post Earnings Announcements 39
Table 4.10 Foreign Ownership – AAR Price 39
Table 4.11 Foreign Ownership – AAR Post Earnings Announcements 40
Table 4.12 Foreign Ownership – CAR Post Earnings Announcements 40
Table 4.13 Summary of Price Behavior Statistics 41
Table 4.14 Summary of AAR Post Earnings Announcements Statistics 41
Table 4.15 Summary of CAR Post Earnings Announcements Statistics 42

viii
LIST OF FIGURES
Figure 3.1 Model of positive earnings announcements 18
Figure 3.2 Model of negative earnings announcements 19
Figure 3.3 Model of Event Study 21
Figure 3.4 Shareholders by Type of Investor 25
Figure 3.5 Equity Held by Type of Investor 25
Figure 3.6 Shareholders by Nationality 26
Figure 3.7 Equity Held by Nationality 26
Figure 4.1 Main Board – Good News vs Bad News CAR 35
Figure 4.2 Second Board – Good News vs Bad News CAR 36
Figure 4.3 Good News – Main Board vs Second Board CAR 37
Figure 4.4 Bad News – Main Board vs Second Board CAR 38
Figure 4.5 Institutional Ownership CAR 39
Figure 4.6 Foreign Ownership CAR 40

ix
ABSTRAK
Kertas ini mengkaji faktor-faktor yang menpengaruhi perubahan harga saham
semasa pengumuman hasil pendapatan syarikat-syarikat tempatan. Tambahan pula,
kecekapan pasaran saham juga diselidiki selepas pengumuman hasil pendapatan
dibuat. Penyesuaian Beta dengan model Dimson dilakukan untuk mengurangkan
kesan kepincangan (bias) dagangan tipis. Faktor-faktor yang diselidiki termasuk jenis
berita yang dilaporkan semasa pengumuman, saiz syarikat, hakmilik institusi, dan
hakmilik pelabur asing. Dari empat faktor yang dikaji, hanya faktor hakmilik pelabur
asing didapati mempunyai kesan yang penting. Keputusan analisa ini menunjukkan
bahawa peratus hakmilik pelabur asing yang rendah boleh mengakibatkan perubahan
tinggi pada harga saham jika dibandingkan dengan peratus hakmilik pelabur asing
yang tinggi. Keputusan yang didapati ini adalah selaras dengan keputusan yang
diperolehi pengkaji yang lain seperti Chung dan Lee (1998) dan Su (2002). Saiz
syarikat didapati hanya mempengaruhi sedikit perubahan harga saham. Faktor-faktor
yang selainnya tidak mempunyai sebarang pengaruh terhadap perubahan harga saham.
Jika kecekapan pasaran saham dikaji, didapati kebanyakan paras AAR selepas hasil
pendapatan pengumuman dibuat tidak terdapat kesan yang penting terhadap
perubahan harga saham. Ini bermakna pasaran saham tempatan agak cekap dalam
bentuk “semi-strong” ketika pengumuman pendapatan hasil dibuat. Akan tetapi
terdapat perubahan yang nyata didalam hipotesis yang melibatkan CAR hasil
keuntungan selepas pengumuman dibuat.

x
ABSTRACT
This paper studies the impact of factors in affecting the price behavior of the
local stock market during earnings announcements. In addition, the market efficiency
during post-earnings announcements is also studied. Appropriate adjustments to
mitigate possible effects of thin trading bias are carried out using Dimson method.
The factors investigated included type of news, firm size, level of institutional
ownership, and level of foreign ownership. Out of these 4 factors studied only one
factor, the level of foreign ownership show significant findings. The findings show
that low-level foreign ownership firms have higher price change compared to high-
level foreign ownership. These findings are consistent with findings from other
researchers such as Chung and Lee (1998) and Su (2002). Firm size has marginal
significant findings. As for the other 2 factors, the findings are not significant. In the
area of testing market efficiency, most levels of AAR post earnings announcements
show insignificant results. This means that the local market is quite efficient in the
semi-strong form with regards to earnings announcements. However, this is in
contrast with all the hypotheses involved in CAR post earnings announcements,
which showed significant drifts.

1
Chapter 1
INTRODUCTION
1.1 Introduction
Often we read about how information such as earnings announcements affects
stock price in the stock market. In addition to price behavior, market efficiency also
comes into play since information is being processed and disseminated during
earnings announcements. A lot of studies have been done by foreign researches such
as Atiase (1985), Cheung and Sami (2000), Chung and Lee (1998), Cready (1988),
Defeo (1986), Morse (1981) and Kim and Verrecchia (1991) on the effect of earnings
announcements on price behavior. Additionally, researches done by Kross and
Schroeder (1984), Freeman (1987), Riahi-Belkaoui (2002) and Utama and Cready
(1997) looked into other factors that work in conjunction with earnings
announcements to affect the price behavior of stocks. These factors include the type
of news, either “good news” or “bad news” elicited from the announcements, size of
the firms and ownership structure. Ownership structure can be further divided into
level of institutional and foreign ownership of firms.
1.2 KLSE Overview
June 6, 1964 saw the birth of the Stock Exchange of Malaysia following the
formation of Malaysia in 1963. It was renamed the Stock Exchange of Malaysia and
Singapore after the pullout of Singapore from the federation of Malaysia in August
1965. In May 1973, the currency interchangeability arrangement between Malaysia
and Singapore was dissolved. This led to the formation of a separate Malaysian stock
exchange called the Kuala Lumpur Stock Exchange Berhad on July 2, 1973. On

2
December 27, 1976, a new company called the Kuala Lumpur Stock Exchange
(KLSE) took over the functions of the Kuala Lumpur Stock Exchange Berhad.
KLSE provides trading facilities for common equities, preferred stocks,
Malaysian government securities, corporate debt securities, and transferable
subscription rights and warrants. For companies seeking a listing on the Main Board,
the pre-requisites for admission include a minimum paid-up capital of RM60 million,
comprising ordinary shares of RM1 each. The Second Board was launched in
November 1988 with the aim of allowing small and medium sized companies with
good growth prospects to raise funds from the capital market. It is relatively small
compared to the Main Board. Listing requirements for Second Board are essentially
the same as Main Board. However, the paid-up capital of a company should be at
least RM40 million, comprising ordinary shares of RM1 each. All companies listed on
the Second Board are categorized into 7 sectors, namely, technology, consumer
products, industrial products, construction, trading services, plantations and
properties. In addition to these 7 sectors, Main Board companies can be further
categorized into 6 more sectors, namely, finance, hotel, IPC, mining, trusts and
closed-end funds. For the purpose of this study, Main Board firms are considered as
large firms whereas Second Board firms are considered as small firms.
1.3 Problem Statement
Locally, there is relatively no earnings research done using these factors.
Local research done by Annuar, Ariff and Shamsher (1993) and Au (2000)
investigated the impact of only earnings announcements on price and market
efficiency. As a result, there is a need and motivation to do a more comprehensive
study, which encompasses other variables such as type of news, firm size and

3
ownership structure. This study is undertaken to investigate the effect of these
additional four factors on the price behavior of stocks in the Kuala Lumpur Stock
Exchange (KLSE) during annual earnings announcements. The theory used in this
study is in line with the Market Efficient Hypothesis, which states that information
dissemination and interpretation is crucial but unobservable in the stock market.
Earnings announcements belong to the semi-strong form of the Market Efficient
Hypothesis. As such, this study focuses on the semi-strong form of the hypothesis that
states that all publicly available information regarding the prospects of a company
must be reflected in the stock price.
1.4 Research Objective and Research Questions
The main objective of this study is to investigate the effect of type of news,
firm size and ownership structure on the price behavior during earnings
announcements in the Kuala Lumpur Stock Exchange. But since data for studying
market efficiency is generated too, this study will also look at market efficiency.
However, for market efficiency, the focus will only be on the post earnings
announcements time frame so as to limit the scope of this paper. An attempt will be
made to answer the following research questions, specifically:
1. What is the difference in price behavior and market efficiency between “good
news” announcements and “bad news” announcements?
2. What is the impact of firm size on price behavior and market efficiency? Is the
magnitude of abnormal return higher for small (Second Board) firms than
large (Main Board) firms?
3. What is the impact of the level of institutional ownership on price behavior
and market efficiency?

4
4. Is level of foreign ownership a critical factor in affecting price behavior and
market efficiency during earnings announcements?
1.5 Significance of the Study
Stock investment is always considered an important investment opportunity in
the financial markets. All investors whether they are individuals or institutions such as
unit trust funds are always interested in the price behavior and hence the performance
of the stock markets. In fact, for some of them, their well-being and livelihood
depends on how well they are able to decipher and understand the stock markets
movements. This paper is designed to evaluate how information affects the price
behavior of the local stock market. In particular, this study looks at how the type of
news announcements, firm size and ownership structure play a role as well in
affecting price behavior during earnings announcements. In addition, this paper also
investigates the market efficiency of the stock using the four factors mentioned above
during earnings announcements.
A study of this nature is useful in several aspects. According to Defeo (1986),
this line of study provides a benchmark to researchers interested in examining price
adjustments to events. Second, it contributes to the development of an understanding
of the meaning of the term “rapid adjustment” as it is applied to describe an
informationally efficient market. Lastly, it provides evidence, which is useful in
understanding those factors that motivate traders to seek information and influence
the way they respond to it, in aggregate. The findings of this study will help investors
to make better decisions in equity investments. In addition, listed companies will
benefit, as they will be more prepared in anticipation of price behavior following

5
annual earnings announcements. On the whole, this study will enhance the
understanding of the role information played in the local stock market.
1.6 Organization of the Report
The chapters of this study are organized as follows. Chapter 1 provides the
background of KLSE in Malaysia and states the objectives and organization of the
study. Chapter 2 reviews the empirical evidence of stock performance as reported in
previous research. Chapter 3 describes the theoretical framework and methodology of
this study and hypotheses to be tested. It also describes the statistical procedures
employed in this study and explains the data, the sample and the period of study.
Chapter 4 reports the results and findings of the statistical tests and the summary.
Finally, Chapter 5 gives the conclusion, implication, limitations and recommendations
of the study.

6
Chapter 2
LITERATURE REVIEW
2.1 Introduction
This chapter begins by reviewing the efficient market hypothesis since the
whole idea of this study is concerned about how information in earnings
announcements affects the price behavior of the stock market. The relevancy and
usefulness of earnings announcements as a source of information for investors is also
explored. This exploration is critical because if information from earnings
announcements is found to be not relevant or useful to investors then this study will
not be valid at all. Next, reviews will be done on all those selected factors that interact
with earnings announcements in affecting price behavior and market efficiency.
2.2 Efficient Market Hypothesis
The global financial markets are highly competitive. This means that alert
investors are always on the look out for superior investment opportunities in the
securities markets. These investors will bid up the price of superior security until its
expected return is equivalent to other investments with similar risks. Similarly,
inferior investments that are expected to generate below-average returns will be sold
until their prices decline enough to again yield acceptable returns. Security prices will
be adjusted to their perceived worth quickly so long as investors believe that they can
earn above-average returns by buying under-priced securities and selling over-priced
ones. These rapid transactions of securities ensure that the financial markets are
always in a state of high competitiveness. The idea that securities already reflect all
available information is referred to as the efficient market hypothesis (EMH).

7
Fama (1970) had done an extensive study on the efficient market hypothesis.
In his paper, he reviewed three relevant information subsets of EMH: the weak, semi
strong and strong forms of the hypothesis. The weak-form hypothesis asserts that
stock prices already reflect all information that can be derived by examining market
trading data such as history of past prices or trading volume. These trading data are
publicly available and virtually free to get. The semi-strong form hypothesis states
that all publicly available information regarding the prospects of a company must be
reflected already in the stock price. These information includes past prices, data on
the company’s product line, quality of management, balance sheet composition,
patents held, earning forecasts, earning announcements, and accounting practices.
Again, all these information is almost free to obtain. The strong form is a quite
extreme version of EMH. This hypothesis is concerned with whether individual
investors or groups have monopolistic access to any information relevant for price
formation. Hence, in efficient market hypothesis, information dissemination and
interpretation are crucial albeit complex and unobservable in most of the times.
At the local stock market, Annuar, Ariff and Shamsher (1993) investigated the
semi-strong form efficiency on the Kuala Lumpur Stock Exchange. They studied the
effect of annual earnings and dividend announcements on stock prices. As a result of
their study, they found that the market anticipates the information content of annual
earnings and dividend announcements well before the official announcement. After
the announcement, the abnormal returns for earnings and dividend announcements are
not significant. Their findings are consistent with semi-strong market efficiency.

8
2.3 Earnings Announcements and Competing Information
In their study, Lev and Zarowin (1999) expressed concerns that financial
reporting has lost much of its usefulness for investment decisions. According to them,
one of the reasons contributing to this alleged decline in usefulness is attributed to the
increasing rate and impact of business change and the inadequate accounting
treatment of change and its consequences. As an example, they observed that the large
investments that generally drive change, such as Research and Development
expenditures, are immediately expensed, while the benefits of change are recorded
later and not matched with the previously expensed investments. Another reason for
this usefulness decline is attributed to the increases in competing sources of firm- and
industry-specific information (e.g., growth in the security analyst industry). But
another study done by Francis and Schipper (1999) on whether financial statements
have lost their relevancy found that the results were mixed and inconclusive.
The above findings motivated Francis, Schipper and Vincent (2002) to
examine whether the news in analyst reports pre-empts, or substitutes for, the news in
earnings announcements. They found that investors’ reactions to analyst reports and
to earnings announcements are negatively related as would be expected if the two
were substitutes. That is, their results provide little support for the view that the
informativeness of earnings announcements is eroded by competing information in
the form of analyst reports. Hence, their results suggest that the usefulness of earnings
announcements as a source of information for investors cannot be ignored.
2.4 Earnings Announcements and Trading Price and Volume Change
Trading price and volume change are inextricably tied together when ones
looked at the stock market. According to Bamber (1986), security prices reflect an

9
averaging of investors’ belief whereas trading volume reflects investors’ activity by
summing all market trades. Hence, a brief review of trading volume is necessary.
Morse (1981) investigated price changes and trading volume during the days
surrounding the announcement of quarterly and annual earnings in the Wall Street
Journal (WSJ). He found that the most significant price changes and excess trading
volume occurred the day prior to and the day of the WSJ announcement. The results
suggested a lack of activity in the stock market in anticipation of the earnings
announcements. Cheung and Sami (2000) replicated Morse (1981) study and found
that their results support his findings. By studying firms listed in the Hong Kong
Stock Exchange, they found that there are significant price changes during the four
days from the date of announcement to three days after the announcement. Also, there
is large volume reaction during the four days from day one before the date of
announcement to day two after the announcement.
Verrecchia (1981) showed that the degree of volume reaction to new
information could not be used to infer correctly the extent of agreement among
investors about how information should be interpreted. In particular, the degree of
volume reaction in conjunction with the degree of price change does not tell us
anything about the extent to which investors would revise their expectations given the
new information. He suggested that greater volume reaction might mean that the
information has resulted in a greater shift in expectations than less volume reaction.
Further studies in trading volume and price reactions to public announcements
were done by Kim and Verrecchia (1991). They found that the price change at the
time of the announcement is proportional to both the unexpected portion of the
announcement and its relative importance across posterior beliefs of traders. Also,
studies done by Utama and Cready (1997), Eilifsen, Knivsfla and Saettem (2001), and

10
Isakov and Perigno (2001) showed that there is significant decrease in stock price
volatility in the post-announcement period relative to the pre-announcement period.
This implies that information is being disseminated and processed during the pre-
announcement period. However, in this paper the focus will only be on the price
behavior. The study of the impact of earnings announcements on trading volume will
not be investigated as time limitation prevents the study of this enlarged scope of
works.
2.5 Earnings Announcements and Type of News
Ball and Brown (1968) found that a significant portion of the information
revealed through earnings announcements is reflected in security prices prior to the
report month. Kross and Schroeder (1984) examined both the association between
quarterly announcement timing (early or late) and the type of news (good or bad)
reported, and the relationship between stock returns and timing around the earnings
announcement dates. Their results showed that early quarterly earnings
announcements contain better news and are associated with larger abnormal returns
relative to late announcements for both large and small firms. This also implies that
stock prices respond positively to announcements of increase in earnings and
negatively to announcements of decrease in earnings. Nofsinger (1997) investigated
the trading behavior of institutional and individual investors around news releases. He
found that institutions conducted high abnormal buy and sell volume around both
good and bad firm-specific news releases. However, individual investors engaged
high abnormal trading only around good news. He suggested that bad news travels
more slowly than good news.

11
2.6 Earnings Announcements and Firms Size
Grant (1980) found that traded Over The Counter (OTC) firms, which are
smaller, have greater price reactions to accounting reports than do New York Stock
Exchange (NYSE) firms. Oppong (1980) investigated the information content of
annual earnings announcements. He postulated that information is also available in
other sources beside annual earnings announcements. He also hypothesized that large
firms are generally associated with greater flow of additional information, which may
preempt annual reports. Atiase (1985) found that the degree of unexpected security
price changes in response to earnings reports is inversely related to the capitalized
value (size) of the firms. This implies that the returns of small firms during
announcement periods are on average more variable than the announcement-period
returns of large firms. That is, for a given level of unexpected earnings, the
cumulative abnormal returns of small firms exceed those of large firms. Freeman
(1987) supported Atiase’s findings. In addition, he also showed that security prices of
large firms anticipate accounting earnings earlier than those of small firms. This could
be due to large firms having more resources at their disposal to gather or predict
earnings earlier than small firms.
Defeo (1986) investigated the duration of price adjustments to earnings
announcements relative to other potential sources of variations across firms and time.
One of the variations was firm size. He found that, when the market response was
defined as a change in the mean of the distribution of returns, the response period was
longer and began earlier for larger firms. This is in line with Freeman (1987) findings.
Eilifsen, Knivsfla and Saettem (2001) found that there is a significant decline
in the noise term for the largest companies after the earnings release date, supporting
the hypothesis that earnings announcements reduce informational asymmetries among

12
investors. Asthana and Mishra (2001) went a step further by examining the effects of
the sizes of the announcing and non-announcing firms on information transfers. They
hypothesized that the information transfer is positively related to the announcing firm
size. One implication of their hypothesis is that abnormal price reactions of large
firms around earnings announcements are more likely due to information about
overall trends in the economy and industry sector. Hence, the disclosures by large
firms should contain more relevant information for non-announcing firms in the same
industry and thereby cause more information transfers than small firms. Their
empirical results supported this hypothesis. Norfsinger (2001) investigated on the
trading behavior around macro-economic announcements and tested on the lead/lag
relationship between large and small firms. He found evidence to show that investors
reacted quickly to both good or bad news by buying large firms and not small firms.
This implied that small firms returns lagged large firm returns during both up markets
and down markets.
2.7 Earnings Announcements and Institutional Ownership
Potter (1992) examined the relation between the level of institutional investor
ownership and the magnitude of security price variability at quarterly earnings
announcement dates. He found that the degree of price variability at quarterly
announcement dates increases with the level of institutional investor ownership. This
result is consistent with the view that a concentration of institutional investor
ownership reduces the informativeness of prices prior to an earnings announcement.
This means that firms with high level of institutional ownership potentially have more
resources to process and analyze information at an earlier stage. These firms typically
do not have to wait for the earnings announcements for information. With earlier

13
access to information, they can make investment decisions earlier than the earnings
announcements dates. Later findings by Utama and Cready (1997) showed that
volume response as a function of institutional ownership is quadratic with quadratic
curve reaches a maximum at around 50 percent institutional ownership. Nofsinger
(1997) found that high-level institutional firms reduce informativeness of prices prior
to an earnings announcement due to the fact that they can access to information
earlier. Due to this, it is expected that price changes would be less around earnings
announcements.
2.8 Earnings Announcements and Foreign Ownership
Riahi-Belkaoui (2002) examined the relationship between the observed post-
announcement drift in stock prices and the level of multinationality. He found that
post-earnings-announcement drift was negatively related to the level of foreign
ownership given that the firm size is controlled. This implies that firms with high
level of foreign ownership tend to have more capability in processing information
during post-earnings-announcement. The level of foreign ownership is synonymous
with how wealthy the firms are or how much resources they have in information
gathering and processing. This is in line with Cready (1988) findings that stated the
wealth of market participants is a determinant of the speed and duration of the
market’s response of information. He suggested that firms characterized by high-
wealth investors should be associated with speedier responses to information releases
than firms characterized by low-wealth investors. Again all these could be attributed
to the more resources these firms have in gathering and processing information.
Su (2002) investigated the stock price reactions to earnings announcements in
the China markets. He found that domestic A-share investors did not correctly

14
anticipate price changes and did not adjust to the new earnings information very
rapidly in the markets. He offered a couple of reasons for these findings. Government
officials and managers may be involved in inside trading of A-shares. Also, most A-
share investors are short-term traders who speculate based on sentimental factors.
However, international B-share investors seem to be able to predict price changes
better and hence, not much abnormal announcement-day effect were observed.
Chung and Lee (1998) investigated the ownership structure and trading
volume reaction to earnings announcements in Japan. Three types of shareholders
were identified. They were corporate stockholders, foreign investors and ordinary
domestic investors. They found that volume reaction increases with the fraction of
shares held by foreign investors. This means that foreign investors trade more on
current information and are more responsive to earnings announcements than
domestic investors. This can be partly explained by the fact that foreign investors are
large institutional investors that react more strongly and more quickly to earnings
announcements than small investors.
2.9 Summary
Despite the tremendous amount of information generated by the stock market
community, information content of earnings announcements is still useful for
investment decisions as found by Francis, Schipper and Vincent (2002). Other studies
done by foreign researchers showed that factors such as type of news, firm size, level
of institutional ownership and level of foreign ownership work in conjunction with
earnings announcements in affecting the price behavior and market efficiency of the
foreign stock market. Kross and Schroeder (1984) showed that stock prices react
positively to “good news” announcements and negatively to “bad news”

15
announcements. This is to be expected intuitively since investors are profit-inclined.
The other three factors, that is firm size, level of institutional ownership and level of
foreign ownership have more to do with the wealth of the firms. Large firm, high
level of institutional ownership and high level of foreign ownership translates into
more wealth and hence more resources at their disposal in gathering, processing and
analyzing firm-specific information.

16
Chapter 3
METHODOLOGY
3.1 Introduction
This chapter begins by giving a brief description about event study that leads
to the foundation used in the development of the performance measures. It is divided
into 10 sections. Section 2 gives an overview of event study and the adoption of the
market model for this study. Section 3 and 4 discusses the methodology and
framework used in this study. Section 5 discusses about the adjustment of thin trading
since KLSE is relative thinly traded. Section 6 and 7 describe the variables used in the
study. Section 8 outlines the hypotheses used in the study. Section 9 describes the data
set and data collection procedure. Lastly, Section 10 outlines the tests used in this
study.
3.2 Overview of Event Study
Event study is an important methodological approach to market-based
empirical research in finance and accounting. It is also known as residual analysis and
abnormal performance index test. This study involves the analysis of security price
behavior around the time of disclosure of firm-specific events. In this study, the firm
annual earnings announcement date is the firm-specific event. According to Bowman
(1982), there are four basic types of event studies.
1. Information content
2. Market efficiency
3. Model evaluation
4. Metric explanation

17
The information content of an event is studied by analysis of security price
behavior up to and concurrent with the event. Market efficiency goes one step further.
It involves analysis of security price behavior subsequent to the event. The other two
types, namely model evaluation and metric explanation are generally concurrent with
an information content study. The type of event study used in this paper is the market
efficiency test since this study investigates the security price changes around the
earnings announcements dates.
3.3 Research Methodology
The design and methodology used in this paper was adopted from study done
by Bowman (1982). Five steps involved were:
1. The event of interest was identified. As mentioned earlier, this study looked at
the annual earnings announcements of KLSE firms. The calendar date of the
announcements became time zero in event time. All time periods were
described in event time relative to the zero time when the event occurred.
2. The security price reaction was modeled. For studies involving earnings
announcements, one expected the direction of the security price reaction to the
event to differ across firms and to be conditional upon information relevant to
the event. Hence, one could hypothesize the null hypothesis as follows:
0),|( itit yeE
where
e it = measure of abnormal returns for firm i in time period t
= expectations model
y it = information from for firm i and time t.
18
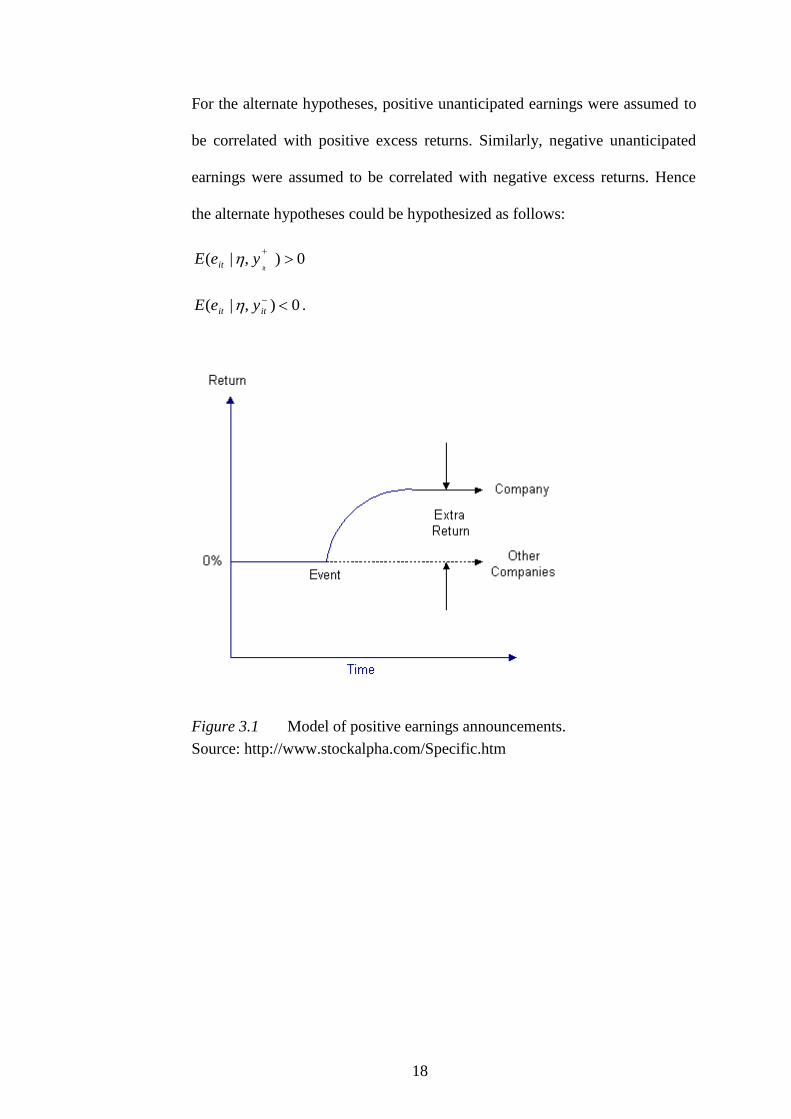
For the alternate hypotheses, positive unanticipated earnings were assumed to
be correlated with positive excess returns. Similarly, negative unanticipated
earnings were assumed to be correlated with negative excess returns. Hence
the alternate hypotheses could be hypothesized as follows:
0),|(
ityeE it
0),|(
itit yeE .
Figure 3.1 Model of positive earnings announcements.
Source: http://www.stockalpha.com/Specific.htm

19
Figure 3.2 Model of negative earnings announcements.
Source: http://www.stockalpha.com/Specific.htm
3. The abnormal returns were estimated. There were many estimation methods
available such as the unadjusted or mean adjusted returns, risk adjusted returns
and risk controlled portfolio returns. The risk-adjusted methodologies were
more universally used as seen in studies by Eilifsen, Knivsfla and Saettem
(2001) and Asthana and Mishra (2001). Hence, this method was adopted in
this study. The most common of this method was the market model where its
parameters iα and iβ were estimated using daily returns from a certain number
of trading days preceding the event window. The market model used in this
paper was defined as follows:
R it = iα + iβ R mt + e it
where
R it = return on security i in period t
R mt = return on the market portfolio in period t
iα and iβ = constants for security i

20
e it = disturbance term (residual)
The parameters of the model were estimated using ordinary least squares
regression and then used to calculate the residuals
e it = R it – ( iα + iβ R mt )
which, were assumed to have the properties that its expected value or mean is
zero and its variance is constant.
E(e it ) = 0
(e it , e jt ) = 0 i j
Since the expected value of the residuals was zero, any non-zero value of the
residuals was termed the abnormal return.
4. The abnormal returns were organized and grouped. They were averaged to get
the Average Abnormal Returns (AAR). The next step was the accumulation
over time to capture the aggregate abnormal return behaviors. There were two
principle aggregation methods, namely Cumulative Abnormal Returns (CAR)
and Abnormal Performance Index (API). In this paper, the CAR method,
which is simply the sum of all abnormal returns over the time period of
interest, was used. A number of researchers (Au, 2000; Freeman, 1986 and Su,
2002) used the CAR method. CAR captures the total firm-specific stock
movement for an entire period when the market might be responding to new
information. AAR and CAR were computed as follows:
AAR t = N
1
N
i
ite1
CAR t =
Kt
Kt
tAAR
where

21
e it = excess return for firm I in period t
N = number of firms in the portfolio
t = number of time periods being aggregated.
5. The results were analyzed. The final step was to analyze and interpret the
results.
3.4 Research Framework
Utama and Cready (1997) used 250 days for the estimating period while
Cheung and Sami (2000) used 120 days. As such, no specific number of days were
specified in research literatures but logically, the longer this estimating period is the
more accurate is the estimated iα and iβ . In this study, 500 trading days was used for
this estimating period. Longer than 500 days was not recommended, as the estimating
period would fall into the time frame when Malaysia economic structural breakdown
occurred in the 1997 since the announcements dates selected for this paper were from
year 2000 to 2002. A test period of 31 days, that is, –15 trading days to +15 trading
days from the event date or announcement date was chosen as used in Cheung and
Sami (2000) study. Too narrow a test period might lead to price behavior changes not
be observed. Conversely, too long a period might lead to additional confounding
effects from other events.
Figure 3.3 Model of Event Study.
Source: Atiase (1985) and Strong (1989)

22
3.5 Adjustment for Thin Trading
Thin trading was an issue with the local relatively small stock market. Strong
(1989) found that thinly traded shares have a beta estimate that is biased downwards,
while for frequently traded shares the bias is upwards. The biased beta estimates
would potentially give biased estimates of abnormal returns and hence affect the
accuracy of the test statistics. There are a number of methods for correcting this bias,
namely Scholes – William (SW) beta estimator and Dimson Aggregate Coefficients
(DAC) estimator. Dyckman, Philbrick, and Stephan (1984) found that both SW and
DAC procedures yield reduced biases in ordinary least square estimates of beta. In
this study, DAC method was adopted, as the DAC method does not require that a
trade to take place in every return interval as happened in some of local listed firms.
Also, Annuar, Ariff and Shamsher (1993) used this method in their research. The
main purpose of adopting DAC method in this study was to alleviate thin trading bias
in the relatively small KLSE stock market. The DAC formula is as follows:
Dβ =
n
nk
kβ
where k = -n, …,0, …,n,
kβ are estimates of the slope coefficients in a multiple regression of the return on the
security in period t against the return on the market in periods t - n, …,o, …,t + n.
Dimson used this method with k = -1, …, 5. Similarly, this paper would use k = -1, 0,
1, 2, 3, 4, 5.
3.6 Unit of Analysis and Sampling Design
AAR (Average Abnormal Return) and Cumulative Abnormal Return (CAR)
of individual firm at specific annual earnings announcements date were used as the

23
units of analysis. AAR was used for 2-level statistical testing. CAR was used for
plotting charts. Both were used in the post earnings announcements statistical testing.
For hypotheses 1 and 2, a sampled firm from either Main Board or Second Board
could have a range of up to 3 annual earnings announcements dates from year 2000,
2001,and 2002. That is, each firm could have up to 3 AAR values. But for hypotheses
3 and 4, whereby ownership structure information was only available in KLSE
Annual Handbook 2000, each sampled firm would only have 1 AAR value.
Convenience sampling was used in this study. In fact, due to the fragmented nature in
KLSE data, as long as a unit of analysis contained all the relevant information used in
this study, that unit was included in the sample.
3.7 Variables
The 4 factors selected for this study are type of news, firm size, level of
institutional ownership, and level of foreign ownership.
3.7.1 Type of news
The type of news could be either “good news” or “bad news” during
the earnings announcements. An increase in earning per share or a decrease in
loss per share as compared to previous year performance denoted good news
for the firms. In contrast, a decrease in earning per share or an increase in loss
per share as compared to previous year performance denoted bad news for the
firms. Information about type of news was found in the annual earnings
reports of all firms. The above definition of “good news” and “bad news”
implicitly assume that previous year earning is the best predictor of this year

24
earning. In fact, this is the most naïve model (random walk model of earning
forecast) of earning forecast.
3.7.2 Firm Size
Firm size referred to the degree of market capitalization of the firm. In
this study, Main Board firms were used as proxy for large firms. Similarly,
Second Board firms were used as proxy for small firms.
Table 3.1
Main Board and Second Board Capitalization
Source: KLSE Statistics (2001)
3.7.3 Level of Institutional Ownership
This ownership structure referred to the percentage of outstanding
shares held by institutional investors at earnings announcement dates. In this
study, those firms with 15% or less of total shares owned by institutions were
classified as low-level institutional ownership. Those firms with 45% or
higher were classified as having high-level institutional ownership. These
figures were selected to represent extreme levels of institutional ownership
conveniently available. This information was found in the KLSE Annual
Handbook. Below is the profile of institutional ownership among KLSE firms.
As can be seen from the figures below, institutional investors made up only
about 3% of the total shareholders, yet they took up 43% of the total equity.
No breakdown in institutional ownership by local and foreign shareholder was
available.


