Early childhood obesity prevention efforts through a life ...
24
RESEARCH ARTICLE Early childhood obesity prevention efforts through a life course health development perspective: A scoping review Sheri Volger ID *, Diane Rigassio Radler, Pamela Rothpletz-Puglia Department of Clinical and Preventive Nutrition Sciences, School of Health Professions, Biomedical and Health Sciences, Rutgers University, Newark, New Jersey, United States of America * [email protected] Abstract Introduction The obesity rate in preschool children in the United States (US) is 13.9%, while even higher rates are associated with racial and ethnic minorities and children from low-income families. These prevalence patterns underscore the need to identify effective childhood obesity pre- vention programs. Method A scoping review was conducted following Arksey and O’Malley’s framework to provide an overview of the types, effectiveness and cost-effectiveness of obesity prevention interven- tions and policies in children up to 6 years old. Inclusion criteria were studies at least 6- months duration; included a weight-based outcome, conducted in the US, English publica- tions from January 2001 to February 2018. Exclusions: studies in overweight/obese children and obesity treatments, no comparator group. Evidence was characterized across the early life course and multiple-levels of influence. Results From the 2,180 records identified, 34 met the inclusion criteria. Less than half of the inter- ventions initiated during pregnancy, infancy or preschool reported a significant improvement in a weight-based outcome. All interventions included strategies to influence individual- or interpersonal-level health behaviors, yet few removed obstacles in the healthcare system, physical/built environment, or sociocultural environment. The majority (78%) of the interven- tions occurred during preschool years, with 63% conducted in early childcare education set- tings serving low-income families. The health impact of the state-wide and national policies on children under age 6 years remains unclear. There was considerable uncertainty around estimates of the health and economic impacts of obesity prevention interventions and policies. PLOS ONE | https://doi.org/10.1371/journal.pone.0209787 December 28, 2018 1 / 24 a1111111111 a1111111111 a1111111111 a1111111111 a1111111111 OPEN ACCESS Citation: Volger S, Rigassio Radler D, Rothpletz- Puglia P (2018) Early childhood obesity prevention efforts through a life course health development perspective: A scoping review. PLoS ONE 13(12): e0209787. https://doi.org/10.1371/journal. pone.0209787 Editor: Louisa Ells, Teesside University, UNITED KINGDOM Received: September 12, 2018 Accepted: December 11, 2018 Published: December 28, 2018 Copyright: © 2018 Volger et al. This is an open access article distributed under the terms of the Creative Commons Attribution License, which permits unrestricted use, distribution, and reproduction in any medium, provided the original author and source are credited. Data Availability Statement: All relevant data are within the manuscript and its Supporting Information files. Funding: The authors received no specific funding for this work. Competing interests: The authors have declared that no competing interests exist.
Transcript of Early childhood obesity prevention efforts through a life ...
RESEARCH ARTICLE
Early childhood obesity prevention efforts
through a life course health development
perspective: A scoping review
Sheri VolgerID*, Diane Rigassio Radler, Pamela Rothpletz-Puglia
Department of Clinical and Preventive Nutrition Sciences, School of Health Professions, Biomedical and
Health Sciences, Rutgers University, Newark, New Jersey, United States of America
Abstract
Introduction
The obesity rate in preschool children in the United States (US) is 13.9%, while even higher
rates are associated with racial and ethnic minorities and children from low-income families.
These prevalence patterns underscore the need to identify effective childhood obesity pre-
vention programs.
Method
A scoping review was conducted following Arksey and O’Malley’s framework to provide an
overview of the types, effectiveness and cost-effectiveness of obesity prevention interven-
tions and policies in children up to 6 years old. Inclusion criteria were studies at least 6-
months duration; included a weight-based outcome, conducted in the US, English publica-
tions from January 2001 to February 2018. Exclusions: studies in overweight/obese children
and obesity treatments, no comparator group. Evidence was characterized across the early
life course and multiple-levels of influence.
Results
From the 2,180 records identified, 34 met the inclusion criteria. Less than half of the inter-
ventions initiated during pregnancy, infancy or preschool reported a significant improvement
in a weight-based outcome. All interventions included strategies to influence individual- or
interpersonal-level health behaviors, yet few removed obstacles in the healthcare system,
physical/built environment, or sociocultural environment. The majority (78%) of the interven-
tions occurred during preschool years, with 63% conducted in early childcare education set-
tings serving low-income families. The health impact of the state-wide and national policies
on children under age 6 years remains unclear. There was considerable uncertainty around
estimates of the health and economic impacts of obesity prevention interventions and
policies.
PLOS ONE | https://doi.org/10.1371/journal.pone.0209787 December 28, 2018 1 / 24
a1111111111
a1111111111
a1111111111
a1111111111
a1111111111
OPEN ACCESS
Citation: Volger S, Rigassio Radler D, Rothpletz-
Puglia P (2018) Early childhood obesity prevention
efforts through a life course health development
perspective: A scoping review. PLoS ONE 13(12):
e0209787. https://doi.org/10.1371/journal.
pone.0209787
Editor: Louisa Ells, Teesside University, UNITED
KINGDOM
Received: September 12, 2018
Accepted: December 11, 2018
Published: December 28, 2018
Copyright: © 2018 Volger et al. This is an open
access article distributed under the terms of the
Creative Commons Attribution License, which
permits unrestricted use, distribution, and
reproduction in any medium, provided the original
author and source are credited.
Data Availability Statement: All relevant data are
within the manuscript and its Supporting
Information files.
Funding: The authors received no specific funding
for this work.
Competing interests: The authors have declared
that no competing interests exist.

Conclusion
There is a need to intensify early childhood obesity preventive efforts during critical periods
of health development in the US. Future studies should estimate the feasibility, program
effectiveness, and cost of implementing multilevel obesity prevention interventions and poli-
cies. Addressing these research gaps will provide stakeholders with the scientific evidence
necessary to facilitate funding and policy decisions to decrease the prevalence of early
childhood obesity.
Introduction
Despite recommendations to prioritize obesity prevention efforts, [1–4] epidemiological data
from the 2015–2016 National Health and Nutrition Examination Survey (NHANES) found
that the prevalence of early childhood obesity remains at a 10-year high [5]. Furthermore, obe-
sity rates among school-aged children aged 6–11 years are approximately 25% higher com-
pared with preschool children aged 2–5 years [5]. In addition, even higher obesity rates are
differentially associated with minorities and children from low-income families [6]. These
prevalence patterns underscore the need to focus on early childhood obesity prevention efforts
with the goal of meeting the Healthy People 2020 obesity rate target of 9.4% [2]
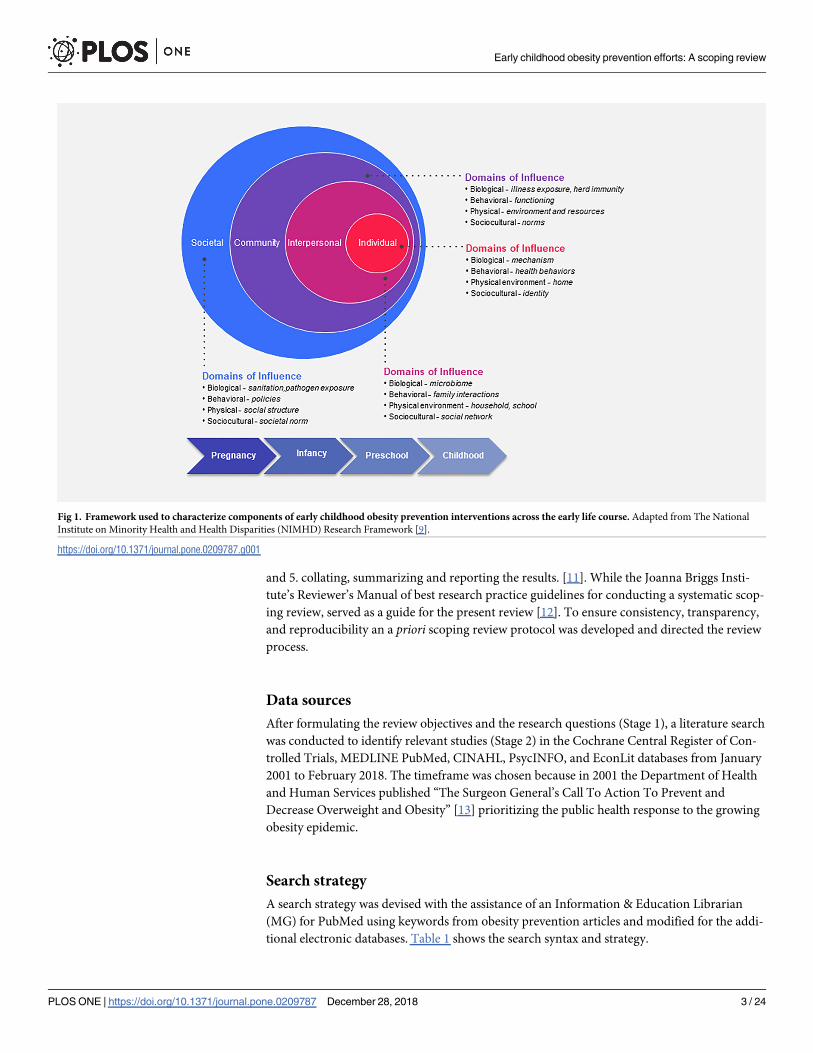
The evaluation of such efforts should be guided by framework models that consider the var-
ious levels that influence an individual’s health trajectory [7, 8]. For example, the National
Institute on Minority Health and Health Disparities (NIMHD) Research Framework repre-
sents the multiple levels of modifiable and interacting determinants that contribute to health
disparities (Fig 1) [9]. While the multi-level Life Course Health Development Framework per-
spective also recognizes that health-development unfolds over the life course, is sensitive to
time and environment, adaptive, and requires a balance among all levels of health [10].
Together, these models are well-suited for evaluating and characterizing childhood obesity
prevention efforts and informing future interventions.
We conducted a scoping review to provide an overview of the current state of obesity pre-
vention efforts in the United States (US) with children less than 6 years of age, and to answer
two questions: “What types of interventions and policies are being used for obesity prevention
across the early life course and at multiple levels of influence?” and “How effective are they?”
The secondary aim was to describe the best available evidence on the cost and cost-effective-
ness of implementing obesity prevention interventions and policies.
Methods
A scoping review was conducted to expand on previous systematic and narrative reviews of
obesity prevention efforts in young children and to identify scientific evidence from a broad
range of interventional studies, government and non-governmental programs, and local and
national policies in the US. The scoping study design was chosen because it offers a framework
to identify, “map”, merge evidence, and synthesize a broad range of evidence. Furthermore,
the scoping review methodology is focused on providing conceptual clarity and allows
researchers to focus on questions with relevance to target populations and locations [11–12].
The scoping review process is based on the Arksey and O’Malley’s 5-stage methodological
framework [11]. The 5-stages that served as a roadmap for the present review are: 1. identifying
the research question; 2. identifying relevant studies; 3. study selection; 4. charting the data,
Early childhood obesity prevention efforts: A scoping review
PLOS ONE | https://doi.org/10.1371/journal.pone.0209787 December 28, 2018 2 / 24
and 5. collating, summarizing and reporting the results. [11]. While the Joanna Briggs Insti-
tute’s Reviewer’s Manual of best research practice guidelines for conducting a systematic scop-
ing review, served as a guide for the present review [12]. To ensure consistency, transparency,
and reproducibility an a priori scoping review protocol was developed and directed the review
process.
Data sources
After formulating the review objectives and the research questions (Stage 1), a literature search
was conducted to identify relevant studies (Stage 2) in the Cochrane Central Register of Con-
trolled Trials, MEDLINE PubMed, CINAHL, PsycINFO, and EconLit databases from January
2001 to February 2018. The timeframe was chosen because in 2001 the Department of Health
and Human Services published “The Surgeon General’s Call To Action To Prevent and
Decrease Overweight and Obesity” [13] prioritizing the public health response to the growing
obesity epidemic.
Search strategy
A search strategy was devised with the assistance of an Information & Education Librarian
(MG) for PubMed using keywords from obesity prevention articles and modified for the addi-
tional electronic databases. Table 1 shows the search syntax and strategy.
Fig 1. Framework used to characterize components of early childhood obesity prevention interventions across the early life course. Adapted from The National
Institute on Minority Health and Health Disparities (NIMHD) Research Framework [9].
https://doi.org/10.1371/journal.pone.0209787.g001
Early childhood obesity prevention efforts: A scoping review
PLOS ONE | https://doi.org/10.1371/journal.pone.0209787 December 28, 2018 3 / 24

Study selection
During study selection (Stage 3), publication titles and abstracts were screened, duplicates
deleted, and full-text articles reviewed for eligibility based on the review’s inclusion criteria.
References from the bibliographies of included trials were hand searched. Two researchers
(SV, PRP) independently reviewed, discussed, and agreed upon the eligibility of all studies.
While systematic reviews adhere to rigid inclusion criteria, scoping studies’ inclusion criteria
are broad to allow for the evaluation of a wide range of information [12]. Eligible studies were
included if they incorporated a comparator group; were conducted in children with a normal
or healthy weight (BMI-for-age percentile between the 5th percentile to less than the 85th per-
centile); children under the age of 6 or woman in any setting, and reported at least one weight-
based outcome measure of growth or weight status (Table 1). While critical appraisal of meth-
odology is not the focus of scoping reviews, we followed a standardized research protocol and
applied the Dixon Woods threshold to exclude articles judged "fatally flawed" [14].
Data extraction
Data extraction (Stage 4) was done using a two-step process. First, a Microsoft Excel, version
2016 (Microsoft, Redmond, WA) data extraction template was developed to chart continuous
and categorical variables and perform summary statistics. S1 Appendix shows a list of the key
Table 1. Search strategy and study selection criteria.
Search Strategy
PubMed Search
Strategy
((policy[Title/Abstract] OR policies[Title/Abstract] OR prevention[Title/Abstract] OR "primary prevention"[Mesh]) AND ("Child,
Preschool"[Mesh] OR "Infant"[Mesh] OR childhood[Ti] OR childcare[Ti] OR early childhood[Ti] OR preschool[Ti]) AND (obesity[mh] OR
obese[tiab] OR obesity[tiab] OR overweight[tiab] OR over-weight[tiab])) NOT (("Review"[Publication Type] OR "Meta-Analysis"[Publication
Type] OR "Meeting Abstracts"[Publication Type] OR "research design"[Mesh]))
Limits Full text; Publication date from 2001/01/01; Humans; English; Newborn: birth-1 month; Infant: birth-23 months; Infant: 1–23 months;
Preschool Child: 2–5 years
Study Selection Criteria (PICOTS)
Inclusion Criteria Exclusion Criteria
Population -Children under the age of 6
- Records/ separate analysis of children under the age of 6, if older
children were also included
-Otherwise healthy
-Populations of exclusively obese or overweight children
-Children with a chronic illness, disability, congenital
malformation or significant medical condition that could
contribute to changes in body weight
Interventions, Policies
or Practices
Any intervention, program or policy aimed at preventing early
childhood obesity
-Interventions, programs or policies aimed at obesity treatment or
promoting weight loss
Comparison -Other intervention, programs or policy aimed at preventing early
childhood obesity
-Or usual care, within the same aged children and in a similar setting
-Or an equivalent historical control group or policy period
-No relevant comparator group
Outcome Change in a weight-based measure of growth or weight status such as
weight, weight/weight percentiles, BMI / BMIz-score, or BMI categories
(underweight, normal weight, overweight, obese) compared to a
comparator group
-No weight-based outcome measure
Timing -Interventions/programs lasting at least 6 months long or collecting a
weight-based outcome measure 6 months after initiation
-Policies since 2001
- Interventions/programs less than 6 months
Setting
-Individual (primary-care based)
-Interpersonal (home-based, peers)
-Community (childcare-based, community organizations)
-Societal (policies, health information, social norms)
-Non-US settings or policies
Year Range Publications from Jan 2001 to Feb 2018 -Publication prior to 2001
Studies estimating implementation costs, cost effectiveness analyses and policy studies were included provided that the assumptions and datasets included children
under 6 years of age.
https://doi.org/10.1371/journal.pone.0209787.t001
Early childhood obesity prevention efforts: A scoping review
PLOS ONE | https://doi.org/10.1371/journal.pone.0209787 December 28, 2018 4 / 24

data extraction variables. Next, included articles were imported into Nvivo 11 Pro (QRS Inter-
national, Doncaster, Australia) and qualitative data were extracted by selecting, coding and
creating nodes (files) representing key concepts. A coding structure and organizational hierar-
chy was created to characterize major themes by life course, concepts and context pertaining
to the NIMHD Framework (Fig 1).
Results
Collating, summarizing and reporting the results (Stage 5)
Fig 2 describes the literature search and study selection process. We identified a total of 2,467
records. After removing duplicate records, the titles and abstracts of 2,180 records were
screened for inclusion. The full text of 73 articles were reviewed for eligibility and 34 studies
were included in the review.
Study characteristics
The included studies examined the collective experiences of approximately 900 pregnant
women, 1,600 infants and 10,000 preschool aged children across 16 states, in 10 urban centers,
and a mix of suburban and rural communities (Tables 2–4). The interventions (n = 25) were
initiated during three stages in the early life course: pregnancy (n = 3),[16–18], infancy (n = 3),
[19–21] and preschool (n = 19), [22–40]. The majority (88%, 22/25) of the interventions used
an experimental study design (19–40).
We identified 6 publications examining the impact of city, state and national obesity pre-
vention policies [41–46]. Three additional studies calculated the net cost or cost-effectiveness
of obesity prevention interventions [47–49].
In total, 11 (44%) interventions reported a positive benefit on a weight-based measure of
growth or weight status (e.g., weight, weight/weight percentiles, BMI/ BMI z-score, and BMI
categories) [17, 19, 20, 22–25, 28, 31, 36, 38]. The effectiveness of the interventions was incon-
sistent and contradictory across all stages of the early life course. Tables 2–4 provide descrip-
tions of the characteristics and outcomes of the interventions.
Studies initiated during pregnancy
This review identified 3 studies initiated during pregnancy conducted in children from low-
income families and members of racial-ethnic minority groups who are at higher risk of obe-
sity [6] and in a variety of settings [urban healthcare clinic-bases [16]; community-wide plus
home-visits [17]; community-wide plus primary care practice], (Table 2), [18)]. All three inter-
ventions focused on similar individual- and interpersonal-level behaviors (preventing excess
gestational weight gain [16, 18] and accelerated infant growth [16–18]), two studies also
focused on community-level influences [17–18] but only the one study [17] that implemented
interventional components at multilevel domains of influence demonstrated a positive effect
on Body Mass Index z-score (BMI-z) in American Indian/Alaskan Native tribal communities
in the multi-level, community wide-plus home-visit intervention.
Interventions during infancy
Two [19, 20] of the three [19–21] studies identified were initiated during infancy and showed a
positive effect on infant growth (Table 3). All studies included behavioral strategies at the indi-
vidual and interpersonal level aimed at increasing knowledge of healthy food choices and
appropriate growth patterns. The Well Baby Group (WBG) intervention also targeted commu-
nity levels of influence by delivering sociocultural adapted nutrition education and providing a
Early childhood obesity prevention efforts: A scoping review
PLOS ONE | https://doi.org/10.1371/journal.pone.0209787 December 28, 2018 5 / 24

Fig 2. Flow diagram showing literature and study selection. Adapted from Moher D, Liberati A, Tetzlaff J, Altman DG. Preferred reporting items for
systematic reviews and meta-analyses: the PRISMA statement. BMJ (Clinical research ed). 2009;339:b2535, [15].
https://doi.org/10.1371/journal.pone.0209787.g002
Early childhood obesity prevention efforts: A scoping review
PLOS ONE | https://doi.org/10.1371/journal.pone.0209787 December 28, 2018 6 / 24

peer social support network while maximizing the physical environment and healthcare sys-
tem resources at a federally qualified community health center [19]. At two years, the infants
of low-income, predominately Hispanic mothers attending the WBG were significantly less
likely to have a BMI-for-age� 85th percentile compared with a randomly selected compari-
sons group of infants. Also, at one year, infants of mothers who received both the home-based
intervention Soothe/Sleep and Introduction to Solids interventions had lower mean weight-
for-length percentiles (33rd vs. 50th) compared to the no intervention group [20].
Interventions in preschool aged children
Childcare center-based interventions. Over half (63%, 12/19) of the preschool-aged
interventions enrolled children from low-income, racially and ethnically diverse families from
Table 2. Characteristics of interventions during pregnancy.
Author
Year
Study location Population Study Design Theoretical
Framework
Level of
Influence
Intervention Participant Effectiveness
Study Name Study Setting Analytical
Sample aDomains of
Influence
Delivery Treatment
provider
Gregory [16]
2016
Baltimore, MD Pregnant, < 21
weeks
gestation; Pre-
pregnancy
BMI > 30 kg/
m2; Medicaid
insurance;
Mainly AA
Retrospective
cohort
Obstetrical
model
Individual,
interpersonal
Behavior, Diet,
Appropriate
GWG
Mother,
Infant
Not significant: at
1-year, infant
WFL� 95th
percentile I = 17%;
C = 15%, P = .66
Nutrition in
Pregnancy
clinic (NIP)
Urban hospital,
health care clinic
Mothers:
I = 61; C = 145
Infants: I = 32
C = 97
Biological,
Behavioral,
Healthcare
system
Individual
sessions
Physician,
Nurse,
practitioner,
Nutritionist
Olson [18]
2014
Rural, NY
8-counties with
below state median
family income;
higher rates of
childhood
overweight/
obesity in 6 of the
counties
Pregnant, <24
weeks gestation
and 6 months
post-partum;
infant weights
through 6
months
Prospective
cohort study
Community
coalition
action theory
Individual,
Interpersonal,
Community,
Societal
Environmental
community
changes, Diet, PA,
Appropriate
GWG,
Breastfeeding
Mother,
Infant,
Community
Not significant: at 6
months, WFL z-
score in (%),
I = 34.2%;
C = 31.4%, P = .52
Healthy Start
Partnership
(HSP)
Combination
community- wide
plus primary care
clinic
Mothers:
I = 114;
C = 152;
Infants: I = 88
C = 65
Biological:
Behavioral,
Physical / built,
Sociocultural
Community
exposure, multiple
formats & modes
of delivery
Multiple
sectors
Karanja [17]
2010
Portland Area
Indian Health
Services (Idaho,
Oregon, WA)
Pregnant:
affiliated with 1
of 3 AI / AN
tribes with
children at
higher risk for
overweight
Before and
after design
Home-
visiting
model
Individual,
interpersonal,
community
Environmental
community
changes, Behavior,
Diet,
Breastfeeding,
Reduce SSB
Mother,
Infant,
Community
Significant: at 24
months, BMI- z
scores increased less
in the community-
wide plus home
groups (Tribes B &
C) compared with
community only
(Tribe A) (−0.75, P
= .016)
The toddler
overweight
and tooth
decay
prevention
study (TOTS)
Combination
community-wide
plus home-visit/
phone
Mothers:
I = 142; C = 63;
Infants:
I = 125; C = 53
Biological,
Behavioral,
Physical/ built,
Socio-cultural,
Healthcare
system
Individual, face to
face, Phone,
Multimedia
Trained, peer,
community
worker
Abbreviations: AA, African American; AI, American Indian; AN Alaskan Native; BMI, Body Mass Index kg /m2, C, comparator group; GWG, gestational weigh gain; I,
Intervention group; PA, physical activity; PCP, primary care provider; WFL, weight-for-length; Wt, weighta Sample size is the analytical sample or sample included in the primary analysis
https://doi.org/10.1371/journal.pone.0209787.t002
Early childhood obesity prevention efforts: A scoping review
PLOS ONE | https://doi.org/10.1371/journal.pone.0209787 December 28, 2018 7 / 24

Head Start centers (n = 7), YMCA-affiliated childcare centers (n = 2) or other subsidized child-
care programs (n = 3), (Table 4). The childcare center-based interventions included in this
review were designed with interventional components that primarily focused on influencing
individual- or interpersonal-level health behaviors of the children and preschool teachers.
Only 42% (5/12) of these interventions reported a significant improvement in either BMI-z
score [22], BMI [23–24, 28] and BMI percentile [36].
Of the interventions demonstrating a positive effect on BMI, two studies administered 30
minutes of moderate to vigorous physical activity (MVPA) for primarily African American
(AA) children attending YMCA-affiliated preschools [23, 24]. Similarly, the “Hip-Hop to
Health” efficacy trial [28] enrolled predominately AA preschoolers attending Head Start and
used trained educators to deliver 20-minute healthy-lifestyle behavior themed lessons and 20
minutes of directed physical activity (PA). However, the same intervention did not have a ben-
eficial effect on BMI in Latino preschoolers [29], nor did other similar effectiveness trial in
Latino [30] and AA preschoolers [33, 50]. Another study found that five, 1-hour long healthy-
lifestyle themed workshops presented by trained nurse childcare health consultant to parents,
childcare teachers and staff, significantly decreased mean BMI-z scores in children from
underserved minority families [22]. Finally, a multilevel, childcare-based intervention [36]
Table 3. Characteristics of interventions during infancy.
Author
Year
Study
location
Population Study Design Theoretical
Framework
Level of
Influence
Intervention Participant Effectiveness
Study Name Study
Setting
Analytical Samplea
Domains of
Influence
Delivery Treatment
provider
Machuca [19]
2016
Bronx, NY Enrolled in
WBG by age 2
months;
Attended at least
on WBG group
and 24- or
30-month well-
child care visit
nRCT Trans-
theoretical
model stages of
change; Social
Learning
Theory
Interpersonal,
Individual,
Community
Behavior and
Diet
Mothers,
Infant
Significant: at 2
years, I group were
significantly less
likely to have a BMI-
for-age� 85th
percentile compared
with C (2.1% vs.
15.0%; OR 0.12; 95%
C; 0.02–0.94; P = .02)
Well Baby
Group (WBG)
Federally
Qualified
Healthcare
Center
Mothers: I = 47;
C = 140
Biological,
Behavioral,
Sociocultural
environment,
Healthcare
system
Group mother
sessions
Pediatrician
Registered
Dietitian
Schroeder [21]
2015
Baltimore,
MD
Healthy infants;
�2000 g birth
weight;
discharged
home < 5 days
post birth
Randomized
cluster
Not stated Individual,
Interpersonal
Behavior, Diet
and PA
Parents, Infant Not Significant: at
age 24 months, no
between group
difference in growth
pattern; for example,
mean (SD) BMIz-
scores I = [0.339
(1.13) vs.C = 0.218
(0.95), P >.05]
Growing Leaps
and Bounds
Health
Centers
Centers = 4;
Infants: I = 112;
C = 110
Biological,
Behavioral,
Healthcare
system
Individual
sessions,
Brochures,
Phone,
Postcards
Pediatrician;
Nurse
practitioner;
Clinic staff
Paul [20]
2011
Hershey, PA Mothers
intending to
breastfeed;
Newborn infants
RCT (2 x 2
design)
Not stated Interpersonal,
Individual
Behavior and
Diet
Mothers,
Infant
Significant: at 1 year,
infants in both I
groups had lower
mean WFL
percentiles compared
with C (I = 33rd
percentile vs.
C = 50th percentile; P
= .009)
Sleeping and
Intake Methods
Taught to
Infants and
Mothers Early in
life (SLIMTIME)
Home Mother Infant
pairs = 110;
Soothe/Sleep,
n = 29;
Introduction of
solids, n = 29;
Both, n = 22;
None, n = 30
Biological,
Behavioral
Individual
sessions, face-
to-face, video,
Instructional
handouts
Research
Nurse
Abbreviations: BMI, Body Mass Index kg /m2, C, comparator group; I, Intervention group; nRCT, non-randomized control trial; OR, Odds ratio; PA, physical activity;
RCT, randomized control trial; SD, Standard deviation; WFL, weight-for-length; WIC, Women, Infants, and Children Program; Wt, weighta Sample size is the analytical sample or sample included in the primary analysis
https://doi.org/10.1371/journal.pone.0209787.t003
Early childhood obesity prevention efforts: A scoping review
PLOS ONE | https://doi.org/10.1371/journal.pone.0209787 December 28, 2018 8 / 24
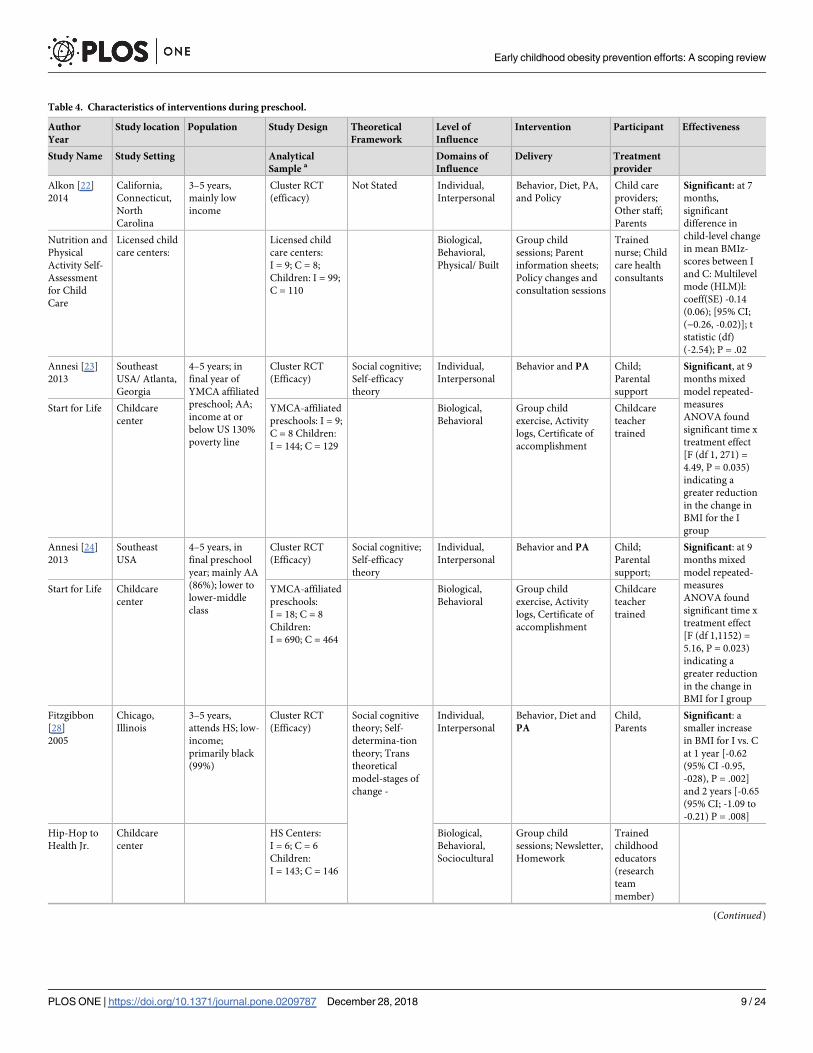
Table 4. Characteristics of interventions during preschool.
Author
Year
Study location Population Study Design Theoretical
Framework
Level of
Influence
Intervention Participant Effectiveness
Study Name Study Setting Analytical
Sample aDomains of
Influence
Delivery Treatment
provider
Alkon [22]
2014
California,
Connecticut,
North
Carolina
3–5 years,
mainly low
income
Cluster RCT
(efficacy)
Not Stated Individual,
Interpersonal
Behavior, Diet, PA,
and Policy
Child care
providers;
Other staff;
Parents
Significant: at 7
months,
significant
difference in
child-level change
in mean BMIz-
scores between I
and C: Multilevel
mode (HLM)l:
coeff(SE) -0.14
(0.06); [95% CI;
(−0.26, -0.02)]; t
statistic (df)
(-2.54); P = .02
Nutrition and
Physical
Activity Self-
Assessment
for Child
Care
Licensed child
care centers:
Licensed child
care centers:
I = 9; C = 8;
Children: I = 99;
C = 110
Biological,
Behavioral,
Physical/ Built
Group child
sessions; Parent
information sheets;
Policy changes and
consultation sessions
Trained
nurse; Child
care health
consultants
Annesi [23]
2013
Southeast
USA/ Atlanta,
Georgia
4–5 years; in
final year of
YMCA affiliated
preschool; AA;
income at or
below US 130%
poverty line
Cluster RCT
(Efficacy)
Social cognitive;
Self-efficacy
theory
Individual,
Interpersonal
Behavior and PA Child;
Parental
support
Significant, at 9
months mixed
model repeated-
measures
ANOVA found
significant time x
treatment effect
[F (df 1, 271) =
4.49, P = 0.035)
indicating a
greater reduction
in the change in
BMI for the I
group
Start for Life Childcare
center
YMCA-affiliated
preschools: I = 9;
C = 8 Children:
I = 144; C = 129
Biological,
Behavioral
Group child
exercise, Activity
logs, Certificate of
accomplishment
Childcare
teacher
trained
Annesi [24]
2013
Southeast
USA
4–5 years, in
final preschool
year; mainly AA
(86%); lower to
lower-middle
class
Cluster RCT
(Efficacy)
Social cognitive;
Self-efficacy
theory
Individual,
Interpersonal
Behavior and PA Child;
Parental
support;
Significant: at 9
months mixed
model repeated-
measures
ANOVA found
significant time x
treatment effect
[F (df 1,1152) =
5.16, P = 0.023)
indicating a
greater reduction
in the change in
BMI for I group
Start for Life Childcare
center
YMCA-affiliated
preschools:
I = 18; C = 8
Children:
I = 690; C = 464
Biological,
Behavioral
Group child
exercise, Activity
logs, Certificate of
accomplishment
Childcare
teacher
trained
Fitzgibbon
[28]
2005
Chicago,
Illinois
3–5 years,
attends HS; low-
income;
primarily black
(99%)
Cluster RCT
(Efficacy)
Social cognitive
theory; Self-
determina-tion
theory; Trans
theoretical
model-stages of
change -
Individual,
Interpersonal
Behavior, Diet and
PA
Child,
Parents
Significant: a
smaller increase
in BMI for I vs. C
at 1 year [-0.62
(95% CI -0.95,
-028), P = .002]
and 2 years [-0.65
(95% CI; -1.09 to
-0.21) P = .008]
Hip-Hop to
Health Jr.
Childcare
center
HS Centers:
I = 6; C = 6
Children:
I = 143; C = 146
Biological,
Behavioral,
Sociocultural
Group child
sessions; Newsletter,
Homework
Trained
childhood
educators
(research
team
member)
(Continued)
Early childhood obesity prevention efforts: A scoping review
PLOS ONE | https://doi.org/10.1371/journal.pone.0209787 December 28, 2018 9 / 24

Table 4. (Continued)
Author
Year
Study location Population Study Design Theoretical
Framework
Level of
Influence
Intervention Participant Effectiveness
Study Name Study Setting Analytical
Sample aDomains of
Influence
Delivery Treatment
provider
Natale [36]
2017
Miami-Dade
County,
Florida
2–5 years; low-
income children;
racial/ ethnic
distribution of
Miami-Dade
County: 60%
Hispanic, 20%
AA
Cluster RCT
(Effectiveness)
Socio-ecological
model; Social
Cognitive Theory
Individual,
Interpersonal
Behavior, Diet, PA
and Policy
Child care
providers and
staff; Parents,
Child
Significant: at 2
years, a growth
curve analysis
showed a
significantly
smaller increase
in PBMI for I vs.
C [negative slope
(ß coefficient =
-1.95, SE = 0.97, P
= .04)
Healthy
Caregivers-
Healthy
Children
Childcare
center
Subsidized Child
care centers:
I = 12: C = 16:
Children:
I = 754; C = 457
Biological,
Behavioral,
Physical/ Built,
Sociocultural
Policy changes;
Group teacher,
parent and child
sessions; English and
Spanish resources;
Newsletters,
Homework,
Childcare
teacher
trained;
Bilingual
study team
members;
Lumeng [34]
2017
Urban and
Rural
Michigan
Child attending
HS, first year
Cluster RCT
(Efficacy)
Social cognitive
theory;
observational
learning/
reinforcement
techniques
Individual,
Interpersonal,
Behavior and Diet Child;
Parents
Not significant: at
the end of the
academic year, no
between group
difference in the
prevalence of
overweight or
obesity and BMI-
z scores (All, P
>.05)
Preschool
Obesity
Prevention
Series [POPS]
Childcare
center
HS classes: I = 9;
C = 9; I Obesity-
prevention,
n = 221;
I2 = plus self
-regulation,
n = 253);
C = 216
Biological,
Behavioral,
Sociocultural
Group child and
parent sessions,
Video vignettes,
Homework, Phone
calls
Master’s-level
nutrition/
mental health
specialist;
Childcare
teacher
trained
Kong [33]
2016
Chicago,
Illinois
3–5 years, HS
serving AA, low-
income families
Cluster RCT
(Effectiveness)
Social cognitive
theory; Self-
determination
theory; Trans-
theoretical model
-stages of change
Individual,
Interpersonal
Behavior, Diet and
PA
Child,
Parents
Not significant: at
1 year, no
between group
difference in
adjusted mean
changes in BMIz
scores (P = .83)
Hip-Hop to
Health Jr.
Childcare
center
HS centers:
N = 18;
Children;
I = 285; C = 258
Biological,
Behavioral,
Sociocultural
Group child
sessions: Exercise
CD, Newsletter,
Homework
Childcare
teacher
trained
Esquivel [27]
2016
Oahu, Hawaii HS classroom; 2
to 5 years; NHPI
children (23%)
Cluster RCT
(Effectiveness)
Not stated Individual,
Interpersonal,
Behavior, Diet, PA
and Policy
HS Teachers;
Child
Not significant: at
7 months, no
within -group
differences in
mean change in
BMIz-scores and
BMI categories
(All, P >.05)
Children’s
Healthy
Living
Program
(CHL)
Childcare
center
HS classes
(geographical
cluster): I = 11;
C = 12;
Children:
I = 114; C = 132
Biological,
Behavioral,
Physical/ Built
Group teacher
sessions, Menu
changes, Classroom
nutrition / PA
resources,
Newsletters, Phone
Childcare
teacher
trained
(Continued)
Early childhood obesity prevention efforts: A scoping review
PLOS ONE | https://doi.org/10.1371/journal.pone.0209787 December 28, 2018 10 / 24

Table 4. (Continued)
Author
Year
Study location Population Study Design Theoretical
Framework
Level of
Influence
Intervention Participant Effectiveness
Study Name Study Setting Analytical
Sample aDomains of
Influence
Delivery Treatment
provider
Natale [35]
2014
Miami-Dade
County,
Florida
2 to 5 years,
child care
centers serving
multi-ethnic
children from
low-income
families
Cluster RCT
(Effectiveness)
Socio-ecological
model
Individual,
Interpersonal
Behavior, Diet, PA
and Policy
Child care
providers;
Other staff;
Parents;
Child
Not significant: at
12 months no
between group
difference in
mean Wt. (P =
.35) and BMI-z
scores (P = .81)
Healthy
Inside–
Healthy
Outside
Childcare
center
Subsidized child
care centers:
I = 6; C = 2;
Children:
I = 238; C = 69
Biological,
Behavioral,
Physical/ Built,
Sociocultural
Policy changes;
Group sessions,
Spanish and English
resources;
Newsletters,
Homework
Childcare
teacher
trained; RD/
Nutritionist
Fitzgibbon
[30]
2013
Chicago,
Illinois
3–5 years, low-
income, Latino
Cluster RCT
(Feasibility)
Social cognitive
theory; Health
belief model; Self-
Determination
Theory
Individual,
Interpersonal
Behavior, Diet and
PA
Child,
Parents
Not significant: at
1 year, did find a
greater reduction
in in BMI and
BMIz- scores in
the I group (P
>.05)
Family-based
Hip-Hop to
Health
Childcare
center
HS centers: I = 2,
C = 2: Children:
I = 61; C = 67
Biological,
Behavioral,
Sociocultural
Group child
sessions, Nutrition
and Spanish exercise
CD, Parent group
sessions and PA,
Newsletters
Trained,
bilingual/
bicultural
educator
Fitzgibbon
[29]
2006
Chicago,
Illinois
3–5 years, low
income; mainly
Latino HS
centers
Cluster RCT
(Efficacy)
Social cognitive
theory; Self-
determination
theory
Individual,
Interpersonal
Behavior, Diet and
PA
Child,
Parents
Not significant: at
1 and 2 years, no
between group
differences in
change in BMI
and BMIz-scores
(P = .05)
Hip-Hop to
Health Jr.
Latino
Childcare
center
HS centers: I = 6,
C = 6; Children:
I = 176; C = 160
Biological,
Behavioral,
Sociocultural
Group child
sessions; Lessons in
English and Spanish:
Spanish exercise CD;
Newsletter,
Homework
Trained,
bilingual/
bicultural
early
childhood
educator
(research
team
member)
Haines [32]
2016
Boston, MA 2–5 years;
Hispanic (58%)
and Black/AA
(23%) recruited
from
community
resources
serving low-
income families
RCT (Efficacy) Social contextual
framework
Individual,
Interpersonal
Behavior, Diet and
PA
Parents,
Child
Not significant: at
9 months, no
between group
difference in BMI
(P = .41)
Parents and
Tots
Together
Community
health center
Parent-child
dyad: I = 46,
C = 50
Biological,
Behavioral
Group child and
parent sessions,
DVD set,
Newsletter,
Homework,
(bilingual
interviews)
Trained
facilitator
(Continued)
Early childhood obesity prevention efforts: A scoping review
PLOS ONE | https://doi.org/10.1371/journal.pone.0209787 December 28, 2018 11 / 24

Table 4. (Continued)
Author
Year
Study location Population Study Design Theoretical
Framework
Level of
Influence
Intervention Participant Effectiveness
Study Name Study Setting Analytical
Sample aDomains of
Influence
Delivery Treatment
provider
Slusser [38]
2012
Los Angeles,
CA
Parent of 2–4
years; Low-
income Latino
RCT (Pilot) Social learning
framework
Individual,
Interpersonal
Behavior, Diet and
PA
Mother,
Child (Wt.
only)
Significant: at 1
year, decrease in
mean (SD) PBMI
in the I group
[-3.85 (0.29) vs.
an increase in C
group [+1.33
(0.30)];
accounting for
drop-out rates
with multiple
imputation,
significant
difference shown
between change
in BMI-z scores
[0.24 (0.01) P <
.04]
Pediatric
Overweight
Prevention
through
Parent
Training
Program
Community
center/ health
centers
Local centers:
Parent-child
dyad: I = 44;
C = 37
Biological,
Behavioral,
Sociocultural
Group, Spanish,
parent training
sessions; Spanish
handouts;
Homework
Trained,
bilingual
staff; social
worker or
master’s level
health
educator
Cloutier [25]
2015
Hartford, CT Caregiver of 2–4
years; Hispanic
(82%) / AA WIC
recipient
N-RCT
(Efficacy)
Chronic care
model
Individual,
Interpersonal
Behavior, Diet and
PA
Mother,
Child (Wt
only)
Significant: at 12
Months,
significant
intervention effect
on change in
PBMI (ß
coefficient =
-0.23; 95% CI;
-0.33, -0.13) with
a mean decrease
in I (-0.33)
compared with an
mean increase
PBMI (8.75) in
the C group (P <
.001)
Steps to
Growing Up
Healthy
Pediatric
Primary Care
Clinic
Clinics, N = 32;
Parent-child
dyad: I = 200,
C = 218
Biological,
Behavioral,
Sociocultural
Healthcare
System
Individual MI
sessions, English and
Spanish resources;
Handouts, Self-
monitoring
calendar, Toolkit
Trained
primary care
clinicians and
nurses;
bilingual
team
members
(Continued)
Early childhood obesity prevention efforts: A scoping review
PLOS ONE | https://doi.org/10.1371/journal.pone.0209787 December 28, 2018 12 / 24

Table 4. (Continued)
Author
Year
Study location Population Study Design Theoretical
Framework
Level of
Influence
Intervention Participant Effectiveness
Study Name Study Setting Analytical
Sample aDomains of
Influence
Delivery Treatment
provider
Sherwood
[37]
2015
Minneapolis-
St Paul area
Families with a
2- to 4-year-old
with a scheduled
well-child visit;
BMI or weight-
for-height age
and sex
percentile from
50th to 95th; one
overweight
parent
RCT (Pilot) Social ecological
models; Social
cognitive theory
Individual,
Interpersonal
Behavior, Diet and
PA
Parent; Child
(Wt. only)
Not Significant: at
6 months no
difference in
PBMI (P = 0.64)
and BMI z-scores
(P = 0.89); post
hoc analysis of
baseline child
weight status
moderated the
time by treatment
effect on BMI
percentile (P =
.04)
Healthy
Homes/
Healthy Kids-
Preschool
Pediatric
Primary Care
Clinics/ Phone
Parent-child
dyad I = 30,
C = 30
Biological,
Behavioral,
Healthcare
system
Individual MI
session, Flipchart,
Handouts: Phone
MI sessions
Pediatric PCP
counseling;
clinic staff;
Trained
coaches
Woo Baidal
[40]
2017
Fitchburg and
New Bedford,
MA
2–4 years, WIC
participant
N-RCT
(Efficacy)
Chronic care
model; Energy
gap model; Social
cognitive theory
Individual,
Interpersonal,
Community
Behavior, Diet and
PA
WIC
-Providers;
Parents Child
(Wt. only)
Not Significant:
Over 2 years, no
significant
difference in
BMIz-scores
adjusting for age,
gender, race,
ethnicity
(P>0.05);
Sensitivity
analysis,
excluding Asian
children found
site I2 had a
significant
decrease in BMI-z
scores [-0.08
units/year (95%
CI, -0.14, -0.02),
P = 0.01] compare
with the C group
MA-CORD
WIC
WIC Sites WIC centers
I = 2, C = 1
Children: I
site1 = 198; I
site2 = 637;
C = 626
Biological,
Behavioral
Healthcare
system
Train-the-trainer
group sessions,
Individual parent
sessions, Handouts;
Healthy weight
clinic referrals
Trained WIC
providers
Davis [26]
2016
Albuquerque
NM
Under 4-years
followed for 1 to
2 years; HS
serving rural,
Hispanic and
AI, low-income
families
Cluster RCT
(Efficacy)
Social ecological
model
Individual,
Interpersonal,
Community
Behavior, Diet, PA
and Policy
Child;
Parents;
Family; HS
teachers and
food service
Not significant: at
6 months, no
between group
difference in
change in mean
BMIz-scores (P =
.69) and 2 years
(P >.30)
Child Health
Initiative for
Lifelong
Eating and
Exercise
(CHILE)
Childcare
center plus
local
community
component
HS centers:
N = 16; Children
I = 945, C = 871
Biological,
Behavioral
Physical/ built,
Sociocultural,
Healthcare
system
Group child
sessions, English and
Spanish resources;
Teacher and
foodservice training;
Family events;
Grocery store
component,
Healthcare provider
support
Childcare
teacher
trained;
Grocery
store;
Healthcare
provider
(Continued)
Early childhood obesity prevention efforts: A scoping review
PLOS ONE | https://doi.org/10.1371/journal.pone.0209787 December 28, 2018 13 / 24

showed a significantly smaller increase in the BMI percentile when intervention centers imple-
mented early childcare center policies focused on modifying individual-level child, parent, and
teacher behaviors with physical/built and sociocultural environment changes.
Primary care providers clinic-based. Two primary care clinic-based studies [25, 37]
reported contradictory results. Both studies targeted individual- and interpersonal-level behav-
ioral changes, implemented in a healthcare environment. Only Cloutier and colleagues found
a significantly greater reduction in BMI percentile in the intervention group that participated
in bilingual, culturally adapted, motivational interviewing (MI) sessions during primary care
provider (PCP) visits and phone-coaching session [25].
Community center-based. Similarly, two interpersonal-level, family-based studies were
conducted a community center-based environment with mixed results. Slusser and colleagues [38]
randomized Latino mothers of preschoolers to receive nine culturally tailored, Spanish language,
parent-training sessions or be in a Wait List Group (WLG). Despite reporting 33.3% attrition, the
intervention group experienced a greater reduction in BMI percentile differences compared with
the WLG at nine months. In contrast, Haines and colleagues [32] failed to demonstrate a signifi-
cant improvement in BMI with a family-based, community health center intervention.
Table 4. (Continued)
Author
Year
Study location Population Study Design Theoretical
Framework
Level of
Influence
Intervention Participant Effectiveness
Study Name Study Setting Analytical
Sample aDomains of
Influence
Delivery Treatment
provider
Haines [31]
2013
Boston, MA 2–5 years; low-
income; racial /
ethnic minority;
television in the
child’s bedroom
RCT
(Effectiveness)
Not stated-
applied (MI
coaching)
Individual,
Interpersonal
Behavior and Diet Families,
Child
Significant: at 6
months, mean
BMI decreased in
I group (-0.18)
but increased in C
group (+0.21)
with a difference
of −0.40 (95% CI,
−0.79 to 0.00; P =
.05).
Healthy
Habits,
Happy
Homes
Home/ phone Parent-child
dyad: I = 55;
C = 56
Biological,
Behavioral,
Physical/ built,
Sociocultural
Individual, home MI
sessions, Phone,
Mail, Text messages
Trained,
bilingual,
health
educators
Sun [39]
2017
San Francisco
Bay Area, CA
Child: 3–5 years;
attends HS; Low
income, Chinese
mothers speak /
read Cantonese
with a BMI� 23
or waist circum.
>31.5
RCT (Pilot) Information
Motivation
behavior model
Individual,
Interpersonal
Behavior, Diet and
PA
Mothers,
Child (Wt.
only)
Not Significant: at
6 months, no
difference in post-
baseline
assessment in
child’s BMI
(t = 1.21,
P = 0.24)
No study
name
provided
Internet-based Parent-child
dyad: I- = 16;
C = 16
Biological,
Behavioral,
Sociocultural
Online/tablets
computer:
Interactive,
Cantonese, modules,
Animated short
videos, Talk show
format
Lessons
developed by
bilingual/
bicultural
RDs and
health
educators
Abbreviations: AA, African American; AI, American Indian; BMI, Body Mass Index kg /m2, C, comparator group; CI confidence interval; coeff(SE), coefficient estimate
(standard error); circum, circumference; f, f-test statistic; GWG, gestational weigh gain; HLM, Hierarchical linear modeling; HS, Head Start; I, Intervention group; MI,
Motivational Interview; NHPI, Native Hawaiian and Pacific Islander; PA, physical activity; PBMI, BMI percentile; PCP, primary care provider; RCT, randomized
control trial; RD, registered dietitian; SD, Standard deviation; t, t-test statistic; vs, versus; WFL, weight-for-length; WIC, Women, Infants, and Children Program; Wt,
weighta Sample size is the analytical sample or sample included in the primary analysis
Bold PA- Direct provision of structured PA
https://doi.org/10.1371/journal.pone.0209787.t004
Early childhood obesity prevention efforts: A scoping review
PLOS ONE | https://doi.org/10.1371/journal.pone.0209787 December 28, 2018 14 / 24

Other settings. Additional preschool-aged interventions were conducted at a WIC site
[40], online [39] and in the home and over the telephone [31]. Only one study reported a posi-
tive effect on BMI. In the “Healthy Habit, Healthy Home” [31] health educators used MI
coaching techniques during home and phone coaching sessions, along with text messages to
promote interpersonal-level changes in healthy family routines and PA, encourage family
meals and beverage choices, adequate sleep and change the physical-built environment by ask-
ing families to remove TVs from the child’s bedroom. Although a WIC-based intervention
within the community-wide Massachusetts Childhood Obesity Research Demonstration [51]
found no effect on BMI-z scores, a post-hoc analysis excluding Asians (due to disproportionate
distribution of Asian children in the comparison community) found a significant improve-
ment in BMI-z scores [40].
Costs of obesity prevention interventions. Table 5 includes a summary of three studies
appraising the cost of preventing obesity. Cradock and colleagues [47] estimated the total
annual cost per child associated with implementing and nationally disseminating the PA com-
ponent of the childcare center-based “Hip-Hop Jr.” PA intervention was $22.65 yearly [33].
Also, Wright and colleagues [45] calculated the net cost of a primary-care based intervention
[52], aimed at reducing obesity related behaviors and BMI in overweight and young, obese
children at $196 per child [49]. In the third study, Ma and Frick [48] modeled the breakeven
point of a hypothetical intervention producing a 1% reduction in the prevalence of obesity
among children 0–6 years. Accounting for future medical costs, population-based interven-
tions could cost up to $339 per child and still have a favorable health benefit/cost profile.
Policy interventions. Six studies [41–46] estimated the cost and health benefits of city-
wide, and state and national policies aimed at preventing future weight gain and obesity
(Table 5). Kuo and colleagues [41] developed a simulation model estimating the impact on
annual weight gain in Los Angeles (LA) County of a California menu law mandating large res-
taurant chains to display the caloric content of menu items. The model assumed 10% of all cus-
tomers would consume 100 calories less per meal and found the law was projected to avert as
much as 500,000 lbs. of the estimated annual LA County population weight gain (1.25 million
lbs.) in children 5 to 17 years old.
The Northeast Iowa Food and Fitness program enacted multilevel changes during a 6-year
long program. The changes targeted schools and home meals and PA, established school gar-
dens, and at the community-level provided access to outdoor recreational spaces and pro-
grams, local farmers markets and affordable healthy food. It was shown that children ages
4–12 years who had longer periods of program exposures (2 to 6 years) demonstrated a greater
improvement in appropriate growth rate compared with children with shorter periods of pro-
gram exposure (0 to 1 year) [46].
Dharmasena et al. utilized an economic demand model based on household purchasing
habits to assess the impact of a 20% tax on SSB consumption, caloric intake and weight. Results
using the most conservative estimate showed an overall reduction in SSB with corresponding
increases in fruit juice and low-fat milk consumption. The interrelated changes in beverage
consumption patterns was forecast to produce an average reduction of 449 calories per month
resulting in a mean body weight reduction of 1.54 lbs/year.
Costs and cost effectiveness analysis. Finally, three studies describe the economic impact
and health consequences of obesity prevention policies using a Markov-based cohort model to
estimate the cost effectiveness of: an excise tax on SSBs, [44] eliminating the tax subsidy for TV
advertising, [42] and implementing a set of hypothetical childcare center-based policy changes
[45], (Table 5). Sonneville and colleagues [42] found that eliminating the ability of food manu-
factures to deduct the cost of advertising unhealthy foods would result in a mean BMI reduc-
tion 0.028 per child [42]. Likewise, Wright and colleagues [45] estimated that a hypothetical
Early childhood obesity prevention efforts: A scoping review
PLOS ONE | https://doi.org/10.1371/journal.pone.0209787 December 28, 2018 15 / 24

Table 5. Cost and cost effectiveness of interventions and policies.
Author
Year
Study Objective Setting /
Sample
Data source/
Population Reach
Analysis model; Year
of Costinga
Key evaluation
components
Domains of
influence
Outcome measures Net Results: Impact
on Obesity and
Cost
Evaluation
type /
Intervention
Location Discount Ratea Perspectivea Levels of
Influence
Ma [48]
2011
Estimate lifetime
obesity-related
medical costs
and establish the
breakeven cost
saving of obesity
prevention
intervention
US population Obesity prevalence
estimates from 30 000
000 children ages: 0 to
6 Years; 7 to 12 years;
13 to 18 years;
NHANES, 2003–2006;
MEPS 2006
Simulation; Year of
costing: 2006 US$
Medical cost
perspective
Biological,
Behavioral,
Healthcare
system
Preventing and
reducing childhood
obesity (defined
as � 95th percentile
of age- and gender
BM)
In healthy 0-
6-year-old children,
spending up to
$339 per child will
result in a positive
cost benefit.
Simulation of
an obesity
prevention
intervention
Discount: medical
costs 3% annually
Individual,
Interpersonal,
Community,
Societal
An intervention
that results in 1%
reduction in
obesity in children
0–6 years would
result in a $1.7
billion-dollar cost
savings
Wright [49]
2014
Estimate the cost
of a cluster RCT,
obesity
prevention
intervention to
reduce TV
viewing time;
fast food SSB
intake
Non-profit
pediatric
offices;
Eastern, MA
Children 2.0 to 6.9
years old; BMI � 95th
percentile or � 85th <
95th percentile with 1
overweight parent
(BMI �25)
Cost Study: net cost
analysis: difference in
cost for the I vs. C
group); Year of
costing: 2011 US$
Costs include:
Parent time and
costs; Provider’s
direct visit-related
-costs: 4 chronic
care visits; 2 phone
calls; Educational
materials; Interactive
website
Biological,
Behavioral,
Healthcare
system
At 1 year, no
significant
difference in BMI,
kg/m2 and BMI z-
score; Total I group
cost = $65,643 (95%
CI, $64,522,
$66,842); Total C
group cost = $12,192
(95% CI, $11,393,
$13,174)
The intervention
costs per child,
mean I group =
$259 (95% CI,
$255, $264); C
group = $63 (95%
CI, $59, $69)
Cost Study:
based on the
High Five for
Kids
intervention
[51]
I group: Sites (n = 5)
Children, (n = 253); C
group: Sites (n = 5);
Children (n = 192)
Discount: medical
equipment 3.5%
Societal perspective Individual,
interpersonal
Net difference in
cost between I and
C: $196; (95% CI,
$191, $202) per
child
Cradock [47]
2017
Estimate the cost
of a national
policy to
implement the
Hip-Hop Jr.
physical activity
intervention in
licensed
childcare centers
Child Care
Setting; US
population
National Association
for Regulatory
Administration 2013,
Census Bureau, MEPS
2001–2003;
Implementation cost
estimates from similar
intervention
Microsimulation
modeling of outcomes
and costs; Year of
costing: 2014 US$
All intervention
costs; State level:
training, labor and
travel; Program
level: training, labor
and materials
Biological,
Behavioral,
Healthcare
system
Assumptions based
on Hip-Hop results:
Reduction in mean
BMI (-0.13.
SE = 0.11); PA
increase in mean
mins per day 7.4
(SE = 3.09)
Cases of obesity
prevented (2015–
2025) 93,065c (95%
UI; -88,279,
248,174)
CEA: based on
the Hip-Hop to
Health Jr.
intervention
(Kong 2016)
1st year reach:
children 3–5
attending
licensed child
care centers
(4.8 million)
Discount: future cost
3% annually
Modified Societal
perspective
Individual,
Interpersonal,
Community,
Societal
Cost per BMI unit
changed per person
$361c (95% UI,
$2031, $3454)
Kuo, [41]
2009
Assess the
impact of menu-
labeling law on
population
weight gain
Large
restaurant
chains in LA
County,
California
LA county Health
Survey; California
Department of
Education Physical
Fitness Testing
Program (1999 and
2006.) National
Restaurant Association
Simulation model Estimates of total
annual revenue,
market share, and
average meal price
of large chain
restaurants, total
annual revenue;
Biological,
Behavioral,
Physical/built,
Sociocultural
Assumed 10% of
customers would
order reduced-
calorie meals with
an average 100
calories reduction
Intervention
prevents a total
average annual
weight gain of
507,500 lbs. in
children 5–17 years
Policy, city &
county wide
law: menu
labeling
Health impact
assessment approach;
weight gain averted
Assumed similar
weight gain patterns
for all school-aged
children aged 5 to 17
years
Individual,
Interpersonal,
Societal
Estimated annual
weight gain in
children 5–17 years
is 1.25 million lbs.
No cost data
(Continued)
Early childhood obesity prevention efforts: A scoping review
PLOS ONE | https://doi.org/10.1371/journal.pone.0209787 December 28, 2018 16 / 24

Table 5. (Continued)
Author
Year
Study Objective Setting /
Sample
Data source/
Population Reach
Analysis model; Year
of Costinga
Key evaluation
components
Domains of
influence
Outcome measures Net Results: Impact
on Obesity and
Cost
Evaluation
type /
Intervention
Location Discount Ratea Perspectivea Levels of
Influence
Dharmasena
[43]
2012
Estimate the
impact of a 20%
SSB tax,
considering the
expected effect
on other
beverages
Four regions
in the US
(East,
Midwest,
South and
West).
Nielsen Homescan
Panel 1998–2003
Quadratic Almost
Ideal Demand System
(QUAIDS) model
Estimating direct
and indirect effects
of a tax on SSB
consumption,
caloric intake and
per capita annual
body weight;
Biological,
Behavioral
Percent change in
per capita
consumption of:
Regular soda (-49%);
High-fat milk (-
2%); Low-fat milk
(+ 11%); Fruit Juice
(+ 29%); Bottled
water (-5%)
Change in body
weight, mean -1.54
lbs. per year
Direct own-price
and indirect cross-
price effects on other
beverages (milk,
fruit juice, sports
drinks)
Policy,
National: a tax
on SSBs
Individual,
Interpersonal,
Societal
Net calorie
reduction: 449.6
calories per person
per month.
No cost data
Wright [45]
2015
Estimate the
health and
economic costs
of early childcare
center obesity
prevention
policies
Licensed child
care facilities
in the US;
Eligible
population-
6.5 million
preschool
children
U.S. 2012: 2007 census;
Child Care Licensing
Study; 2005 NAP;
NHANES 2009–2012;
US Bureau of Labor
Statistics 2013;
Agriculture Marketing
Service, USDA;
Beverage, PA and
screen time data from
research studies;
Simulation: Markov-
based cohort modelb;
Estimated: licensing,
training, and beverage
costs; Assumed 73%
policy adoption rate;
Year of costing: 2014
US$
Hypothetical policy
intervention: for
preschoolers
attending childcare
centers: Replacing
SSBs with water,
limiting fruit juice to
6 ounces /child/day,
serving reduced fat
milk; 90 minutes of
MVPA /day; limit
screen time to 30
min./week
Biological,
Behavioral,
Physical/built
Policy components’
contribution to
change in BMI: PA
(28%); Beverage
(32%); Screen time
(40%); Short term
outcomes: First-year
intervention cost ($
million): 4.82 (6.02,
12.6); Ten-year
(2015–2025)
invention cost ($
million): 8.39 (–10.4,
21.9); Net healthcare
cost savings ($
million): 51.6 (14.2,
134)
Total BMI units
reduced 338,00
(107,000, 790,000);
Mean BMI
reduction per
eligible preschool
child: 0.0186 fewer
BMI units (0.00592,
0.0434)
Policy,
National: A
multi-
component
early childhood
care center
policy
intervention
Population reach: 6.50
million preschoolers
attending childcare
Discount: healthcare
costs 3% annually
Societal perspective Individual,
Interpersonal,
Societal
ICER, $57.80 per
BMI unit avoided;
The intervention is
94.7% likely to
yield a cost saving
by 2025.
Sonnenville
[42]
2015
Estimate the
impact of
eliminating the
TV advertising
tax subsidy on
BMI
US children
and
adolescents
aged 2–19
years
The Nielsen Company;
National Longitudinal
Survey of Youth; Rudd
Report; US Bureau of
Labor Statistics 2013
salary; TV viewing/
advertising data from
published studies
Simulation: Markov-
based cohort modelb;
Year of costing: 2014
US$
CEA of the
elimination of the
tax subsidy of TV
advertising costs for
nutritionally poor
foods and beverages
during children’s
programming
(> 35% child
-audience share)
Biological,
Behavioral
Short term
outcomes: First-year
intervention cost ($
million): 1.05 (0.69,
1.42); Ten-year
(2015–2025):
Healthcare cost
savings ($ millions) -
352 (-581, -138; Net
cost saving per
dollar spent ($
million): 38.0 (14.3,
74.3)
Total population
BMI units reduced
among youth 2–19
years (millions):
2.13 (0.83, 3.52);
Mean BMI
reduction per
youth: 0.028 (0.011,
0.046); Estimated
reduction in
obesity prevalence:
0.30%.
Policy,
National:
Eliminating the
tax subsidy for
TV advertising
Population reach: 74
million
Discount: healthcare
costs 3% annually
Societal perspective Individual,
Interpersonal,
Societal
Two-year costs per
BMI unit reduced
($ million): 1.16
(0.51, 2.63)
(Continued)
Early childhood obesity prevention efforts: A scoping review
PLOS ONE | https://doi.org/10.1371/journal.pone.0209787 December 28, 2018 17 / 24
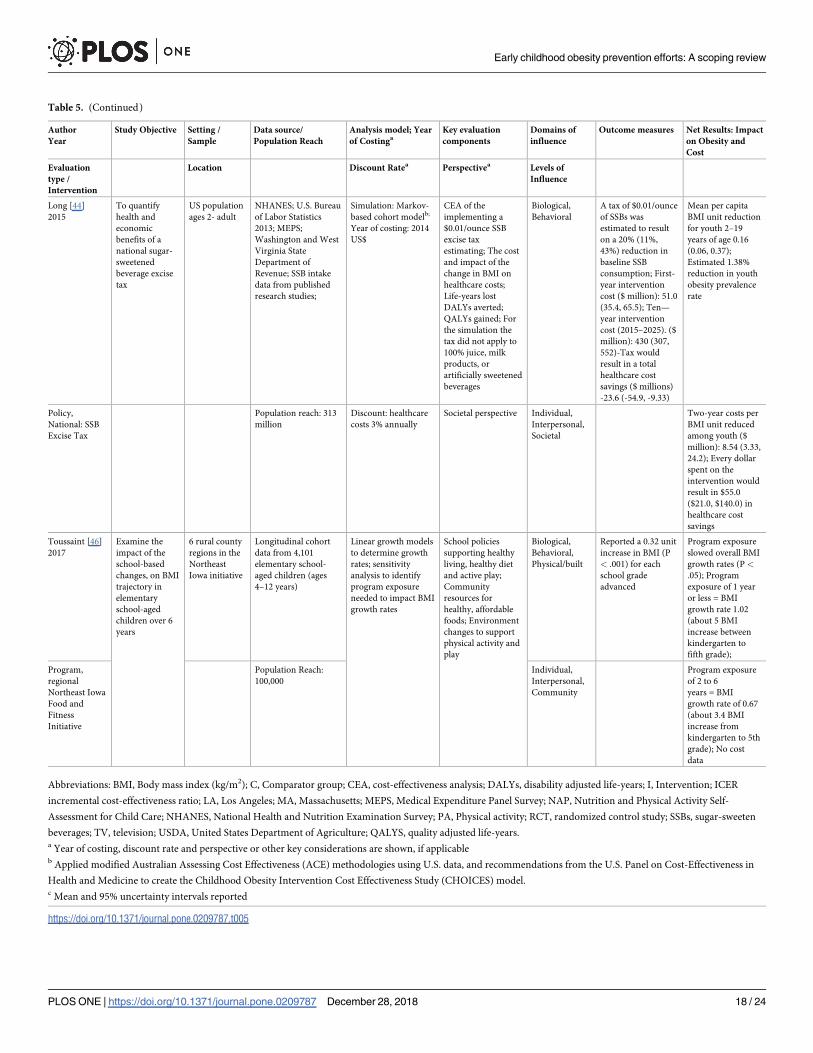
Table 5. (Continued)
Author
Year
Study Objective Setting /
Sample
Data source/
Population Reach
Analysis model; Year
of Costinga
Key evaluation
components
Domains of
influence
Outcome measures Net Results: Impact
on Obesity and
Cost
Evaluation
type /
Intervention
Location Discount Ratea Perspectivea Levels of
Influence
Long [44]
2015
To quantify
health and
economic
benefits of a
national sugar-
sweetened
beverage excise
tax
US population
ages 2- adult
NHANES; U.S. Bureau
of Labor Statistics
2013; MEPS;
Washington and West
Virginia State
Department of
Revenue; SSB intake
data from published
research studies;
Simulation: Markov-
based cohort modelb;
Year of costing: 2014
US$
CEA of the
implementing a
$0.01/ounce SSB
excise tax
estimating; The cost
and impact of the
change in BMI on
healthcare costs;
Life-years lost
DALYs averted;
QALYs gained; For
the simulation the
tax did not apply to
100% juice, milk
products, or
artificially sweetened
beverages
Biological,
Behavioral
A tax of $0.01/ounce
of SSBs was
estimated to result
on a 20% (11%,
43%) reduction in
baseline SSB
consumption; First-
year intervention
cost ($ million): 51.0
(35.4, 65.5); Ten—
year intervention
cost (2015–2025). ($
million): 430 (307,
552)-Tax would
result in a total
healthcare cost
savings ($ millions)
-23.6 (-54.9, -9.33)
Mean per capita
BMI unit reduction
for youth 2–19
years of age 0.16
(0.06, 0.37);
Estimated 1.38%
reduction in youth
obesity prevalence
rate
Policy,
National: SSB
Excise Tax
Population reach: 313
million
Discount: healthcare
costs 3% annually
Societal perspective Individual,
Interpersonal,
Societal
Two-year costs per
BMI unit reduced
among youth ($
million): 8.54 (3.33,
24.2); Every dollar
spent on the
intervention would
result in $55.0
($21.0, $140.0) in
healthcare cost
savings
Toussaint [46]
2017
Examine the
impact of the
school-based
changes, on BMI
trajectory in
elementary
school-aged
children over 6
years
6 rural county
regions in the
Northeast
Iowa initiative
Longitudinal cohort
data from 4,101
elementary school-
aged children (ages
4–12 years)
Linear growth models
to determine growth
rates; sensitivity
analysis to identify
program exposure
needed to impact BMI
growth rates
School policies
supporting healthy
living, healthy diet
and active play;
Community
resources for
healthy, affordable
foods; Environment
changes to support
physical activity and
play
Biological,
Behavioral,
Physical/built
Reported a 0.32 unit
increase in BMI (P
< .001) for each
school grade
advanced
Program exposure
slowed overall BMI
growth rates (P <
.05); Program
exposure of 1 year
or less = BMI
growth rate 1.02
(about 5 BMI
increase between
kindergarten to
fifth grade);
Program,
regional
Northeast Iowa
Food and
Fitness
Initiative
Population Reach:
100,000
Individual,
Interpersonal,
Community
Program exposure
of 2 to 6
years = BMI
growth rate of 0.67
(about 3.4 BMI
increase from
kindergarten to 5th
grade); No cost
data
Abbreviations: BMI, Body mass index (kg/m2); C, Comparator group; CEA, cost-effectiveness analysis; DALYs, disability adjusted life-years; I, Intervention; ICER
incremental cost-effectiveness ratio; LA, Los Angeles; MA, Massachusetts; MEPS, Medical Expenditure Panel Survey; NAP, Nutrition and Physical Activity Self-
Assessment for Child Care; NHANES, National Health and Nutrition Examination Survey; PA, Physical activity; RCT, randomized control study; SSBs, sugar-sweeten
beverages; TV, television; USDA, United States Department of Agriculture; QALYS, quality adjusted life-years.a Year of costing, discount rate and perspective or other key considerations are shown, if applicableb Applied modified Australian Assessing Cost Effectiveness (ACE) methodologies using U.S. data, and recommendations from the U.S. Panel on Cost-Effectiveness in
Health and Medicine to create the Childhood Obesity Intervention Cost Effectiveness Study (CHOICES) model.c Mean and 95% uncertainty intervals reported
https://doi.org/10.1371/journal.pone.0209787.t005
Early childhood obesity prevention efforts: A scoping review
PLOS ONE | https://doi.org/10.1371/journal.pone.0209787 December 28, 2018 18 / 24

childcare center-based policy (eliminating SSBs, limiting fruit juice, serving low-fat milk, limit-
ing screen time and increasing MVPA) would result in a mean BMI reduction of 0.019 BMI
units per child [45]. Finally, Long and colleagues [44] estimated that a tax of $0.01/ounce on
SSBs would reduce the total calories consumed by children ages 2–4 and 5–9 years, by -1 to
-13 kcal/day, respectively, and result in a mean reduction in BMI of approximately 0.16 units
for children 2–19 years. The cost per unit BMI reduction based on these policies ranged from
$1.16 for eliminating the advertising subsidy to $57.80 for the childcare center-based policy.
Discussion
This scoping review identified the characteristics and effectiveness of obesity prevention inter-
ventions, programs and policies across the early life course and at multiple levels of influence
in the US. There were a number of key findings (S2 Appendix). We found slightly less than
half of the interventions initiated during pregnancy, infancy or preschool were effective at
improving a weight-based measure of growth or weight status in young children [17, 19, 20,
22–25, 28, 31, 36, 38]. All interventions included strategies to influence health behaviors at an
individual or interpersonal level. However, few studies removed obstacles in the physical/built
environment, sociocultural environment or healthcare system. The majority of the interven-
tions were conducted in children at higher risk of obesity, in early childcare education settings.
The impact of menu labeling laws, taxing SSBs and eliminating incentives for TV advertising
of unhealthy foods, on a direct weight-based measure of growth or weight status in children
under age 6 years remains unclear. Finally, this review confirmed the lack of available data on
the cost of implementing obesity preventions efforts in the US.
We used the NIMHD Research framework [53] to guide our examination of obesity preven-
tion efforts considering factors relevant to obesity and health equality research. We found that all
interventions initiated during pregnancy and infancy focused on modifying biological risk factors
of obesity by enhancing individual-level knowledge of healthy eating patterns, appropriate gesta-
tional weight gain, prolonged breastfeeding, delayed introduction of complementary feeding,
responsive feeding techniques and appropriate infant growth patterns [19, 20]. For example, in
the primary care setting, MI coaching techniques were applied to reduce obesogenic behaviors
[25, 37], while in the childcare center setting, parents and teachers gained the necessary knowledge
and skills to serve as role-models of healthy-lifestyle behaviors [19, 28, 36, 38]. Also, preschool
children were encouraged to modify their behaviors using culturally adapted, nutrition and PA
lessons [19, 28, 31, 36, 38], food group-themed, hand puppet activities [29], English and Spanish-
language CDs [30], healthy snacks [22, 28, 36] and structured MVPA [23, 24, 28].
All effective interventions identified in this review incorporated interpersonal-level strate-
gies affecting family behaviors and home routines. Parental and family participation was either
a primary or secondary component of all successful interventions. Parents attended culturally
tailored education sessions [38], home visits [17, 20, 31], or were assigned homework, received
instructional handouts and newsletters promoting frequent family meals, adequate sleep, fam-
ily PA and limiting screen time [20, 22, 25, 28, 31, 36, 38]. The inclusion of parent-direct strate-
gies in successful interventions is consistent with the findings of a recent review of obesity
prevention interventions in early childcare centers. Ward and colleagues [54] found that
higher parent engagement in the early childcare settings enhanced the effectiveness of inter-
ventions by achieving a positive weight related outcome [54].
Recognizing the influence of physical environments on the risk of childhood obesity and
health disparities is critical to the design of multilevel obesity prevention interventions. Yet,
less than one-third of the studies aimed to modify a component in the physical/built environ-
ment. These interventions effectively removed barriers to facilitate healthier lifestyle behaviors.
Early childhood obesity prevention efforts: A scoping review
PLOS ONE | https://doi.org/10.1371/journal.pone.0209787 December 28, 2018 19 / 24

They included components such as removing TVs from bedrooms, providing alternative play-
time activities, and implementing childcare centers polices limiting SSBs, serving water, low-
fat milk, fruits and vegetables as snacks; increasing hours of PA, and limiting screen time [22,
31, 36]. At the community-level, Karanja and colleagues [17] enacted tribal-wide policies pro-
viding access to breast feeding rooms and reallocating resources by stocking vending machines
with water and providing water coolers at community-sponsored activities. Collectively, these
types of physical environment changes rendered healthy behaviors as the default behavior.
Approximately half of the interventions integrated strategies to change sociocultural envi-
ronmental-level factors, with considerable variability in the intensity of the components. Few
included primary objectives examining the effectiveness of culturally-tailored training pro-
grams [38, 39] or other high-intensity activities such as media campaigns encouraging drink-
ing water and breastfeeding as cultural values [17] or establishing group sessions intended to
support shared sociocultural values [19]. While the majority of studies included the following
types of moderate- to low-intensity components: using bi-cultural/bilingual interventionalist
[19, 25, 29, 30, 32, 36, 38, 39], culturally adapted curriculum [25, 26, 28–31, 33, 34, 36, 38, 39]
and providing culturally relevant recipes [19, 25, 26, 35, 39].
Healthcare system-level changes facilitate access to healthcare resources, engage parents in
healthcare decisions and improve parent-healthcare provider relationships. Furthermore, the
early initiation of interventions in the healthcare setting might alter the course of health and dis-
ease, and reduce future health disparities [55]. Yet, of the 5 healthcare-based interventions [16,
19, 21, 25, 37], only two reported improvements in a measure of obesity. One was informed by
the chronic care model and used brief MI format [25], while the other used a patient-centered
approach and group sessions [19]. In contrast, others failed to improve childhood growth trajec-
tories [16, 21, 37]. Such results suggest that even in a healthcare setting, the intensity of the pro-
gram and study population are important considerations for the success of any intervention.
This review identified studies that estimated the health and economic impact of regional
and national SSBs pricing strategies, labeling laws and food marketing policies. These strate-
gies were shown to change purchasing behavior and improve the prevalence of obesity, and
potentially to generate tax revenue, drive the reformulation of unhealthy foods, and change
social norms [42, 44]. Although the population reach and societal-level impact of obesity pre-
vention policies are high, the long-term outcome on the prevalence of early childhood obesity
remains uncertain.
None of the included interventions reported on the costs or cost effectiveness of the study.
The lack of economic evaluations is a surprising finding given that the annual cost of obesity-
related medical spending was estimated to exceed $147 billion [56]. Consistent with our find-
ings, Wolfenden and colleagues [57] noted that 88% of the systematic reviews of obesity pre-
vention intervention in children did not report whether a cost analysis has been conducted. In
the absence of CEA data, a reliable cost threshold could assist stakeholders to determine the
amount of money to spend on obesity prevention interventions. Ma and Frick [48] established
the break-even cost of $339 per child as a “good value” for interventions resulting in a 1%
reduction in childhood obesity prevalence.
There were several limitations to our review. First, our scoping review presented a compre-
hensive overview of the quantity and context of current childhood obesity prevention efforts
in the US, which limits the generalizability of our findings to other countries. Next, our review
did not identify any obesity prevention interventions conducted during pre-pregnancy and
identified very few studies conducted during pregnancy. It is likely that our search strategy
may not have been sensitive enough to identify the full breadth of research activities during
these early life stages. Since we followed standardized methodology for scoping reviews, we
did not assess the effect size of the interventions or systematical evaluate the quality of the
Early childhood obesity prevention efforts: A scoping review
PLOS ONE | https://doi.org/10.1371/journal.pone.0209787 December 28, 2018 20 / 24

individual studies including the risk of bias quality. We acknowledge that many of the studies
were of varying quality based on study design, sample size, intensity, analytical approaches,
high attrition rates and low parent attendance rates. Although we excluded studies judged to
be fatally flawed, our results are subject to a range of biases due to these many threats to the
internal and external validity of the study results. Furthermore, given that studies reporting
positive results are more likely to be published, conclusions may also be subject to publication
bias [44]. Finally, our synthesis was based on interventions reporting a weight-based measure
of growth or weight status in normal weight children. Because we did not consider favorable
behavioral or PA outcomes the generalization of our results may be limited.
Conclusions
This review presents an overview of the current state of obesity prevention efforts across multiple
levels of influence and the early life course in the US. The majority of efforts focused on individual
and interpersonal-level health behavior changes in preschoolers. Thus, there is a need to intensify
obesity preventive efforts during critical periods of health development and target multiple levels
of influence, especially regarding physical, sociocultural and healthcare system-level obesity risk
factors. Furthermore, there is considerable uncertainty around estimates of the economic impacts
of obesity prevention interventions and policies. Future studies should estimate the feasibility,
effectiveness, and cost-effectiveness of obesity prevention interventions and policies. Addressing
these research gaps may provide government agencies, policy makers, and healthcare payers with
the necessary scientific evidence to make informed decisions regarding the allocation of funds for
initiatives aimed at decreasing the prevalence of early childhood obesity.
Supporting information
S1 Appendix. Table of data extraction information for interventions.
(DOCX)
S2 Appendix. Summary of key findings.
(DOCX)
S1 PRISMA. PRISMA checklist.
(DOC)
Acknowledgments
We thank Mina Ghajar (Librarian, George F. Smith Library of the Health Sciences, University
Libraries Rutgers) for her assistance with the literature search strategy.
Author Contributions
Conceptualization: Sheri Volger, Diane Rigassio Radler, Pamela Rothpletz-Puglia.
Data curation: Sheri Volger, Pamela Rothpletz-Puglia.
Formal analysis: Sheri Volger.
Methodology: Sheri Volger, Diane Rigassio Radler, Pamela Rothpletz-Puglia.
Supervision: Diane Rigassio Radler, Pamela Rothpletz-Puglia.
Writing – original draft: Sheri Volger, Diane Rigassio Radler, Pamela Rothpletz-Puglia.
Writing – review & editing: Sheri Volger, Diane Rigassio Radler, Pamela Rothpletz-Puglia.
Early childhood obesity prevention efforts: A scoping review
PLOS ONE | https://doi.org/10.1371/journal.pone.0209787 December 28, 2018 21 / 24
References1. Committee on Accelerating Progress in Obesity Prevention, Food and Nutrition Board, Institute of Medi-
cine; Glickman D, Parker L, Sim LJ, Del Valle Cook H, Miller EA, (eds.). Accelerating Progress in Obe-
sity Prevention: Solving the Weight of the Nation. 2012. Washington, DC: The National Academies
Press. Available from: https://www.ncbi.nlm.nih.gov/books/NBK201141/.
2. Healthy People 2020 [Internet]. U.S. Department of Health and Human Services, Office of Disease Pre-
vention and Health Promotion Washington, DC: [July 27, 2018]. Available from: https://www.
healthypeople.gov/2020/topics-objectives/topic/nutrition-and-weight-status/objectives#4924.
3. White House Task Force on Childhood Obesity Report to the President, Solving the Problem of Child-
hood Obesity. 2010. Office of the President of the United States. Available from https://letsmove.
obamawhitehouse.archives.gov/sites/letsmove.gov/files/TaskForce_on_Childhood_Obesity_
May2010_FullReport.pdf
4. Office of the Surgeon General (US). The Surgeon General’s Vision for a Healthy and Fit Nation. Rock-
ville (MD): Office of the Surgeon General (US); 2010. Available from https://www.ncbi.nlm.nih.gov/
books/NBK44660/.
5. Hales CM, Fryar CD, Carroll MD, Freedman DS, Ogden CL. Trends in obesity and severe obesity prev-
alence in US youth and adults by sex and age, 2007–2008 to 2015–2016. JAMA. 2018; 319(16):1723–
1725. https://doi.org/10.1001/jama.2018.3060 PMID: 29570750
6. Hales CM, Carroll MD, Fryar CD, Ogden CL. Prevalence of obesity among adults and youth: United
States, 2015–2016. NCHS data brief. 2017; 288:1–8.
7. Anderson NB. Levels of analysis in health science. A framework for integrating sociobehavioral and bio-
medical research. Annals of the New York Academy of Sciences. 1998; 840:563–76. PMID: 9629283
8. Halfon N, Hochstein M. Life Course Health Development: An integrated framework for developing
health, policy, and research. The Milbank Quarterly. 2002; 80(3):433–79. https://doi.org/10.1111/1468-
0009.00019 PMID: 12233246
9. National Institute of Health. Nathional Institute on Minority Health and Health Disparities Research
Framework [Available from: https://www.nimhd.nih.gov/about/overview/research-framework.html.
10. Halfon N., Forrest C.B. The Emerging Theoretical Framework of Life Course Health Development. In:
Halfon N., Forrest C., Lerner R., Faustman E. (eds) Handbook of Life Course Health Development.
Springer, Cham; 2018: Chapter 2.
11. Arksey H, O’Malley L. Scoping Studies: towards a methodological framework. International Journal of
Social Research Methodology. 2005; 8(1):19–32.
12. Peters MDJ GC, McInerney P, Baldini Soares C, Khalil H, Parker D. Chapter 11: Scoping reviews.
2017. In: Joanna Briggs Institute Reviewer’s Manual [Internet]. The Joanna Briggs Institute. Available
from: Available from https://reviewersmanual.joannabriggs.org/
13. U.S. Department of Health and Human Services. The Surgeon General’s call to action to prevent and
decrease overweight and obesity. Rockville, MD: U.S. Department of Health and Human Services,
Public Health Service, Office of the Surgeon General; 2001. Available from: https://www.ncbi.nlm.nih.
gov/books/NBK44206/.
14. Dixon-Woods M, Cavers D, Agarwal S, Annandale E, Arthur A, Harvey J, et al. Conducting a critical
interpretive synthesis of the literature on access to healthcare by vulnerable groups. BMC Medical
Research Methodology. 2006; 6:35. https://doi.org/10.1186/1471-2288-6-35 PMID: 16872487
15. Moher D, Liberati A, Tetzlaff J, Altman DG. Preferred reporting items for systematic reviews and meta-
analyses: the PRISMA statement. BMJ (Clinical research ed). 2009; 339:b2535.
16. Gregory EF, Goldshore MA, Henderson JL, Weatherford RD, Showell NN. Infant growth following
maternal participation in a gestational weight management intervention. Childhood Obesity. 2016; 12
(3):219–25. https://doi.org/10.1089/chi.2015.0238 PMID: 27123956
17. Karanja N, Lutz T, Ritenbaugh C, Maupome G, Jones J, Becker T, et al. The TOTS community interven-
tion to prevent overweight in American Indian toddlers beginning at birth: a feasibility and efficacy study.
Journal of Community Health. 2010; 35(6):667–75. https://doi.org/10.1007/s10900-010-9270-5 PMID:
20508978
18. Olson CM, Baker IR, Demment MM, Graham ML, May JJ, Strawderman MS, et al. The healthy start
partnership: an approach to obesity prevention in young families. Family & Community health. 2014; 37
(1):74–85.
19. Machuca H, Arevalo S, Hackley B, Applebaum J, Mishkin A, Heo M, et al. Well Baby Group Care: evalu-
ation of a promising intervention for primary obesity prevention in toddlers. Childhood Obesity. 2016; 12
(3):171–8. https://doi.org/10.1089/chi.2015.0212 PMID: 27035857
Early childhood obesity prevention efforts: A scoping review
PLOS ONE | https://doi.org/10.1371/journal.pone.0209787 December 28, 2018 22 / 24

20. Paul IM, Savage JS, Anzman SL, Beiler JS, Marini ME, Stokes JL, et al. Preventing obesity during
infancy: a pilot study. Obesity. 2011; 19(2):353–61. https://doi.org/10.1038/oby.2010.182 PMID:
20725058
21. Schroeder N, Rushovich B, Bartlett E, Sharma S, Gittelsohn J, Caballero B. Early obesity prevention: a
randomized trial of a practice-based intervention in 0-24-month infants. Journal of Obesity. 2015;
2015:795859. https://doi.org/10.1155/2015/795859 PMID: 26078877
22. Alkon A, Crowley AA, Neelon SE, Hill S, Pan Y, Nguyen V, et al. Nutrition and physical activity random-
ized control trial in child care centers improves knowledge, policies, and children’s body mass index.
BMC Public Health. 2014; 14:215. https://doi.org/10.1186/1471-2458-14-215 PMID: 24580983
23. Annesi JJ, Smith AE, Tennant GA. Reducing high BMI in African American preschoolers: effects of a
behavior-based physical activity intervention on caloric expenditure. Southern Medical Journal. 2013;
106(8):456–9. https://doi.org/10.1097/SMJ.0b013e3182a05bef PMID: 23912139
24. Annesi JJ, Smith AE, Tennant GA. Effects of a cognitive–behaviorally based physical activity treatment
for 4- and 5-Year-old children attending US preschools. International Journal of Behavioral Medicine.
2013; 20(4):562–6. https://doi.org/10.1007/s12529-013-9361-7 PMID: 24114718
25. Cloutier MM, Wiley J, Huedo-Medina T, Ohannessian CM, Grant A, Hernandez D, et al. Outcomes from
a pediatric primary care weight management program: Steps to Growing Up Healthy. The Journal of
pediatrics. 2015; 167(2):372–7.e1. https://doi.org/10.1016/j.jpeds.2015.05.028 PMID: 26073106
26. Davis SM, Myers OB, Cruz TH, Morshed AB, Canaca GF, Keane PC, et al. CHILE: Outcomes of a
group randomized controlled trial of an intervention to prevent obesity in preschool Hispanic and Ameri-
can Indian children. Preventive medicine. 2016; 89:162–8. https://doi.org/10.1016/j.ypmed.2016.05.
018 PMID: 27222162
27. Esquivel M, Nigg CR, Fialkowski MK, Braun KL, Li F, Novotny R. Head Start wellness policy intervention
in Hawaii: a project of the children’s healthy living program. Childhood Obesity. 2016; 12(1):26–32.
https://doi.org/10.1089/chi.2015.0071 PMID: 26771119
28. Fitzgibbon ML, Stolley MR, Schiffer L, Van Horn L, KauferChristoffel K, Dyer A. Two-year follow-up
results for Hip-Hop to Health Jr.: a randomized controlled trial for overweight prevention in preschool
minority children. The Journal of pediatrics. 2005; 146(5):618–25. https://doi.org/10.1016/j.jpeds.2004.
12.019 PMID: 15870664
29. Fitzgibbon ML, Stolley MR, Schiffer L, Van Horn L, KauferChristoffel K, Dyer A. Hip-Hop to Health Jr. for
Latino preschool children. Obesity. 2006; 14(9):1616–25. https://doi.org/10.1038/oby.2006.186 PMID:
17030973
30. Fitzgibbon ML, Stolley MR, Schiffer L, Kong A, Braunschweig CL, Gomez-Perez SL, et al. Family-
based Hip-Hop to Health: outcome results. Obesity. 2013; 21(2):274–83. https://doi.org/10.1002/oby.
20269 PMID: 23532990
31. Haines J, McDonald J, O’Brien A, Sherry B, Bottino CJ, Schmidt ME, et al. Healthy Habits, Happy
Homes: randomized trial to improve household routines for obesity prevention among preschool-aged
children. JAMA Pediatrics. 2013; 167(11):1072–9. https://doi.org/10.1001/jamapediatrics.2013.2356
PMID: 24019074
32. Haines J, Rifas-Shiman SL, Gross D, McDonald J, Kleinman K, Gillman MW. Randomized trial of a pre-
vention intervention that embeds weight-related messages within a general parenting program. Obesity.
2016; 24(1):191–9. https://doi.org/10.1002/oby.21314 PMID: 26638185
33. Kong A, Buscemi J, Stolley MR, Schiffer LA, Kim Y, Braunschweig CL, et al. Hip-Hop to Health Jr. ran-
domized effectiveness trial: 1-year follow-up results. American Journal of Preventive Medicine. 2016;
50(2):136–44. https://doi.org/10.1016/j.amepre.2015.07.008 PMID: 26385162
34. Lumeng JC, Miller AL, Horodynski MA. Improving self-regulation for obesity prevention in Head Start: a
randomized controlled trial. Pediatrics. 2017; 139(5):1–10.
35. Natale RA, Lopez-Mitnik G, Uhlhorn SB, Asfour L, Messiah SE. Effect of a child care center-based obe-
sity prevention program on body mass index and nutrition practices among preschool-aged children.
Health Promotion Practice. 2014; 15(5):695–705. https://doi.org/10.1177/1524839914523429 PMID:
24662896
36. Natale RA, Messiah SE, Asfour LS, Uhlhorn SB, Englebert NE, Arheart KL. Obesity prevention program
in childcare centers: two-year follow-up. American Journal of Health Promotion. 2017; 31(6):502–10.
https://doi.org/10.1177/0890117116661156 PMID: 27630110
37. Sherwood NE, Meghan M, JaKa MS, Crain AL, Martinson BC, Hayes MG, Anderson JD. Pediatric pri-
mary care-based obesity prevention for parents of preschool children: a pilot study. Childhood Obesity.
2015; 11(6):674–82. https://doi.org/10.1089/chi.2015.0009 PMID: 26478951
38. Slusser W, Frankel F, Robison K, Fischer H, Cumberland WG, Neumann C. Pediatric overweight pre-
vention through a parent training program for 2–4 year old Latino children. Childhood Obesity. 2012; 8
(1):52–9. https://doi.org/10.1089/chi.2011.0060 PMID: 22799481
Early childhood obesity prevention efforts: A scoping review
PLOS ONE | https://doi.org/10.1371/journal.pone.0209787 December 28, 2018 23 / 24

39. Sun A, Cheng J, Bui Q, Liang Y, Ng T, Chen J-L. Home-based and technology-centered childhood obe-
sity prevention for Chinese mothers with preschool-aged children. Journal of Transcultural Nursing.
2017; 28(6):616–24.
40. Woo Baidal JA, Nelson CC, Perkins M, Colchamiro R, Leung-Strle P, Kwass JA, et al. Childhood obe-
sity prevention in the women, infants, and children program: Outcomes of the MA-CORD study. Obe-
sity. 2017; 25(7):1167–74. https://doi.org/10.1002/oby.21865 PMID: 28653498
41. Kuo T, Jarosz CJ, Simon P, Fielding JE. Menu labeling as a potential strategy for combating the obesity
epidemic: a health impact assessment. American Journal of Public Health. 2009; 99(9):1680–6. https://
doi.org/10.2105/AJPH.2008.153023 PMID: 19608944
42. Sonneville KR, Long MW, Ward ZJ, Resch SC, Wang YC, Pomeranz JL, et al. BMI and healthcare cost
impact of eliminating tax subsidy for advertising unhealthy food to youth. American Journal of Preven-
tive Medicine. 2015; 49(1):124–34. https://doi.org/10.1016/j.amepre.2015.02.026 PMID: 26094233
43. Dharmasena S, Capps O Jr. Intended and unintended consequences of a proposed national tax on
sugar-sweetened beverages to combat the U.S. obesity problem. Health Economics. 2012; 21(6):669–
94. https://doi.org/10.1002/hec.1738 PMID: 21538676
44. Long MW, Gortmaker SL, Ward ZJ, Resch SC, Moodie ML, Sacks G, et al. Cost effectiveness of a
sugar-sweetened beverage excise tax in the U.S. American Journal of Preventive Medicine. 2015; 49
(1):112–23. https://doi.org/10.1016/j.amepre.2015.03.004 PMID: 26094232
45. Wright DR, Kenney EL, Giles CM, Long MW, Ward ZJ, Resch SC, et al. Modeling the cost effectiveness
of child care policy changes in the U.S. American Journal of Preventive Medicine. 2015; 49(1):135–47.
https://doi.org/10.1016/j.amepre.2015.03.016 PMID: 26094234
46. Toussaint LL, Housholder K, Janssen K, Mansfield A, Lynch BA. Slowing BMI growth trajectories in ele-
mentary school-aged children: The Northeast Iowa Food and Fitness Initiative. Family & Community
Health. 2017; 40(3):192–7.
47. Cradock AL, Barrett JL, Kenney EL, Giles CM, Ward ZJ, Long MW, et al. Using cost-effectiveness anal-
ysis to prioritize policy and programmatic approaches to physical activity promotion and obesity preven-
tion in childhood. Preventive Medicine. 2017; 95 Suppl:S17–s27. https://doi.org/10.1016/j.ypmed.2016.
10.017 PMID: 27773710
48. Ma S, Frick KD. A simulation of affordability and effectiveness of childhood obesity interventions. Aca-
demic Pediatrics. 2011; 11(4):342–50. https://doi.org/10.1016/j.acap.2011.04.005 PMID: 21764018
49. Wright DR, Taveras EM, Gillman MW, Horan CM, Hohman KH, Gortmaker SL, et al. The cost of a pri-
mary care-based childhood obesity prevention intervention. Bmc Health Services Research. 2014;
14:44. https://doi.org/10.1186/1472-6963-14-44 PMID: 24472122
50. Fitzgibbon ML, Stolley MR, Schiffer LA, Braunschweig CL, Gomez SL, Van Horn L, et al. Hip-Hop to
Health Jr. obesity prevention effectiveness trial: postintervention results. Obesity. 2011; 19(5):994–
1003. https://doi.org/10.1038/oby.2010.314 PMID: 21193852
51. Taveras EM, Blaine RE, Davison KK, Gortmaker S, Anand S, Falbe J, et al. Design of the Massachu-
setts Childhood Obesity Research Demonstration (MA-CORD) study. Childhood Obesity. 2015; 11
(1):11–22. https://doi.org/10.1089/chi.2014.0031 PMID: 25469676
52. Taveras EM, Gortmaker SL, Hohman KH, Horan CM, Kleinman KP, Mitchell K, et al. Randomized con-
trolled trial to improve primary care to prevent and manage childhood obesity: the High Five for Kids
study. Archives of Pediatrics & Adolescent Medicine. 2011; 165(8):714–22.
53. Moss B, Yeaton W. Early childhood healthy and obese weight status: potentially protective benefits of
breastfeeding and delaying solid foods. Maternal & Child Health Journal. 2014; 18(5):1224–32.
54. Ward DS, Welker E, Choate A, Henderson KE, Lott M, Tovar A, et al. Strength of obesity prevention
interventions in early care and education settings: A systematic review. Preventive Medicine. 2017; 95
Suppl:S37–s52. https://doi.org/10.1016/j.ypmed.2016.09.033 PMID: 27693295
55. Braveman P, Barclay C. Health disparities beginning in childhood: a life-course perspective. Pediatrics.
2009; 124 Suppl 3:S163–75.
56. Finkelstein EA, Trogdon JG, Cohen JW, Dietz W. Annual medical spending attributable to obesity:
payer-and service-specific estimates. Health Affairs (Project Hope). 2009; 28(5):w822–31.
57. Wolfenden L, Jones J, Williams CM, Finch M, Wyse RJ, Kingsland M, et al. Strategies to improve the
implementation of healthy eating, physical activity and obesity prevention policies, practices or pro-
grammes within childcare services. The Cochrane Database of Systematic Reviews. 2016; 10:
Cd011779. https://doi.org/10.1002/14651858.CD011779.pub2 PMID: 27699761
Early childhood obesity prevention efforts: A scoping review
PLOS ONE | https://doi.org/10.1371/journal.pone.0209787 December 28, 2018 24 / 24