EAP Ensemble Coding in Audition revision...Running head: ENSEMBLE CODING IN AUDITION 3 Ensemble...
23
Running head: ENSEMBLE CODING IN AUDITION 1 Ensemble Coding in Audition Elise A. Piazza, Timothy D. Sweeny, David Wessel, Michael A. Silver, and David Whitney University of California, Berkeley Author Note Elise A. Piazza, Vision Science Program, University of California, Berkeley; Timothy D. Sweeny, Vision Science Program, University of California, Berkeley; David Wessel, Department of Music and Center for New Music and Audio Technologies, University of California, Berkeley; Michael A. Silver, Helen Wills Neuroscience Institute and School of Optometry, University of California, Berkeley; David Whitney, Department of Psychology, University of California, Berkeley. This research was supported by the Department of Defense (DoD) through the National Defense Science and Engineering Graduate Fellowship awarded to Elise A. Piazza, NSF 1245461 to David Whitney, and NEI Core grant EY003176. We thank Aaron Bloch for assistance with data collection and Jason Fischer for providing psychometric curve-fitting code. Correspondence concerning this article should be addressed to Elise Piazza, 360 Minor Hall, University of California, Berkeley, CA, 94720-2020. E-mail: [email protected].
Transcript of EAP Ensemble Coding in Audition revision...Running head: ENSEMBLE CODING IN AUDITION 3 Ensemble...
Running head: ENSEMBLE CODING IN AUDITION
1
Ensemble Coding in Audition
Elise A. Piazza, Timothy D. Sweeny, David Wessel, Michael A. Silver, and David Whitney
University of California, Berkeley
Author Note
Elise A. Piazza, Vision Science Program, University of California, Berkeley; Timothy D.
Sweeny, Vision Science Program, University of California, Berkeley; David Wessel, Department
of Music and Center for New Music and Audio Technologies, University of California,
Berkeley; Michael A. Silver, Helen Wills Neuroscience Institute and School of Optometry,
University of California, Berkeley; David Whitney, Department of Psychology, University of
California, Berkeley.
This research was supported by the Department of Defense (DoD) through the National
Defense Science and Engineering Graduate Fellowship awarded to Elise A. Piazza, NSF
1245461 to David Whitney, and NEI Core grant EY003176. We thank Aaron Bloch for
assistance with data collection and Jason Fischer for providing psychometric curve-fitting code.
Correspondence concerning this article should be addressed to Elise Piazza, 360 Minor
Hall, University of California, Berkeley, CA, 94720-2020. E-mail: [email protected].

Running head: ENSEMBLE CODING IN AUDITION
2
Abstract
In vision, humans use summary statistics (e.g., average facial expression) to efficiently perceive
the “gist” of groups of features. Here, we present direct evidence that ensemble coding is
important for auditory processing. We found that listeners could accurately estimate the mean
frequency of a set of logarithmically spaced pure tones presented in a temporal sequence
(Experiment 1) but that their performance was severely reduced when only a subset of tones
from a given sequence was presented, demonstrating that ensemble coding is based on a
substantial number of the tones in a sequence (Experiment 2). This precise ensemble coding
occurred despite very limited representation of individual tones from the sequence: listeners were
poor at identifying specific individual member tones (Experiment 3) and at determining their
positions in the sequence (Experiment 4). Together, these results indicate that summary
statistical coding is not limited to visual processing and is an important auditory mechanism for
extracting ensemble frequency information from sequences of sounds.
Keywords: ensemble coding; auditory perception; statistical summary; frequency
Running head: ENSEMBLE CODING IN AUDITION
3
Ensemble Coding in Audition
Humans frequently encounter ensembles or groups of objects (e.g., crowds of people,
peaches at a fruit stall, cars in traffic) and are able to quickly process them with ease. However,
the task of rapidly combining numerous features into a coherent percept is an incredible
computational challenge. Because many natural scenes are composed of multiple objects that are
similar and therefore highly redundant, it is efficient for the visual system to compress these
scenes by encoding information about summary statistics instead of features of individual objects
(for a review, see Alvarez, 2011). This ensemble coding has been shown to be important for
perceiving the “gist” of visual scenes, and it occurs across an impressive variety of visual
features. For example, humans can quickly extract the average size (Ariely, 2001; Chong &
Treisman, 2003), brightness (Bauer, 2009), orientation (Parkes, Lund, Angelucci, Solomon, &
Morgan, 2001), location (Alvarez & Oliva, 2008), color (de Gardelle & Summerfield, 2011),
speed (Watamaniuk & Duchon, 1992), and motion direction (Williams & Sekuler, 1984) of a set
of objects. Humans can even extract the mean emotion, gender (Haberman & Whitney, 2007),
identity (de Fockert & Wolfenstein, 2009), and biological motion (Sweeny, Haroz, & Whitney,
in press) of a crowd of people. Summary statistics in vision are computed across both space and
time (Albrecht & Scholl, 2010; Haberman, Harp, & Whitney, 2009), and certain temporal
properties of a visual sequence (such as its overall duration) can impact its summary
representation (Haberman et al., 2009).
Although ensemble coding is an important and widely studied phenomenon in vision,
little is known regarding ensemble representations in other sensory domains. Auditory scene
analysis is an extremely difficult task because the brain must segregate multiple streams of
information and assign them to distinct objects, even though they often overlap in pitch, time,
Running head: ENSEMBLE CODING IN AUDITION
4
and space (Bregman & Campbell, 1971; Bregman, 1990; Micheyl & Oxenham, 2010). There is
some evidence for statistical processing of auditory ensembles: statistical information in tone
sequences influences the phonetic categorization of subsequent speech sounds (Holt, 2006), and
McDermott and Simoncelli (2011) have reported time-averaged statistical processing of sound
textures in the auditory periphery (although at a very fine, sub-second timescale, involving
statistics of activation of individual cochlear channels). In addition, humans can estimate the
mean frequency from a series of tones (Albrecht, Scholl, & Chun, 2012), but it is not known how
many of the tones subjects use to make their estimate and to what extent this ability is based on
encoding of individual tones as opposed to a summary statistic. In particular, no previous studies
have measured the efficiency of listeners’ estimates of the mean frequency of auditory sequences
and compared them to their memory of individual tones in the sequence. Given the importance of
ensemble coding for vision, we hypothesized that it would also be present in auditory processing.
Research on auditory statistical learning has shown that listeners can acquire statistical
information from tone sequences that are repeated multiple times (Saffran et al., 1999; Loui,
Wessel, & Hudson-Kam, 2010). In addition, many years of exposure to the statistics inherent in
speech in a particular linguistic community can subsequently influence one’s perceptual
interpretation of ambiguous sounds, such as the tritone paradox (Deutsch, 1991; Dolson, 1994).
However, this type of statistical learning is fundamentally distinct from statistical “gist”
perception. The former involves the acquisition of statistical information from an assortment of
sounds heard previously over a prolonged training period, whereas the latter refers to listeners’
nearly instantaneous, moment-to-moment extraction of summary statistics from a given sensory
environment. In an experimental setting, statistical summary perception of an auditory stimulus
would occur within a single experimental trial.

Running head: ENSEMBLE CODING IN AUDITION
5
We hypothesized that summary statistical representation of frequency information in
auditory scenes may be an important property of auditory perception, and we designed several
experiments to assess whether there is ensemble coding in audition. Specifically, we assessed
whether listeners could extract the mean frequency (on a logarithmic scale) of a tone sequence
despite limited access to information about the individual tones that comprise the sequence.
Experiment 1: Listeners Extract the Mean Frequency of Auditory Sequences
Method
Listeners. 23 listeners (four male, ages 18-34) participated in the experiment, all of
whom were affiliates of the University of California, Berkeley. Listeners gave informed consent
to participate in the experiment and were compensated for their time. All experimental
procedures were approved by the Committee for the Protection of Human Subjects at the
University of California, Berkeley. All listeners had normal hearing, and none had absolute pitch
(self-report). On average, listeners had 7.8 years of musical training (SD = 5.8) and initiated
training at age 7.7 (SD = 2.8).
All but two listeners were naïve as to the purpose of the experiments. In our study,
“naïve” means that the listeners were given no information about the hypotheses, methods, or
any other aspects of the study before beginning the experiment. For participants who completed
more than one experiment, they were unaware of the methods of each individual experiment
until the beginning of the experimental procedures and were not given information about the
overall purpose or hypotheses of the study until data collection was complete.
To eliminate effects of experiment order on performance, we counterbalanced the order
in which participants completed the different experiments throughout the study (for those
Running head: ENSEMBLE CODING IN AUDITION
6
subjects who participated in multiple experiments), except for eleven of the participants in
Experiment 1, who were added after the original round of counterbalanced data collection and
had already participated in Experiment 2.
Stimuli and procedure. We assessed listeners’ abilities to estimate the mean (log)
frequency of a temporal sequence of six pure tones. All stimuli were sine wave tones (Figure 1)
generated in MATLAB and presented at a comfortable listening level via closed headphones. In
each trial, the mean frequency of the sequence was randomly chosen from the range 110 to
1174.7 Hz (A2 to D6 on a piano keyboard; darkest shaded area in Figure 1). The individual tones
in each sequence were chosen from a wider range of fifty-two possible tones (82.4 Hz to 1568
Hz; E2 to G6) and were always -5, -3, -1, +1, +3, or +5 semitone units from the mean. Thus, all
tones in the sequence were separated by at least two semitones, an interval that greatly exceeds
normal two-tone discrimination thresholds for successive pure tones (Moore, 2004), which we
confirmed in a preliminary experiment. In addition, no two members of a sequence were ever
more than one octave apart, thereby eliminating possible octave confusions. We chose a
logarithmic (i.e., semitone, or musical) spacing between tones because auditory frequency
discrimination of pure tones follows an approximately logarithmic scale (Moore, 2004), and
results from a preliminary experiment indicated that listeners tend to report that the logarithmic
mean sounds more like the true “mean” of a sequence of pure tones than the linear mean. From
here onward, the term “mean frequency” will be used to refer to mean frequency on a
logarithmic (semitone) scale.
Each trial consisted of two intervals—“sequence” and “test”—which were always
separated by a 500 ms silent interval. During the “sequence” interval, the six tones in the
sequence were played in random order, each for 300 ms with a 100 ms pause between successive
Running head: ENSEMBLE CODING IN AUDITION
7
tones. In the subsequent “test” interval, a single comparison tone was played for 300 ms, and
listeners reported whether this tone was higher or lower than the mean frequency of the sequence
(two alternative forced choice; 2AFC). Test tones differed from the true sequence mean by +/-5,
+/-3, +/-2, +/-1, or +/- 0.5 semitones. Measuring discrimination between the mean frequency of
the sequence and the test tone across this range of differences allowed us to determine how
precisely listeners could estimate the mean frequency. The frequency difference between the test
tone and the mean of the sequence was counterbalanced across trials. Listeners completed either
300 or 240 trials over two runs. No feedback was provided in any of the experiments.
Results
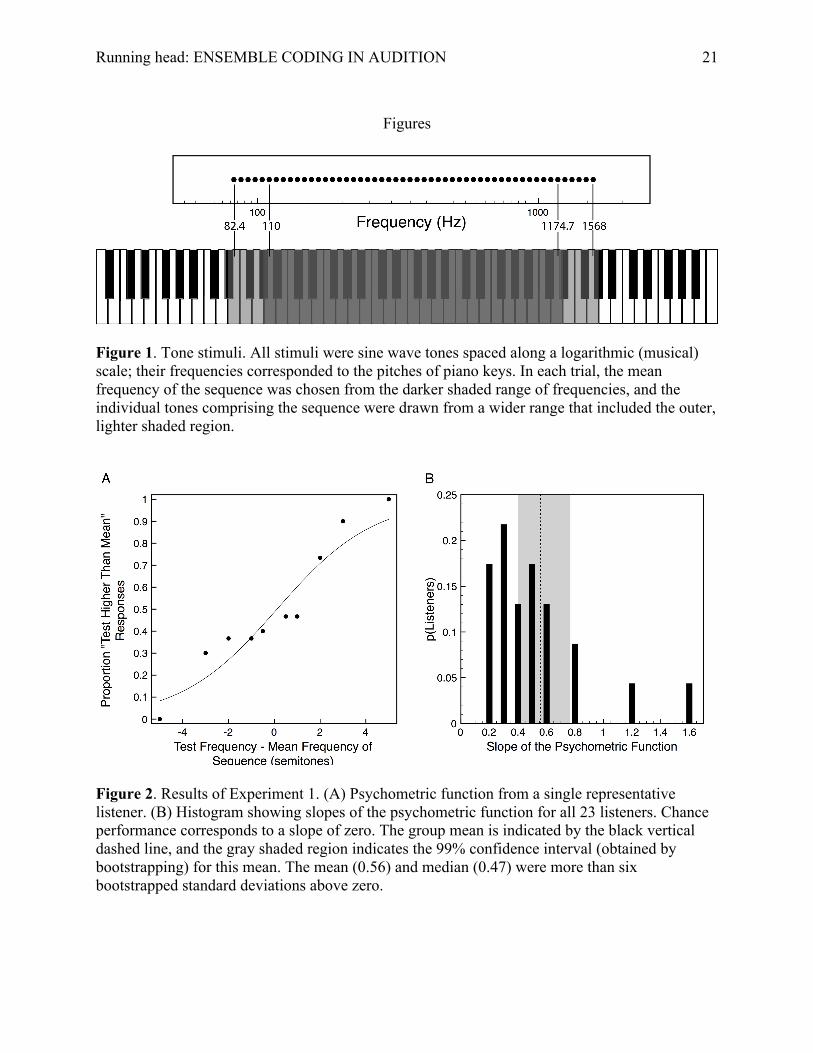
We fit a psychometric function to each listener’s data (Figure 2A) using a logistic
equation. For each psychometric function, we generated a bootstrapped distribution of model fit
parameter values by resampling the data with replacement 1,000 times and fitting a new curve
for each iteration (as in Fischer and Whitney, 2011) to obtain a bootstrapped slope for each
listener, corresponding to the listener’s sensitivity for estimating the mean frequency of the
sequence. Higher slopes indicate better discrimination of mean frequency. If listeners were
completely unable to discriminate the mean frequency of the sequence from the test tone, the
slope of the psychometric function would be zero. Every individual listener performed
significantly above chance (least significant was slope = 0.21, with more than 99% of the
bootstrapped estimates > 0).
As a group, listeners performed above chance in reporting whether a test tone was higher
or lower than the mean frequency of the preceding sequence (Figure 2B; One-Sample Wilcoxon
Signed Ranks Test, p < .001, Cohen’s d = 1.60). These data indicate that listeners could estimate
the mean frequency of the sequence, consistent with the findings of Albrecht, Scholl, & Chun
Running head: ENSEMBLE CODING IN AUDITION
8
(2012). However, it is unclear how many of the tones in the sequence contributed to this estimate
and whether this estimate relied on explicit memory of each of the tones. In Experiment 2, we
determined the number of tones that contributed to listeners’ mean estimates by varying the
proportion of tones that were presented from each sequence. In Experiments 3 and 4, we
measured listeners’ memory capacity for the frequency and position of individual tones in the
sequence.
Experiment 2: Listeners’ Estimates of the Mean Incorporate a Substantial Number of the
Tones in a Sequence
In Experiment 2, we tested the hypothesis that listeners use multiple tones to estimate the
mean frequency of a sequence of tones — ensemble coding. This experiment is necessary to rule
out the possibility that in Experiment 1, listeners used only a single tone (and simply ignored or
disregarded the other five tones) to estimate the average, which could have resulted in some
ability to estimate mean frequency but would not constitute summary statistical perception. This
concern has been important in the study of visual summary statistics (e.g., Myczek & Simons,
2008), and it is equally important in this investigation.
To directly test whether estimates were based on multiple tones, we restricted the number
of tones that listeners could use to estimate the mean frequency of the full 6-tone sequence.
Specifically, we generated 6-tone sequences as in Experiment 1, and on a given trial, either a
subset of tones from the full sequence (1, 2, or 4) or all 6 tones were presented. We asked
whether a listener’s percept of the average frequency improves when more information about
that average is available. If a listener’s estimate of the mean frequency improves with increasing
number of presented tones, this would indicate that they use those additional tones in their

Running head: ENSEMBLE CODING IN AUDITION
9
ensemble judgment. Because a single randomly selected tone from the sequence is a poor
representative of the full 6-tone sequence, we expected estimates of the mean to be poor when
only one tone was presented. If listeners integrate multiple tones into an ensemble code, then
estimates of mean frequency should improve when more tones are presented from the full
sequence (e.g., 2, 4, or all 6), as these tones provide more information about the ensemble
average. Alternatively, if listeners rely on only a single tone to estimate the mean even when
more than one tone from the full sequence are presented, then behavioral performance should not
vary as a function of the proportion of presented tones in each sequence.
Method
Listeners. 11 listeners (two male, ages 24-34) from the University of California,
Berkeley gave informed consent to participate in the experiment and were compensated for their
time. All had normal hearing, and none had absolute pitch (self-report). On average, listeners had
10.1 years of musical training (SD = 4.9) and initiated training at age 7.0 (SD = 1.8). All listeners
also participated in Experiment 1, and all but two listeners were naïve regarding the purpose of
the experiment.
Stimuli and procedure. All sequences were generated as in Experiment 1 (with 6 tones),
but we varied how many of those 6 tones were presented from each sequence—1, 2, 4, or all 6 of
the tones. As in Experiment 1, each sequence was followed by a single test tone, differing from
the true mean of the full sequence of 6 tones by +/-5, +/-3, +/-2, +/-1, or +/- 0.5 semitones. The
number of presented tones and the frequency difference between the test tone and the mean of
the full sequence were counterbalanced across trials. Listeners were told to use any strategy to
determine whether the test tone was higher or lower than the average frequency of the sequence.
The correct mean was always defined as the mean of the full sequence (including those tones that
Running head: ENSEMBLE CODING IN AUDITION
10
were not presented, for trials with only 1, 2, or 4 tones). On trials in which only 1 tone was
presented, the correct mean was never equal to the single tone. All listeners completed 880 trials
over 4 runs.
Results
Listeners performed the same task as in Experiment 1, but only a subset of the full tone
sequence was presented on each trial (1, 2, 4, or all 6 tones). We fit psychometric functions to the
data for each of the four conditions (1, 2, 4, or 6 tones) using the same method as in Experiment
1 and compared slopes across the four conditions (Figure 3). The average slope for the 6-tone
condition was significantly greater than the slope for the 1-tone (Wilcoxon Signed Ranks Test, p
< .01, Cohen’s d = .71) and the 2-tone condition (p < .05, Cohen’s d = .57), but it was not
significantly greater than the slope for the 4-tone condition (p = .50). This indicates that listeners
integrated over a substantial number (at least 3) of the tones, and it shows that encoding only 1 or
2 tones was insufficient to achieve optimal estimation of the mean frequency of the full 6-tone
sequence. In other words, listeners used an ensemble code to estimate the mean frequency of the
sequence. For those listeners who participated in both Experiment 1 and Experiment 2, we found
very high test-retest reliability of slopes for the identical 6-tone conditions in the two
experiments (Cronbach’s alpha = .94; maximum alpha value is 1; Cronbach, 1951).
Experiment 3: Listeners Do Not Reliably Encode Individual Frequencies in a Sequence
Experiment 2 demonstrated that listeners used at least three tones to make estimates of
mean frequency. It is possible that rather than encoding a summary statistic, listeners estimated
the mean frequency by employing an auditory working memory strategy that involved encoding
the individual tones. Auditory working memory capacity has been widely studied (Miller, 1956;
Running head: ENSEMBLE CODING IN AUDITION
11
Crowder, 1993), and recency effects on tone memory are well-known and robust (Crowder,
1993). In Experiments 3 and 4, we measured how many tones listeners could remember from the
same stimuli that were used in Experiments 1 and 2. Specifically, we tested whether listeners
could accurately identify the frequency or position of individual tones within the sequence. Poor
performance on these tasks would suggest that the ensemble code is formed implicitly, without
access to individual tones.
Method
Listeners. Ten listeners (five listeners from Experiment 1, two listeners from both
Experiments 1 and 2, and three additional listeners) participated in Experiment 3. All listeners
(six male, ages 18-33) gave informed consent to participate in the experiment and were
compensated for their time. All listeners had normal hearing, and none had absolute pitch (self-
report). On average, listeners had 5.2 years of musical training (SD = 5.3) and initiated training at
age 7.4 (SD = 3.6). All but one listener were naïve as to the purpose of the experiment.
Stimuli and procedure. The sequences were generated and presented in exactly the
same way as in Experiment 1, except that each “test” interval contained two comparison tones
(each with a 300-ms duration and separated by 100 ms): a member of the sequence and a new
lure tone that differed by at least 1 semitone (well above the just-noticeable difference for
frequency) from any member of the sequence. The temporal order of the lure and the target was
counterbalanced across trials. Listeners reported which of the two tones was a member of the
sequence (2AFC). All listeners completed 192 trials over two runs.
Results
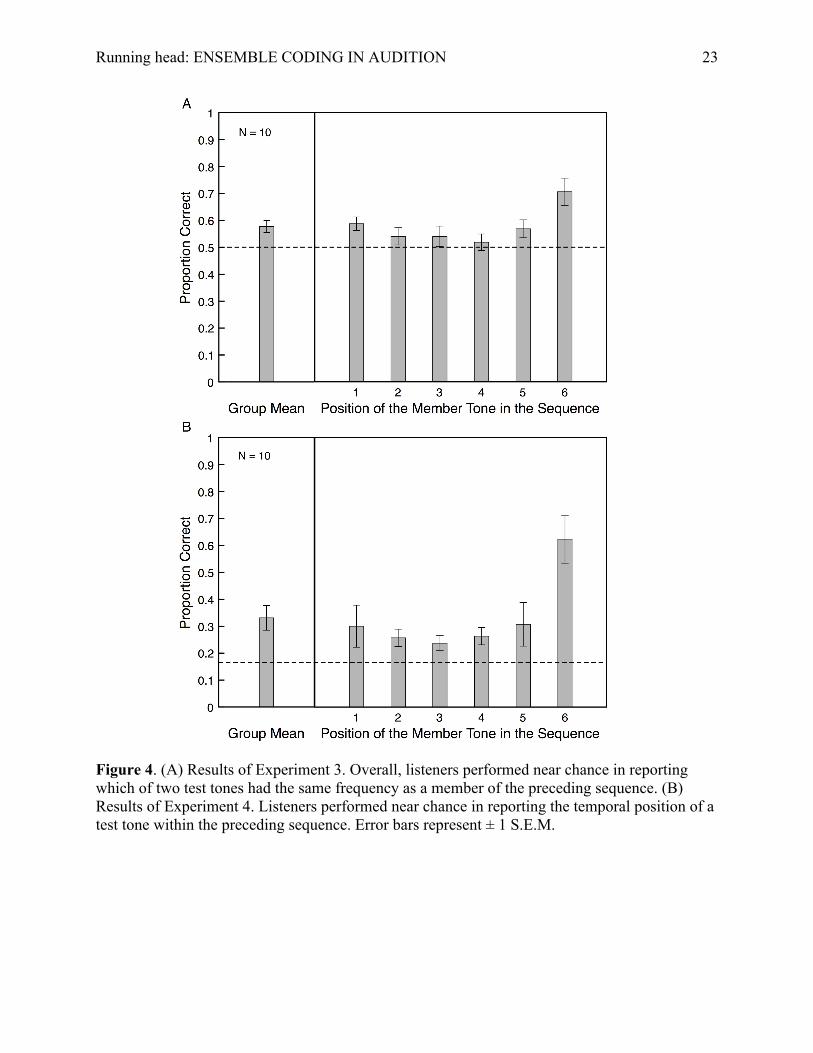
When asked to identify which of two test tones was present in the preceding sequence,
listeners performed significantly, but only slightly, above chance levels (Figure 4A; One-Sample
Running head: ENSEMBLE CODING IN AUDITION
12
Wilcoxon Signed Ranks Test, p < .05, Cohen’s d = 1.12), indicating limited access to frequency
information about individual tones in the sequence. We estimated the mean number of tones that
were effectively accessible to the listener at the time of report, assuming a linear relationship
between number of remembered tones and percentage correct. Specifically, we divided the
difference between perfect and chance performance (100% - 50% = 50%) by the number of tones
in the sequence (6), resulting in 8.3%. A performance level of 58.3%, or 8.3% above chance
(8.3% + 50% = 58.3%), is consistent with representation of a single tone, performance of 66.6%
(8.3% + 8.3% + 50% = 66.6%) corresponds to representation of two tones, etc. Our listeners’
average accuracy rate was 57.7%, or 7.7% above chance. By dividing 7.7% by 8.3% (which
corresponds to representation of one tone), we determined that on average, listeners had access to
approximately one of the individual tones in the sequence (0.93 tones, SEM = 0.26) at the time of
report, a number that is insufficient to explain the mean discrimination accuracy in Experiments
1 and 2 (see Discussion).
Experiment 4: Listeners Cannot Reliably Identify a Single Tone’s Position Within a
Sequence
Method
Listeners. Ten individuals from Experiment 1 (including four from Experiment 3 and
none from Experiment 2) participated in Experiment 4. All listeners (two male, ages 18-24) gave
informed consent to participate in the experiment and were compensated for their time. All
listeners had normal hearing, and none had absolute pitch (self-report). On average, listeners had
4.3 years of musical training (SD = 5.6) and initiated training at age 9.1 (SD = 3.7). All listeners
were naïve as to the purpose of the experiment.
Running head: ENSEMBLE CODING IN AUDITION
13
Stimuli and procedure. The method of generating and presenting the sequences was the
same as in Experiment 1, except the “test” stimulus was always one of the tones from the
sequence. Listeners were asked to identify the position (1-6) of the test tone in the preceding 6-
tone sequence (6AFC). Listeners completed 180 trials over two runs.
Results
Overall, listeners correctly identified the position of the test tone in the sequence 33.1%
of the time, slightly but significantly above chance (Figure 4B; One-Sample Wilcoxon Signed
Ranks Test, p < .01, Cohen’s d = 1.14). As in Experiment 3, we estimated the mean number of
tones that were accessible to the listener at the time of report. To do this, we again divided the
difference between perfect and chance performance (100% - 16.6% = 83.4%) by the number of
tones (6), resulting in 13.9%. A performance level of 30.5%, or 13.9% above chance (13.9% +
16.6% = 30.5%), is consistent with representation of a single tone, performance of 44.4% (13.9%
+ 13.9% + 16.6% = 44.4%) corresponds to representation of two tones, etc. The fact that actual
performance was only 33.1% indicates that, on average, listeners had access to the position of
approximately one of the individual tones in the sequence (1.18 tones, SEM = 0.33) at the time of
report. This is remarkably consistent with Experiment 3 (in particular, a bootstrapped
permutation test indicated no significant difference between the mean number of accessible tones
in the two experiments, p > .20). In conclusion, both Experiments 3 and 4 indicate that listeners
have access to approximately one tone. This very limited auditory working memory capacity for
the tone sequences we have employed cannot account for the discrimination performance in
Experiments 1 and 2 (see Discussion).
We also found a significant recency effect: listeners were significantly more likely to
successfully report the position of the test tone when it was the final tone in the sequence
Running head: ENSEMBLE CODING IN AUDITION
14
compared to when the test tone position was any of the first five tones (Related-Samples
Wilcoxon Signed Ranks Test; after Bonferroni correction, p < .05 for all five comparisons).
Together, the results of Experiments 3 and 4 indicate that listeners’ ability to report information
about the frequencies of individual tones in the sequence was severely limited.
Discussion
Our results provide the first direct evidence of ensemble coding in the auditory domain.
Listeners reliably estimated the mean frequency of a sequence of six sinewave tones. This ability
was severely reduced when we restricted the proportion of these six tones that were presented to
listeners, indicating that ensemble coding occurred over a substantial number (at least three) of
the tones in the sequence. This finding rules out cognitive strategies for estimating the mean
frequency such as basing judgments on a single tone in the sequence. Listeners performed poorly
when asked to identify either the frequency or the position of individual tones in a sequence,
indicating that the ensemble code was not based on explicit memory of the individual tones that
comprised the sequence. Instead, listeners’ representations of those tones were transformed into a
concise summary representation of the mean frequency.
Previous work on visual statistical summary demonstrates that the number of items in a
set that subjects can integrate is equal to approximately the square root of the total set size
(Dakin, 2001). Experiment 2 showed that listeners used at least 3 out of the 6 tones in a sequence
to estimate the mean, a value that is generally consistent with √N (i.e., √6 is ~2.5). Future work
using sequences with a greater number of tones will help elucidate whether, as in vision, this
square-root relationship holds for various lengths of auditory sequences.

Running head: ENSEMBLE CODING IN AUDITION
15
Auditory frequencies convey crucial information in various social contexts, and ensemble
coding of frequency may provide a computationally efficient means of obtaining perceptual
information that is essential for communication. Pitch is an important social cue in speech
processing: it can indicate emotional tone (Curtis & Bharucha, 2010; Fairbanks & Provonost,
1939), level of interest (Wennerstrom, 2001), gender (Abitbol, Abitbol, & Abitbol, 1999), and
even sexual infidelity (O’Connor, Re, & Feinberg, 2011). For instance, the frequency of a single
pure tone can influence the perceived gender of a visually androgynous face (Smith,
Grabowecky, & Suzuki, 2007). In the natural world, auditory information is broadband,
containing multiple frequencies. Here, we show that humans can accurately perceive ensemble
frequency even when information about individual frequencies is not explicitly encoded. Given
that natural environments and stimuli, including speech, contain complex sequences of pitches
comprised of multiple frequencies, our ability to encode ensemble frequency may have evolved
to facilitate perception of social stimuli.
Ensemble frequency encoding may also be a fundamental mechanism underlying music
processing, even in individuals without music training. When we hear a tonal sequence (i.e., a
melody in a particular key, like E Major), statistical likelihood and hierarchical pitch schemas
constrain our understanding of which pitches belong in the sequence, and which do not
(Krumhansl & Kessler, 1982; Krumhansl, 1990; Krumhansl & Cuddy, 2010; Temperley, 2007).
Even listeners without musical training can reliably judge how well a given pitch fits into a
particular key context (Krumhansl & Kessler, 1982). Our results extend these findings by
showing that statistical mechanisms are also involved in the perception of sequences that are not
traditionally tonal (i.e., not belonging to a single major or minor key). This gist encoding was
independent of musical training (we found no significant correlation between musical training
Running head: ENSEMBLE CODING IN AUDITION
16
and performance in any of our experiments), suggesting the operation of a basic mechanism for
rapidly perceiving an ensemble of tones.
We have shown that ensemble coding is a powerful mechanism for perceiving the
auditory environment, and we propose that perceiving auditory “gist” may be critical for social
interactions and music perception. Our findings demonstrate that ensemble coding is a useful
strategy beyond the visual domain and may represent a general mechanism for efficient
representation of the environment.
Running head: ENSEMBLE CODING IN AUDITION
17
References
Abitbol, J., Abitbol, P., & Abitbol, B. (1999). Sex hormones and the female voice. Journal of
Voice, 13, 424-446.
Albrecht, A., & Scholl, B. (2010). Perceptually averaging in a continuous world: extracting
statistical summary representations over time. Psychological Science, 21, 560-567.
Albrecht, A., Scholl, B., & Chun, M. (2012). Perceptual averaging by eye and ear: computing
summary statistics from multimodal stimuli. Attention, Perception, & Psychophysics, 74,
810-815.
Alvarez, G. (2011). Representing multiple objects as an ensemble enhances visual cognition.
Trends in Cognitive Sciences, 15, 122-131.
Alvarez, G., & Oliva, A. (2008). The representation of simple ensemble visual features outside
the focus of attention. Psychological Science, 19, 392-398.
Ariely, D. (2001). Seeing sets: representation by statistical properties. Psychological Science,
12, 157-162.
Bauer, B. (2009). Does Steven’s power law for brightness extend to perceptual brightness
averaging? Psychological Record, 59, 171-186.
Bregman, A. S., & Campbell, J. (1971). Primary auditory stream segregation and perception of
order in rapid sequences of tones. Journal of Experimental Psychology, 89, 244-249.
Bregman, A. S. (1990). Auditory scene analysis. Cambridge, Massachusetts: MIT Press.
Chong, S., & Treisman, A. (2003). Representation of statistical properties. Vision Research, 43,
393-404.
Cronbach, L. J. (1951). Coefficient alpha and the internal structure of tests. Psychometrika,
16, 297-334.

Running head: ENSEMBLE CODING IN AUDITION
18
Crowder, R. G. (1993). Auditory memory. In S. McAdams & E. Bigand (Eds.), Thinking in
sound: The cognitive psychology of human audition (pp. 113-145). Oxford: Clarendon
Press.
Curtis, M. E., & Bharucha, J. J. (2010). The minor third communicates sadness in speech,
mirroring its use in music. Emotion, 10, 335-348.
Dakin, S. (2001). Information limit on the spatial integration of local orientation signals. Journal
of the Optical Society of America, A, 18, 1016-1026.
de Gardelle, V., & Summerfield, C. (2011). Robust averaging during perceptual judgment.
Proceedings of the National Academy of Sciences, USA, 108, 13341-13346.
de Fockert, J., & Wolfenstein, C. (2009). Rapid extraction of mean identity from sets of faces.
The Quarterly Journal of Experimental Psychology, 62, 1716-1722.
Deutsch, D. (1991). The tritone paradox: An influence of language on music perception. Music
Perception, 8, 335-347.
Dolson, M. (1994). The pitch of speech as a function of linguistic community. Music Perception,
11, 321-331.
Fairbanks, G., & Provonost, W. (1939). An experimental study of the pitch characteristics of the
voice during the expression of emotion. Speech Monographs, 6, 87-104.
Fischer, J., & Whitney, D. (2011). Object-level visual information gets through the bottleneck
of crowding. Journal of Neurophysiology, 106, 1389-1398.
Haberman, J., & Whitney, D. (2007). Rapid extraction of mean emotion and gender from sets
of faces. Current Biology, 17, 751-753.
Haberman, J., Harp, T., & Whitney, D. (2009). Averaging facial expression over time. Journal of
Vision, 9, 1-13.
Running head: ENSEMBLE CODING IN AUDITION
19
Holt, L. (2006). The mean matters: effects of statistically defined nonspeech spectral
distributions on speech categorization. Journal of the Acoustical Society of America, 120,
2801-2817.
Krumhansl, C. L., & Kessler, E. J. (1982). Tracing the dynamic changes in perceived tonal
organization in a spatial representation of musical keys. Psychological Review, 89, 334-
368.
Krumhansl, C. L. (1990). Cognitive foundations of musical pitch. New York, NY: Oxford
University Press.
Krumhansl, C. L., & Cuddy, L. L. (2010). A theory of tonal hierarchies in music. In M. R. Jones,
R. R. Fay, & A. N. Popper (Eds.), Music perception (pp. 51-87). New York: Springer.
Loui, P., Wessel, D. L., & Hudson-Kam, C. L. (2010). Humans rapidly learn grammatical
structure in a new musical scale. Music Perception, 27, 377-388.
McDermott, J. H., & Simoncelli, E. P. (2011). Sound texture perception via statistics of the
auditory periphery: evidence from sound synthesis. Neuron, 71, 926-940.
Micheyl, C., & Oxenham, A. J. (2010). Pitch, harmonicity and concurrent sound segregation:
psychoacoustical and neurophysiological findings. Hearing Research, 266, 36-51.
Miller, G. A. (1956). The magical number seven, plus or minus two: some limits on our capacity
for processing information. Psychological Review, 63, 81-97.
Moore, B. C. J. (2004). An introduction to the psychology of hearing (5th ed.). London,
England: Elsevier.
Myczek, K., & Simons, D. J. (2008). Better than average: Alternatives to statistical summary
representations for rapid judgments of average size. Perception & Psychophysics, 70,
772-788.
Running head: ENSEMBLE CODING IN AUDITION
20
O’Connor, J., Re, D. E., & Feinberg, D. R. (2011). Voice pitch influences perceptions of sexual
infidelity. Evolutionary Psychology, 9, 64-78.
Parkes, L., Lund, J., Angelucci, A., Solomon, J., & Morgan, M. (2001). Compulsory averaging
of crowded orientation signals in human vision. Nature Neuroscience, 4, 739-744.
Saffran, J. R., Johnson, E. K., Aslin, R. N., & Newport, E. L. (1999). Statistical learning of tone
sequences by human infants and adults. Cognition, 70, 27-52.
Smith, E. L., Grabowecky, M., & Suzuki, S. (2007). Auditory-visual crossmodal integration in
perception of face gender. Current Biology, 17, 1680-1685.
Sweeny, T. D., Haroz, S., & Whitney, D. (In Press). Perceiving group behavior: Sensitive
ensemble coding mechanisms for biological motion of human crowds. Journal of
Experimental Psychology: Human Perception and Performance.
Temperley, D. (2007). Music and probability. Cambridge, Massachusetts: MIT Press.
Watamaniuk, S. N. J., & Duchon, A. (1992). The human visual system averages speed
information. Vision Research, 32, 931-941.
Wennerstrom, A. K. (2001). The music of everyday speech: Prosody and discourse analysis.
Oxford, England: Oxford University Press.
Williams, D. W., & Sekuler, R. (1984). Coherent global motion percepts from stochastic local
motions. Vision Research, 24, 55-62.
Running head: ENSEMBLE CODING IN AUDITION
21
Figures
Figure 1. Tone stimuli. All stimuli were sine wave tones spaced along a logarithmic (musical) scale; their frequencies corresponded to the pitches of piano keys. In each trial, the mean frequency of the sequence was chosen from the darker shaded range of frequencies, and the individual tones comprising the sequence were drawn from a wider range that included the outer, lighter shaded region.
Figure 2. Results of Experiment 1. (A) Psychometric function from a single representative listener. (B) Histogram showing slopes of the psychometric function for all 23 listeners. Chance performance corresponds to a slope of zero. The group mean is indicated by the black vertical dashed line, and the gray shaded region indicates the 99% confidence interval (obtained by bootstrapping) for this mean. The mean (0.56) and median (0.47) were more than six bootstrapped standard deviations above zero.

Running head: ENSEMBLE CODING IN AUDITION
22
Figure 3. Results of Experiment 2. Overall mean estimation was significantly better for trials with presentation of all 6 tones in a sequence compared to trials in which only 1 or 2 of the 6 tones were presented. Error bars represent ± 1 S.E.M.
Running head: ENSEMBLE CODING IN AUDITION
23
Figure 4. (A) Results of Experiment 3. Overall, listeners performed near chance in reporting which of two test tones had the same frequency as a member of the preceding sequence. (B) Results of Experiment 4. Listeners performed near chance in reporting the temporal position of a test tone within the preceding sequence. Error bars represent ± 1 S.E.M.