ealth Status eport 2014 - Sac County DHHS Health Status Report – Sacramento County 2014 i Table of...
82
Community Health Status Report 2014
Transcript of ealth Status eport 2014 - Sac County DHHS Health Status Report – Sacramento County 2014 i Table of...
Community Health Status Report
2014

Community Health Status Report 2014
A Description of the Health Status and Mortality Experience of Sacramento County Residents
Prepared by:
Helen Zheng, MPH Jake Pry, MPH
Helena Chung, MPH Cassius Lockett, PhD
Kasirye, Olivia C., MD, MS
To obtain additional copies of this report (or make suggestions), please contact:
Sacramento County Department of Health and Human Services
Public Health Division Disease Control and Epidemiology Unit
7001‐A East Parkway, Suite 600 Sacramento, CA 95823
Phone: 916‐875‐5881 TTY: 877‐835‐2929
Website: www.scph.com

Community Health Status Report – Sacramento County 2014 i
Table of Contents Table of Content
MESSAGE FROM THE HEALTH OFFICER ...................................................................................................................................................................................................... III
MISSION, VISION AND VALUES .................................................................................................................................................................................................................. IV
INTRODUCTION .......................................................................................................................................................................................................................................... V
EXECUTIVE SUMMARY .............................................................................................................................................................................................................................. VI
DEMOGRAPHICS ........................................................................................................................................................................................................................................ 1
SACRAMENTO COUNTY POPULATION ............................................................................................................................................................................................................................... 1 POPULATION BY GENDER ............................................................................................................................................................................................................................................... 2 POPULATION BY RACE AND ETHNICITY .............................................................................................................................................................................................................................. 3
LIFE EXPECTANCY ....................................................................................................................................................................................................................................... 5
SOCIAL DETERMINANTS OF HEALTH ........................................................................................................................................................................................................... 7
OCCUPATION .............................................................................................................................................................................................................................................................. 7 UNEMPLOYMENT ......................................................................................................................................................................................................................................................... 8 EDUCATION ................................................................................................................................................................................................................................................................ 9 POVERTY LEVELS ........................................................................................................................................................................................................................................................ 11 LIVING WAGE ........................................................................................................................................................................................................................................................... 12 HEALTH INSURANCE ................................................................................................................................................................................................................................................... 13 TRANSPORTATION ...................................................................................................................................................................................................................................................... 14 YOUTH PHYSICAL FITNESS ............................................................................................................................................................................................................................................ 15
BIRTHS ...................................................................................................................................................................................................................................................... 16
BIRTH RATES ............................................................................................................................................................................................................................................................. 17 POPULATION COMPARISON: BIRTHS BY RACE AND ETHNICITY ............................................................................................................................................................................................. 18 FERTILITY RATES ........................................................................................................................................................................................................................................................ 19 TEENAGE BIRTHS ....................................................................................................................................................................................................................................................... 20 ENTRY INTO PRENATAL CARE ........................................................................................................................................................................................................................................ 22 LOW BIRTH WEIGHT................................................................................................................................................................................................................................................... 24 PREMATURE BIRTHS ................................................................................................................................................................................................................................................... 25 PAYMENT SOURCE FOR DELIVERY .................................................................................................................................................................................................................................. 26

Community Health Status Report – Sacramento County 2014 ii
Table of Contents
COMMUNICABLE DISEASES ....................................................................................................................................................................................................................... 27
MOST FREQUENTLY REPORTED COMMUNICABLE DISEASES ................................................................................................................................................................................................ 27 AIDS ....................................................................................................................................................................................................................................................................... 28 CHLAMYDIA .............................................................................................................................................................................................................................................................. 30 GONORRHEA ............................................................................................................................................................................................................................................................. 32 SYPHILIS ................................................................................................................................................................................................................................................................... 34 TUBERCULOSIS .......................................................................................................................................................................................................................................................... 35 PERTUSSIS ................................................................................................................................................................................................................................................................ 38
CHRONIC DISEASE ..................................................................................................................................................................................................................................... 39
ASTHMA .................................................................................................................................................................................................................................................................. 40 CANCER ................................................................................................................................................................................................................................................................... 44 DIABETES ................................................................................................................................................................................................................................................................. 46 ADULT OBESITY ......................................................................................................................................................................................................................................................... 50 HEART DISEASE ......................................................................................................................................................................................................................................................... 51 HYPERTENSION .......................................................................................................................................................................................................................................................... 53 STROKE MORTALITY ................................................................................................................................................................................................................................................... 54
INFANT MORTALITY .................................................................................................................................................................................................................................. 55
INFANT MORTALITY RATE ............................................................................................................................................................................................................................................ 55 INFANT MORTALITY RATE BY ZIP CODE .......................................................................................................................................................................................................................... 56 LEADING CAUSES OF INFANT DEATH .............................................................................................................................................................................................................................. 57
MORTALITY ............................................................................................................................................................................................................................................... 58
DEATHS AND DEATH RATES ......................................................................................................................................................................................................................................... 58 TOP 5 LEADING CAUSES OF DEATH TRENDS OVER TIME ..................................................................................................................................................................................................... 59 TOP 10 LEADING CAUSES OF DEATH RANKING ................................................................................................................................................................................................................ 60 LEADING CAUSES OF DEATH BY GENDER ......................................................................................................................................................................................................................... 61 LEADING CAUSES OF DEATH BY RACE/ETHNICITY ............................................................................................................................................................................................................. 62 LEADING CAUSES OF DEATH BY AGE GROUP .................................................................................................................................................................................................................... 63 ACCIDENTS (UNINTENTIONAL INJURIES) ......................................................................................................................................................................................................................... 64 INTENTIONAL INJURIES DEATHS .................................................................................................................................................................................................................................... 65 ALCOHOL‐ AND DRUG‐ RELATED DEATHS ....................................................................................................................................................................................................................... 66
DEFINITIONS ............................................................................................................................................................................................................................................. 69

Community Health Status Report – Sacramento County 2014 iii
Message From the Health Officer
Message From the Health Officer
Olivia Kasirye, MD, MS. Public Health Officer Sacramento County
Sacramento County, Department of Health and Human Services, Public Health Division, is pleased to bring you the 2014 Community Health Status Report. The purpose of this report is to provide an overview of some of the key community health indicators and trends in our County. One of the primary roles of public health is to systematically collect, analyze, report and disseminate information about the health of the County’s population. This is done to encourage collaboration to support community‐driven health improvement intervention and policy. This report presents public health data that can be directly compared with clearly established benchmarks, such as national standards and is meant to be a tool for learning as well as planning. This is the third edition of the Community Health Status Report. This year’s report includes data on life expectancy, social determinants of health, chronic disease, communicable disease, births and mortality. As much as possible, we compared our local data to State or national Healthy People 2020 Objectives. In addition to health related indicators, we included other socio‐economic factors that influence the health status of the population. The community is the most valuable partner in public health. Therefore the broad purpose of the report is to help policy‐makers, educators, community members and program planners identify priority issues and measure progress in the domain of population health. The general public, health professionals and organizations that deal with preventing disease and mortality will find the information in the report useful. We value your opinions about this report and welcome the opportunity for feedback and collaboration.
Community Health Status Report – Sacramento County 2014 iv
Mission, Vision and Values
Mission, Vision and Values
Mission, Vision and Values
Mission: The mission of Sacramento County Public Health is to promote, protect, and assure conditions for optimal health and public safety for residents and communities of Sacramento County through leadership, collaboration, prevention and response.
Vision: Optimal health and well‐being for Sacramento County communities!
Values: Collaboration: We value collaboration and diversity. Dedication: We are dedicated to meet the public health needs of Sacramento County residents and communities. Quality: We provide high quality and effective services based on best practices and the most current information and resources. Competence: We hire staff with essential skills, education, experience and certification to accomplish program goals. Responsiveness: We listen to community needs, monitor community health, and develop responses to match needs. Accountability: We accept responsibility and accountability for providing efficient and quality service. We conduct ourselves with integrity in delivering services. Diversity: We respect and value diversity within the community and strive to deliver services that are respectful and relevant to the needs, values, and beliefs of the community. We seek to recruit and hire diverse staffs that enhance our level of understanding of various populations and to promote cultural competence. Efficiency: We look for the most efficient way to get the job done.

Community Health Status Report – Sacramento County 2014 v
Introduction
Introduction
Acknowledgements
The Department of Health and Human Services acknowledges all health care providers for their timely reporting of communicable diseases to the Disease Control and Epidemiology Unit. Technical Notes Population Data The population data used in this report are from the State of California, Department of Finance, Race/Ethnic Population with Age and Sex Detail, 2000–2050, Sacramento, CA, May 2007 and State of California, Department of Finance, Race/Ethnic Population with Age and Sex Detail, 2010–2060. Sacramento, CA, Jan 2013. Birth (including Prenatal Care) and death data The birth and death data presented in this report are from the State of California, Department of Public Health birth and death master files for the Sacramento County 2002 through 2011. Communicable Disease Data The data presented on communicable disease in Sacramento County were obtained from the State of California, Department of Public Health, the HIV and AIDS registry (EHARS), California Reportable Disease Information Exchange (CalREDIE), and the TB registry. Please note that all communicable disease data for 2012 are provisional. Chronic Disease Data The data for chronic diseases in Sacramento County are based on the information obtained from the 2001, 2003, 2005, 2007, 2009 and 2011 California Health Interview Survey (CHIS). Social Determinants of Health Data The social determinants of health indicator data were obtained from California Department of Public Health, Office of Health Equity.

Community Health Status Report – Sacramento County 2014 vi
Executive Summary
Executive Summary
Monitoring the occurrence of disease and mortality in the population is vital to understanding and limiting their impact on human health. This Community Health Status Report focuses on social determinants of health and general health indicators, including birth rates, prenatal care, sexually transmitted infections, asthma, diabetes, obesity, heart disease and infant mortality. The statistics provide a picture of the health status and mortality experiences of residents in Sacramento County. This report accomplishes essential public health functions such as monitoring the health status of a community to identify community health problems, and informing, educating and empowering people to manage health issues in their communities. Highlights of Major Findings Demographics
The population in the County of Sacramento increased by 9.0% between 2003 and 2013. The Hispanic population increased the most of all races and ethnicities in Sacramento County, increasing by 31.0% in the
period between 2003 and 2013. Sacramento County’s population is aging. From 2003 to 2013, there was a 54.2 % increase in the population over ages 60‐69,
and a 44.7% increase over age 85 and older.
Social Determinants of Health
Unemployment has been slowly decreasing from late 2009 in Sacramento County to 8.9% in August of 2013. The most common occupation in Sacramento County falls in the category of “Management, Business, Science and Arts” 63.2% of Sacramento County’s residents reported at least some college education in the five years average (2007‐2011). This
was slightly higher than the State as a whole (59.8%). High school graduation rate increased 4.4% from school year 2009/2010 to 2011/2012 for Sacramento County. People with no health insurance coverage increased from 2001 to 2011 in Sacramento County.
Community Health Status Report – Sacramento County 2014 vii
Executive Summary
Life Expectancy
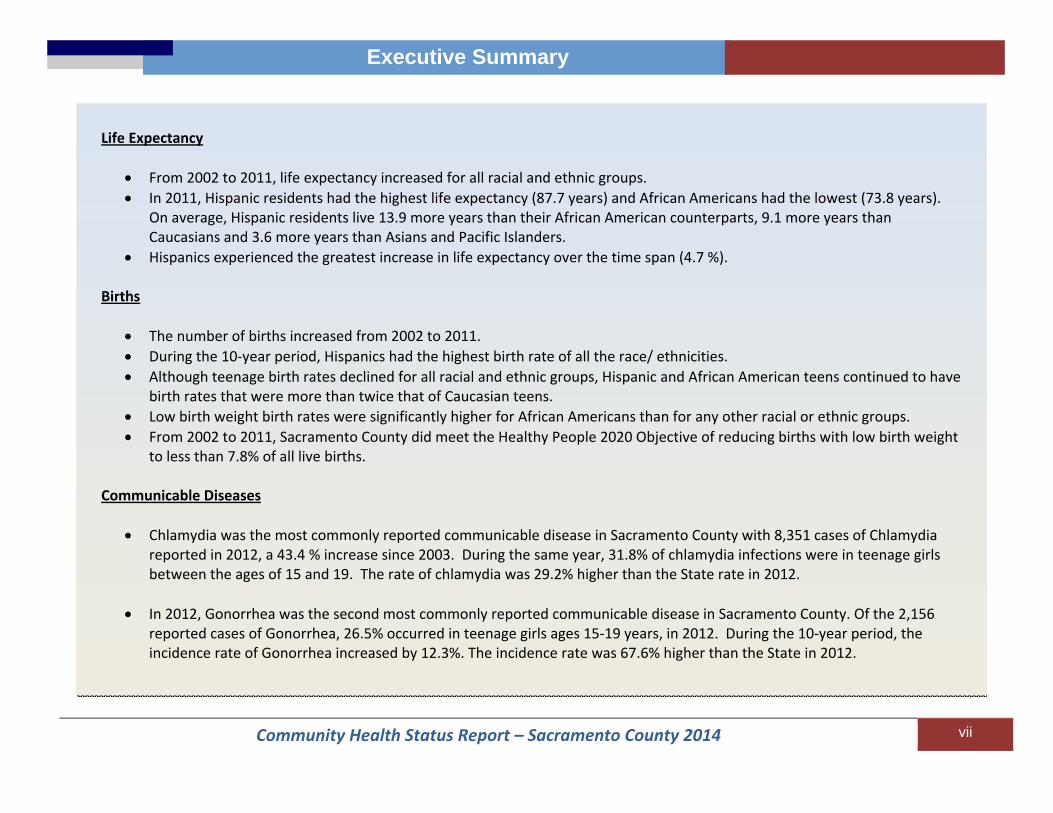
From 2002 to 2011, life expectancy increased for all racial and ethnic groups. In 2011, Hispanic residents had the highest life expectancy (87.7 years) and African Americans had the lowest (73.8 years).
On average, Hispanic residents live 13.9 more years than their African American counterparts, 9.1 more years than Caucasians and 3.6 more years than Asians and Pacific Islanders.
Hispanics experienced the greatest increase in life expectancy over the time span (4.7 %). Births
The number of births increased from 2002 to 2011. During the 10‐year period, Hispanics had the highest birth rate of all the race/ ethnicities. Although teenage birth rates declined for all racial and ethnic groups, Hispanic and African American teens continued to have
birth rates that were more than twice that of Caucasian teens. Low birth weight birth rates were significantly higher for African Americans than for any other racial or ethnic groups. From 2002 to 2011, Sacramento County did meet the Healthy People 2020 Objective of reducing births with low birth weight
to less than 7.8% of all live births. Communicable Diseases
Chlamydia was the most commonly reported communicable disease in Sacramento County with 8,351 cases of Chlamydia reported in 2012, a 43.4 % increase since 2003. During the same year, 31.8% of chlamydia infections were in teenage girls between the ages of 15 and 19. The rate of chlamydia was 29.2% higher than the State rate in 2012.
In 2012, Gonorrhea was the second most commonly reported communicable disease in Sacramento County. Of the 2,156 reported cases of Gonorrhea, 26.5% occurred in teenage girls ages 15‐19 years, in 2012. During the 10‐year period, the incidence rate of Gonorrhea increased by 12.3%. The incidence rate was 67.6% higher than the State in 2012.
Community Health Status Report – Sacramento County 2014 viii
Executive Summary
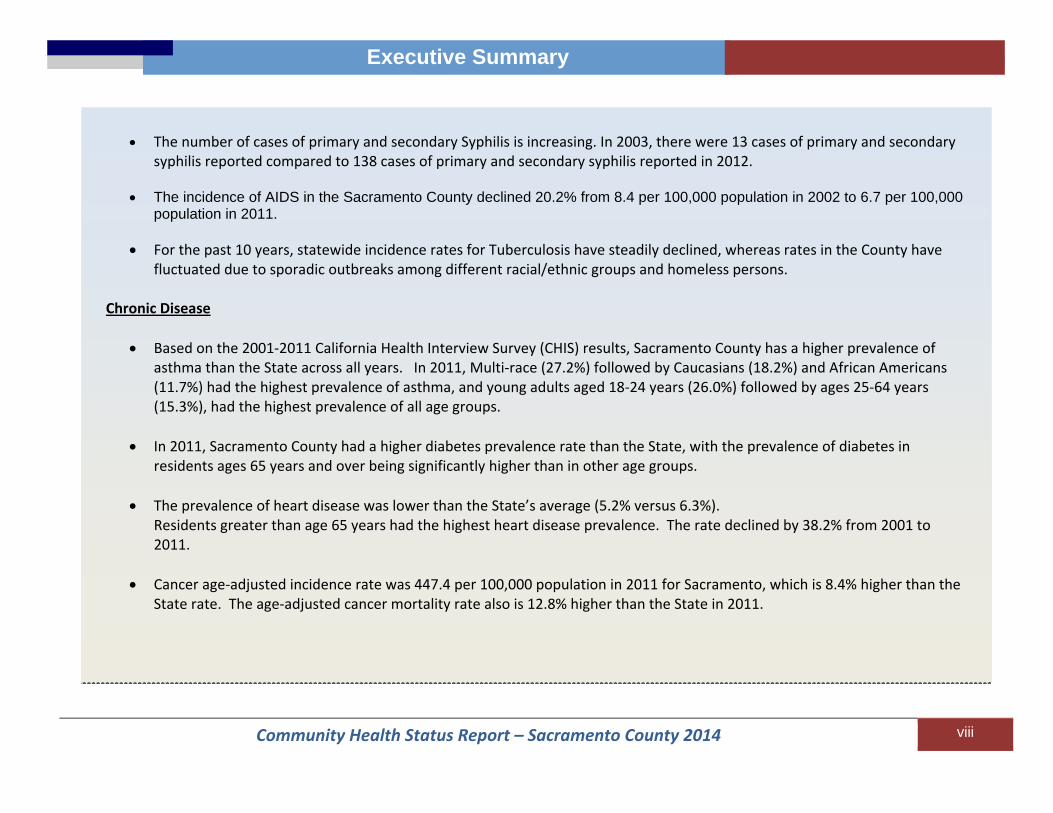
The number of cases of primary and secondary Syphilis is increasing. In 2003, there were 13 cases of primary and secondary syphilis reported compared to 138 cases of primary and secondary syphilis reported in 2012.
The incidence of AIDS in the Sacramento County declined 20.2% from 8.4 per 100,000 population in 2002 to 6.7 per 100,000 population in 2011.
For the past 10 years, statewide incidence rates for Tuberculosis have steadily declined, whereas rates in the County have fluctuated due to sporadic outbreaks among different racial/ethnic groups and homeless persons.
Chronic Disease
Based on the 2001‐2011 California Health Interview Survey (CHIS) results, Sacramento County has a higher prevalence of asthma than the State across all years. In 2011, Multi‐race (27.2%) followed by Caucasians (18.2%) and African Americans (11.7%) had the highest prevalence of asthma, and young adults aged 18‐24 years (26.0%) followed by ages 25‐64 years (15.3%), had the highest prevalence of all age groups.
In 2011, Sacramento County had a higher diabetes prevalence rate than the State, with the prevalence of diabetes in residents ages 65 years and over being significantly higher than in other age groups.
The prevalence of heart disease was lower than the State’s average (5.2% versus 6.3%).
Residents greater than age 65 years had the highest heart disease prevalence. The rate declined by 38.2% from 2001 to 2011.
Cancer age‐adjusted incidence rate was 447.4 per 100,000 population in 2011 for Sacramento, which is 8.4% higher than the State rate. The age‐adjusted cancer mortality rate also is 12.8% higher than the State in 2011.
Community Health Status Report – Sacramento County 2014 ix
Executive Summary
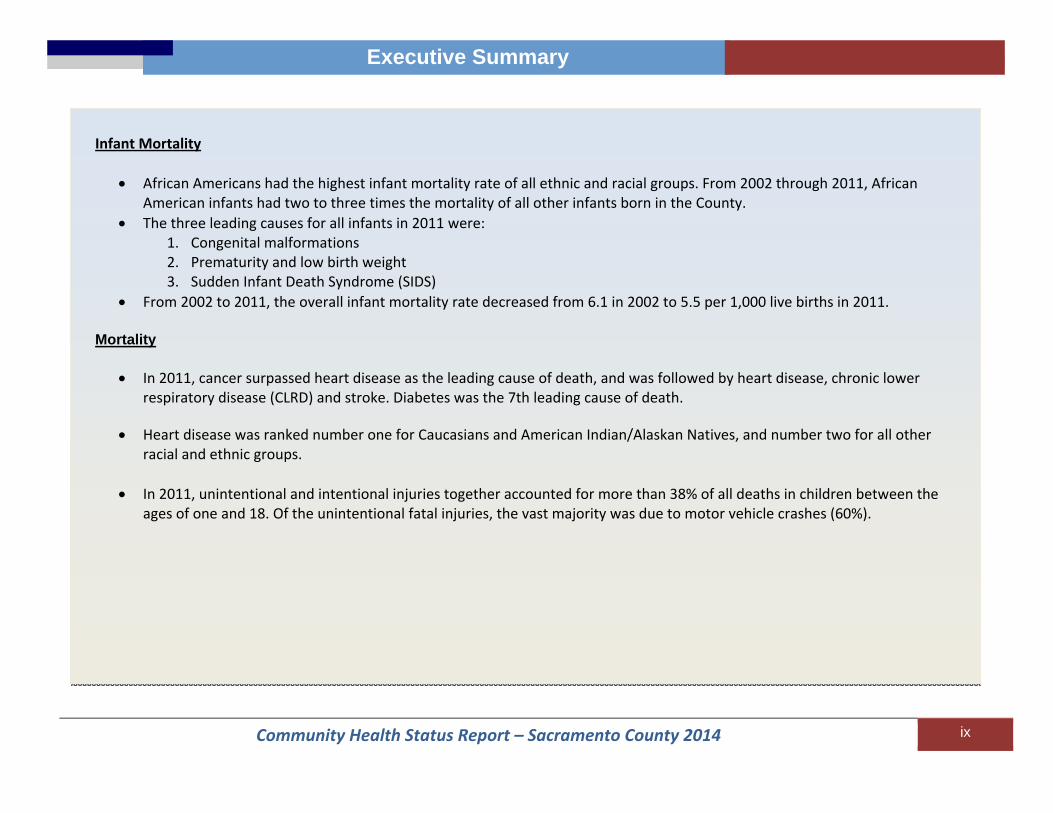
Infant Mortality
African Americans had the highest infant mortality rate of all ethnic and racial groups. From 2002 through 2011, African American infants had two to three times the mortality of all other infants born in the County.
The three leading causes for all infants in 2011 were: 1. Congenital malformations 2. Prematurity and low birth weight 3. Sudden Infant Death Syndrome (SIDS)
From 2002 to 2011, the overall infant mortality rate decreased from 6.1 in 2002 to 5.5 per 1,000 live births in 2011. Mortality
In 2011, cancer surpassed heart disease as the leading cause of death, and was followed by heart disease, chronic lower respiratory disease (CLRD) and stroke. Diabetes was the 7th leading cause of death.
Heart disease was ranked number one for Caucasians and American Indian/Alaskan Natives, and number two for all other
racial and ethnic groups.
In 2011, unintentional and intentional injuries together accounted for more than 38% of all deaths in children between the ages of one and 18. Of the unintentional fatal injuries, the vast majority was due to motor vehicle crashes (60%).
Community Health Status Report – Sacramento County 2014 1
Demographics
Demographics
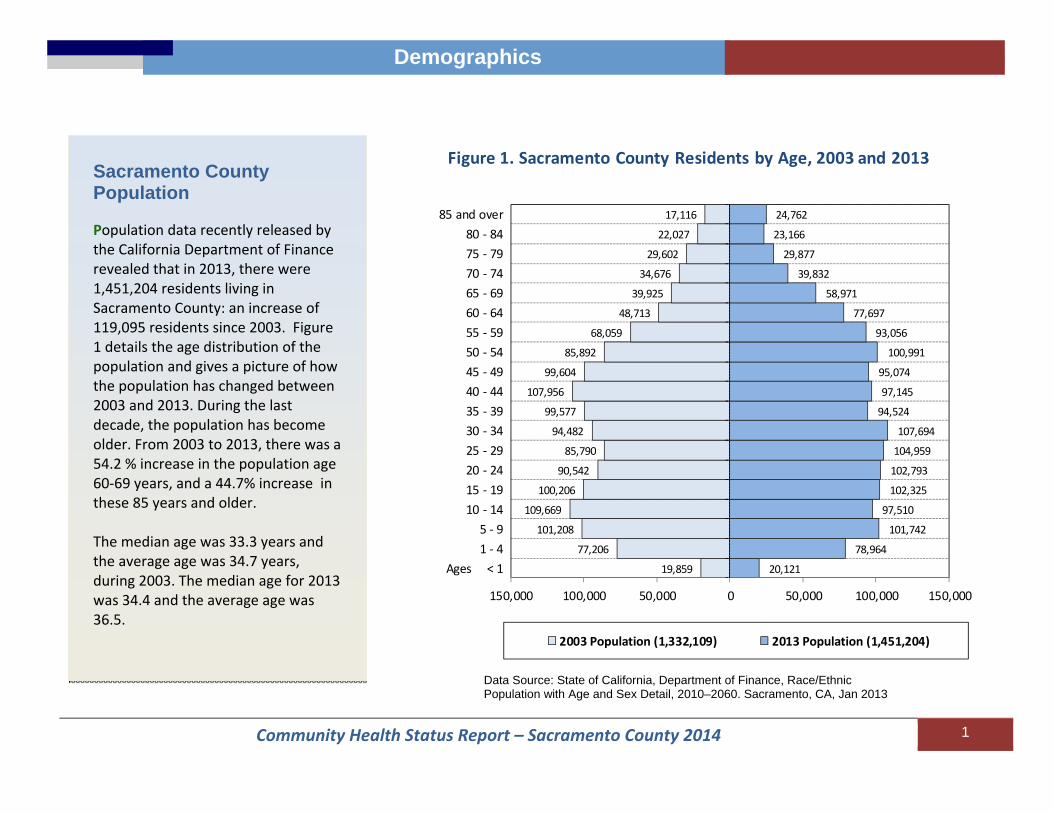
Sacramento County Population Population data recently released by the California Department of Finance revealed that in 2013, there were 1,451,204 residents living in Sacramento County: an increase of 119,095 residents since 2003. Figure 1 details the age distribution of the population and gives a picture of how the population has changed between 2003 and 2013. During the last decade, the population has become older. From 2003 to 2013, there was a 54.2 % increase in the population age 60‐69 years, and a 44.7% increase in these 85 years and older. The median age was 33.3 years and the average age was 34.7 years, during 2003. The median age for 2013 was 34.4 and the average age was 36.5.
20,121
78,964
101,742
97,510
102,325
102,793
104,959
107,694
94,524
97,145
95,074
100,991
93,056
77,697
58,971
39,832
29,877
23,166
24,762
19,859
77,206
101,208
109,669
100,206
90,542
85,790
94,482
99,577
107,956
99,604
85,892
68,059
48,713
39,925
34,676
29,602
22,027
17,116
150,000 100,000 50,000 0 50,000 100,000 150,000
Ages < 1 1 ‐ 4 5 ‐ 9
10 ‐ 14 15 ‐ 19 20 ‐ 24 25 ‐ 29 30 ‐ 34 35 ‐ 39 40 ‐ 44 45 ‐ 49 50 ‐ 54 55 ‐ 59 60 ‐ 64 65 ‐ 69 70 ‐ 74
75 ‐ 7980 ‐ 84
85 and over
2003 Population (1,332,109) 2013 Population (1,451,204)
Figure 1. Sacramento County Residents by Age, 2003 and 2013
Data Source: State of California, Department of Finance, Race/Ethnic Population with Age and Sex Detail, 2010–2060. Sacramento, CA, Jan 2013

Community Health Status Report – Sacramento County 2014 2
Demographics
Data Source: State of California, Department of Finance, Race/Ethnic Population with Age and Sex Detail, 2010–2060. Sacramento, CA, Jan 2013
Population by Gender Figure 2 compares the age and sex distribution for residents in 2013. This graph shows that in 2013, there were more female residents than male residents. There was a higher proportion of females over 65 years old compared to males, 13.2% of females were 65 years or older compared to 10.6 % of males 65 years or older.
9,53638,015
49,80147,71549,80450,29752,64853,770
47,38848,82847,83451,636
48,73241,316
31,62722,272
17,13413,65416,311
10,58540,949
51,94149,794
52,52152,49652,31153,924
47,13648,31847,240
49,35544,323
36,38227,345
17,56012,742
9,5128,451
70,000 50,000 30,000 10,000 10,000 30,000 50,000 70,000
Ages < 1 1 ‐ 4 5 ‐ 9
10 ‐ 14 15 ‐ 19 20 ‐ 24 25 ‐ 29 30 ‐ 34 35 ‐ 39 40 ‐ 44 45 ‐ 49 50 ‐ 54 55 ‐ 59 60 ‐ 64 65 ‐ 69 70 ‐ 74
75 ‐ 7980 ‐ 84
85 and over
Male Population (712,885) Female Population (738,319)
Figure 2. Sacramento County Residents by Age and Gender, 2013

Community Health Status Report – Sacramento County 2014 3
Demographics
Population by Race and Ethnicity Figure 3 illustrates the diversity of Sacramento County by race and ethnicity. Beginning with Census 2000, census data have reported multi‐race as a category, which enables residents to identify themselves with two or more racial groups. In 2013, 4.4% of the County’s residents identified themselves as multi‐racial. Hispanics continue to be the fastest growing population in California. In Sacramento County, Hispanics comprised 22.0% of the population compared to 38.7% in California in 2013.
*AA: African American **Asian and Pacific Islander ***American Indian and Alaskan Native Data Source: State of California, Department of Finance, Race/Ethnic Population with Age and Sex Detail, 2010–2060. Sacramento, CA, Jan 2013
Caucasian47.8%
Hispanic22.0%
*Asian/PI15.2%
**AA10.0% ***AIAN
0.6%
Multi‐Race4.4%
Figure 3. Population by Race/EthnicitySacramento County, 2013
Community Health Status Report – Sacramento County 2014 4
Demographics
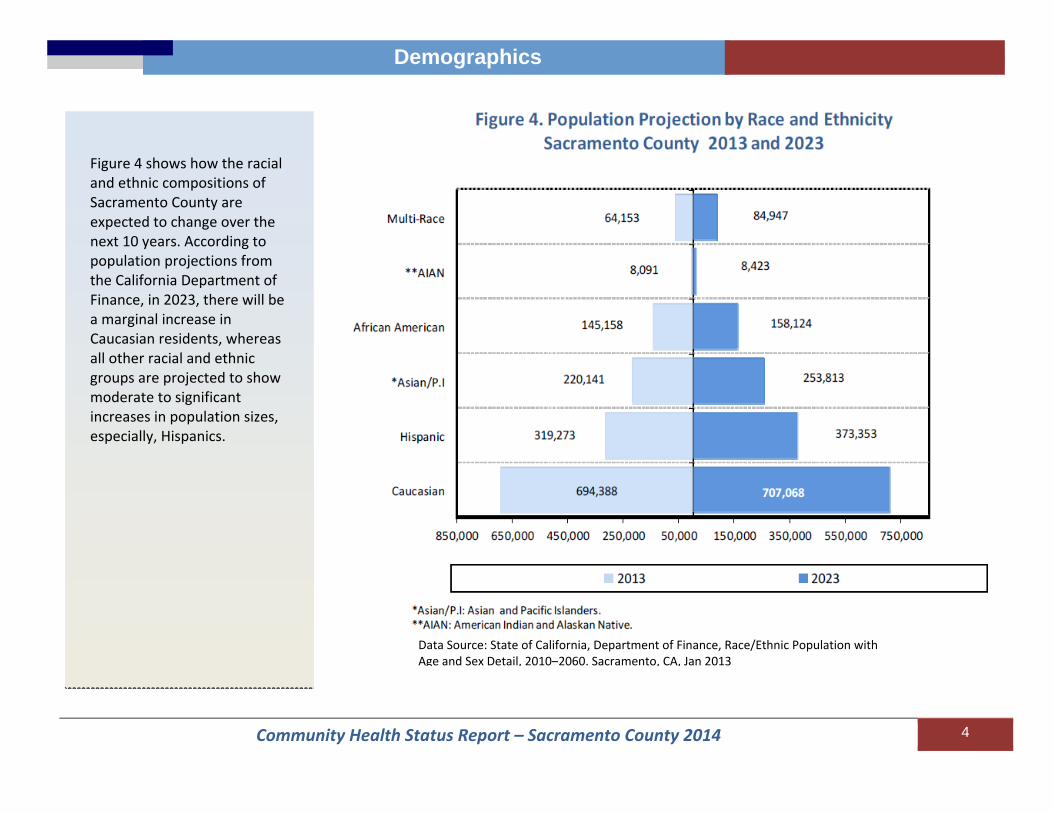
Figure 4 shows how the racial and ethnic compositions of Sacramento County are expected to change over the next 10 years. According to population projections from the California Department of Finance, in 2023, there will be a marginal increase in Caucasian residents, whereas all other racial and ethnic groups are projected to show moderate to significant increases in population sizes, especially, Hispanics.
Data Source: State of California, Department of Finance, Race/Ethnic Population with Age and Sex Detail, 2010–2060. Sacramento, CA, Jan 2013
Community Health Status Report – Sacramento County 2014 5
Life Expectancy
Life Expectancy Life Expectancy in
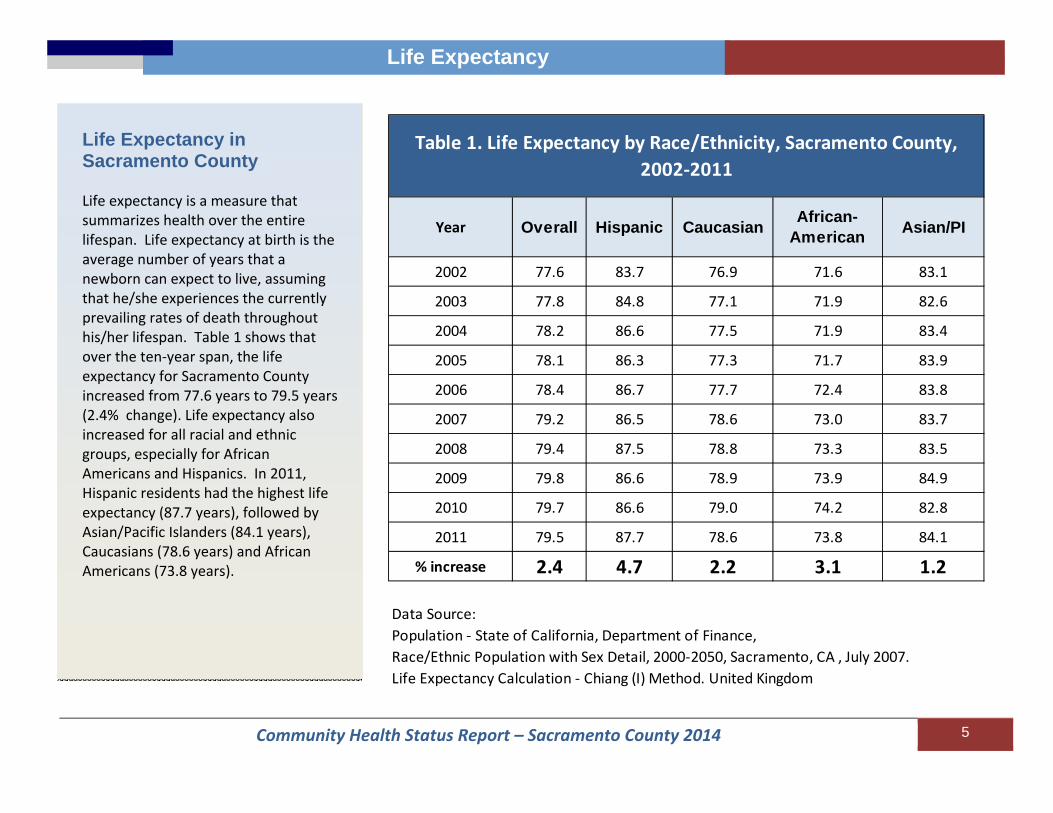
Sacramento County Life expectancy is a measure that summarizes health over the entire lifespan. Life expectancy at birth is the average number of years that a newborn can expect to live, assuming that he/she experiences the currently prevailing rates of death throughout his/her lifespan. Table 1 shows that over the ten‐year span, the life expectancy for Sacramento County increased from 77.6 years to 79.5 years (2.4% change). Life expectancy also increased for all racial and ethnic groups, especially for African Americans and Hispanics. In 2011, Hispanic residents had the highest life expectancy (87.7 years), followed by Asian/Pacific Islanders (84.1 years), Caucasians (78.6 years) and African Americans (73.8 years).
Year Overall Hispanic Caucasian African-American Asian/PI
2002 77.6 83.7 76.9 71.6 83.1
2003 77.8 84.8 77.1 71.9 82.6
2004 78.2 86.6 77.5 71.9 83.4
2005 78.1 86.3 77.3 71.7 83.9
2006 78.4 86.7 77.7 72.4 83.8
2007 79.2 86.5 78.6 73.0 83.7
2008 79.4 87.5 78.8 73.3 83.5
2009 79.8 86.6 78.9 73.9 84.9
2010 79.7 86.6 79.0 74.2 82.8
2011 79.5 87.7 78.6 73.8 84.1
% increase 2.4 4.7 2.2 3.1 1.2
Data Source: Population ‐ State of California, Department of Finance, Race/Ethnic Population with Sex Detail, 2000‐2050, Sacramento, CA , July 2007.Life Expectancy Calculation ‐ Chiang (I) Method. United Kingdom
Table 1. Life Expectancy by Race/Ethnicity, Sacramento County, 2002‐2011
Community Health Status Report – Sacramento County 2014 6
Life Expectancy
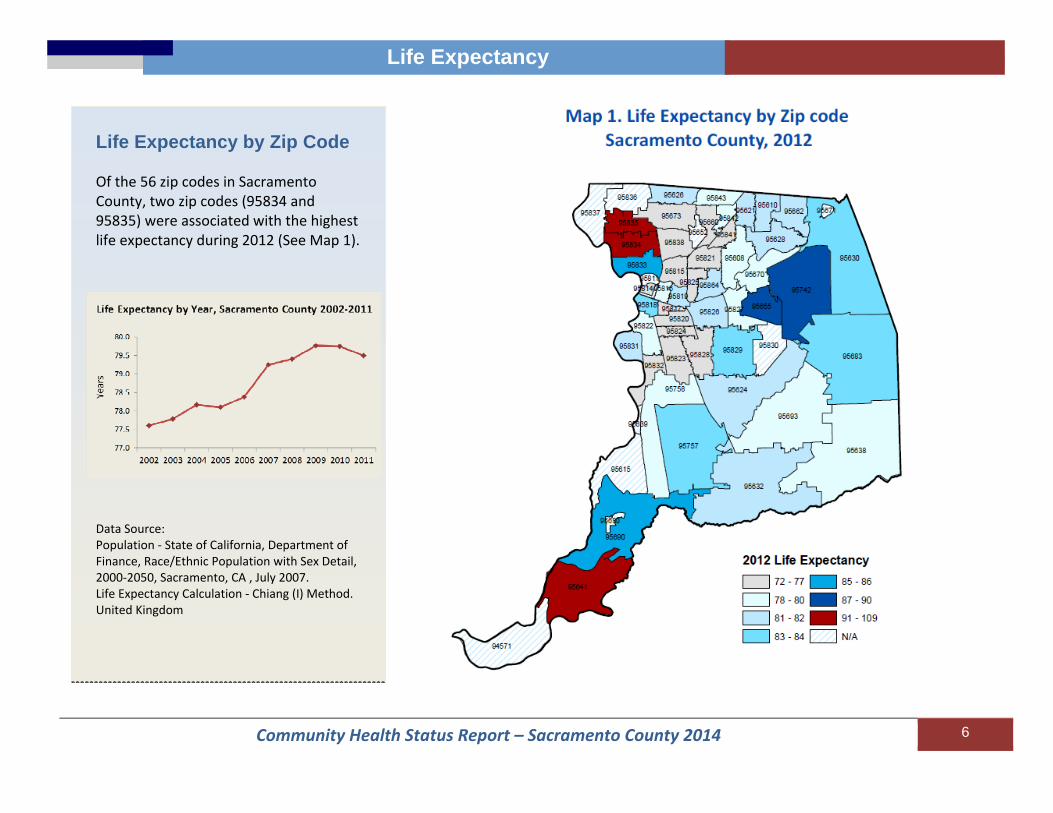
Life Expectancy by Zip Code Of the 56 zip codes in Sacramento County, two zip codes (95834 and 95835) were associated with the highest life expectancy during 2012 (See Map 1).
Data Source: Population ‐ State of California, Department of Finance, Race/Ethnic Population with Sex Detail, 2000‐2050, Sacramento, CA , July 2007. Life Expectancy Calculation ‐ Chiang (I) Method. United Kingdom
Community Health Status Report – Sacramento County 2014 7
Social Determinants of Health
Social Determinants of health
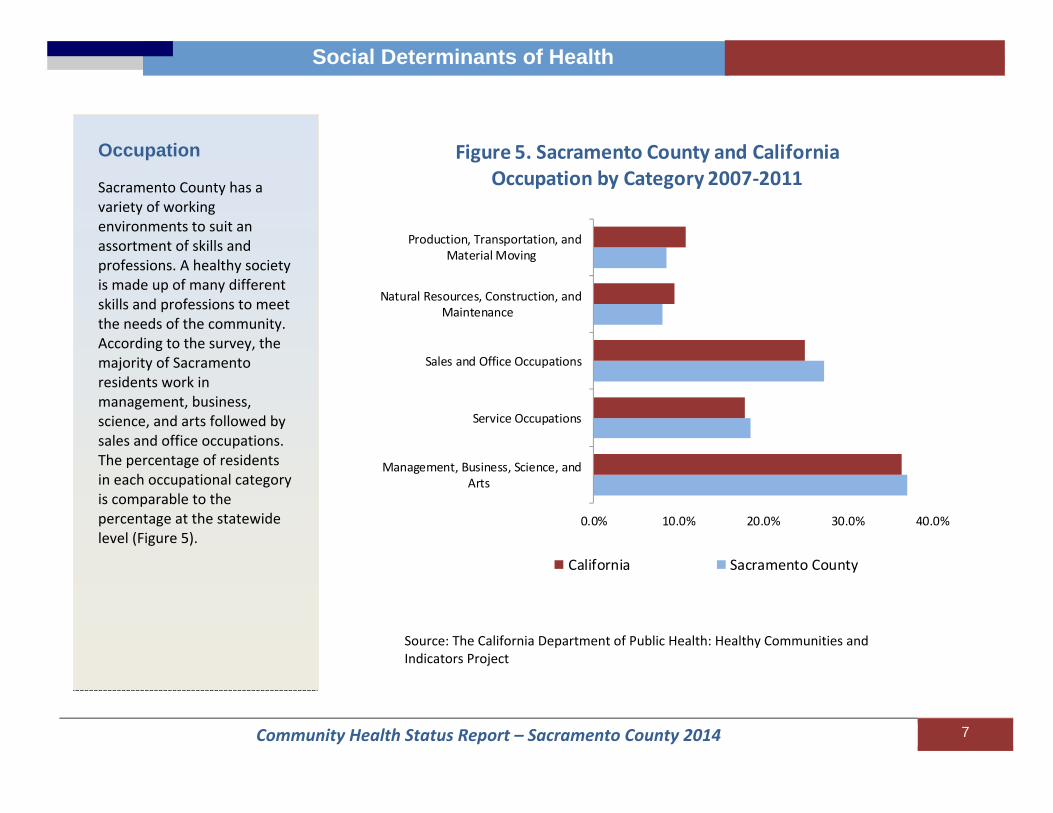
Occupation Sacramento County has a variety of working environments to suit an assortment of skills and professions. A healthy society is made up of many different skills and professions to meet the needs of the community. According to the survey, the majority of Sacramento residents work in management, business, science, and arts followed by sales and office occupations. The percentage of residents in each occupational category is comparable to the percentage at the statewide level (Figure 5).
0.0% 10.0% 20.0% 30.0% 40.0%
Management, Business, Science, andArts
Service Occupations
Sales and Office Occupations
Natural Resources, Construction, andMaintenance
Production, Transportation, andMaterial Moving
Figure 5. Sacramento County and California Occupation by Category 2007‐2011
California Sacramento County
Source: The California Department of Public Health: Healthy Communities and Indicators Project

Community Health Status Report – Sacramento County 2014 8
Social Determinants of Health
Unemployment The unemployment rate is a crucial measure for assessing the need for jobs in a county. The unemployment rate in the County follows very closely to the State’s unemployment rate (Figure 6). Both Sacramento County’s and California’s unemployment rates remain above the national rates for the timeframe examined. Sacramento County’s unemployment rates have been decreasing since the end of 2011; however, rates in the Nation, State and the County were higher in 2013 than before the recession, in 2007.
2.0
4.0
6.0
8.0
10.0
12.0
14.0
Jan‐07
May‐07
Sep‐07
Jan‐08
May‐08
Sep‐08
Jan‐09
May‐09
Sep‐09
Jan‐10
May‐10
Sep‐10
Jan‐11
May‐11
Sep‐11
Jan‐12
May‐12
Sep‐12
Jan‐13
May‐13
Sep‐13
Jan‐14
Crud
e Percen
t Une
mploymen
t
Figure 6. Crude Unemployment Rate in U.S., California and Sacramento from January 2007 ‐ September 2013
US CA Sacramento County
Source: The United States Department of Labor
Community Health Status Report – Sacramento County 2014 9
Social Determinants of Health
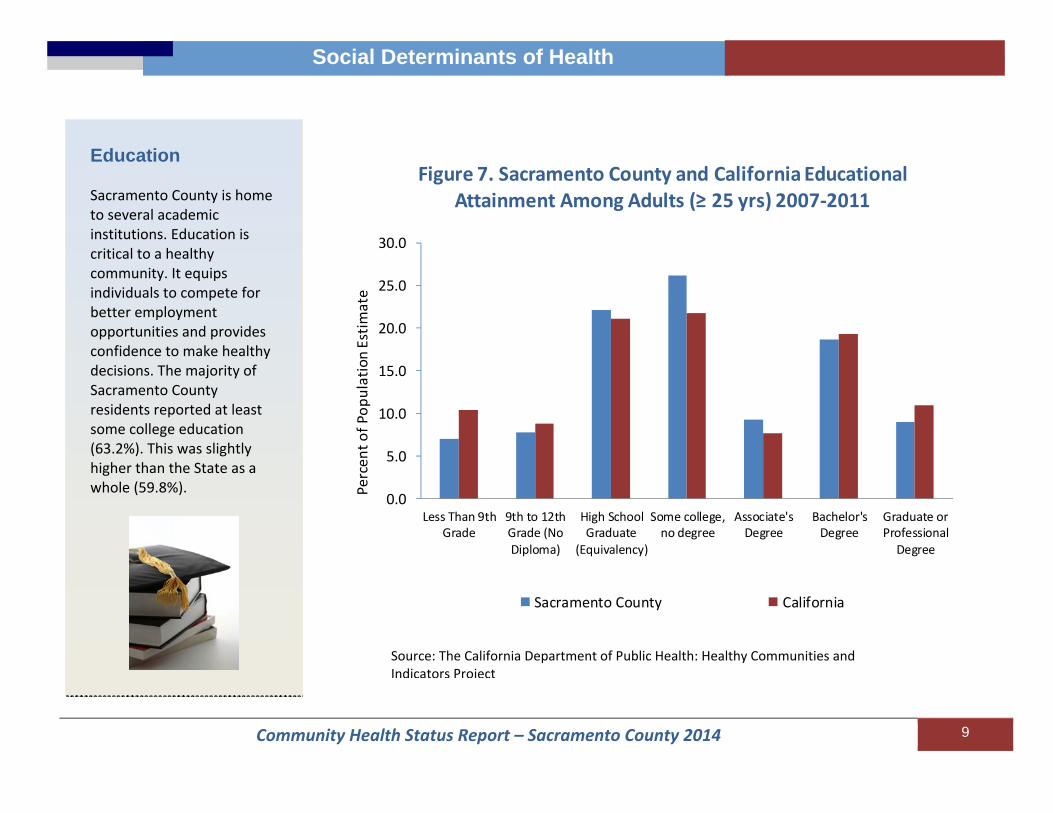
Education Sacramento County is home to several academic institutions. Education is critical to a healthy community. It equips individuals to compete for better employment opportunities and provides confidence to make healthy decisions. The majority of Sacramento County residents reported at least some college education (63.2%). This was slightly higher than the State as a whole (59.8%).
0.0
5.0
10.0
15.0
20.0
25.0
30.0
Less Than 9thGrade
9th to 12thGrade (NoDiploma)
High SchoolGraduate
(Equivalency)
Some college,no degree
Associate'sDegree
Bachelor'sDegree
Graduate orProfessionalDegree
Figure 7. Sacramento County and California Educational Attainment Among Adults (≥ 25 yrs) 2007‐2011
Sacramento County California
Percen
t of P
opulation Estim
ate
Source: The California Department of Public Health: Healthy Communities and Indicators Project

Community Health Status Report – Sacramento County 2014 10
Social Determinants of Health Health Equity
High School Graduation Rate The graduation rate is the percentage of the students expected to graduate in four years that actually did graduate. Sacramento County shows an increasing trend in graduation rates across the school years from 72.3% in 2009/2010 to 76.7% (4.4% increases) in 2011/2012 as indicated in Figure 8. The increasing trend in Sacramento County is consistent with the increase at the state‐level though, Sacramento is consistently lower than the State’s rates for the years displayed. The high school dropout rate for school year 2011‐2012 varied by race/ethnicity. It was highest for African Americans at 6.4% (See insert).
69.0
70.0
71.0
72.0
73.0
74.0
75.0
76.0
77.0
78.0
79.0
2009/2010 2010/2011 2011/2012
Figure 8. Percent Cohort High School Graduation Rates by School Year, 2009‐2012
Sacramento County California
Percent
Source: Ed‐Data ‐ Education Data Partnership Note – General Education Degree Recipients, Special Education Certificates of Completion or those that remain enrolled without a diploma are not included in these rates.
Community Health Status Report – Sacramento County 2014 11
Social Determinants of Health
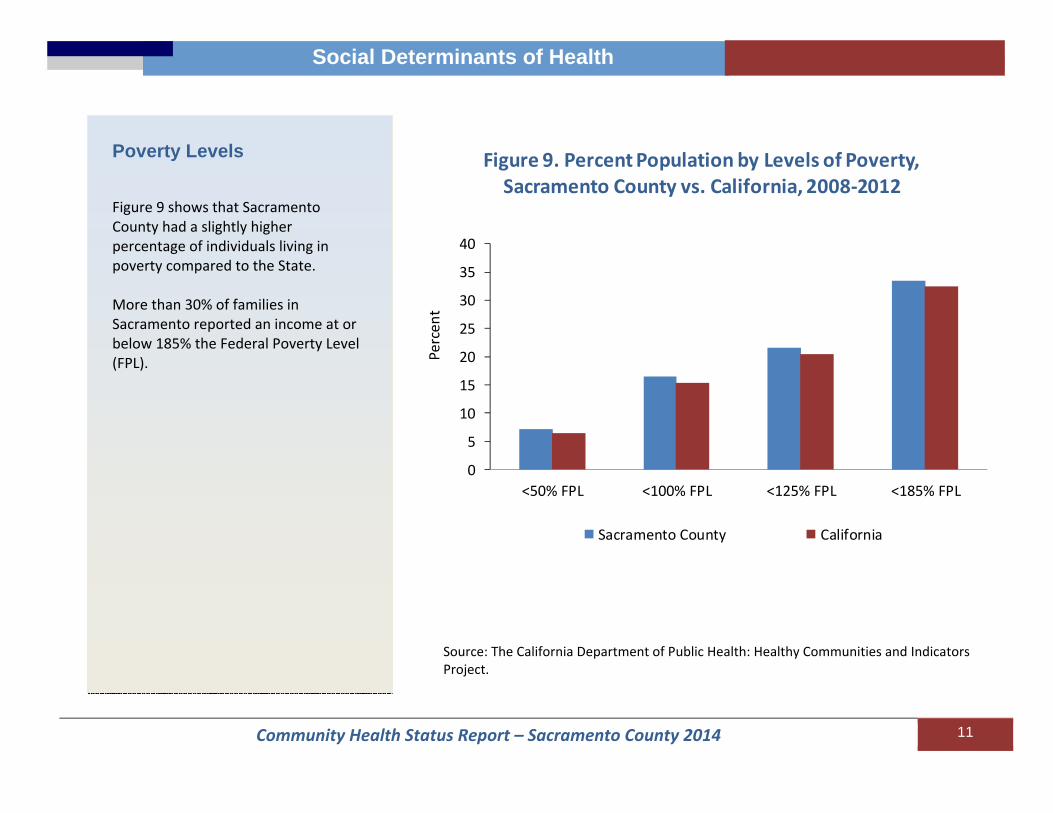
Poverty Levels Figure 9 shows that Sacramento County had a slightly higher percentage of individuals living in poverty compared to the State. More than 30% of families in Sacramento reported an income at or below 185% the Federal Poverty Level (FPL).
Source: The California Department of Public Health: Healthy Communities and Indicators Project.
0
5
10
15
20
25
30
35
40
<50% FPL <100% FPL <125% FPL <185% FPL
Figure 9. Percent Population by Levels of Poverty, Sacramento County vs. California, 2008‐2012
Sacramento County California
Percen
t
Community Health Status Report – Sacramento County 2014 12
Social Determinants of Health
0.0
5.0
10.0
15.0
20.0
25.0
30.0
35.0
40.0
45.0
AIAN Asian AfricanAmerican
Hispanic NHOPI White Multiple Other Total
California Sacramento
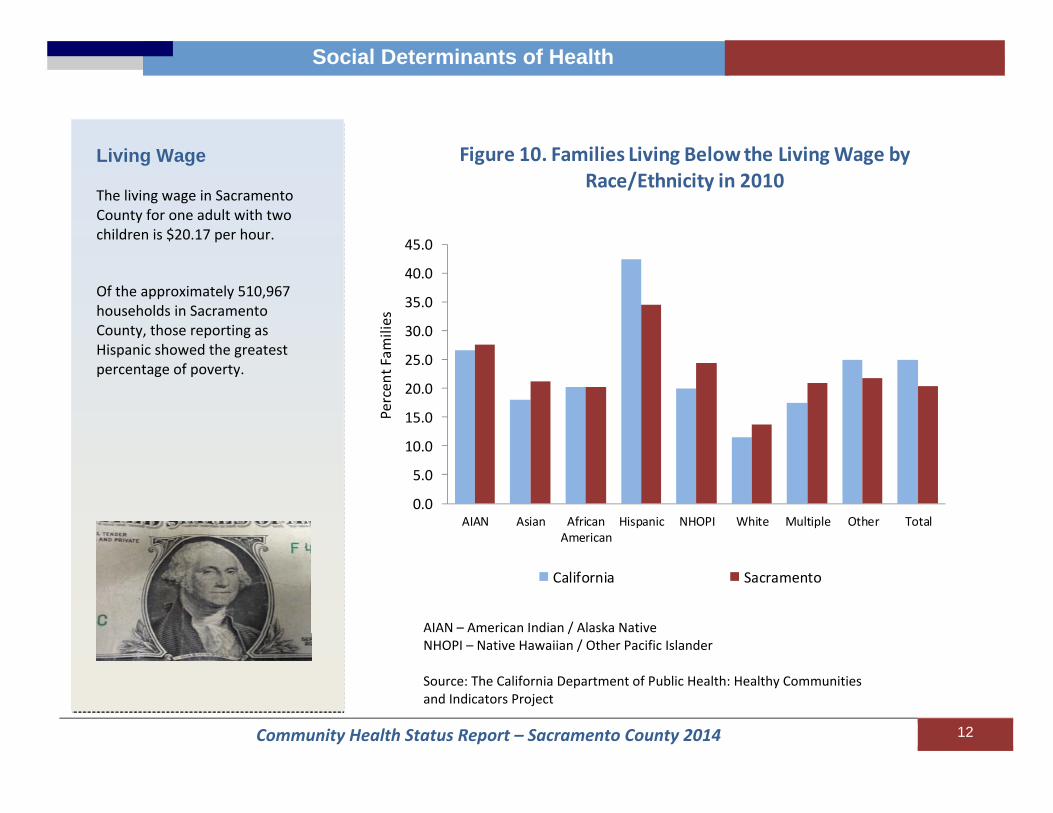
Figure 10. Families Living Below the Living Wage by Race/Ethnicity in 2010
Percen
t Fam
ilies
Living Wage The living wage in Sacramento County for one adult with two children is $20.17 per hour. Of the approximately 510,967 households in Sacramento County, those reporting as Hispanic showed the greatest percentage of poverty.
AIAN – American Indian / Alaska Native NHOPI – Native Hawaiian / Other Pacific Islander Source: The California Department of Public Health: Healthy Communities and Indicators Project
Community Health Status Report – Sacramento County 2014 13
Social Determinants of Health
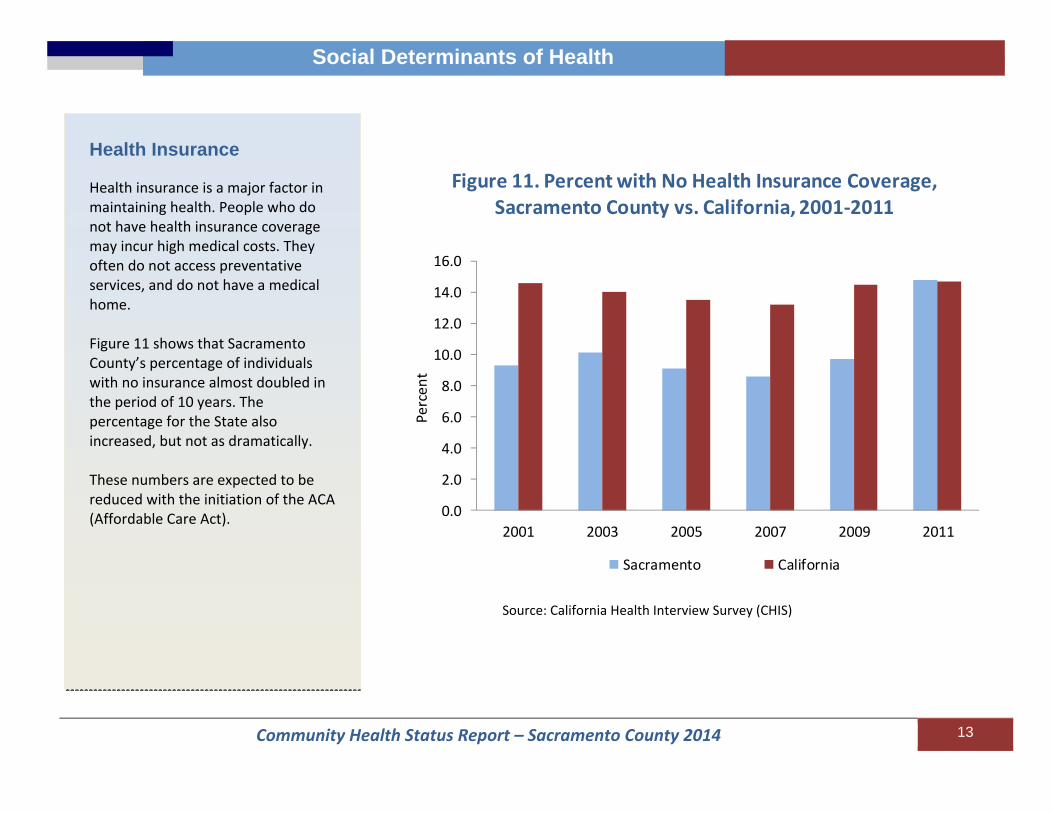
Health Insurance Health insurance is a major factor in maintaining health. People who do not have health insurance coverage may incur high medical costs. They often do not access preventative services, and do not have a medical home. Figure 11 shows that Sacramento County’s percentage of individuals with no insurance almost doubled in the period of 10 years. The percentage for the State also increased, but not as dramatically. These numbers are expected to be reduced with the initiation of the ACA (Affordable Care Act).
0.0
2.0
4.0
6.0
8.0
10.0
12.0
14.0
16.0
2001 2003 2005 2007 2009 2011
Percen
t
Sacramento California
Figure 11. Percent with No Health Insurance Coverage, Sacramento County vs. California, 2001‐2011
Source: California Health Interview Survey (CHIS)

Community Health Status Report – Sacramento County 2014 14
Social Determinants of Health
Transportation The majority (75.0%) of commuters reported driving alone. That is 2.0% higher than the statewide estimate of 73.0%. Although studies show that 18.9% of the population had access to public transit within ½ mile, only about 3% of commuters used public transit. Figure 12 shows that the State had a higher percentage of commuters using public transportation and walking than the County. The County had a higher percentage of commuters carpooling than the State.
0.0
2.0
4.0
6.0
8.0
10.0
12.0
14.0
Carpooled PublicTransportation
Walked Other Means Worked at Home
Percen
t Com
muter
Figure 12. Percent Commuters by Transport Method Sacramento County and California, 2007‐2011
Sacramento County California
Source: The California Department of Public Health: Healthy Communities and Indicators Project
Community Health Status Report – Sacramento County 2014 15
Social Determinants of Health
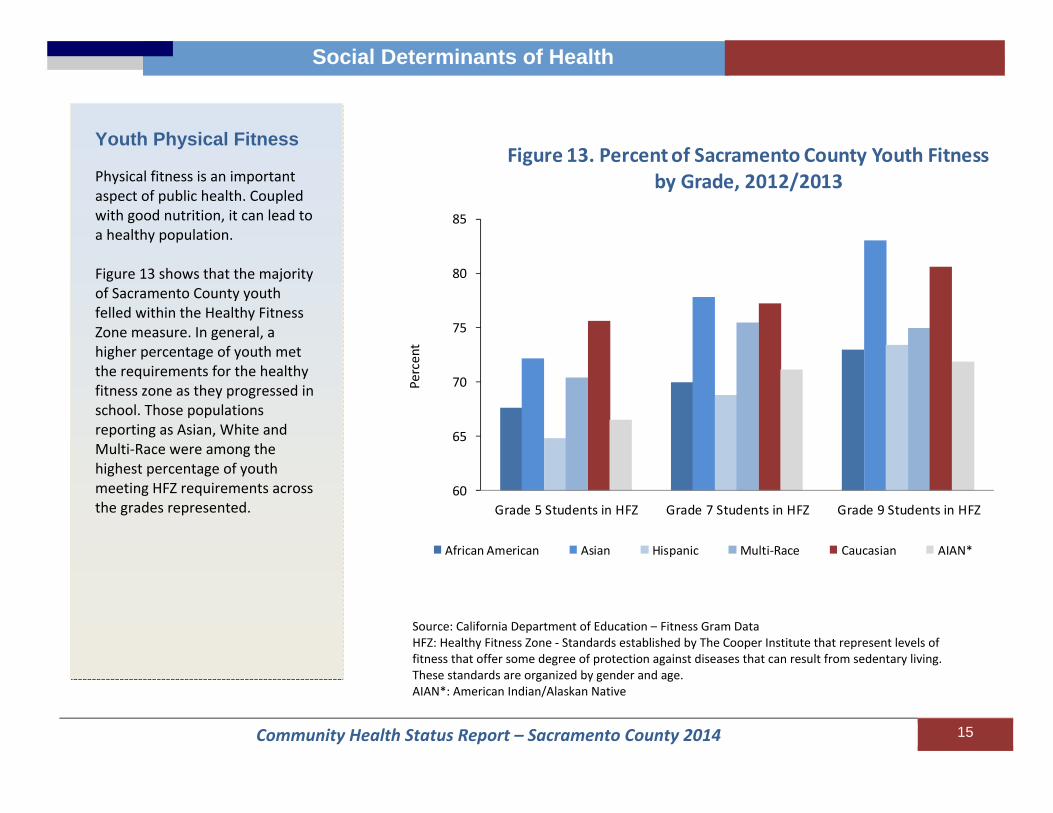
Youth Physical Fitness Physical fitness is an important aspect of public health. Coupled with good nutrition, it can lead to a healthy population. Figure 13 shows that the majority of Sacramento County youth felled within the Healthy Fitness Zone measure. In general, a higher percentage of youth met the requirements for the healthy fitness zone as they progressed in school. Those populations reporting as Asian, White and Multi‐Race were among the highest percentage of youth meeting HFZ requirements across the grades represented.
60
65
70
75
80
85
Grade 5 Students in HFZ Grade 7 Students in HFZ Grade 9 Students in HFZ
Figure 13. Percent of Sacramento County Youth Fitness by Grade, 2012/2013
African American Asian Hispanic Multi‐Race Caucasian AIAN*
Percent
Source: California Department of Education – Fitness Gram DataHFZ: Healthy Fitness Zone ‐ Standards established by The Cooper Institute that represent levels of fitness that offer some degree of protection against diseases that can result from sedentary living. These standards are organized by gender and age. AIAN*: American Indian/Alaskan Native
Community Health Status Report – Sacramento County 2014 16
Births
Births
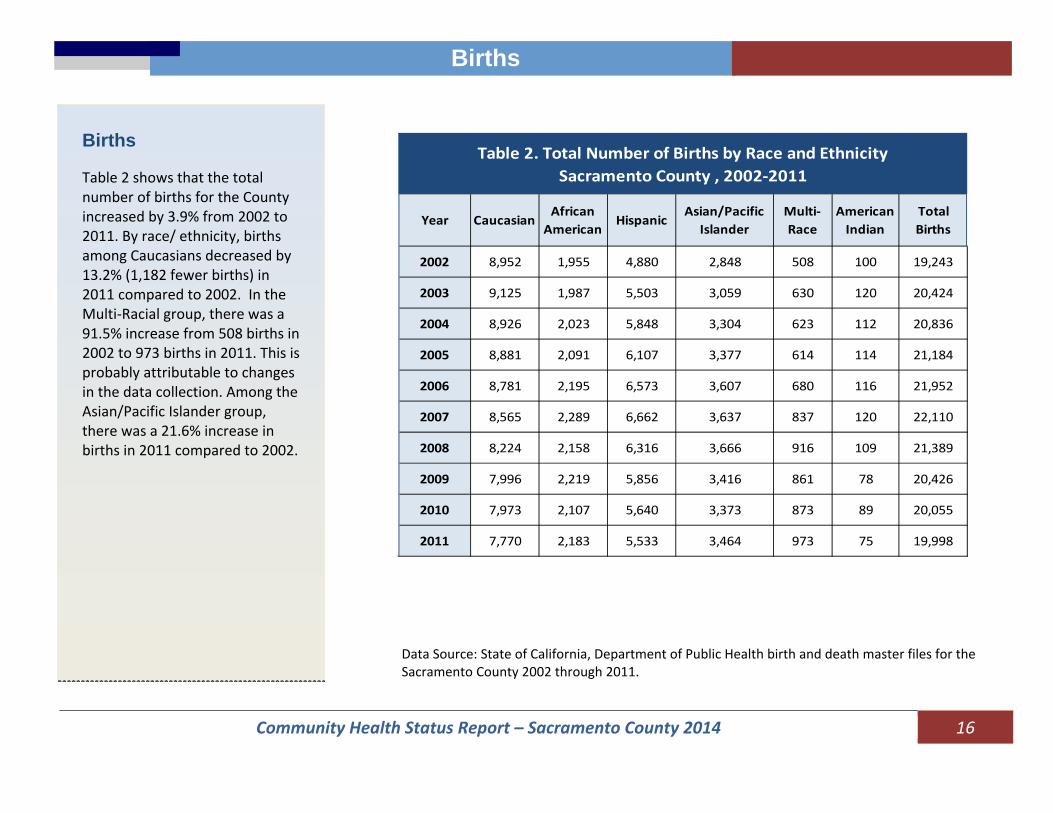
Births Table 2 shows that the total number of births for the County increased by 3.9% from 2002 to 2011. By race/ ethnicity, births among Caucasians decreased by 13.2% (1,182 fewer births) in 2011 compared to 2002. In the Multi‐Racial group, there was a 91.5% increase from 508 births in 2002 to 973 births in 2011. This is probably attributable to changes in the data collection. Among the Asian/Pacific Islander group, there was a 21.6% increase in births in 2011 compared to 2002.
Data Source: State of California, Department of Public Health birth and death master files for the Sacramento County 2002 through 2011.
Year CaucasianAfrican American
HispanicAsian/Pacific
IslanderMulti‐Race
American Indian
Total Births
2002 8,952 1,955 4,880 2,848 508 100 19,243
2003 9,125 1,987 5,503 3,059 630 120 20,424
2004 8,926 2,023 5,848 3,304 623 112 20,836
2005 8,881 2,091 6,107 3,377 614 114 21,184
2006 8,781 2,195 6,573 3,607 680 116 21,952
2007 8,565 2,289 6,662 3,637 837 120 22,110
2008 8,224 2,158 6,316 3,666 916 109 21,389
2009 7,996 2,219 5,856 3,416 861 78 20,426
2010 7,973 2,107 5,640 3,373 873 89 20,055
2011 7,770 2,183 5,533 3,464 973 75 19,998
Table 2. Total Number of Births by Race and EthnicitySacramento County , 2002‐2011

Community Health Status Report – Sacramento County 2014 17
Births
Birth Rates The birth rate (entire county, specific racial or ethnic group) is calculated as the number of live births to a certain population divided by the total number of people in that population, and is reported per 1,000 population. Rates for the County decreased from 14.8 in 2002 to 14.0 in 2011 per 1,000 population. The overall birth rate for California declined from 15.0 to 12.7 per 1,000 population. Over the 10‐year span, Hispanics had the highest birth rate over all race/ethnicity groups, followed by Asian/ Pacific Islander. Caucasians had the lowest birth rate. In 2006, the Hispanic birth rate of 24.1 per 1,000 population was 53.0% higher than the County’s birth rate in the same year.
10.0
12.0
14.0
16.0
18.0
20.0
22.0
24.0
2002 2003 2004 2005 2006 2007 2008 2009 2010 2011
Caucasian African American
Hispanic Asian/Pacific Islander
Overall Sacramento California
Figure 14. Birth Rate by Race/ Ethnicity, Sacramento County and California, 2002‐2011
Rate
per 1
,000
Pop
ulation
Data Source: State of California, Department of Public Health birth and death master files for the Sacramento County 2002 through 2011.
Community Health Status Report – Sacramento County 2014 18
Births
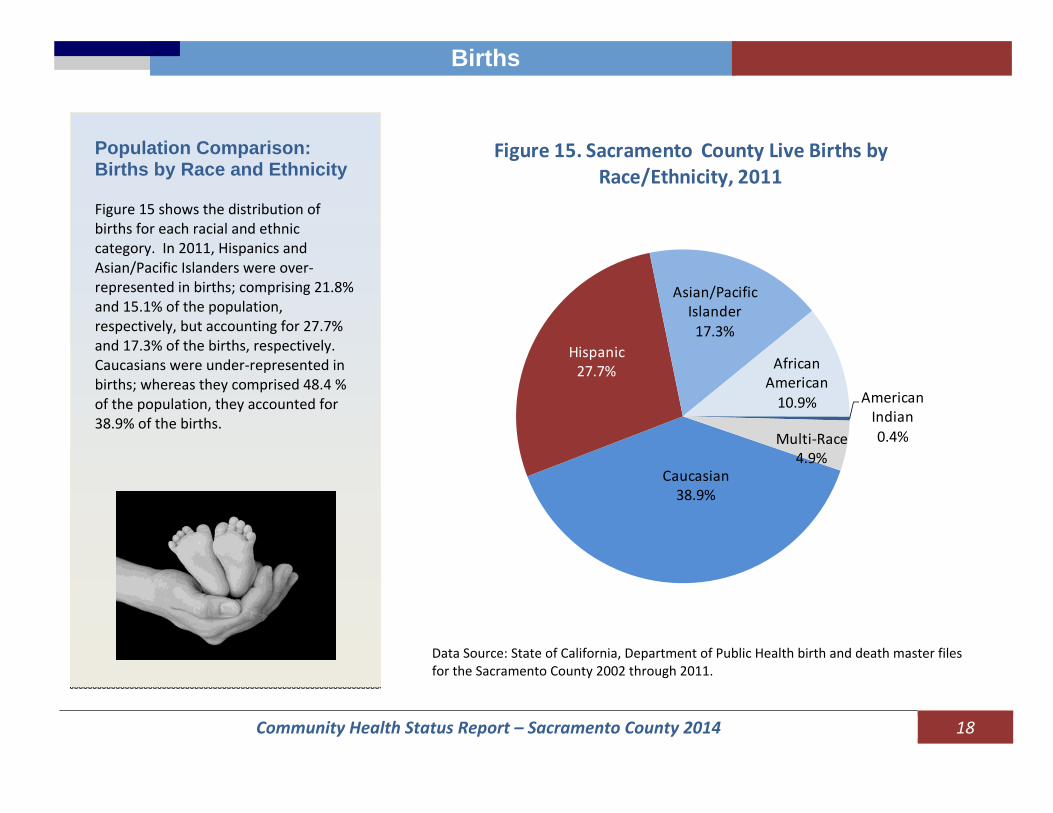
Population Comparison: Births by Race and Ethnicity Figure 15 shows the distribution of births for each racial and ethnic category. In 2011, Hispanics and Asian/Pacific Islanders were over‐represented in births; comprising 21.8% and 15.1% of the population, respectively, but accounting for 27.7% and 17.3% of the births, respectively. Caucasians were under‐represented in births; whereas they comprised 48.4 % of the population, they accounted for 38.9% of the births. Caucasian
38.9%
Hispanic27.7%
Asian/Pacific Islander17.3%
African American10.9% American
Indian0.4%Multi‐Race
4.9%
Figure 15. Sacramento County Live Births by Race/Ethnicity, 2011
Data Source: State of California, Department of Public Health birth and death master files for the Sacramento County 2002 through 2011.

Community Health Status Report – Sacramento County 2014 19
Births
Fertility Rates The fertility rate is calculated by dividing the number of births by the number of women ages 15‐44 years old (child‐bearing) and then multiplying that result by 1,000. It is defined as the number of births per 1,000 females ages 15 to 44 years. Over the past 10 years, Sacramento County had an average fertility rate of 70.6 per 1,000 females ages 15 to 44. During the 10‐year period, Caucasians experienced the lowest fertility rate among all racial and ethnic groups. The fertility rate for Hispanic women was the highest, although it decreased 17.5% over the 10‐year period.
Data Source: State of California, Department of Public Health birth and death master files for the Sacramento County 2002 through 2011.
50.0
60.0
70.0
80.0
90.0
100.0
110.0
2002 2003 2004 2005 2006 2007 2008 2009 2010 2011
Caucasian Hispanic
Asian/Pacific Islander African American
Sacramento California
Figure 16. Fertility Rate by Race/ Ethnicity, Sacramento County and California, 2002‐2011
Rate
per 1
,000
Pop
ulation

Community Health Status Report – Sacramento County 2014 20
Births
Teenage Births
Adolescent pregnancy and childbearing have been associated with adverse health and social consequences. Births to mothers less than 20 years of age are presented here in three different age groups (12‐14, 15‐17 and 18‐19). The rates of births to females ages 15 to 17 years dropped 48.6% during the 10‐year period, from 20.3 in 2002 to 10.5 per 1,000 females in 2011. The birth rate for 18‐19 year‐olds declined 33.5% from 65.2 in 2002 to 43.4 per 1,000 females in 2011. 0.0
10.0
20.0
30.0
40.0
50.0
60.0
70.0
2002 2003 2004 2005 2006 2007 2008 2009 2010 2011
12‐14 15‐17 18‐19
Figure 17. Teen Birth Rate by YearSacramento County, 2002‐2011
Rate
per 1
,000
Fem
ales by Age Grou
p
Data Source: State of California, Department of Public Health birth and death master files for the Sacramento County 2002 through 2011.

Community Health Status Report – Sacramento County 2014 21
Births
From 2002 to 2011, the birth rate for adolescents aged 15 to 19 years declined for all racial and ethnic groups. The overall teen birth rate declined 25.5%. The teen birth rate for Asian/Pacific Islanders dropped 53.4%; Hispanics dropped 35.3%; Caucasians dropped 35.1% and African Americans dropped 15.6% during the 10‐year period. Over the 10‐year span, Hispanics had the highest teen birth rate. In 2011, the teen birth rates for Hispanics and African Americans were more than two times higher than that of Caucasians and Asian/Pacific Islanders.
Data Source: State of California, Department of Public Health birth and death master files for the Sacramento County 2002 through 2011.
10.0
20.0
30.0
40.0
50.0
60.0
70.0
2002 2003 2004 2005 2006 2007 2008 2009 2010 2011
Caucasian Hispanic
Asian/Pacific Islander African American
Sacramento California
Figure 18. Birth Rate by Race/ Ethnicity for Mothers Aged 15‐19 Sacramento County and California, 2002‐2011
Rate
per 1
,000
Pop
ulation

Community Health Status Report – Sacramento County 2014 22
Births
Entry into Prenatal Care Early entry into prenatal care (PNC) is vital to the health of the mother and the infant. The Healthy People 2020 Objective (U.S. Govt.) states that 77.9% of mothers should enter prenatal care during the first trimester (first three months of pregnancy). During the past 10 years, Sacramento County met the Objective except for the years 2007 and 2008. From 2002 to 2011, the percent of mothers entering prenatal care during the first trimester decreased for all racial /ethnic groups. Caucasians had the highest percentage entering prenatal care during the first trimester, over the 10‐year period.
Data Source: State of California, Department of Public Health birth and death master files for the Sacramento County 2002 through 2011.
70.0
72.0
74.0
76.0
78.0
80.0
82.0
84.0
86.0
88.0
90.0
2002 2003 2004 2005 2006 2007 2008 2009 2010 2011
Caucasian Hispanic
Asian/Pacific Islander African American
Sacramento Healthy People 2020
Figure 19, First Trimester Entry Into PNC by Race/ Ethnicity Sacramento County , 2002‐2011
PercentEnterin
gEarly
PNC

Community Health Status Report – Sacramento County 2014 23
Births
Sacramento County did not achieve the Healthy People 2020 Objective for entry into prenatal care for mothers aged less than 25 years old, regardless of race/ethnicity, in 2011. The percentage entering early prenatal care increased with mothers’ ages. In 2011, women aged 25 or older, with the exception of African Americans, were either very close to or surpassed the Healthy People 2020 Objective for early entry into prenatal care.
Data Source: State of California, Department of Public Health birth and death master files for the Sacramento County 2002 through 2011.
45.0
50.0
55.0
60.0
65.0
70.0
75.0
80.0
85.0
90.0
19 and Under 20 ‐24 25‐29 30‐34 35 and Older
Hispanic CaucasianAfrican American Asian/Pacific IslanderMulti‐Race Healthy People 2020
Figure 20, First Trimester Entry Into Prenatal Care by Race/Ethnicity and Age of Mother, Sacramento County, 2011
PercentEnterin
g Early
PNC
Community Health Status Report – Sacramento County 2014 24
Births
4.0
6.0
8.0
10.0
12.0
14.0
2002 2003 2004 2005 2006 2007 2008 2009 2010 2011
Hispanic Caucasian African American
AsianPacific Islander Healthy People 2020 Sacramento
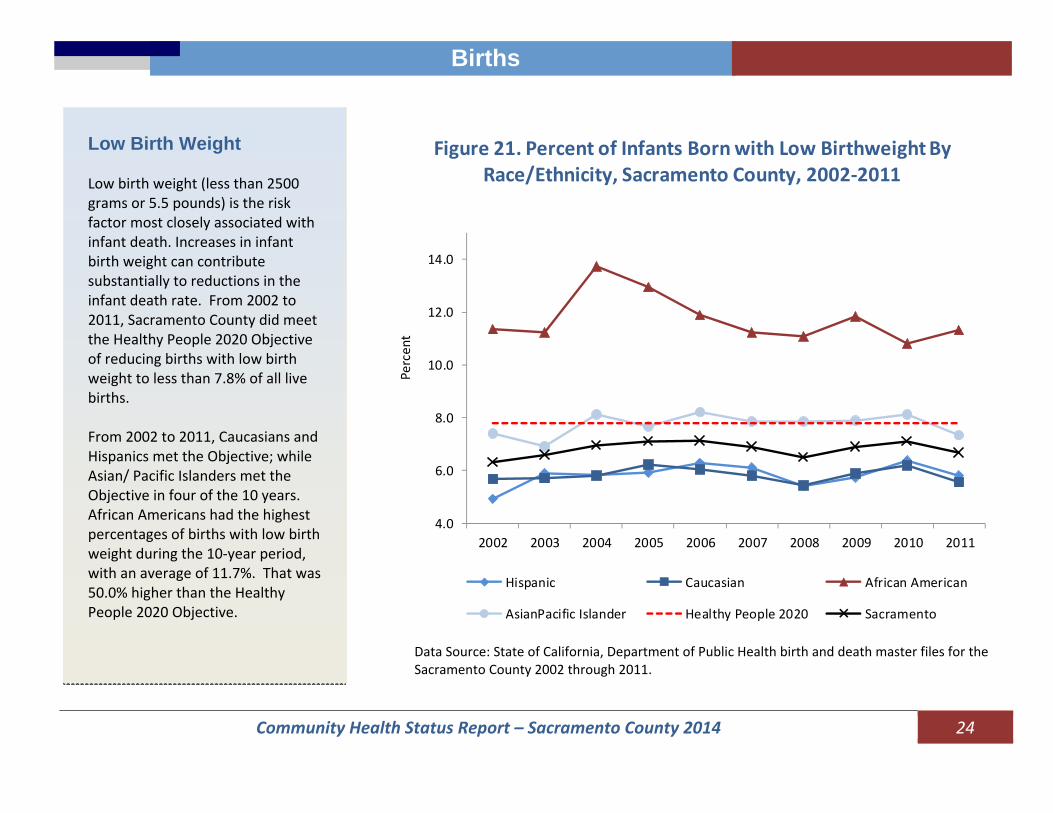
Figure 21. Percent of Infants Born with Low Birthweight By Race/Ethnicity, Sacramento County, 2002‐2011
Percent
Low Birth Weight Low birth weight (less than 2500 grams or 5.5 pounds) is the risk factor most closely associated with infant death. Increases in infant birth weight can contribute substantially to reductions in the infant death rate. From 2002 to 2011, Sacramento County did meet the Healthy People 2020 Objective of reducing births with low birth weight to less than 7.8% of all live births. From 2002 to 2011, Caucasians and Hispanics met the Objective; while Asian/ Pacific Islanders met the Objective in four of the 10 years. African Americans had the highest percentages of births with low birth weight during the 10‐year period, with an average of 11.7%. That was 50.0% higher than the Healthy People 2020 Objective.
Data Source: State of California, Department of Public Health birth and death master files for the Sacramento County 2002 through 2011.
Community Health Status Report – Sacramento County 2014 25
Births
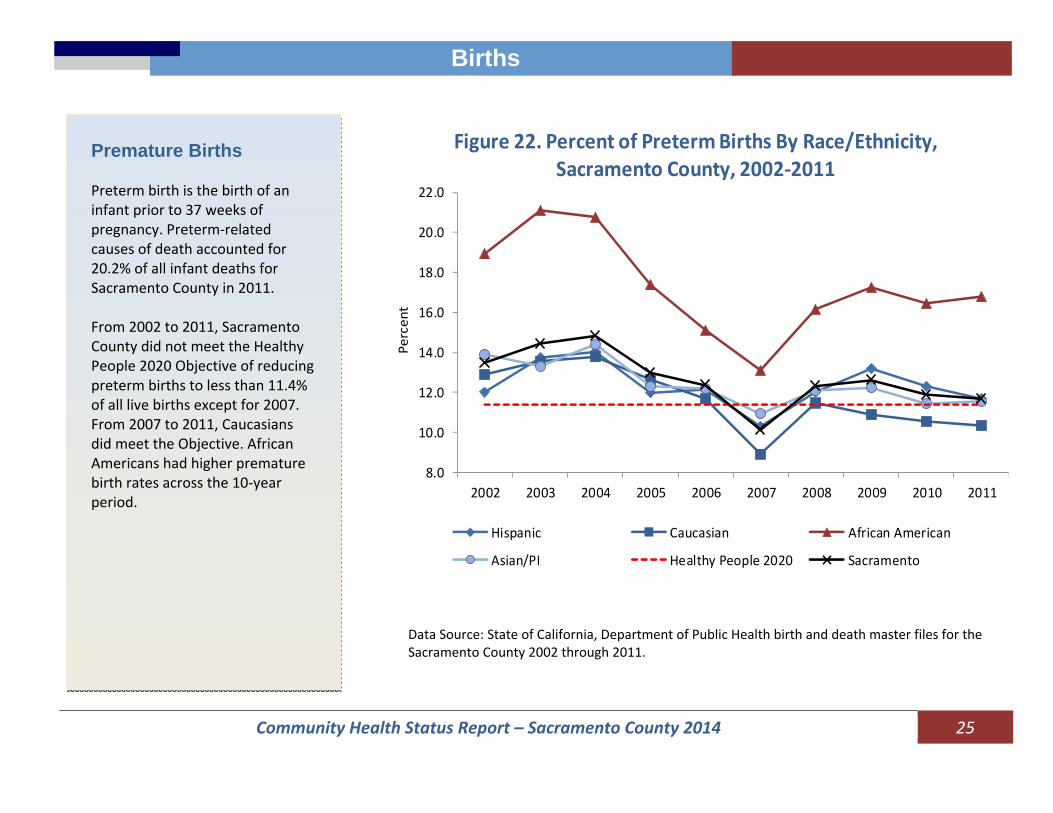
Premature Births Preterm birth is the birth of an infant prior to 37 weeks of pregnancy. Preterm‐related causes of death accounted for 20.2% of all infant deaths for Sacramento County in 2011. From 2002 to 2011, Sacramento County did not meet the Healthy People 2020 Objective of reducing preterm births to less than 11.4% of all live births except for 2007. From 2007 to 2011, Caucasians did meet the Objective. African Americans had higher premature birth rates across the 10‐year period.
8.0
10.0
12.0
14.0
16.0
18.0
20.0
22.0
2002 2003 2004 2005 2006 2007 2008 2009 2010 2011
Hispanic Caucasian African American
Asian/PI Healthy People 2020 Sacramento
Figure 22. Percent of Preterm Births By Race/Ethnicity,Sacramento County, 2002‐2011
Percent
Data Source: State of California, Department of Public Health birth and death master files for the Sacramento County 2002 through 2011.

Community Health Status Report – Sacramento County 2014 26
Births
Payment Source for Delivery In 2011, Medi‐Cal payment accounted for 45.3% of all deliveries, and private insurance paid for 49.7% of deliveries. The major sources of payment for deliveries by race and ethnicity were: African Americans – Medi‐Cal (64.0%); Hispanics – Medi‐Cal (62.8%); Caucasians – Private (63.4%); Asian/Pacific Islanders – Private (56.7%). Insurance status was reported as none or unknown for 6.4% of deliveries in Sacramento County; this was equivalent to 239 births in 2011.
0.0 10.0 20.0 30.0 40.0 50.0 60.0 70.0
Hispanic
Caucasian
African American
Asian/Pacific Islander
Multi‐Race
Overall
Others Private Medi‐Cal
Figure 23. Percent of Births by Payment Source at Delivery and Race/Ethnicity, Sacramento County, 2011
Percent
Data Source: State of California, Department of Public Health birth and death master files for the Sacramento County 2002 through 2011.
Community Health Status Report – Sacramento County 2014 27
Communicable Diseases
Communicable Diseases
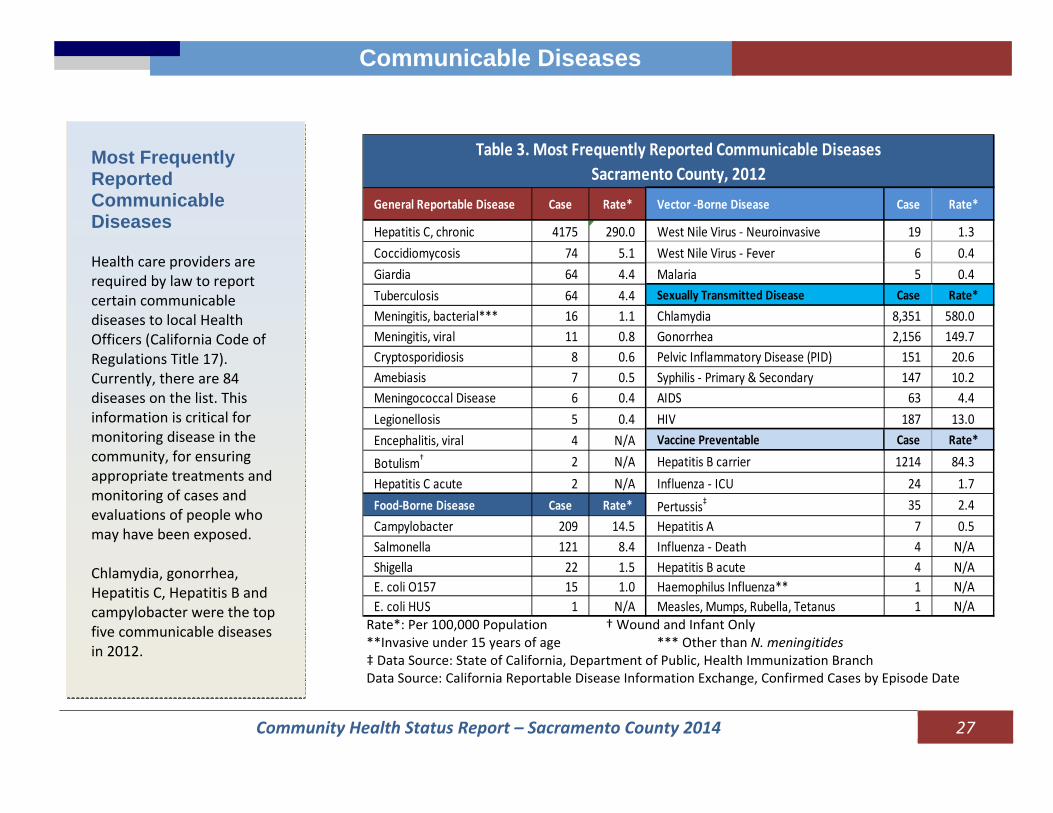
Most Frequently Reported Communicable Diseases Health care providers are required by law to report certain communicable diseases to local Health Officers (California Code of Regulations Title 17). Currently, there are 84 diseases on the list. This information is critical for monitoring disease in the community, for ensuring appropriate treatments and monitoring of cases and evaluations of people who may have been exposed. Chlamydia, gonorrhea, Hepatitis C, Hepatitis B and campylobacter were the top five communicable diseases in 2012.
Rate*: Per 100,000 Population † Wound and Infant Only **Invasive under 15 years of age *** Other than N. meningitides ‡ Data Source: State of California, Department of Public, Health Immuniza on Branch Data Source: California Reportable Disease Information Exchange, Confirmed Cases by Episode Date
General Reportable Disease Case Rate* Vector ‐Borne Disease Case Rate*
Hepatitis C, chronic 4175 290.0 West Nile Virus ‐ Neuroinvasive 19 1.3Coccidiomycosis 74 5.1 West Nile Virus ‐ Fever 6 0.4Giardia 64 4.4 Malaria 5 0.4Tuberculosis 64 4.4 Sexually Transmitted Disease Case Rate*Meningitis, bacterial*** 16 1.1 Chlamydia 8,351 580.0Meningitis, viral 11 0.8 Gonorrhea 2,156 149.7Cryptosporidiosis 8 0.6 Pelvic Inflammatory Disease (PID) 151 20.6Amebiasis 7 0.5 Syphilis ‐ Primary & Secondary 147 10.2Meningococcal Disease 6 0.4 AIDS 63 4.4Legionellosis 5 0.4 HIV 187 13.0Encephalitis, viral 4 N/A Vaccine Preventable Case Rate*
Botulism† 2 N/A Hepatitis B carrier 1214 84.3Hepatitis C acute 2 N/A Influenza ‐ ICU 24 1.7Food‐Borne Disease Case Rate* Pertussis‡ 35 2.4Campylobacter 209 14.5 Hepatitis A 7 0.5Salmonella 121 8.4 Influenza ‐ Death 4 N/AShigella 22 1.5 Hepatitis B acute 4 N/AE. coli O157 15 1.0 Haemophilus Influenza** 1 N/AE. coli HUS 1 N/A Measles, Mumps, Rubella, Tetanus 1 N/A
Table 3. Most Frequently Reported Communicable Diseases Sacramento County, 2012
Community Health Status Report – Sacramento County 2014 28
Communicable Diseases
3.0
5.0
7.0
9.0
11.0
13.0
15.0
2002 2003 2004 2005 2006 2007 2008 2009 2010 2011
California Sacramento
Figure 24. AIDS Incidence Rate, Sacramento County vs. California. 2002‐2011
Rate Per 100,000
Pop
ulation
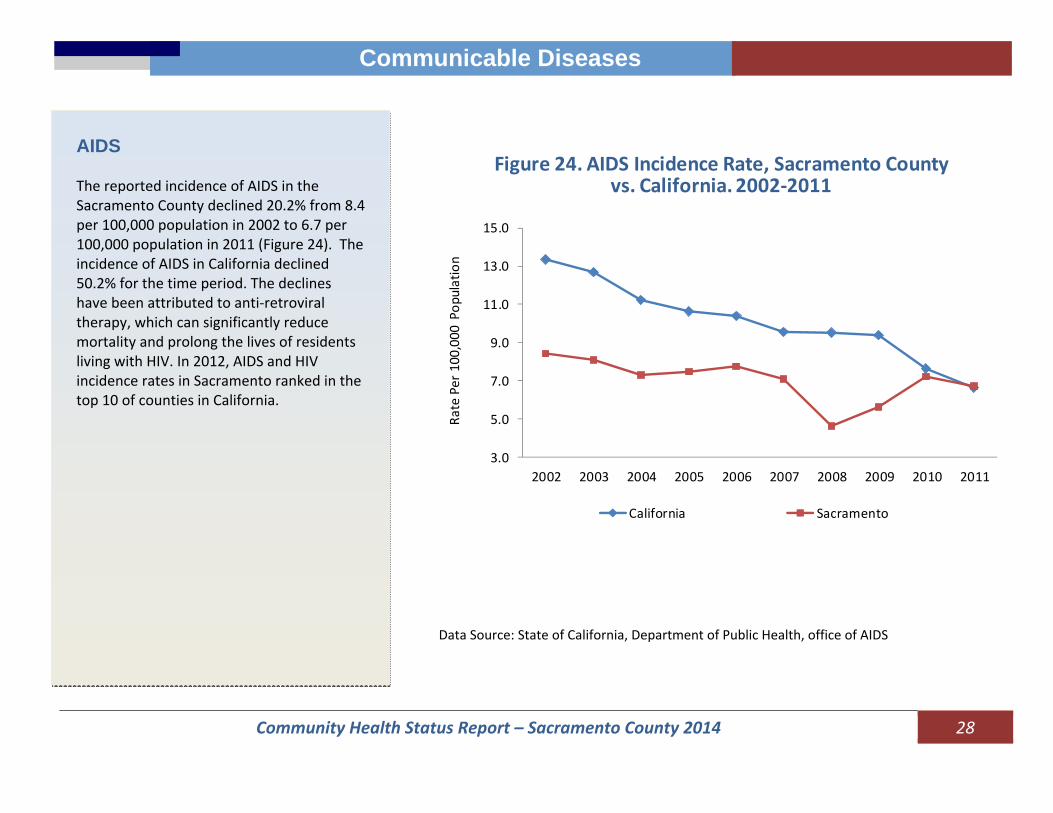
AIDS The reported incidence of AIDS in the Sacramento County declined 20.2% from 8.4 per 100,000 population in 2002 to 6.7 per 100,000 population in 2011 (Figure 24). The incidence of AIDS in California declined 50.2% for the time period. The declines have been attributed to anti‐retroviral therapy, which can significantly reduce mortality and prolong the lives of residents living with HIV. In 2012, AIDS and HIV incidence rates in Sacramento ranked in the top 10 of counties in California.
Data Source: State of California, Department of Public Health, office of AIDS
Community Health Status Report – Sacramento County 2014 29
Communicable Diseases
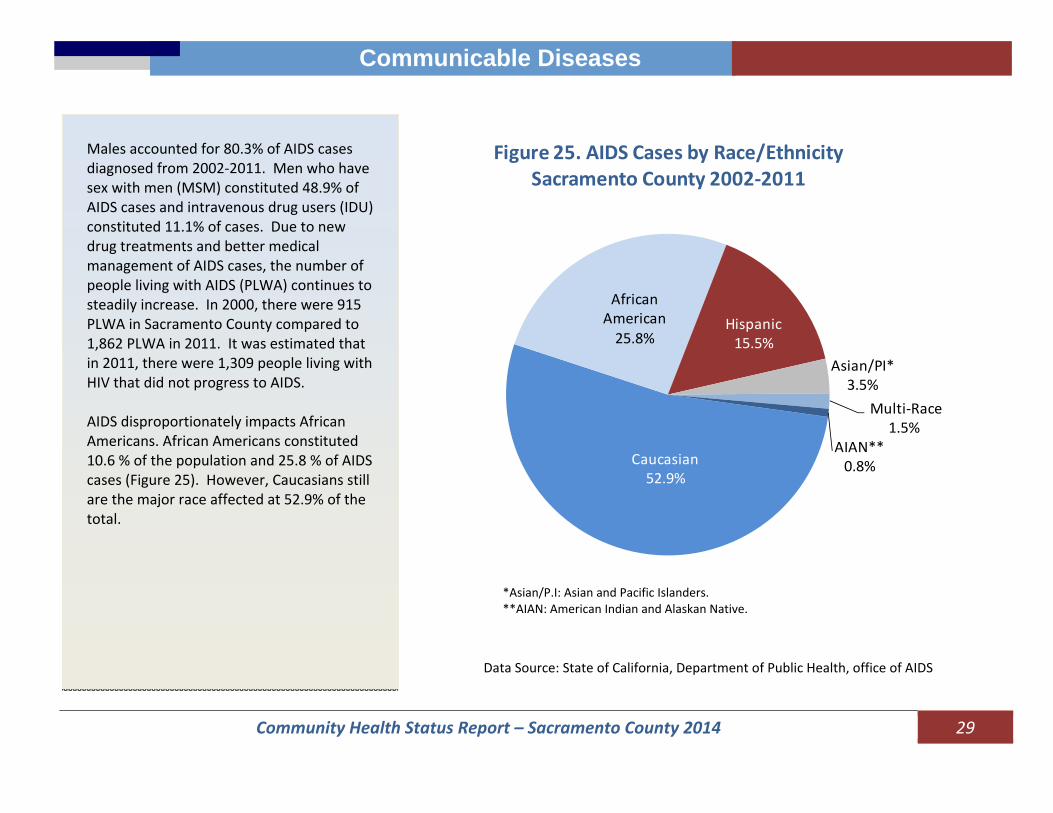
Males accounted for 80.3% of AIDS cases diagnosed from 2002‐2011. Men who have sex with men (MSM) constituted 48.9% of AIDS cases and intravenous drug users (IDU) constituted 11.1% of cases. Due to new drug treatments and better medical management of AIDS cases, the number of people living with AIDS (PLWA) continues to steadily increase. In 2000, there were 915 PLWA in Sacramento County compared to 1,862 PLWA in 2011. It was estimated that in 2011, there were 1,309 people living with HIV that did not progress to AIDS. AIDS disproportionately impacts African Americans. African Americans constituted 10.6 % of the population and 25.8 % of AIDS cases (Figure 25). However, Caucasians still are the major race affected at 52.9% of the total.
Caucasian52.9%
African American25.8%
Hispanic15.5%
Asian/PI*3.5%
Multi‐Race1.5%
AIAN**0.8%
Figure 25. AIDS Cases by Race/Ethnicity Sacramento County 2002‐2011
Data Source: State of California, Department of Public Health, office of AIDS
*Asian/P.I: Asian and Pacific Islanders.**AIAN: American Indian and Alaskan Native.
Community Health Status Report – Sacramento County 2014 30
Communicable Diseases
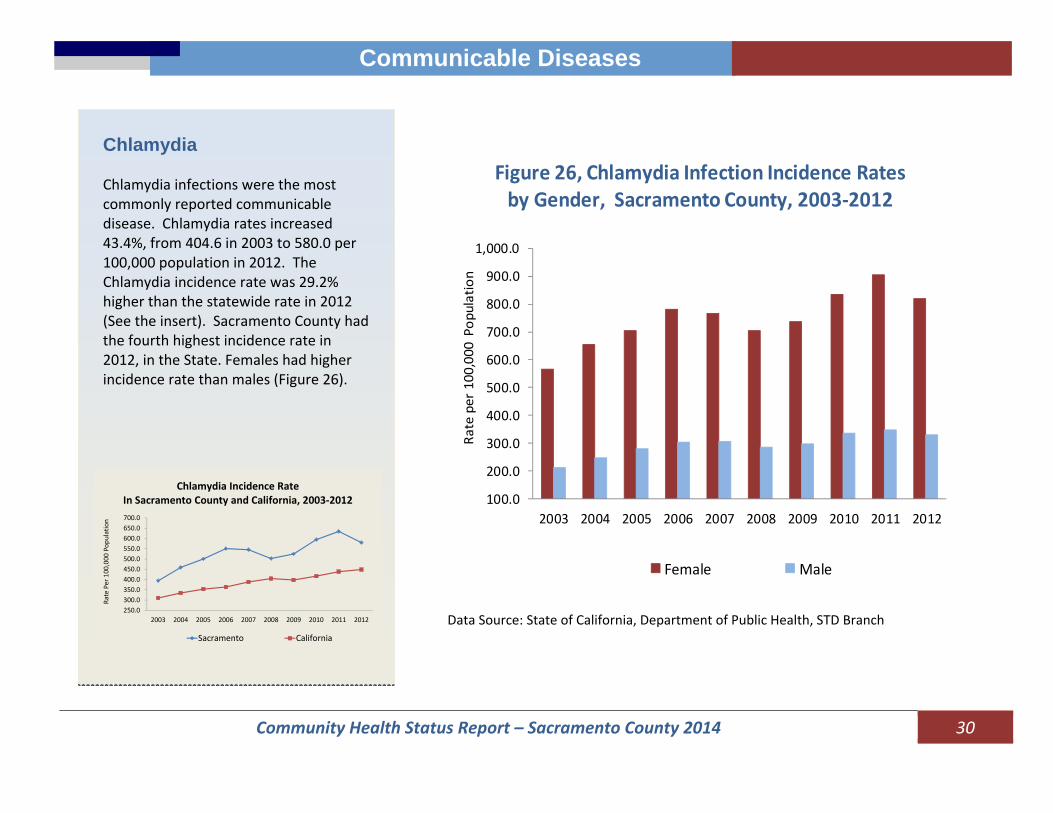
Chlamydia Chlamydia infections were the most commonly reported communicable disease. Chlamydia rates increased 43.4%, from 404.6 in 2003 to 580.0 per 100,000 population in 2012. The Chlamydia incidence rate was 29.2% higher than the statewide rate in 2012 (See the insert). Sacramento County had the fourth highest incidence rate in 2012, in the State. Females had higher incidence rate than males (Figure 26).
250.0300.0350.0400.0450.0500.0550.0600.0650.0700.0
2003 2004 2005 2006 2007 2008 2009 2010 2011 2012
Rate Per 100,000
Pop
ulation
Sacramento California
Chlamydia Incidence Rate In Sacramento County and California, 2003‐2012 100.0
200.0
300.0
400.0
500.0
600.0
700.0
800.0
900.0
1,000.0
2003 2004 2005 2006 2007 2008 2009 2010 2011 2012
Rate per 100,000
Pop
ulation
Female Male
Figure 26, Chlamydia Infection Incidence Rates by Gender, Sacramento County, 2003‐2012
Data Source: State of California, Department of Public Health, STD Branch

Community Health Status Report – Sacramento County 2014 31
Communicable Diseases
In 2012, 70.0% of Chlamydia cases were females. Males may not experience symptoms and therefore do not get tested and reported. Among females, 31.9% of cases were amongst adolescents aged 15‐19 years, while the age group of 20‐24 year‐olds constituted 39.1% of cases.
0.0
500.0
1000.0
1500.0
2000.0
2500.0
3000.0
3500.0
4000.0
4500.0
5000.0
10‐14 15‐19 20‐24 25‐29 30‐34 35‐44 45+
Rate per 100,000
Pop
ulation
Figure 27. Chlamydia Infection Incidence Rate by Age and Gender, Sacramento County, 2012
Male Female
Data Source: State of California, Department of Public Health, STD Branch
Community Health Status Report – Sacramento County 2014 32
Communicable Diseases
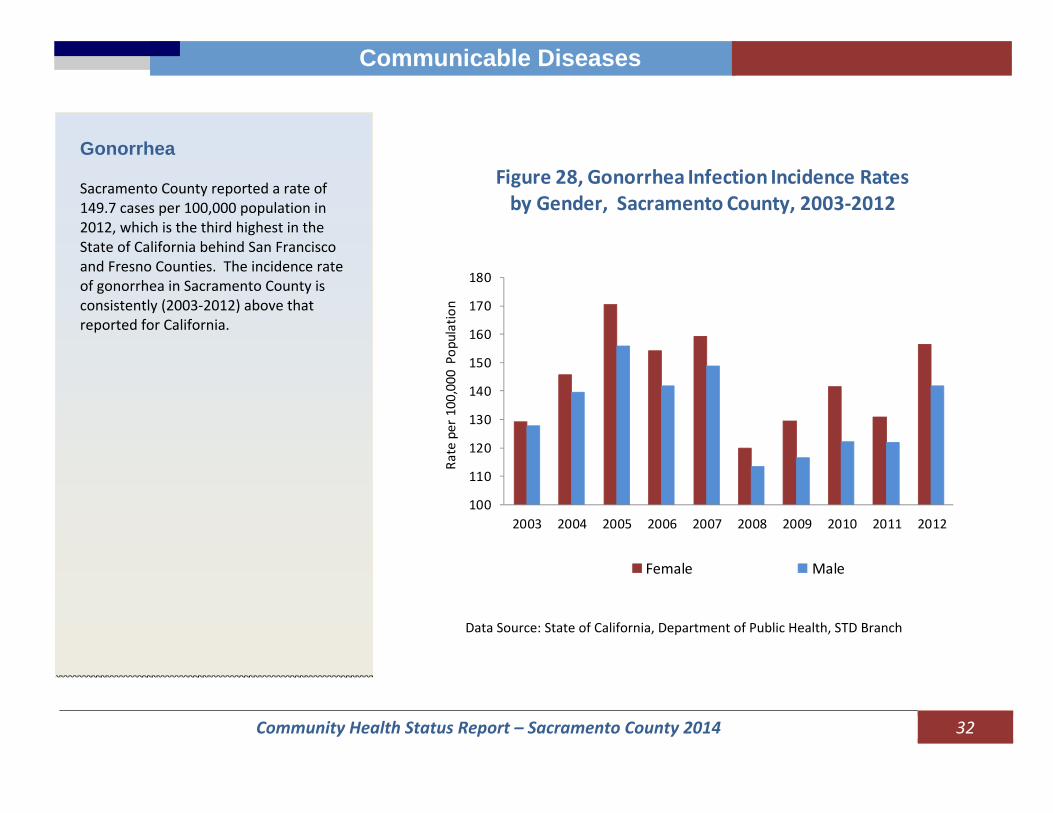
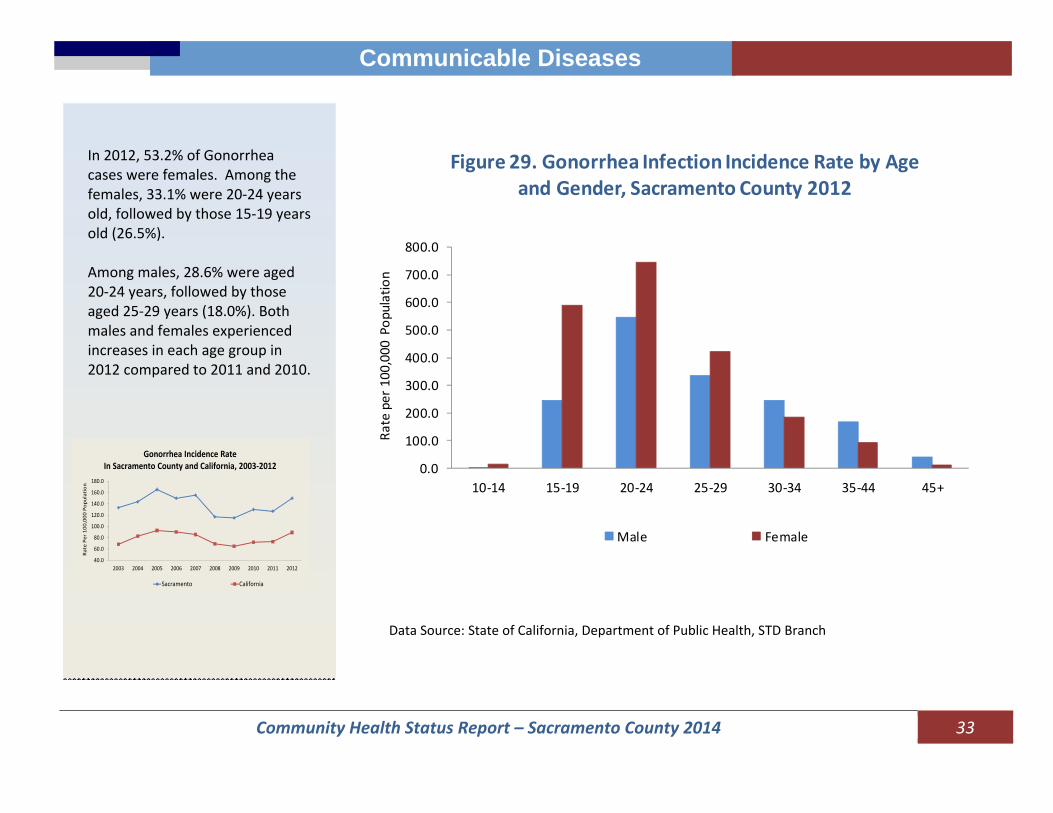
Gonorrhea Sacramento County reported a rate of 149.7 cases per 100,000 population in 2012, which is the third highest in the State of California behind San Francisco and Fresno Counties. The incidence rate of gonorrhea in Sacramento County is consistently (2003‐2012) above that reported for California.
100
110
120
130
140
150
160
170
180
2003 2004 2005 2006 2007 2008 2009 2010 2011 2012
Rate per 100,000
Pop
ulation
Female Male
Figure 28, Gonorrhea Infection Incidence Rates by Gender, Sacramento County, 2003‐2012
Data Source: State of California, Department of Public Health, STD Branch
Community Health Status Report – Sacramento County 2014 33
Communicable Diseases
In 2012, 53.2% of Gonorrhea cases were females. Among the females, 33.1% were 20‐24 years old, followed by those 15‐19 years old (26.5%). Among males, 28.6% were aged 20‐24 years, followed by those aged 25‐29 years (18.0%). Both males and females experienced increases in each age group in 2012 compared to 2011 and 2010.
40.0
60.0
80.0
100.0
120.0
140.0
160.0
180.0
2003 2004 2005 2006 2007 2008 2009 2010 2011 2012
Rate Per 100
,000
Pop
ulation
Sacramento California
Gonorrhea Incidence Rate In Sacramento County and California, 2003‐2012
0.0
100.0
200.0
300.0
400.0
500.0
600.0
700.0
800.0
10‐14 15‐19 20‐24 25‐29 30‐34 35‐44 45+
Rate per 100,000
Pop
ulation
Figure 29. Gonorrhea Infection Incidence Rate by Age and Gender, Sacramento County 2012
Male Female
Data Source: State of California, Department of Public Health, STD Branch

Community Health Status Report – Sacramento County 2014 34
Communicable Diseases
Syphilis The State of California continues to experience an increase in primary and secondary (P&S) syphilis cases. The number of P&S syphilis cases in Sacramento County increased from 13 cases in 2003 to 138 in 2012. Figure 30 illustrates data comparing Sacramento County’s rate to the statewide rate of P&S Syphilis. Sacramento County has surpassed the Statewide rate in recent years (2011 and 2012) with a rate of 9.6 per 100,000 population in 2012 compared to the Statewide rate of 7.8 per 100,000 population.
2.0
3.0
4.0
5.0
6.0
7.0
8.0
9.0
10.0
2008 2009 2010 2011 2012
Rate per 100,000
Pop
ulation
Figure 30. Primary and Secondary Syphilis Rate by Year, Sacramento County vs. California, 2008‐2012
Sacramento County California
Source: California Department of Public Health, STD Control Branch (data reported through 08/19/2013)
Community Health Status Report – Sacramento County 2014 35
Communicable Diseases
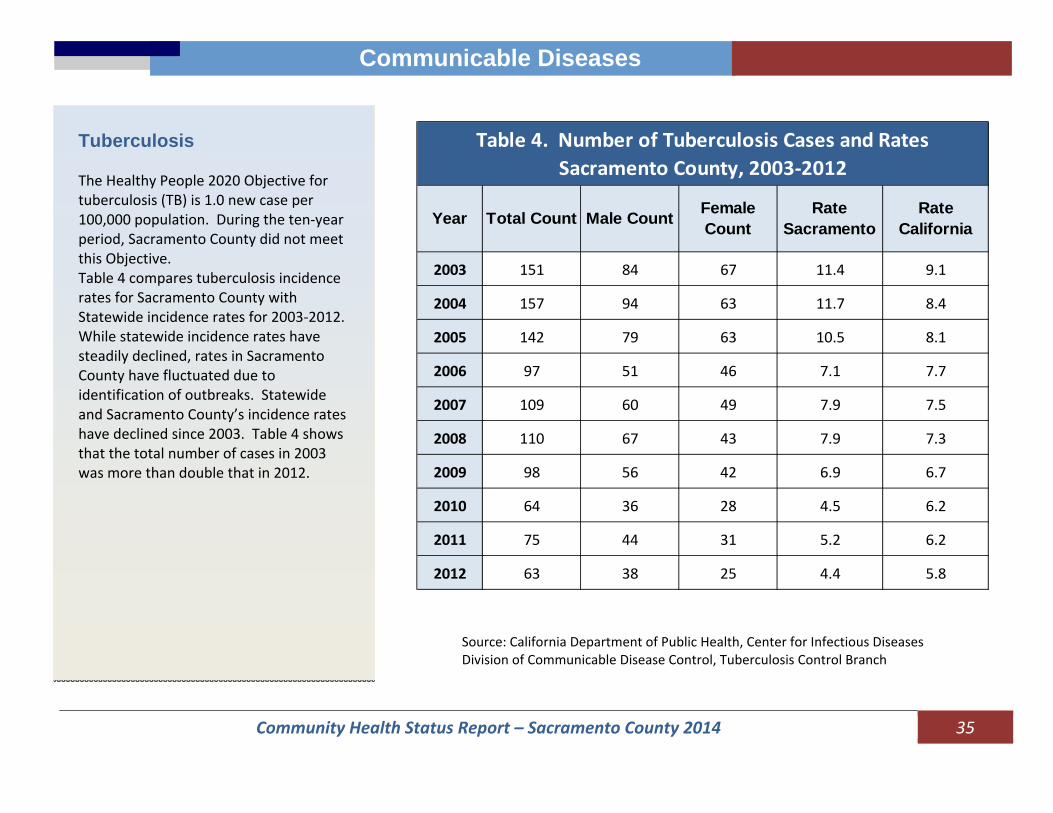
Tuberculosis The Healthy People 2020 Objective for tuberculosis (TB) is 1.0 new case per 100,000 population. During the ten‐year period, Sacramento County did not meet this Objective. Table 4 compares tuberculosis incidence rates for Sacramento County with Statewide incidence rates for 2003‐2012. While statewide incidence rates have steadily declined, rates in Sacramento County have fluctuated due to identification of outbreaks. Statewide and Sacramento County’s incidence rates have declined since 2003. Table 4 shows that the total number of cases in 2003 was more than double that in 2012.
Year Total Count Male Count Female Count
Rate Sacramento
Rate California
2003 151 84 67 11.4 9.1
2004 157 94 63 11.7 8.4
2005 142 79 63 10.5 8.1
2006 97 51 46 7.1 7.7
2007 109 60 49 7.9 7.5
2008 110 67 43 7.9 7.3
2009 98 56 42 6.9 6.7
2010 64 36 28 4.5 6.2
2011 75 44 31 5.2 6.2
2012 63 38 25 4.4 5.8
Table 4. Number of Tuberculosis Cases and Rates Sacramento County, 2003‐2012
Source: California Department of Public Health, Center for Infectious Diseases Division of Communicable Disease Control, Tuberculosis Control Branch

Community Health Status Report – Sacramento County 2014 36
Communicable Diseases
In 2012, Asian/Pacific Islanders made up the highest proportion of TB cases in the County (Figure 31). TB incidence rates declined among all ethnic groups, but the rates among Asians and Pacific Islanders remained higher than the rates for all other race/ethnicity groups over the 10‐year period (see following graph).
Source: California Department of Public Health, Center for Infectious Diseases Division of Communicable Disease Control, Tuberculosis Control Branch
0.0
10.0
20.0
30.0
40.0
50.0
60.0
2003 2004 2005 2006 2007 2008 2009 2010 2011 2012
Rate per 100,000
Pop
ulation
Figure 31. Tuberculosis Incidence Rates by Race/Ethnicity Sacramento County, 2003‐2012
Caucasian African American Hispanic Asian/Pacific Islander
Community Health Status Report – Sacramento County 2014 37
Communicable Diseases
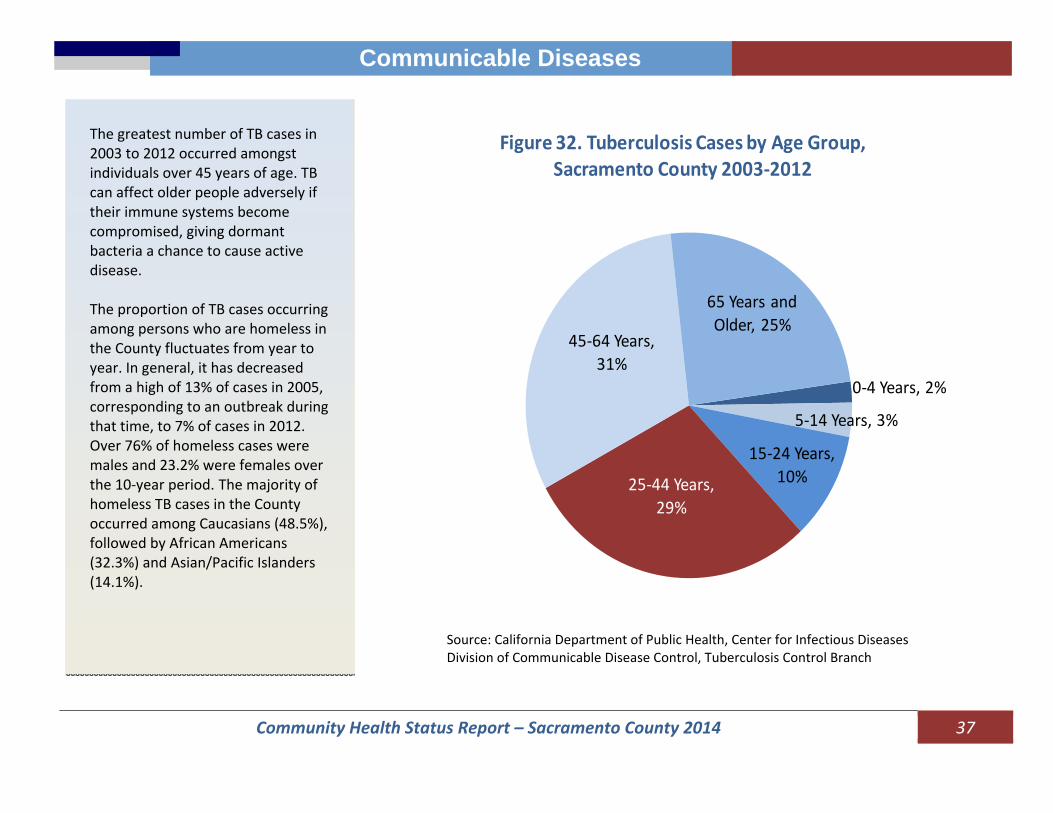
The greatest number of TB cases in 2003 to 2012 occurred amongst individuals over 45 years of age. TB can affect older people adversely if their immune systems become compromised, giving dormant bacteria a chance to cause active disease. The proportion of TB cases occurring among persons who are homeless in the County fluctuates from year to year. In general, it has decreased from a high of 13% of cases in 2005, corresponding to an outbreak during that time, to 7% of cases in 2012. Over 76% of homeless cases were males and 23.2% were females over the 10‐year period. The majority of homeless TB cases in the County occurred among Caucasians (48.5%), followed by African Americans (32.3%) and Asian/Pacific Islanders (14.1%).
0‐4 Years, 2%
5‐14 Years, 3%
15‐24 Years, 10%25‐44 Years,
29%
45‐64 Years, 31%
65 Years and Older, 25%
Figure 32. Tuberculosis Cases by Age Group, Sacramento County 2003‐2012
Source: California Department of Public Health, Center for Infectious Diseases Division of Communicable Disease Control, Tuberculosis Control Branch
Community Health Status Report – Sacramento County 2014 38
Communicable Diseases
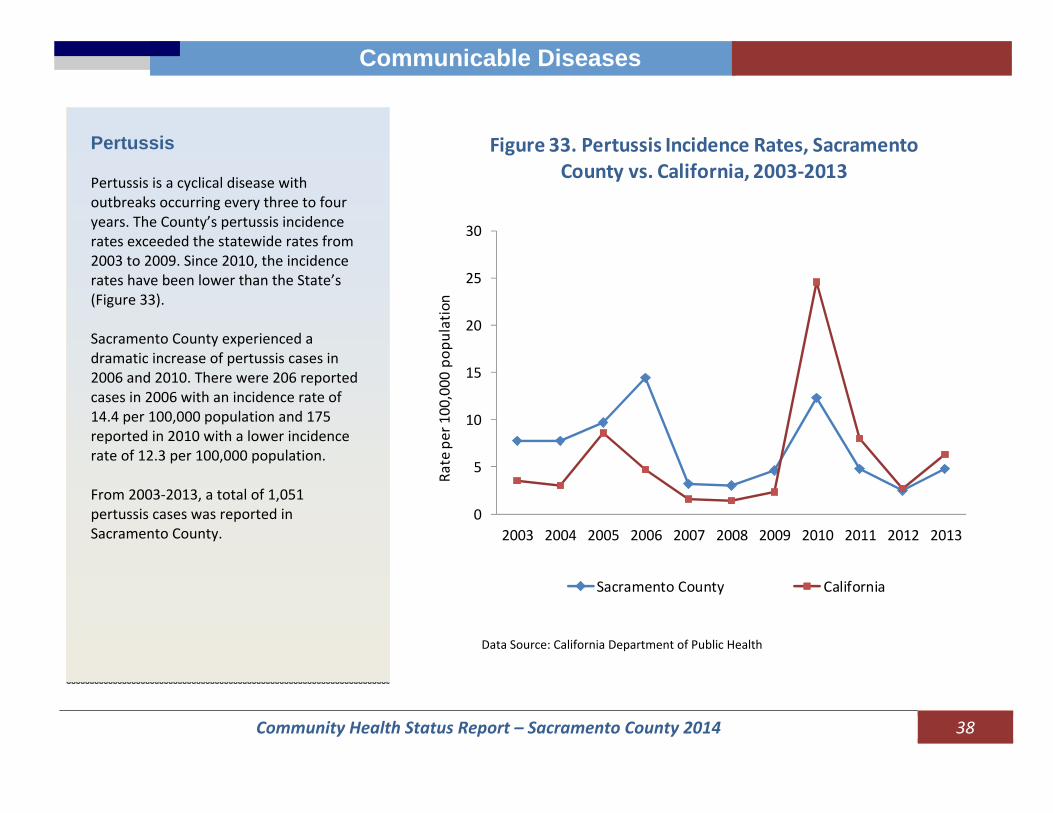
Pertussis Pertussis is a cyclical disease with outbreaks occurring every three to four years. The County’s pertussis incidence rates exceeded the statewide rates from 2003 to 2009. Since 2010, the incidence rates have been lower than the State’s (Figure 33). Sacramento County experienced a dramatic increase of pertussis cases in 2006 and 2010. There were 206 reported cases in 2006 with an incidence rate of 14.4 per 100,000 population and 175 reported in 2010 with a lower incidence rate of 12.3 per 100,000 population. From 2003‐2013, a total of 1,051 pertussis cases was reported in Sacramento County.
0
5
10
15
20
25
30
2003 2004 2005 2006 2007 2008 2009 2010 2011 2012 2013
Rate per 100,000
pop
ulation
Figure 33. Pertussis Incidence Rates, Sacramento County vs. California, 2003‐2013
Sacramento County California
Data Source: California Department of Public Health
Community Health Status Report – Sacramento County 2014 39
Chronic Diseases
Chronic Disease
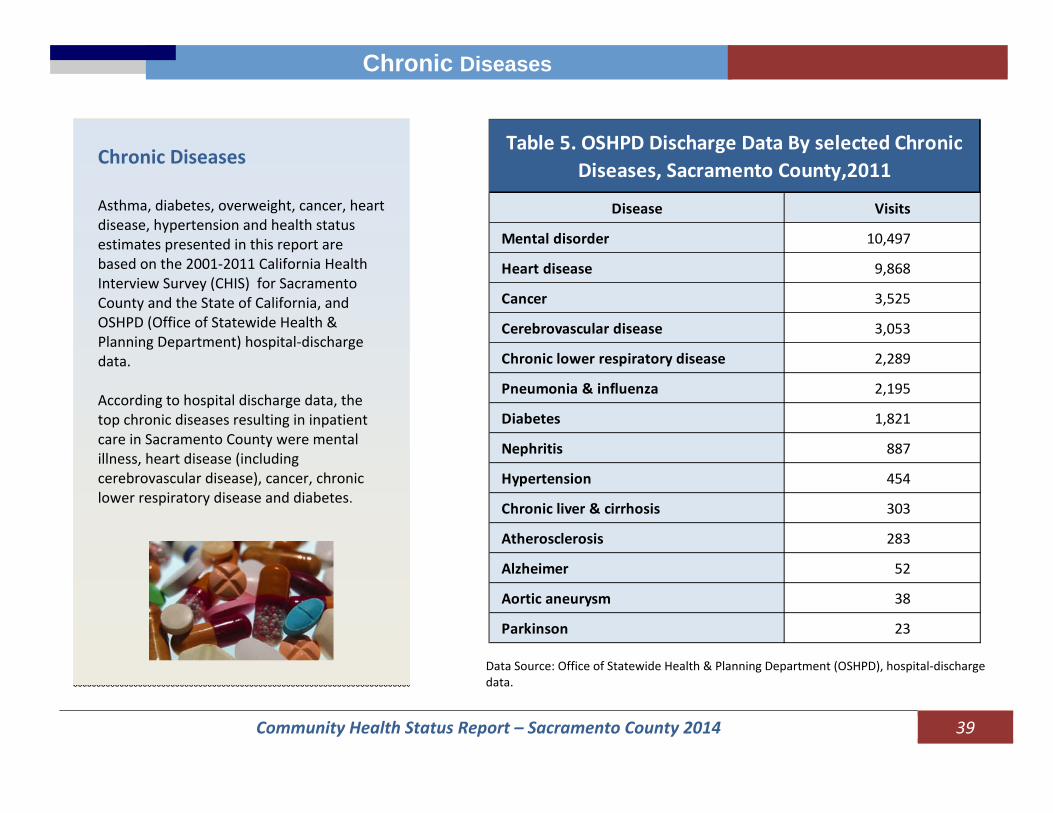
Chronic Diseases Asthma, diabetes, overweight, cancer, heart disease, hypertension and health status estimates presented in this report are based on the 2001‐2011 California Health Interview Survey (CHIS) for Sacramento County and the State of California, and OSHPD (Office of Statewide Health & Planning Department) hospital‐discharge data. According to hospital discharge data, the top chronic diseases resulting in inpatient care in Sacramento County were mental illness, heart disease (including cerebrovascular disease), cancer, chronic lower respiratory disease and diabetes.
Table 5. OSHPD Discharge Data By selected Chronic Diseases, Sacramento County,2011
Disease Visits
Mental disorder 10,497
Heart disease 9,868
Cancer 3,525
Cerebrovascular disease 3,053
Chronic lower respiratory disease 2,289
Pneumonia & influenza 2,195
Diabetes 1,821
Nephritis 887
Hypertension 454
Chronic liver & cirrhosis 303
Atherosclerosis 283
Alzheimer 52
Aortic aneurysm 38
Parkinson 23
Data Source: Office of Statewide Health & Planning Department (OSHPD), hospital‐discharge data.

Community Health Status Report – Sacramento County 2014 40
Chronic Diseases
Asthma Lifetime Asthma Prevalence In 2011, 14.9%, (an estimated 209,000) of Sacramento County residents of all ages were diagnosed with asthma at some point in their lives (lifetime asthma prevalence). Compared to California, the lifetime asthma prevalence for residents in Sacramento County was higher across all years (Figure 34). In 2011, Sacramento County had the lowest asthma prevalence (14.9%) since 2001. In 2011, the lifetime asthma prevalence was only 5.7% higher in Sacramento County than the State, the smallest difference over the period.
Data Source: California Health Interview Survey 2001‐2011 (CHIS)
10.0
12.0
14.0
16.0
18.0
20.0
2001 2003 2005 2007 2009 2011
Figure 34. Lifetime Asthma Prevalence, Sacramento County vs. California, 2001‐2011
Sacramento County CaliforniaPercen
t

Community Health Status Report – Sacramento County 2014 41
Chronic Diseases
Asthma Prevalence by Age Figure 35 shows the distribution of asthma prevalence by age group. In Sacramento County, young adults aged 18‐24 years of age had the highest asthma prevalence (26.0 %), followed by residents 25‐64 years of age (15.3%).
6.0
9.0
12.0
15.0
18.0
21.0
24.0
27.0
0‐4 5‐11 12‐17 18‐24 25‐64 65+
Sacramento California
Percen
t
Figure 35. Lifetime Asthma Prevalence by Age Group
Data Source: California Health Interview Survey 2001‐2011 (CHIS)
Community Health Status Report – Sacramento County 2014 42
Chronic Diseases
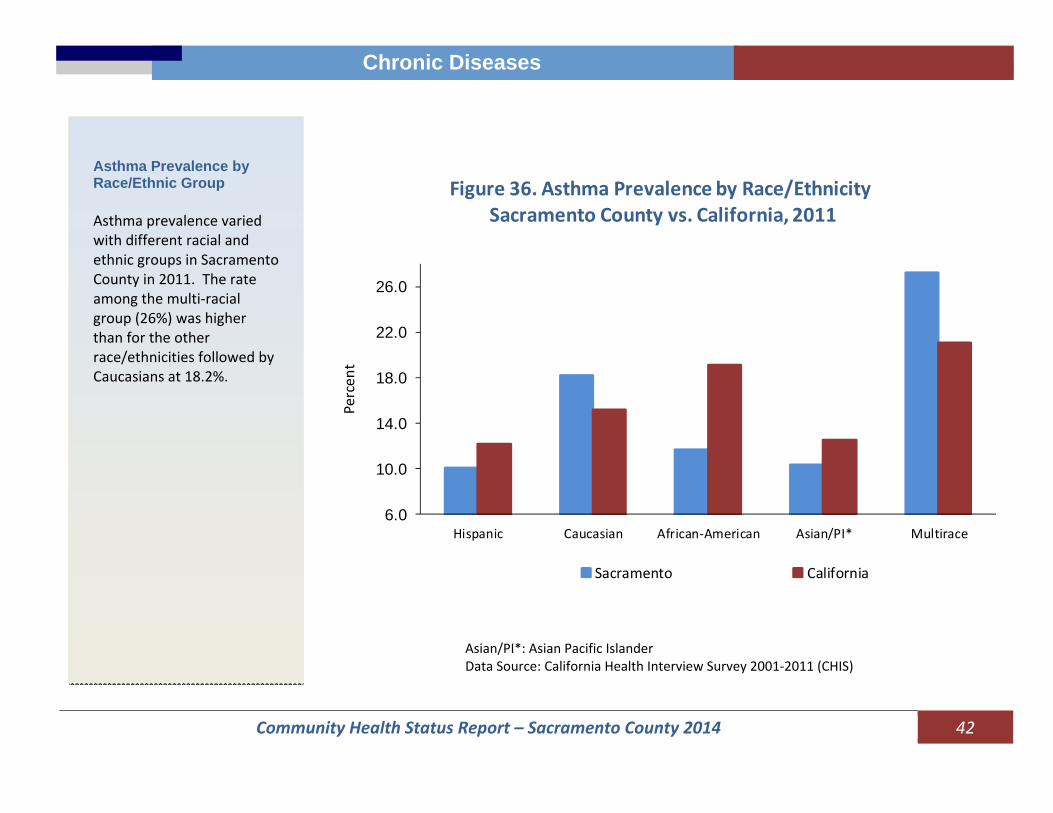
Asthma Prevalence by Race/Ethnic Group Asthma prevalence varied with different racial and ethnic groups in Sacramento County in 2011. The rate among the multi‐racial group (26%) was higher than for the other race/ethnicities followed by Caucasians at 18.2%.
6.0
10.0
14.0
18.0
22.0
26.0
Hispanic Caucasian African‐American Asian/PI* Multirace
Sacramento California
Figure 36. Asthma Prevalence by Race/EthnicitySacramento County vs. California, 2011
Percen
t
Asian/PI*: Asian Pacific Islander Data Source: California Health Interview Survey 2001‐2011 (CHIS)

Community Health Status Report – Sacramento County 2014 43
Chronic Diseases
Chronic Lower Respiratory Disease Chronic Lower Respiratory Diseases (CLRD) is a diverse group of disorders involving impairment of lung function. CLRD comprises three major diseases: chronic bronchitis, emphysema and asthma. Conditions are characterized by shortness of breath due to airway obstruction. Mortality is high in older age groups, especially greater than age 65. Deaths were distributed primarily in the following zip Codes: 95608 (Carmichael), 95823 (Sacramento), and 95621(Citrus Heights), 95828 (Florin) and 95630 (Folsom/Clarksville).
Community Health Status Report – Sacramento County 2014 44
Chronic Diseases
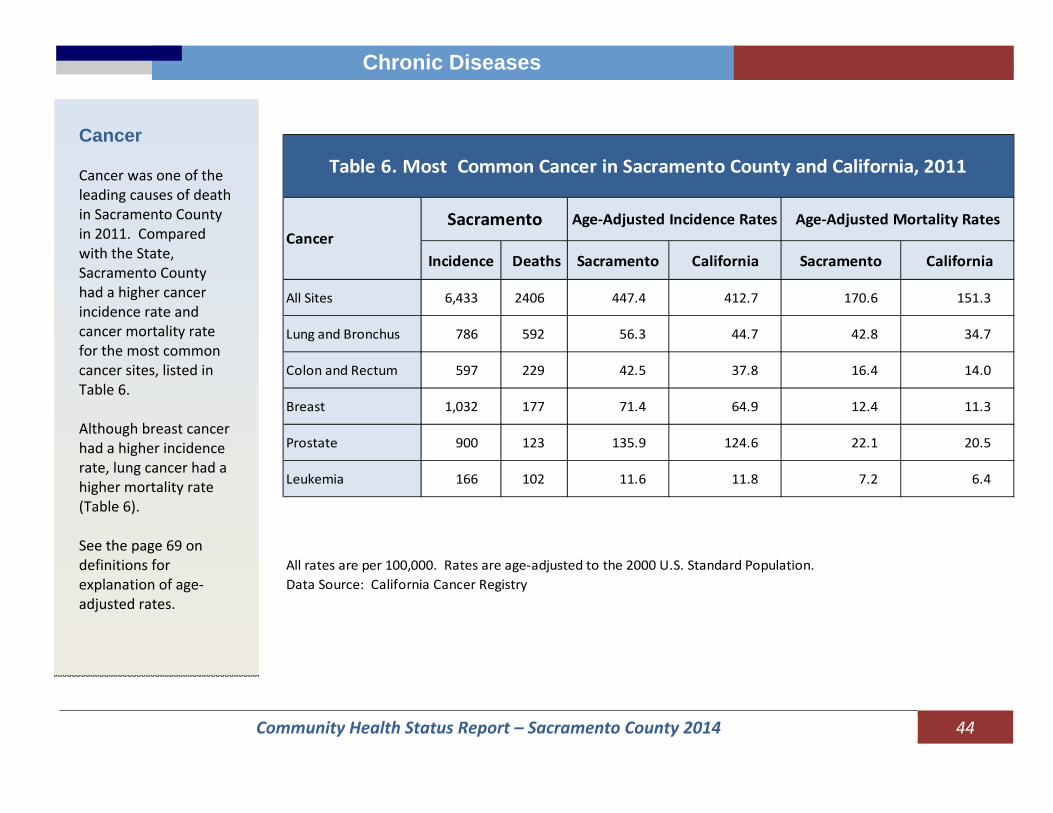
Cancer Cancer was one of the leading causes of death in Sacramento County in 2011. Compared with the State, Sacramento County had a higher cancer incidence rate and cancer mortality rate for the most common cancer sites, listed in Table 6. Although breast cancer had a higher incidence rate, lung cancer had a higher mortality rate (Table 6). See the page 69 on definitions for explanation of age‐adjusted rates.
Incidence Deaths Sacramento California Sacramento California
All Sites 6,433 2406 447.4 412.7 170.6 151.3
Lung and Bronchus 786 592 56.3 44.7 42.8 34.7
Colon and Rectum 597 229 42.5 37.8 16.4 14.0
Breast 1,032 177 71.4 64.9 12.4 11.3
Prostate 900 123 135.9 124.6 22.1 20.5
Leukemia 166 102 11.6 11.8 7.2 6.4
All rates are per 100,000. Rates are age‐adjusted to the 2000 U.S. Standard Population.Data Source: California Cancer Registry
Age‐Adjusted Incidence RatesCancer
Age‐Adjusted Mortality RatesSacramento
Table 6. Most Common Cancer in Sacramento County and California, 2011

Community Health Status Report – Sacramento County 2014 45
Chronic Diseases
Cancer Incidence Rates by Race/Ethnicity and Gender The rates were higher for males than for females, except among the Asian/ Pacific Islanders. This disparity was greatest for African Americans. Overall, Asian/Pacific Islanders had the lowest cancer incidence rates among all race/ethnicity groups.
0.0
100.0
200.0
300.0
400.0
500.0
600.0
700.0
Caucasian African American Hispanic Asian/PacificIslander
California Male Sacramento County Male
California Female Sacramento County Female
Figure 37. Age‐Adjusted Incidence Rate by Race/Ethnicity and GenderSacramento County vs. California, 2011, All Sites Combined
Rate
per 1
00,000
Pop
ulation
Rates are shown as the number of new cases or deaths per 100,000 persons. All rates are age‐adjusted to the 2000 United States Standard Population. Rate based on fewer than 15 cases are not shown. Data Source: California Department of Health, Cancer registry.

Community Health Status Report – Sacramento County 2014 46
Chronic Diseases
Diabetes In 2011, it was estimated that 97,000 adults in Sacramento County had been diagnosed with diabetes at some point in their lives. The prevalence of diabetes in Sacramento County was 9.2%. Compared to the State, the County’s diabetes rate was higher in 2011, but lower in 2005 to 2009. In 2011, it is estimated that there were 55,000 adult males (10.7%) and 43,000 females (7.8%) diagnosed with diabetes. Among those diagnosed with diabetes in 2011, 17.1% had Type I diabetes, 78.5% had Type II diabetes.
5.05.56.06.57.07.58.08.59.09.5
2001 2003 2005 2007 2009 2011
Percen
t
Figure 38. Diabetes Rate by Year, Sacramento County vs. California, 2001‐2011
California Sacramento
Data Source: California Health Interview Survey 2001‐2011 (CHIS)

Community Health Status Report – Sacramento County 2014 47
Chronic Diseases
Diabetes Mortality
Diabetes was the seventh leading cause of death in Sacramento County in 2011. The death rate was more than 5 times as high for persons aged 65 and older group (123.0 per 100,000) compared to aged 45‐64 years old groups (23.7 per 100,000). Mortality was related primarily to heart disease complications. The risk for stroke and end‐stage renal disease is also higher for persons with diabetes. Diabetes deaths were primarily distributed in the following zip codes: 95608 (Carmichael), 95823 (Sacramento), 95628 (Florin), and 95822 (Sacramento). See map 3. Data Source: State of California, Department of Public Health birth and death master files for the Sacramento County 2007 through 2011.

Community Health Status Report – Sacramento County 2014 48
Chronic Diseases
Diabetes Prevalence by Age Individuals age 65 years and older had the highest prevalence of Type II diabetes (25.0 %), followed by individuals age 50‐64 years (15.4%). In 2011, the diabetes rate in Sacramento was higher than the State’s for individuals 50 and older (Figure 39). Overweight and obesity are major risk factors for Type II diabetes.
0.0
5.0
10.0
15.0
20.0
25.0
30.0
18‐49 50‐64 65+
Sacramento California
Figure 39. Prevalence of Diabetes by Age Group, Sacramento County vs. California, 2011
Percen
t
Data Source: California Health Interview Survey 2001‐2011 (CHIS)
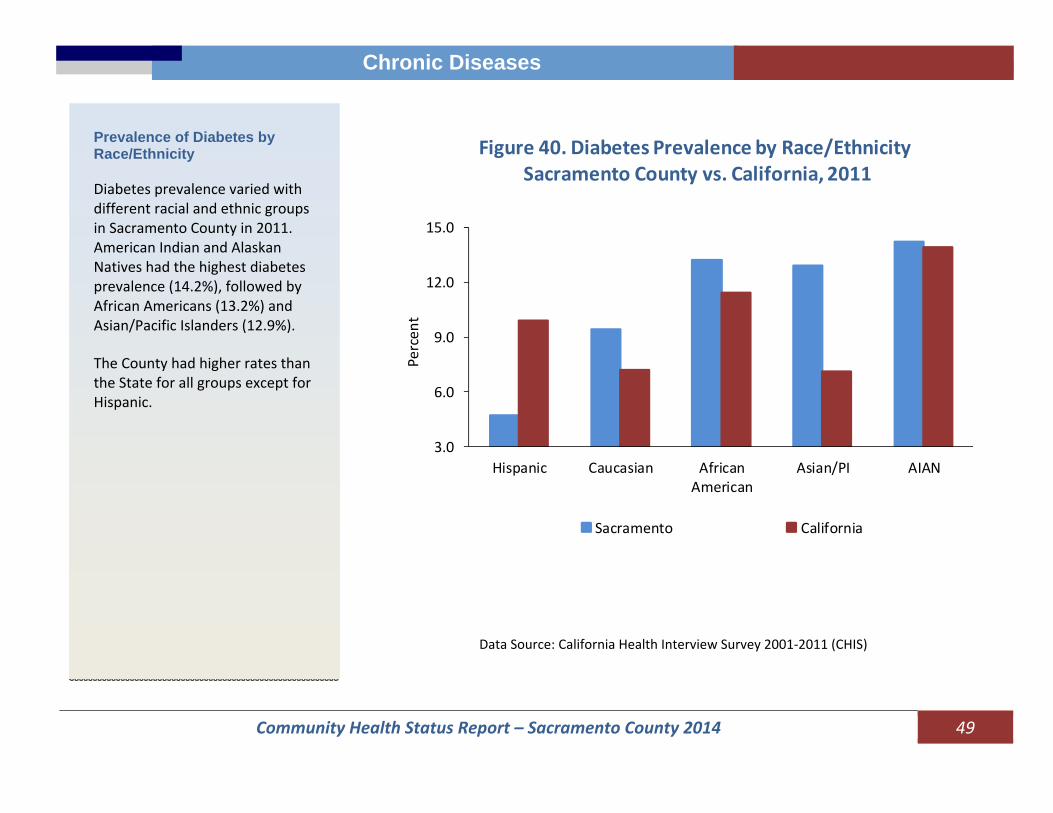
Community Health Status Report – Sacramento County 2014 49
Chronic Diseases
Prevalence of Diabetes by Race/Ethnicity Diabetes prevalence varied with different racial and ethnic groups in Sacramento County in 2011. American Indian and Alaskan Natives had the highest diabetes prevalence (14.2%), followed by African Americans (13.2%) and Asian/Pacific Islanders (12.9%). The County had higher rates than the State for all groups except for Hispanic.
3.0
6.0
9.0
12.0
15.0
Hispanic Caucasian AfricanAmerican
Asian/PI AIAN
Sacramento California
Percen
t
Figure 40. Diabetes Prevalence by Race/EthnicitySacramento County vs. California, 2011
Data Source: California Health Interview Survey 2001‐2011 (CHIS)
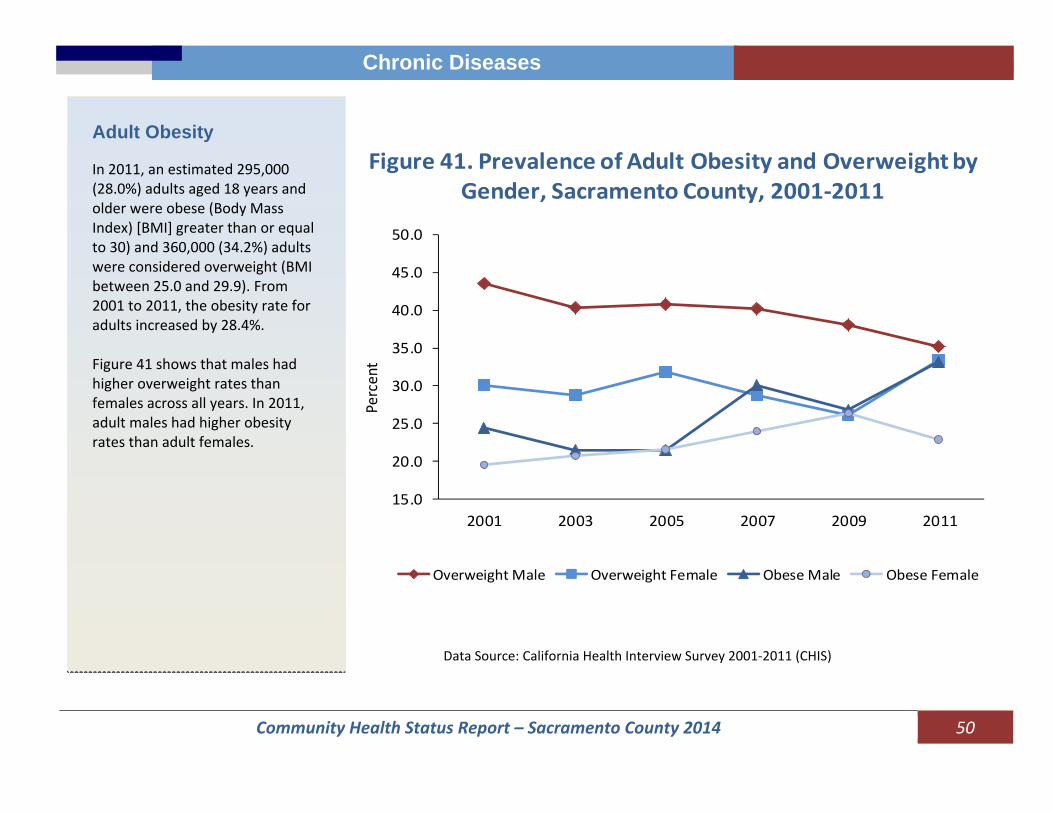
Community Health Status Report – Sacramento County 2014 50
Chronic Diseases
Adult Obesity In 2011, an estimated 295,000 (28.0%) adults aged 18 years and older were obese (Body Mass Index) [BMI] greater than or equal to 30) and 360,000 (34.2%) adults were considered overweight (BMI between 25.0 and 29.9). From 2001 to 2011, the obesity rate for adults increased by 28.4%. Figure 41 shows that males had higher overweight rates than females across all years. In 2011, adult males had higher obesity rates than adult females.
15.0
20.0
25.0
30.0
35.0
40.0
45.0
50.0
2001 2003 2005 2007 2009 2011
Overweight Male Overweight Female Obese Male Obese Female
Figure 41. Prevalence of Adult Obesity and Overweight by Gender, Sacramento County, 2001‐2011
Percent
Data Source: California Health Interview Survey 2001‐2011 (CHIS)

Community Health Status Report – Sacramento County 2014 51
Chronic Diseases
Heart Disease
In 2011, an estimated 55,000 adult residents in Sacramento County reported living with heart disease. The prevalence rate for heart disease was 5.2% in Sacramento County, which was 17.5% lower than the State. Heart disease prevalence for adults 65 and older decreased by 38.2% from 24.9 in 2001 to 15.4% in 2011. The heart disease prevalence rate for seniors in Sacramento County was 28.0 % lower than the statewide rate in 2011 (see the insert).
14.016.018.020.022.024.026.028.0
2001 2003 2005 2007 2009 2011
Sacramento California
Percent (%)
Prevalence of Heart Disease for aged 65 and Older Sacramento County vs California, 2001‐2011
Data Source: California Health Interview Survey 2001‐2011 (CHIS)
3.0
4.0
5.0
6.0
7.0
8.0
9.0
2001 2003 2005 2007 2009 2011
Sacramento California
Percent
Figure 42. Heart Disease Prevalence by YearSacramento County vs. California, 2001‐2011
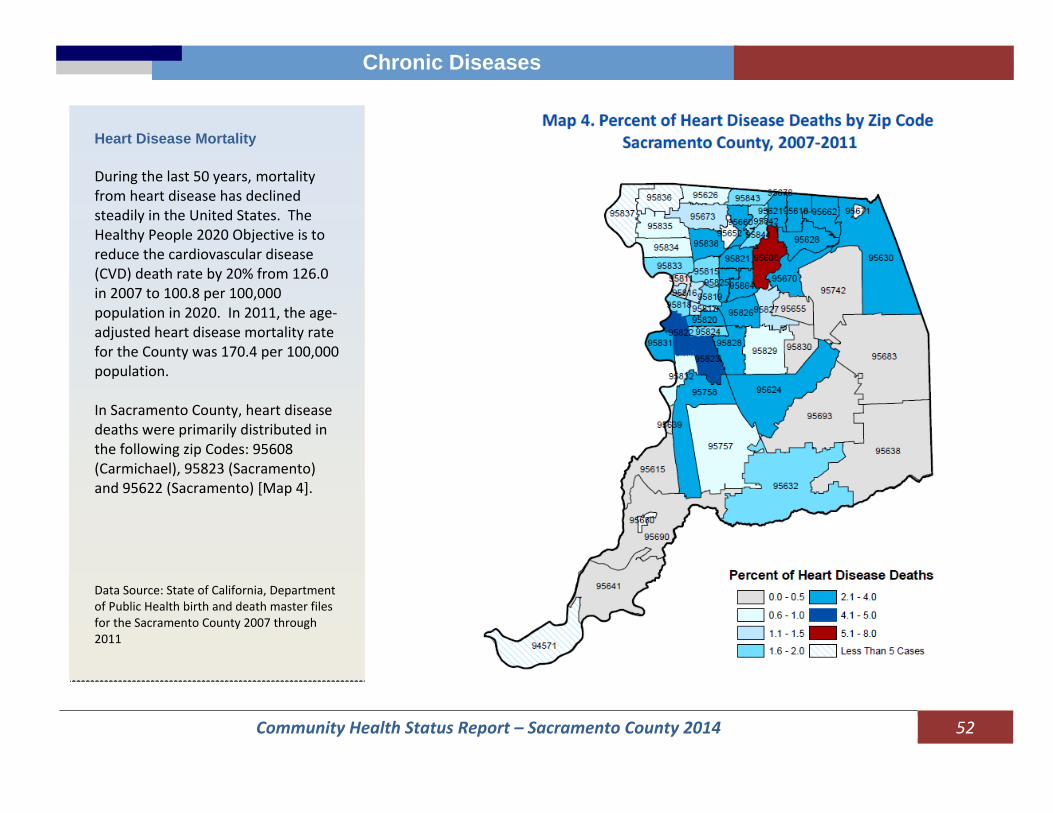
Community Health Status Report – Sacramento County 2014 52
Chronic Diseases
Heart Disease Mortality During the last 50 years, mortality from heart disease has declined steadily in the United States. The Healthy People 2020 Objective is to reduce the cardiovascular disease (CVD) death rate by 20% from 126.0 in 2007 to 100.8 per 100,000 population in 2020. In 2011, the age‐adjusted heart disease mortality rate for the County was 170.4 per 100,000 population. In Sacramento County, heart disease deaths were primarily distributed in the following zip Codes: 95608 (Carmichael), 95823 (Sacramento) and 95622 (Sacramento) [Map 4]. Data Source: State of California, Department of Public Health birth and death master files for the Sacramento County 2007 through 2011

Community Health Status Report – Sacramento County 2014 53
Chronic Diseases
Hypertension From 2001 to 2011, the prevalence of hypertension for adults 65 and over was approximately 60%. The prevalence was three times higher than the other age groups.
10.0
20.0
30.0
40.0
50.0
60.0
70.0
2001 2003 2005 2007 2009 2011
Sacramento Sacramento‐Age 19‐64 Sacramento‐Age 65 and Over
Percent (%)
Prevalence of Hypertension by Year Sacramento County and California, 2001‐2011
Hypertension Mortality In 2011, the age‐adjusted death rate for hypertension was 26.1 per 100,000 population in the County. Hypertension deaths were primarily distributed in the following zip codes: 95608, 95823 95622 and 95831 (Map 5).
Data Source: State of California, Department of Public Health birth and death master files for the Sacramento County 2007 through 2011

Community Health Status Report – Sacramento County 2014 54
Chronic Diseases
Stroke Mortality In 2011, there were 540 stroke‐related deaths in Sacramento County. The age‐adjusted mortality rate was 38.4 per 100,000 population. Stroke‐related deaths were primarily distributed in the following zip codes: 95608 (Carmichael), 95822 (Sacramento), 95823 (Sacramento), 95828 (Florin), 95831 (Sacramento), 95624 (Sheldon/Elk Grove), 95820 (Sacramento), 95670 (Rancho Cordova/Gold River), 95621 (Citrus Heights), 95628 (Fair Oaks), and 95610 (Citrus Heights). [Map 6] Data Source: State of California, Department of Public Health birth and death master files for the Sacramento County 2007 through 2011
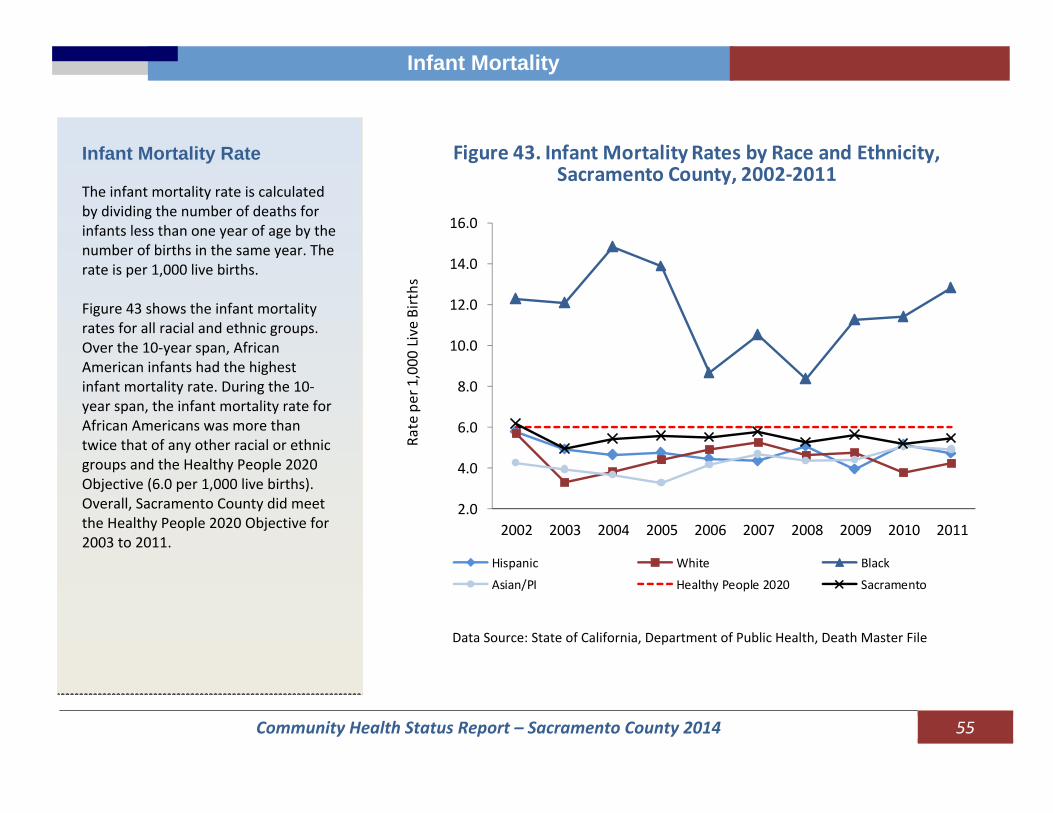
Community Health Status Report – Sacramento County 2014 55
Infant Mortality Infant Mortality
Infant Mortality Rate The infant mortality rate is calculated by dividing the number of deaths for infants less than one year of age by the number of births in the same year. The rate is per 1,000 live births. Figure 43 shows the infant mortality rates for all racial and ethnic groups. Over the 10‐year span, African American infants had the highest infant mortality rate. During the 10‐year span, the infant mortality rate for African Americans was more than twice that of any other racial or ethnic groups and the Healthy People 2020 Objective (6.0 per 1,000 live births). Overall, Sacramento County did meet the Healthy People 2020 Objective for 2003 to 2011.
2.0
4.0
6.0
8.0
10.0
12.0
14.0
16.0
2002 2003 2004 2005 2006 2007 2008 2009 2010 2011
Hispanic White Black
Asian/PI Healthy People 2020 Sacramento
Figure 43. Infant Mortality Rates by Race and Ethnicity, Sacramento County, 2002‐2011
Rate per 1,000
Live Births
Data Source: State of California, Department of Public Health, Death Master File
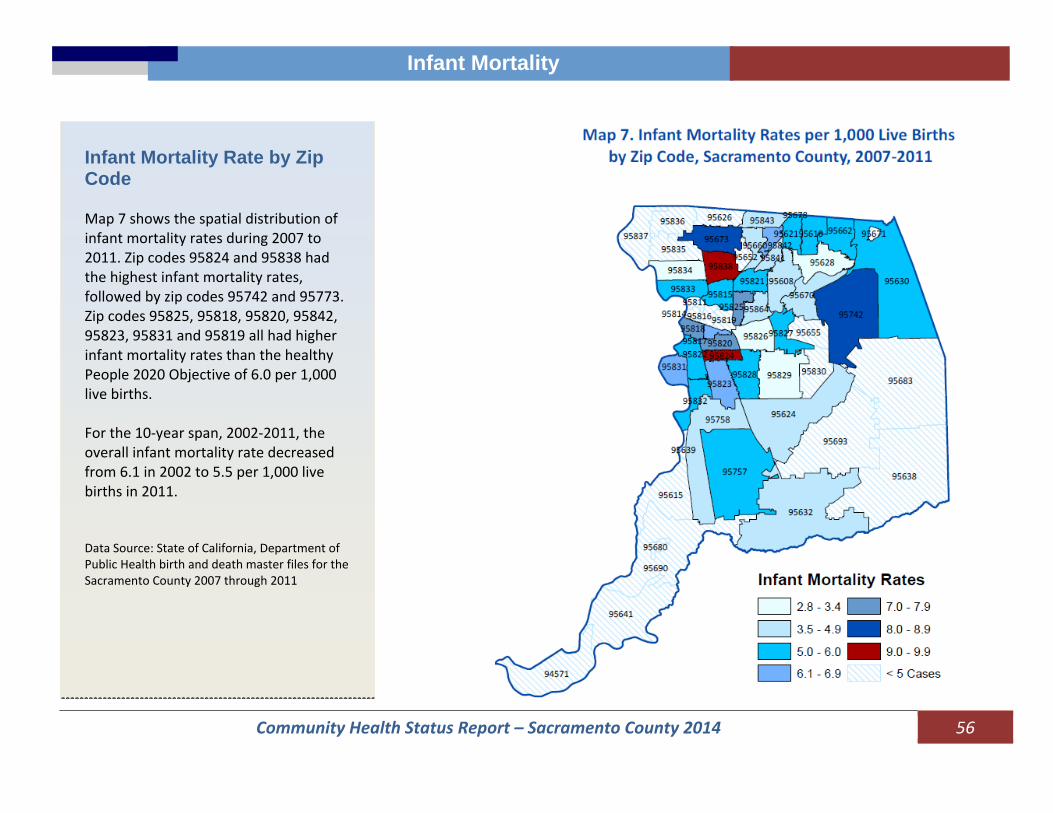
Community Health Status Report – Sacramento County 2014 56
Infant Mortality
Infant Mortality Rate by Zip Code Map 7 shows the spatial distribution of infant mortality rates during 2007 to 2011. Zip codes 95824 and 95838 had the highest infant mortality rates, followed by zip codes 95742 and 95773. Zip codes 95825, 95818, 95820, 95842, 95823, 95831 and 95819 all had higher infant mortality rates than the healthy People 2020 Objective of 6.0 per 1,000 live births. For the 10‐year span, 2002‐2011, the overall infant mortality rate decreased from 6.1 in 2002 to 5.5 per 1,000 live births in 2011. Data Source: State of California, Department of Public Health birth and death master files for the Sacramento County 2007 through 2011
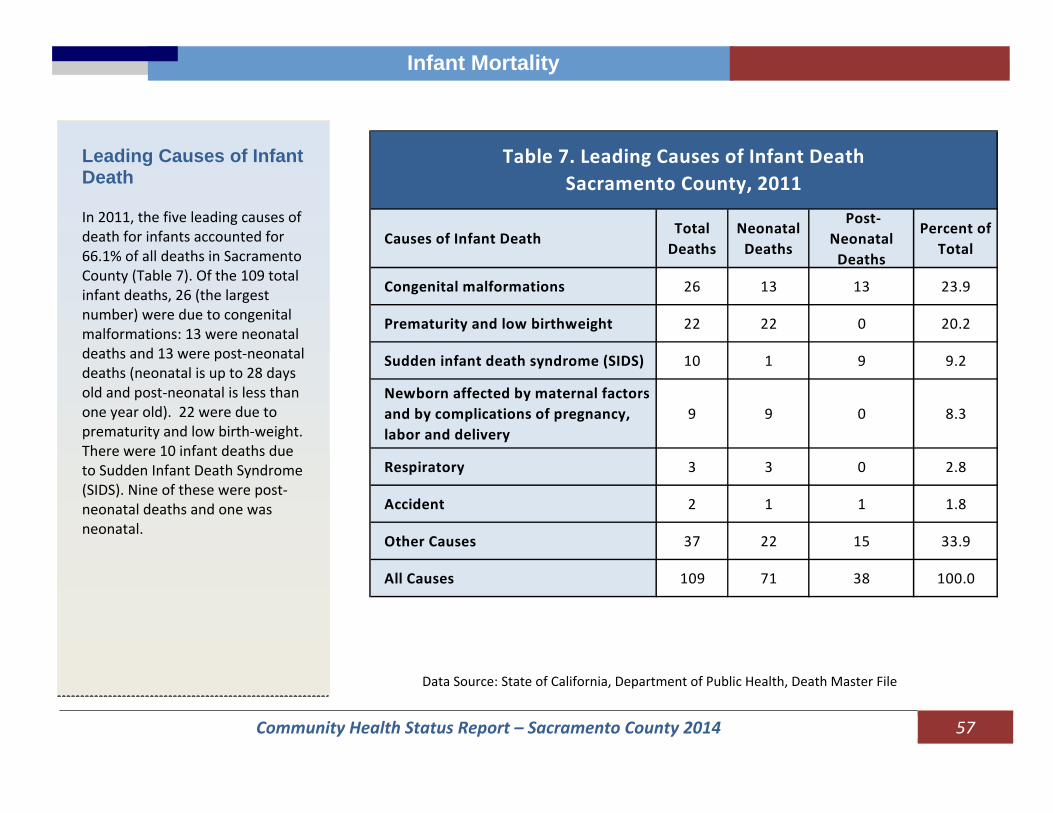
Community Health Status Report – Sacramento County 2014 57
Infant Mortality
Leading Causes of Infant Death In 2011, the five leading causes of death for infants accounted for 66.1% of all deaths in Sacramento County (Table 7). Of the 109 total infant deaths, 26 (the largest number) were due to congenital malformations: 13 were neonatal deaths and 13 were post‐neonatal deaths (neonatal is up to 28 days old and post‐neonatal is less than one year old). 22 were due to prematurity and low birth‐weight. There were 10 infant deaths due to Sudden Infant Death Syndrome (SIDS). Nine of these were post‐neonatal deaths and one was neonatal.
Causes of Infant DeathTotal Deaths
Neonatal Deaths
Post‐Neonatal Deaths
Percent of Total
Congenital malformations 26 13 13 23.9
Prematurity and low birthweight 22 22 0 20.2
Sudden infant death syndrome (SIDS) 10 1 9 9.2
Newborn affected by maternal factors and by complications of pregnancy, labor and delivery
9 9 0 8.3
Respiratory 3 3 0 2.8
Accident 2 1 1 1.8
Other Causes 37 22 15 33.9
All Causes 109 71 38 100.0
Table 7. Leading Causes of Infant Death Sacramento County, 2011
Data Source: State of California, Department of Public Health, Death Master File

Community Health Status Report – Sacramento County 2014 58
Mortality
Mortality
Deaths and Death Rates The total number of deaths of Sacramento County’s residents increased by 9% from 9,578 deaths in 2002 to 10,443 deaths in 2011. During this 10‐year period, the number of deaths in males increased by 464 deaths (9.7%) and the number of deaths in females increased by 401 (8.3%) deaths. Age‐Adjusted Death Rates* (see definitions on page 69): From 2002 to 2011, the age‐adjusted death rate fell by 9.8% from 800.0 per 100,000 population to 721.9 per 100,000 population. In males, it dropped by 11.5% (Table 8). *Rates are per 100,000 population, age‐adjusted to 2000 U.S. Population Standard.
Year Sacramento Female Male
2002 800.0 679.6 954.6
2003 793.6 669.3 958.8
2004 765.4 650.9 915.2
2005 795.0 679.4 940.1
2006 780.5 665.9 918.8
2007 723.3 621.0 851.7
2008 725.5 633.6 840.2
2009 705.8 608.4 827.6
2010 708.7 608.8 835.1
2011 721.9 621.2 845.0
Table 8. Age-Adjusted Mortality Rate* per 100,000 Population, Sacramento County, 2002-2011
Data Source: State of California, Department of Public Health, Death Master File
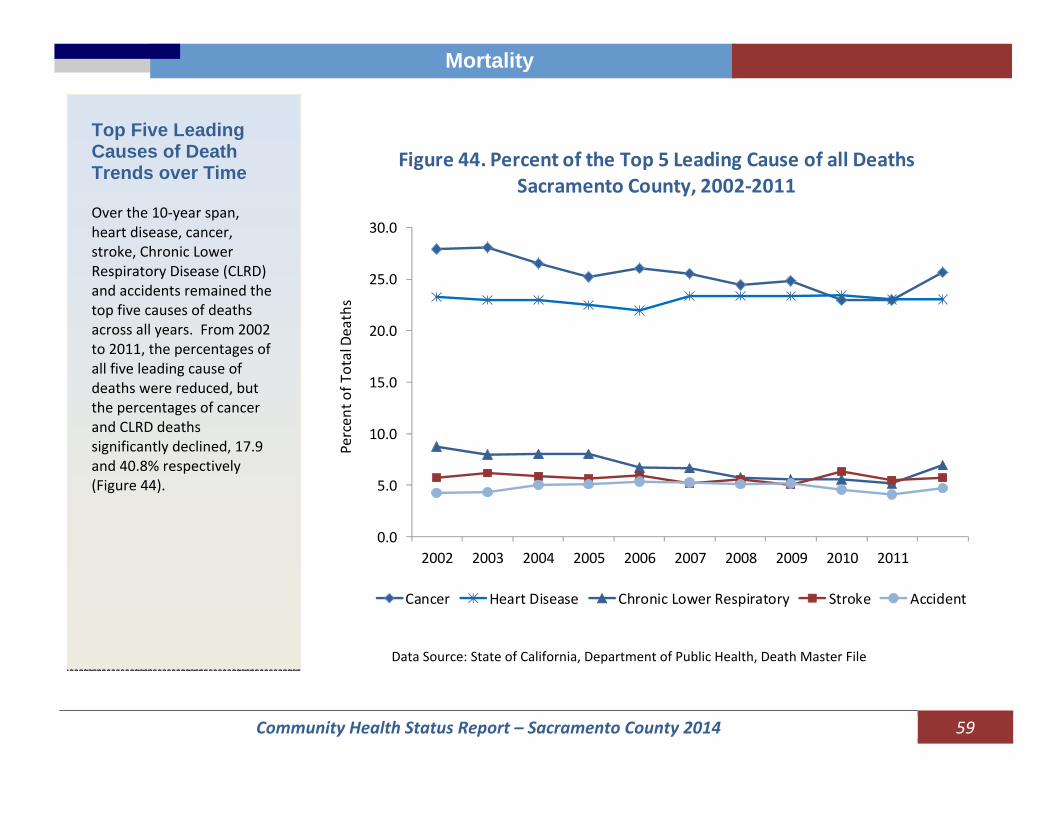
Community Health Status Report – Sacramento County 2014 59
Mortality
Top Five Leading Causes of Death Trends over Time Over the 10‐year span, heart disease, cancer, stroke, Chronic Lower Respiratory Disease (CLRD) and accidents remained the top five causes of deaths across all years. From 2002 to 2011, the percentages of all five leading cause of deaths were reduced, but the percentages of cancer and CLRD deaths significantly declined, 17.9 and 40.8% respectively (Figure 44).
0.0
5.0
10.0
15.0
20.0
25.0
30.0
2002 2003 2004 2005 2006 2007 2008 2009 2010 2011
Cancer Heart Disease Chronic Lower Respiratory Stroke Accident
Figure 44. Percent of the Top 5 Leading Cause of all DeathsSacramento County, 2002‐2011
Percen
t of T
otal Deaths
Data Source: State of California, Department of Public Health, Death Master File
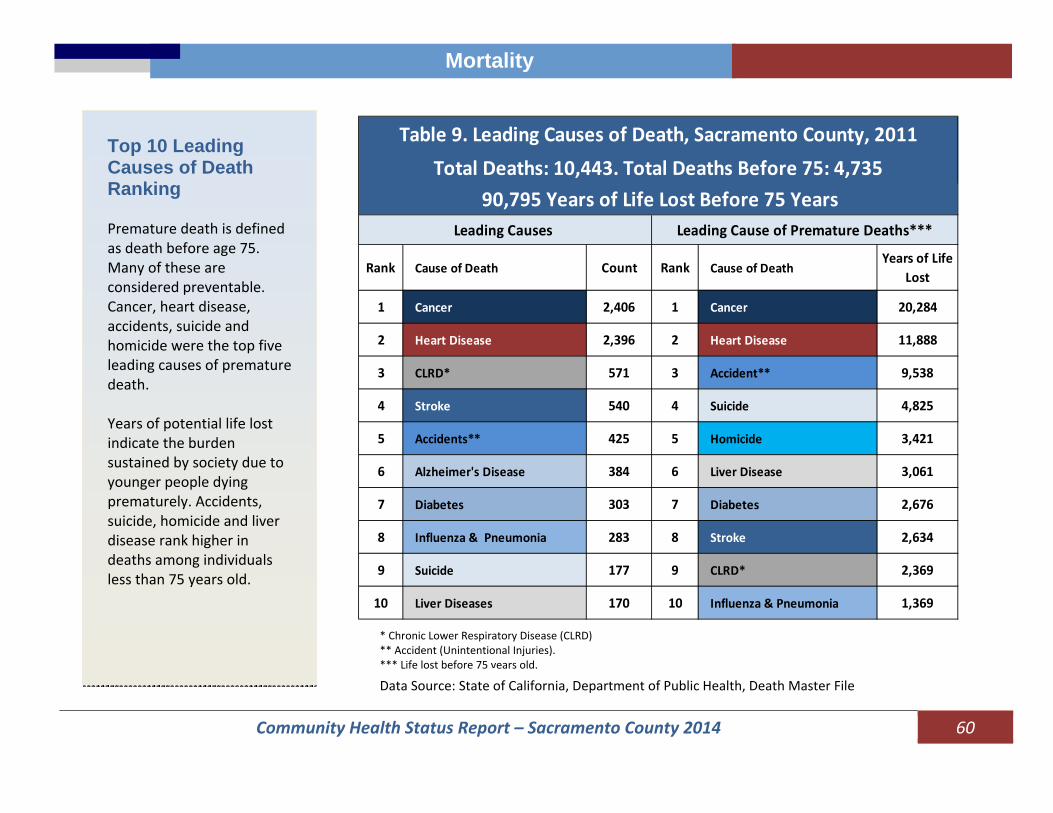
Community Health Status Report – Sacramento County 2014 60
Mortality
Top 10 Leading Causes of Death Ranking Premature death is defined as death before age 75. Many of these are considered preventable. Cancer, heart disease, accidents, suicide and homicide were the top five leading causes of premature death. Years of potential life lost indicate the burden sustained by society due to younger people dying prematurely. Accidents, suicide, homicide and liver disease rank higher in deaths among individuals less than 75 years old.
Rank Cause of Death Count Rank Cause of DeathYears of Life
Lost
1 Cancer 2,406 1 Cancer 20,284
2 Heart Disease 2,396 2 Heart Disease 11,888
3 CLRD* 571 3 Accident** 9,538
4 Stroke 540 4 Suicide 4,825
5 Accidents** 425 5 Homicide 3,421
6 Alzheimer's Disease 384 6 Liver Disease 3,061
7 Diabetes 303 7 Diabetes 2,676
8 Influenza & Pneumonia 283 8 Stroke 2,634
9 Suicide 177 9 CLRD* 2,369
10 Liver Diseases 170 10 Influenza & Pneumonia 1,369
Leading Causes Leading Cause of Premature Deaths***
90,795 Years of Life Lost Before 75 Years
Table 9. Leading Causes of Death, Sacramento County, 2011Total Deaths: 10,443. Total Deaths Before 75: 4,735
* Chronic Lower Respiratory Disease (CLRD) ** Accident (Unintentional Injuries). *** Life lost before 75 years old.
Data Source: State of California, Department of Public Health, Death Master File

Community Health Status Report – Sacramento County 2014 61
Mortality
* Chronic Lower Respiratory Disease (CLRD) ** Accident (Unintentional Injuries)
Leading Causes of Death by Gender In 2011, cancer and heart disease were the top two leading causes of death for both females and males, and accounted for 44.9% of deaths among females and 47.1% of deaths among males. Table 10 shows the differences in leading causes of death for males and females: heart disease is the leading cause of death in the Nation and for males in the County but ranked second for females. Cancer is the leading cause for the females. In the U.S., breast cancer is the most diagnosed cancer in females but lung cancer is the leading cause of death from cancer in females (CDC).
Females Deaths Rank Males Deaths Rank
Cancer 1,209 1 Heart Disease 1,266 1
Heart Disease 1,130 2 Cancer 1,197 2
CLRD* 319 3 Accidents** 279 3
Stroke 317 4 CLRD* 252 4
Alzheimer 275 5 Stroke 223 5
Influenza & Pneumonia
155 6 Diabetes 155 6
Diabetes 148 7 Suicide 134 7
Accidents** 146 8Influenza & Pneumonia
128 8
Hypertension 100 9 Liver Disease 111 9
Liver Disease 59 10 Alzheimer 109 10
All Others All Others
Total Deaths Total Deaths
Table 10. Leading Causes of Death by Gender Sacramento County, 2011
1,357
5,215
1,374
5,228
Data Source: State of California, Department of Public Health, Death Master File
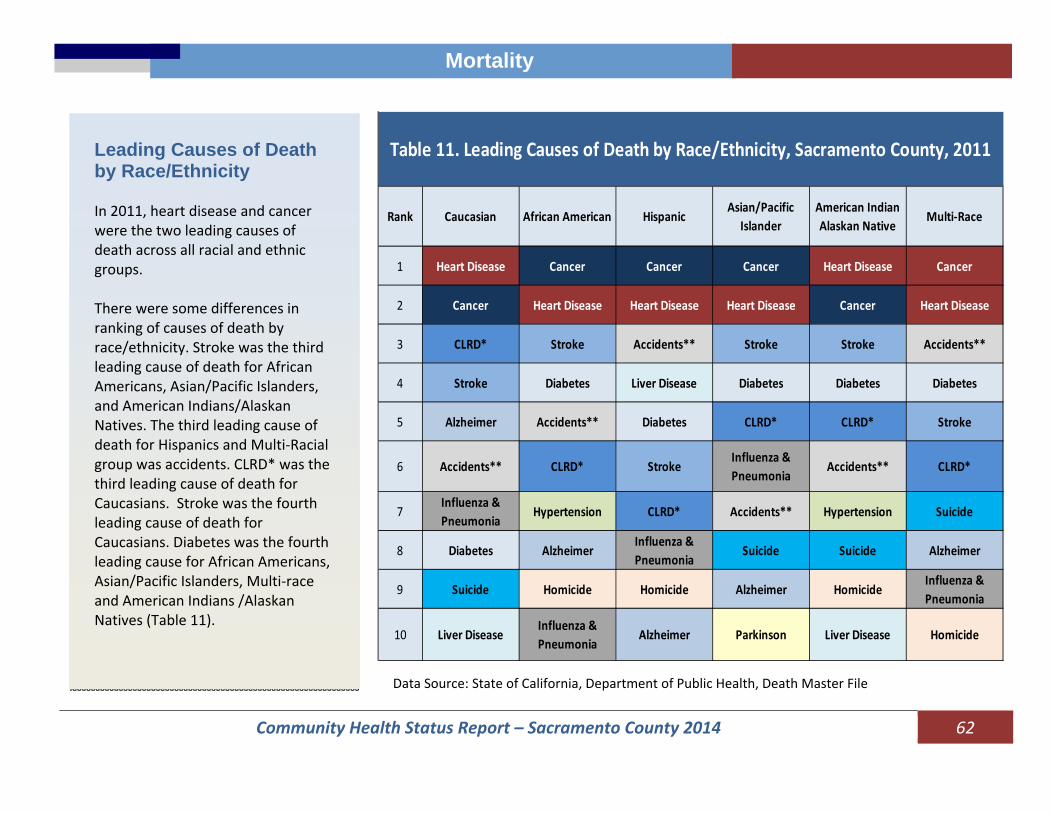
Community Health Status Report – Sacramento County 2014 62
Mortality
* Chronic Lower Respiratory Disease (CLRD) ** Accident (Unintentional Injuries)
Leading Causes of Death by Race/Ethnicity In 2011, heart disease and cancer were the two leading causes of death across all racial and ethnic groups. There were some differences in ranking of causes of death by race/ethnicity. Stroke was the third leading cause of death for African Americans, Asian/Pacific Islanders, and American Indians/Alaskan Natives. The third leading cause of death for Hispanics and Multi‐Racial group was accidents. CLRD* was the third leading cause of death for Caucasians. Stroke was the fourth leading cause of death for Caucasians. Diabetes was the fourth leading cause for African Americans, Asian/Pacific Islanders, Multi‐race and American Indians /Alaskan Natives (Table 11).
Rank Caucasian African American HispanicAsian/Pacific
IslanderAmerican Indian Alaskan Native
Multi‐Race
1 Heart Disease Cancer Cancer Cancer Heart Disease Cancer
2 Cancer Heart Disease Heart Disease Heart Disease Cancer Heart Disease
3 CLRD* Stroke Accidents** Stroke Stroke Accidents**
4 Stroke Diabetes Liver Disease Diabetes Diabetes Diabetes
5 Alzheimer Accidents** Diabetes CLRD* CLRD* Stroke
6 Accidents** CLRD* StrokeInfluenza & Pneumonia
Accidents** CLRD*
7Influenza & Pneumonia
Hypertension CLRD* Accidents** Hypertension Suicide
8 Diabetes AlzheimerInfluenza & Pneumonia
Suicide Suicide Alzheimer
9 Suicide Homicide Homicide Alzheimer HomicideInfluenza & Pneumonia
10 Liver DiseaseInfluenza & Pneumonia
Alzheimer Parkinson Liver Disease Homicide
Table 11. Leading Causes of Death by Race/Ethnicity, Sacramento County, 2011
Data Source: State of California, Department of Public Health, Death Master File

Community Health Status Report – Sacramento County 2014 63
Mortality
* Chronic Lower Respiratory Disease (CLRD) ** Accident (Unintentional Injuries)
Leading Causes of Death by age group In 2011, the top three leading causes of death for ages 1‐14 years were perinatal conditions, followed by accidents and cancer. For the 15‐24 age group, the leading cause of deaths were accidents; of the 37 accidental deaths, 67.6% (25) were motor vehicle accidents. Accidents were also a leading cause for the age group 25‐44 years: of the 93 deaths, 38.7% (36) were related to motor vehicle accidents and 47.3% (44) were related to exposure to poisons. Cancer and heart disease were the top two causes for those 45 years and older.
Data Source: State of California, Department of Public Health, Death Master File
Cause Deaths Cause Deaths Cause Deaths
1‐14 Years Perinatal Conditions
9 Accidents** 7 Cancer 6
15‐24 years Accidents** 37 Homicide 27 Suicide 14
25‐44 Years Accidents** 93 Cancer 86 Suicide 56
45‐64 Years Cancer 682 Heart Disease 406 Accidents** 131
65‐74 Years Cancer 568 Heart Disease 358 CLRD* 145
75+ Years Heart Disease 1,578 Cancer 1,051Alzheimer's Disease
360
Sacramento County, 2011Table 12. Leading Causes of Death By Age Group
Causes#1 Cause #2 Cause #3 Cause
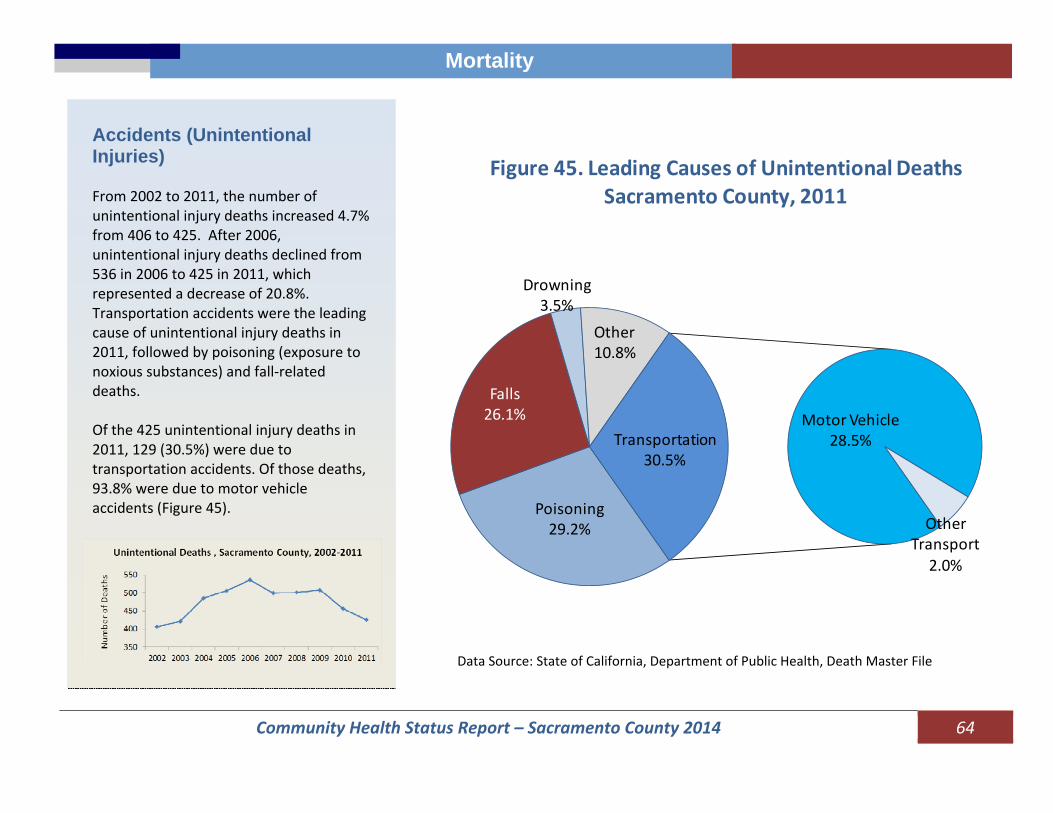
Community Health Status Report – Sacramento County 2014 64
Mortality
Accidents (Unintentional Injuries) From 2002 to 2011, the number of unintentional injury deaths increased 4.7% from 406 to 425. After 2006, unintentional injury deaths declined from 536 in 2006 to 425 in 2011, which represented a decrease of 20.8%. Transportation accidents were the leading cause of unintentional injury deaths in 2011, followed by poisoning (exposure to noxious substances) and fall‐related deaths. Of the 425 unintentional injury deaths in 2011, 129 (30.5%) were due to transportation accidents. Of those deaths, 93.8% were due to motor vehicle accidents (Figure 45).
Poisoning29.2%
Falls26.1%
Drowning3.5%
Other 10.8%
Motor Vehicle 28.5%
Other Transport
2.0%
Transportation30.5%
Figure 45. Leading Causes of Unintentional Deaths Sacramento County, 2011
Data Source: State of California, Department of Public Health, Death Master File
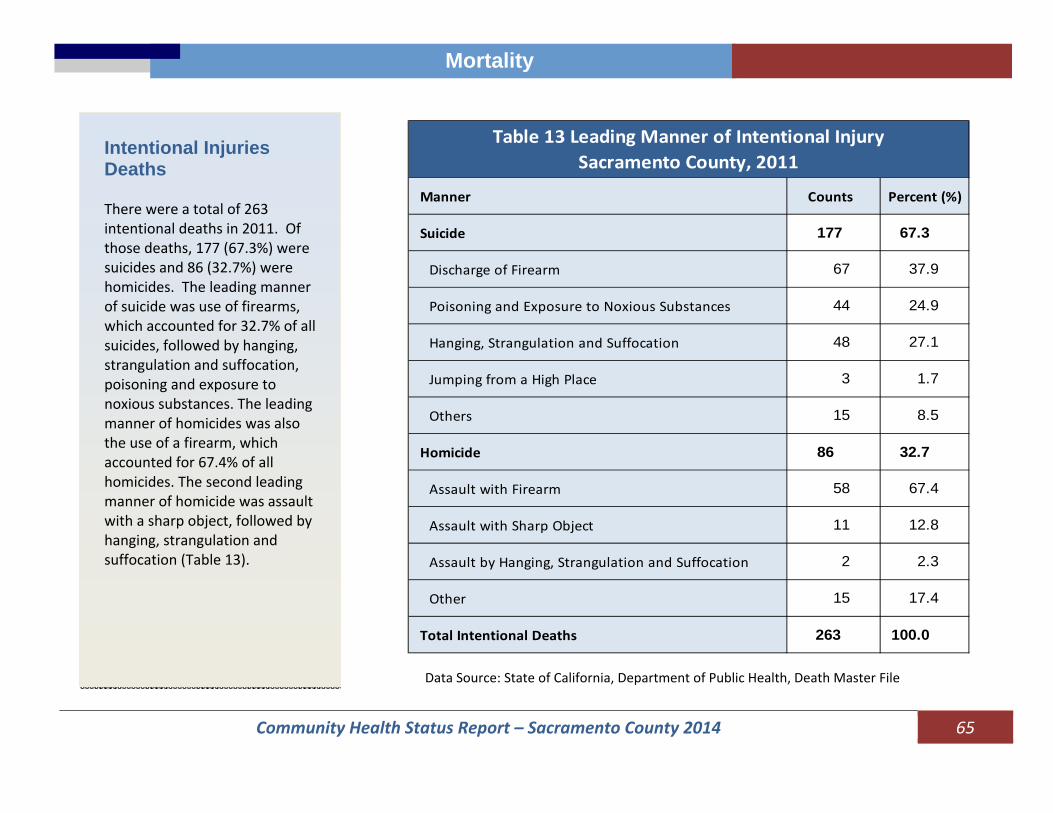
Community Health Status Report – Sacramento County 2014 65
Mortality
Intentional Injuries Deaths There were a total of 263 intentional deaths in 2011. Of those deaths, 177 (67.3%) were suicides and 86 (32.7%) were homicides. The leading manner of suicide was use of firearms, which accounted for 32.7% of all suicides, followed by hanging, strangulation and suffocation, poisoning and exposure to noxious substances. The leading manner of homicides was also the use of a firearm, which accounted for 67.4% of all homicides. The second leading manner of homicide was assault with a sharp object, followed by hanging, strangulation and suffocation (Table 13).
Manner Counts Percent (%)
Suicide 177 67.3
Discharge of Firearm 67 37.9
Poisoning and Exposure to Noxious Substances 44 24.9
Hanging, Strangulation and Suffocation 48 27.1
Jumping from a High Place 3 1.7
Others 15 8.5
Homicide 86 32.7
Assault with Firearm 58 67.4
Assault with Sharp Object 11 12.8
Assault by Hanging, Strangulation and Suffocation 2 2.3
Other 15 17.4
Total Intentional Deaths 263 100.0
Table 13 Leading Manner of Intentional Injury Sacramento County, 2011
Data Source: State of California, Department of Public Health, Death Master File
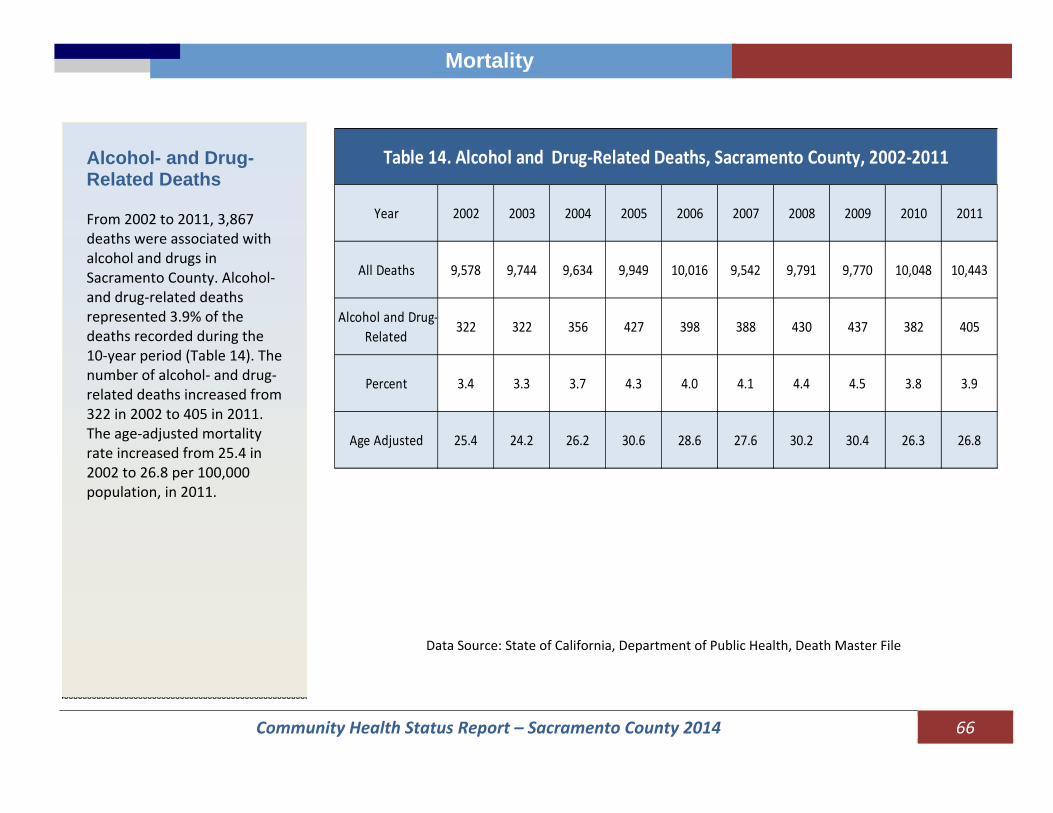
Community Health Status Report – Sacramento County 2014 66
Mortality
Alcohol- and Drug- Related Deaths From 2002 to 2011, 3,867 deaths were associated with alcohol and drugs in Sacramento County. Alcohol‐and drug‐related deaths represented 3.9% of the deaths recorded during the 10‐year period (Table 14). The number of alcohol‐ and drug‐related deaths increased from 322 in 2002 to 405 in 2011. The age‐adjusted mortality rate increased from 25.4 in 2002 to 26.8 per 100,000 population, in 2011.
Year 2002 2003 2004 2005 2006 2007 2008 2009 2010 2011
All Deaths 9,578 9,744 9,634 9,949 10,016 9,542 9,791 9,770 10,048 10,443
Alcohol and Drug‐Related
322 322 356 427 398 388 430 437 382 405
Percent 3.4 3.3 3.7 4.3 4.0 4.1 4.4 4.5 3.8 3.9
Age Adjusted 25.4 24.2 26.2 30.6 28.6 27.6 30.2 30.4 26.3 26.8
Table 14. Alcohol and Drug‐Related Deaths, Sacramento County, 2002‐2011
Data Source: State of California, Department of Public Health, Death Master File

Community Health Status Report – Sacramento County 2014 67
Mortality
Figure 46 shows the racial and ethnic distribution of alcohol‐ and drug‐related deaths over the 10‐year period. Caucasians accounted for 71.9% of deaths followed by Hispanics and African Americans. The age group with the largest number of deaths was 45‐54 years, accounting for 35.5% of all deaths during the 10‐year period (see the following pie chart).
Under 150.1%
15‐242.9%
25‐347.9%
35‐4419.5%
45‐5435.5%
55‐6422.0%
65‐748.2%
75+4.0%
Percent of Acohol and Drug‐Related Deaths by Age Group, Sacramento County, 2002‐2011
Hispanic 13.1%
Caucasian 71.9%
African American 10.9%
American Indian 1.2%
Asian/PI 2.9%
Multi‐Race 0.1%
Figure 46. Percent of Alcohol and Other Drug‐Related Deaths by Race/Ethnicity, Sacramento County, 2002‐2011
Data Source: State of California, Department of Public Health, Death Master File

Community Health Status Report – Sacramento County 2014 68
Mortality
Nearly 40% of all deaths were associated with alcohol or drug poisoning; 14.5% were caused by mental or behavioral disorders and 9.7% were related to suicide There were 1,160 alcohol‐related deaths attributed to alcoholic liver disease (30.0%), of which 512 (56.6%) were due to alcoholic cirrhosis. Nearly 40% of all deaths were associated with alcohol or drug poisoning; 14.5% were caused by mental or behavioral disorders and 9.7% were related to suicide.
Causes Deaths Percent
Total 3,867 100.0
Accidental drug or alcohol poisoning 1,530 39.6
Alcohol Liver disease 1160 30.0
Mental or behavioral disorder due to drug or alcohol use 559 14.5
Suicide 375 9.7
Undetermined intent 177 4.6
Alcoholic cardiomyopathy 34 0.9
Adverse effects of therapeutic drugs 17 0.4
Alcoholic gastritis 6 0.2
Homicide 3 0.1
Degeneration of nervous system due to alcohol 6 0.2
Table 15. Alcohol and Drug‐Related Deaths by Underlying Cause Sacramento County, 2002‐2011
Data Source: State of California, Department of Public Health, Death Master File
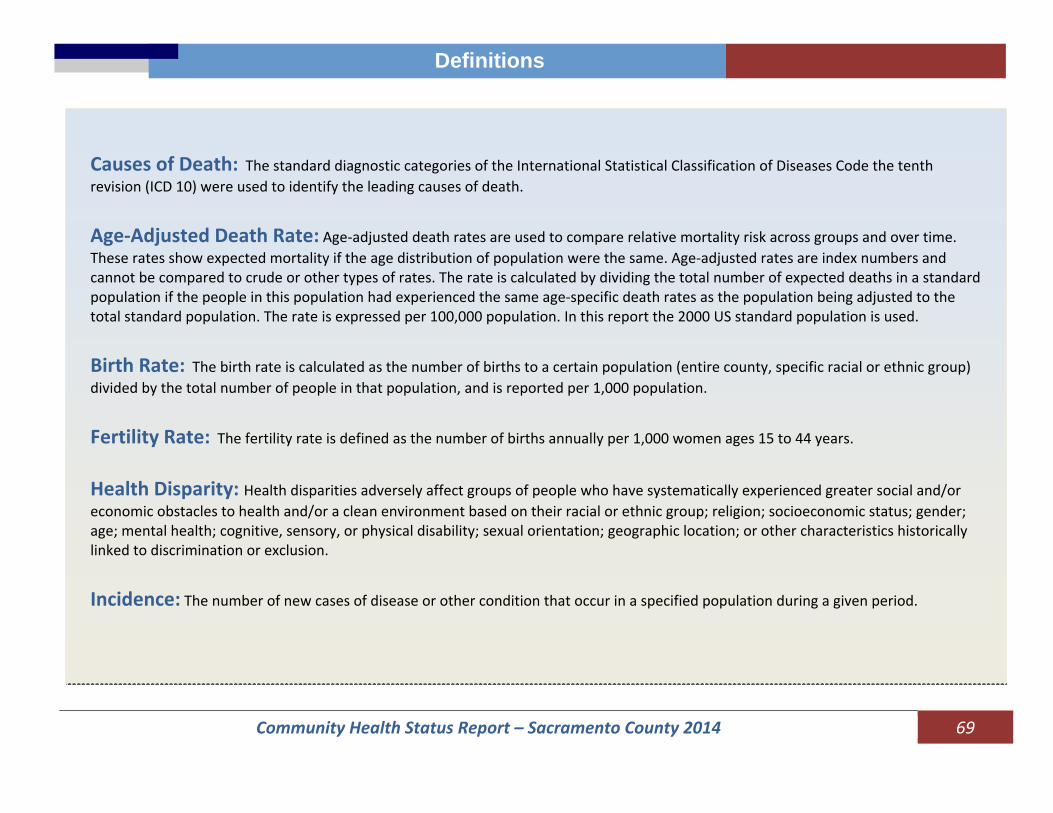
Community Health Status Report – Sacramento County 2014 69
Definitions
Definitions
Causes of Death: The standard diagnostic categories of the International Statistical Classification of Diseases Code the tenth revision (ICD 10) were used to identify the leading causes of death. Age‐Adjusted Death Rate: Age‐adjusted death rates are used to compare relative mortality risk across groups and over time. These rates show expected mortality if the age distribution of population were the same. Age‐adjusted rates are index numbers and cannot be compared to crude or other types of rates. The rate is calculated by dividing the total number of expected deaths in a standard population if the people in this population had experienced the same age‐specific death rates as the population being adjusted to the total standard population. The rate is expressed per 100,000 population. In this report the 2000 US standard population is used. Birth Rate: The birth rate is calculated as the number of births to a certain population (entire county, specific racial or ethnic group) divided by the total number of people in that population, and is reported per 1,000 population. Fertility Rate: The fertility rate is defined as the number of births annually per 1,000 women ages 15 to 44 years.
Health Disparity: Health disparities adversely affect groups of people who have systematically experienced greater social and/or economic obstacles to health and/or a clean environment based on their racial or ethnic group; religion; socioeconomic status; gender; age; mental health; cognitive, sensory, or physical disability; sexual orientation; geographic location; or other characteristics historically linked to discrimination or exclusion. Incidence: The number of new cases of disease or other condition that occur in a specified population during a given period.

Community Health Status Report – Sacramento County 2014 70
Definitions
Definitions
Infant Mortality Rate: Number of deaths to infants under one year of age divided by the number of births in the same year. The rate is per 1,000 live births. Low Birth Weight: Weight of a baby at birth less than 2500 grams (Less than 5.5 pounds). Prevalence: The proportion of cases of a disease or other condition present in a population without any distinction between new and old cases. When used without qualification the term usually refers to the number of cases as a proportion of the population at risk at a specified point in time (point prevalence). SIDS: Sudden Infant Death Syndrome (SIDS) is the diagnosis given for the sudden death of an infant under one year of age that remains unexplained after a thorough case investigation (i.e., autopsy, death scene exam, review of health status prior to dying and other family medical history). SIDS is the leading cause of death in infants between one month and one year of age. Social Determinants of Health: The social determinants of health are the conditions in which people are born, grow, live, work and age. These circumstances are shaped by the distribution of money, power and resources at global, national and local levels. Teen Birth Rate: The number of live births to females age 15 to 19 years divided by the number of females in the population age 15 to 19 years. The rate is expressed per 1,000 females ages 15 to 19 years.
Community Health Status Report – Sacramento County 2014 71
County of Sacramento Board of Supervisors
Phil Serna, District 1
Jimmie R. Yee, District 2, Chair Susan Peters, District 3
Roberta MacGlashan, District 4 Don Nottoli, District 5
Brad Hudson, County Executive Office
www.saccounty.net
Department of
Health & Human Services Sherri Z. Heller, EdD, Director
County Health officer Kasirye, Olivia C., MD, MS