Eagle Creek Ecological Interactions - U.S. Fish and … distribution natural origin winter steelhead...
31
Eagle Creek Ecological Interactions: Distribution and Migration of Hatchery and Wild Steelhead Annual Report for 2006 December 2007
Transcript of Eagle Creek Ecological Interactions - U.S. Fish and … distribution natural origin winter steelhead...
Eagle Creek Ecological Interactions: Distribution and Migration of Hatchery and Wild
Steelhead
Annual Report for 2006 December 2007

Eagle Creek Ecological Interactions: Distribution and migration of hatchery and wild steelhead
Progress Report 2006
Maureen Kavanagh, Doug Olson, Bill Brignon, and Jeff Hogle United States Fish and Wildlife Service, Columbia River Fisheries Program Office
1211 S.E. Cardinal Court, Suite 100, Vancouver WA 98683 360-604-2500
http://www.fws.gov/columbiariver
December 2007

Contents
List of Tables ...................................................................................................................... ii List of Figures .................................................................................................................... iii Background and Introduction ............................................................................................. 1 Methods............................................................................................................................... 3
Adult Trapping and Radio-Telemetry............................................................................. 3 Juvenile Radio-Telemetry............................................................................................... 5 Juvenile Fish Population Estimates ................................................................................ 5 Genetics........................................................................................................................... 6 Rearing Density .............................................................................................................. 7
Results................................................................................................................................. 9
Adult Trapping and Radio-Telemetry............................................................................. 9 Juvenile Radio-Telemetry ............................................................................................ 14 Juvenile Fish Population Estimates .............................................................................. 17
Genetics..........................................................................................................................19 Rearing Density .............................................................................................................22 Acknowledgements........................................................................................................... 24 Literature Cited ..................................................................................................................25
i
List of Tables
Table 1. Expected return dates of juvenile winter steelhead released for broodyears 2004-2006 .............................................................................................................7 Table 2. Mean lengths of natural origin steelhead trapped at the lower ladder and hatchery steelhead bio-sampled at ECNFH. .....................................................10 Table 3. The number of radio-tagged adult winter steelhead detected at the hatchery, North Fork, and mouth receivers from January through June 2006 ....................12 Table 4. The number of radio-tagged adult winter steelhead last detected at the hatchery, North Fork, and mouth receivers from January through June 2006. Tag recoveries include tags collected from fish during spawning, by anglers,
and from snorkeling at the lower ladder and above the middle ladder. Steelhead not detected at a fixed telemetry station or through mobile tracking were classified as not detected............................................................................12
Table 5. Mean length, weight, and condition factor for radio-tagged hatchery steelhead
smolts from low, medium, and high density groups...........................................14 Table 6. Trap efficiency and Peterson population estimates for juvenile fish marked and
recaptured at the smolt trap on Eagle Creek March 26 through May 8, 2006. Trap was removed on May 8th because of vandalism resulting in high fish mortalities ...........................................................................................................18
Table 7. The number of genetic samples collected for each sample reach in
2006. Unknown sample groups included juveniles from the North Fork and upper and lower Eagle Creek. Natural origin adults collected at the lower ladder and juveniles collected from ECNFH were used as baseline groups .....20
Table 8. Mean fork length for brood year 2005 hatchery juvenile steelhead in the rearing density study. Fish were sampled in July 2005 during coded wire tagging. The number of fish tagged and transferred to raceways is in parentheses.........22
Table 9. Mean fork length, condition factor, and density index for brood year 2005 hatchery juvenile steelhead in the rearing density study. Fish were sampled in March 2006 and volitionally released in April 2006. The number of fish released from each raceway is in parentheses.....................................................22
ii
List of Figures
Figure 1. Stationary antennae sites on Eagle Creek and North Fork Eagle Creek……….4 Figure 2. Reach locations for genetic sample collection on Eagle Creek and North Fork Eagle Creek .................................................................................................6 Figure 3. Bi-weekly catch of adult winter steelhead trapped in the lower ladder on Eagle Creek in 2006........................................................................................9 Figure 4. Length-Frequency distribution natural origin winter steelhead trapped at the lower ladder on Eagle Creek.............................................................................10 Figure 5. Length-Frequency distribution hatchery origin winter steelhead returning to Eagle Creek NFH ..............................................................................................10 Figure 6. Last mobile and fixed telemetry detections for radio-tagged adult winter steelhead. The number of hatchery and wild steelhead detected at each site is indicated in bold text next to the pie chart. Tag recoveries by anglers are not included on the map. Two wild steelhead and one hatchery steelhead were not detected post tagging..........................................................13 Figure 7. Mean fork length of radio-tagged steelhead smolts from different density groups. Winter steelhead from low density group were significantly larger than those from medium and high density groups (P<0.05). Error bars represent 95% confidence intervals. ...........................................................................................................14 Figure 8. Mean weight of radio-tagged steelhead smolts from different density groups. Winter steelhead from low density group were significantly larger than those from medium and high density groups (P<0.05). Error bars represent 95% confidence intervals. ...........................................................................................................14 Figure 9. Last mobile and fixed telemetry detections for hatchery steelhead smolts following volitional release from Eagle Creek National Fish Hatchery...........15 Figure 10. Fork length of winter steelhead smolts volitionally released from Eagle Creek National Fish Hatchery (Rkm20) and detected at the fixed telemetry station at the mouth of Eagle Creek (Rkm 1.1). No relationship between smolt length at release and emigration time from the hatchery to the mouth of Eagle Creek was detected .....................................................................................................16 Figure 11. Estimated number of juvenile O. mykiss in Eagle Creek 2006 .......................17
iii
iv
Figure 12. Map of genetic sampling locations on Eagle Creek ........................................19
Figure 13. Population assignment plot coordinates are assignment likelihood values (log- transformed) generated in the program WHICHRUN for all 2006 samples, where the dotted line delineates equal likelihood of NOR or HAT origin .....21 Figure 14. Mean fork lengths of juvenile winter steelhead, (brood year 2005), sampled in July 2005 during coded wire tagging at Eagle Creek National Fish Hatchery. Lengths were taken from fish prior to initial ponding at the hatchery. No significant difference in fork lengths between density groups was detected. Error bars represent standard deviation.......................23 Figure 15. Mean fork lengths of juvenile winter steelhead (brood year 2005), sampled in March 2006 prior to volitional release from Eagle Creek National Fish Hatchery. No significant difference in fork lengths between density groups was detected. Error bars represent standard deviation........................23

Background Eagle Creek National Fish Hatchery (NFH) spawns and raises juvenile coho salmon (Oncorhynchus kisutch) and juvenile steelhead trout (Oncorhynchus mykiss) that are released into Eagle Creek within the Clackamas River basin, Oregon. The purpose of the program is to mitigate fish losses in the Columbia River Basin caused by federal dams, to provide commercial, sport, and tribal harvest, and to support tribal restoration programs upstream of Bonneville Dam. Eagle Creek NFH currently operates as part of the Columbia River Fisheries Development Program and is funded through the Mitchell Act - a program administered by NOAA Fisheries (formerly NMFS). This program is part of the mitigation for habitat loss resulting from flooding, siltation, and fluctuating water levels caused by Bonneville Dam. The Columbia River Fish Management Plan under U.S. v Oregon is currently under renegotiation, however, current production goals for release into Eagle Creek (150,000 steelhead and 500,000 coho) are generally consistent with the production goals in the expired plan. In addition, Eagle Creek NFH production is consistent with court adopted management agreements for Columbia River Chinook, steelhead, and coho that specifically identify coho production from Eagle Creek NFH for tribal restoration programs (Eagle Creek Hatchery and Genetic Management Plans).
The majority of adult hatchery steelhead are present in Eagle Creek from December through March; whereas adult, wild, ESA listed, late-run winter steelhead are most present in Eagle Creek from February until June. While the peak run timing between the groups differs, there is an overlap and concerns have been raised about hatchery steelhead interacting with wild steelhead. The wild winter steelhead in Eagle Creek are considered a unique run, and the North Fork Eagle Creek is considered the major spawning area for the wild steelhead in the Eagle Creek watershed. Hatchery adults that stray into the North Fork Eagle Creek and spawn successfully can affect the wild population in four ways: 1) competition with wild fish for spawning areas, 2) displacement of wild fish due to presence alone, 3) competition between juveniles for rearing habitat, and 4) potential genetic introgression from the hatchery to the wild population.
1

Introduction In 2003, the United States Fish and Wildlife Service - Columbia River Fisheries Program Office (USFWS- CRFPO) commenced a program to monitor and evaluate the effects of hatchery coho and steelhead released from Eagle Creek National Fish Hatchery (ECNFH) on ESA listed wild populations of fish spawning and rearing in Eagle Creek and its tributaries. Initially, project efforts were focused on monitoring the distribution and outmigration timing of coho and steelhead smolts released from ECNFH using radio-telemetry techniques. The telemetry study conducted in 2003 and 2004 suggests that juvenile coho migrate at a significantly faster rate than steelhead, and hatchery steelhead may residualize in Eagle Creek following volitional release (Hoffman et al. 2003, 2004). In 2005, the Eagle Creek ecological interactions project was expanded, and the distribution, migration timing, and reproductive success of adult hatchery and natural origin steelhead was monitored using trapping and radio-telemetry techniques (Kavanagh et al 2006). We have continued to monitor and evaluate the distribution and behavior of juvenile steelhead released from the hatchery as well as evaluate winter steelhead rearing densities to optimize smolt to adult surivival. This report summarizes the progress made during the 2006 field investigation.
Objective 1: Assess the distribution and migration timing of hatchery and natural origin adult winter steelhead in Eagle Creek and North Fork Eagle Creek using radio-telemetry.
Objective 2: Assess the distribution and outmigration timing of juvenile winter
steelhead post volitional release from ECNFH using radio-telemetry. Objective 3: Estimate juvenile abundance and reproductive success of natural-
origin winter steelhead in Eagle Creek and North Fork Eagle Creek.
Objective 4: Determine genetic structure of hatchery and natural origin steelhead in Eagle Creek and North Fork Eagle Creek.
Objective 5: Determine the effect of rearing density on growth and survival of
winter steelhead, both on hatchery and post-release.
2

Methods Objective 1: Assess the distribution and migration timing of hatchery and natural origin adult winter steelhead in Eagle Creek and North Fork Eagle Creek using radio-telemetry.
Adult Trapping and Radio-Telemetry Eagle Creek NFH owns and maintains two fish ladders on Eagle Creek. The lower ladder, located below the confluence of Eagle Creek and North Fork Eagle Creek, was closed periodically from January through June to trap adult winter steelhead and look for late returning coho. A “V”-trap fish weir was placed in the ladder and used to trap adult fish migrating upstream to spawn. A sub-sample of hatchery and wild fish were gastrically implanted with coded radio-transmitters (Lotek Wireless; model MCFT-3A), weighing 16 grams and having an estimated operational life of 457 days. 50 radiotags were available for adult steelhead. A fish was considered “wild” if there were no obvious deformed or missing fins nor coded-wire tags. Overall condition of fish trapped in the ladder was visually evaluated by fish handlers and only those fish determined to be “strong and healthy” were radiotagged. Selected fish were anesthetized with clove oil, checked for marks (adipose clips, right ventral clips, coded wire tags) and measured for length. Scale and tissue samples were taken from wild fish to determine age structure and for genetic analyses by the USFWS Abernathy Fish Technology Center (Matala et al. 2005). Tagged fish were placed in a tub of fresh water to regain equilibrium and then released at or near the fish ladder. Three fixed telemetry stations were set up on Eagle Creek and North Fork Eagle Creek to monitor fish movement (Figure 1). Each fixed station consisted of a four element Yagi antenna, a Lotek SRX-400 continuous data logging receiver and a 12-volt battery used to power the receiver. Antennas were angled toward the stream and attached to 10 ft. long metal conduit pipes driven into the ground and secured with stake posts. Receivers were downloaded weekly with a Rugged laptop computer, and batteries were changed following downloads at each station. Fish were mobile tracked 2-3 times per week along North Fork and mainstem Eagle Creek. Eagle Creek flows downstream from the hatchery through a canyon making mobile tracking difficult in many areas. As a result, mobile tracking was concentrated in the stream area between the lower ladder and middle ladder.
3
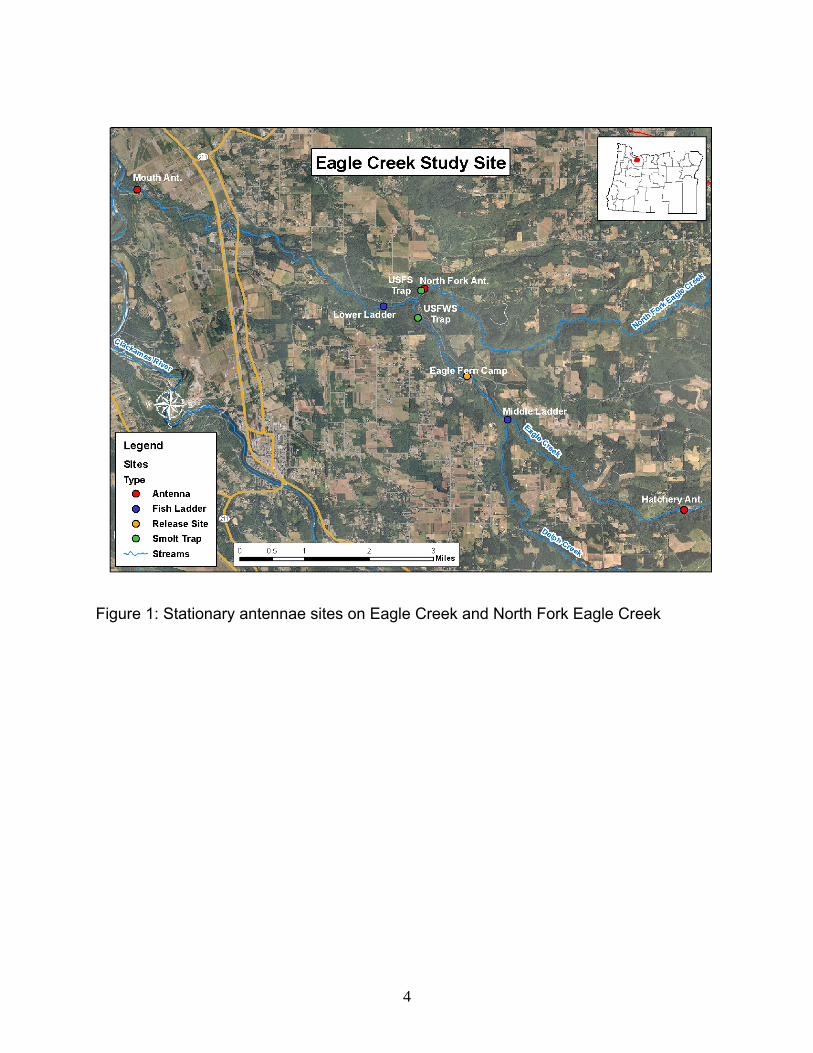
Figure 1: Stationary antennae sites on Eagle Creek and North Fork Eagle Creek
4

Objective 2: Assess the distribution and outmigration timing of juvenile winter steelhead post volitional release from ECNFH using radio-telemetry.
Juvenile Radio-Telemetry In March 2006, 45 juvenile hatchery steelhead were surgically implanted with coded radio-transmitters (Lotek Wireless, model NTC-4-2L) weighing 2.1 grams and having an estimated operational life of 90 days. Five juvenile steelhead were randomly selected with a dip-net from 9 raceways representing three density groups (low, medium, high). Fish were anesthetized with MS-222, measured for length and weight, radio-tagged, and allowed to recover before being placed in their respective raceway. Volitional release of juvenile steelhead from the hatchery began in April and coincided with radio-tagging of adult steelhead at the lower ladder. Mobile and stationary telemetry equipment used to monitor adult movement was simultaneously used to track juvenile fish. Objective 3: Estimate juvenile abundance and reproductive success of natural-origin winter steelhead in Eagle Creek and North Fork Eagle Creek. Juvenile Fish Population Estimates A five foot rotary screw trap was placed in Eagle Creek near Eagle Fern Park to monitor and estimate juvenile production in upper Eagle Creek (below the hatchery and above the North Fork). The trap was fished six days a week, (Sunday through Friday), from March through April and checked daily during the trapping period. Salmonids caught were anesthetized with MS 222, identified by species and life stage (juvenile or smolt), weighed, measured, and marked with a partial fin clip. Fry less than 50mm in length were not clipped. Smolts were distinguished from juveniles by having a silver color (or the beginnings of a silver sheen), a fading or loss of parr marks, and often a dark trailing fringe to their caudal fin. Age 0+ trout and any fish not showing visible signs of smoltification were identified as O. mykiss. Fin clip marks changed daily and followed a similar schedule used by the US Forest Service on North Fork Eagle Creek. No more than 25 fish per species and life stage were marked on a given day. Non-target species such as sculpin and dace were counted and a total weight taken. Marked salmonids were taken upstream to a pre-designated release site, and released. Trap efficiency and population estimates were calculated using the Peterson estimate.
5
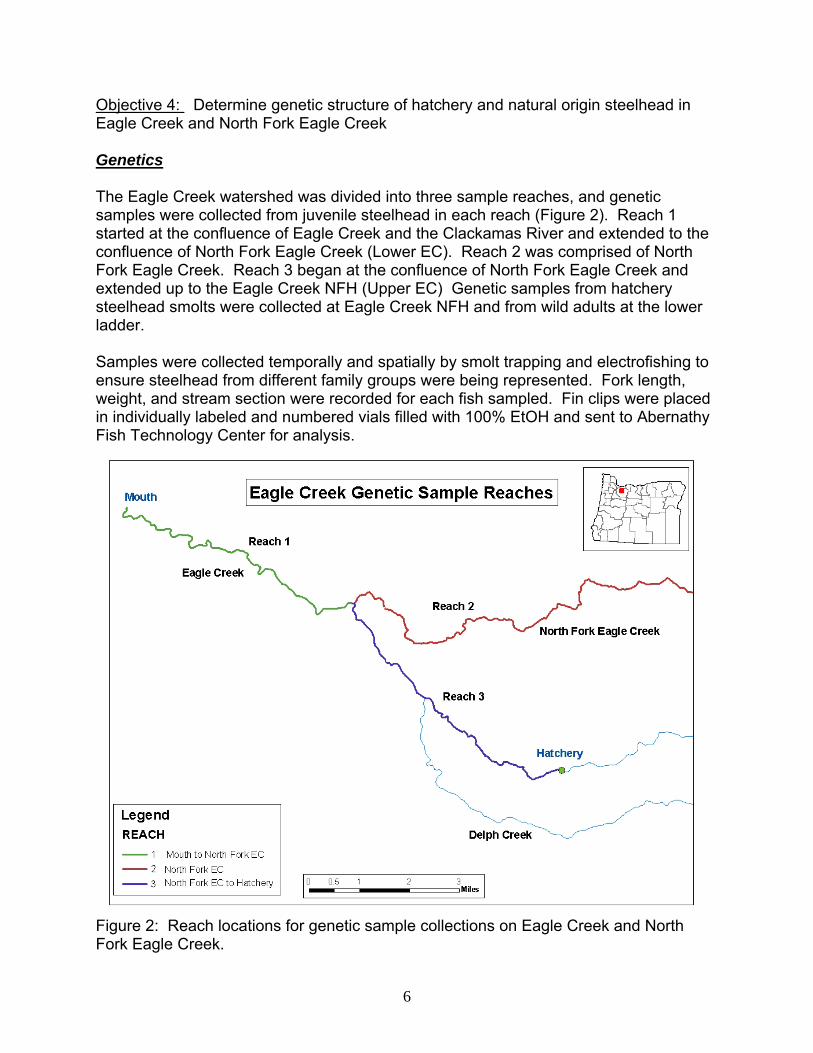
Objective 4: Determine genetic structure of hatchery and natural origin steelhead in Eagle Creek and North Fork Eagle Creek Genetics The Eagle Creek watershed was divided into three sample reaches, and genetic samples were collected from juvenile steelhead in each reach (Figure 2). Reach 1 started at the confluence of Eagle Creek and the Clackamas River and extended to the confluence of North Fork Eagle Creek (Lower EC). Reach 2 was comprised of North Fork Eagle Creek. Reach 3 began at the confluence of North Fork Eagle Creek and extended up to the Eagle Creek NFH (Upper EC) Genetic samples from hatchery steelhead smolts were collected at Eagle Creek NFH and from wild adults at the lower ladder. Samples were collected temporally and spatially by smolt trapping and electrofishing to ensure steelhead from different family groups were being represented. Fork length, weight, and stream section were recorded for each fish sampled. Fin clips were placed in individually labeled and numbered vials filled with 100% EtOH and sent to Abernathy Fish Technology Center for analysis.
Figure 2: Reach locations for genetic sample collections on Eagle Creek and North Fork Eagle Creek.
6
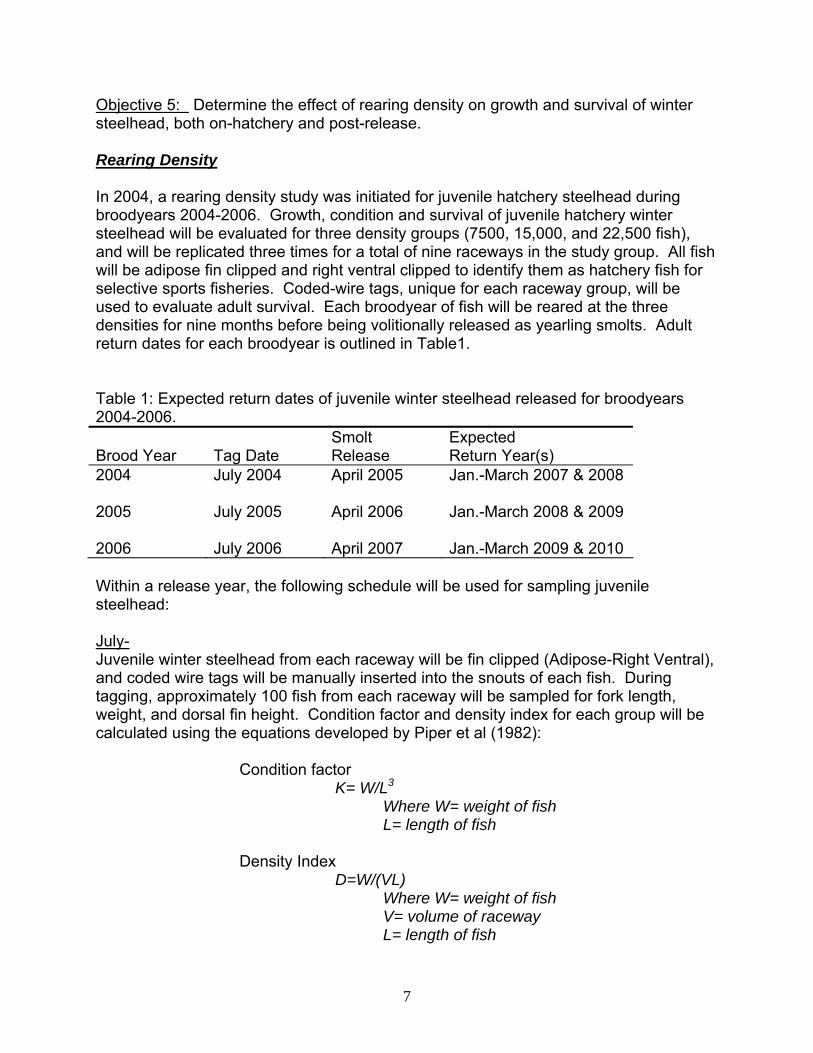
Objective 5: Determine the effect of rearing density on growth and survival of winter steelhead, both on-hatchery and post-release. Rearing Density In 2004, a rearing density study was initiated for juvenile hatchery steelhead during broodyears 2004-2006. Growth, condition and survival of juvenile hatchery winter steelhead will be evaluated for three density groups (7500, 15,000, and 22,500 fish), and will be replicated three times for a total of nine raceways in the study group. All fish will be adipose fin clipped and right ventral clipped to identify them as hatchery fish for selective sports fisheries. Coded-wire tags, unique for each raceway group, will be used to evaluate adult survival. Each broodyear of fish will be reared at the three densities for nine months before being volitionally released as yearling smolts. Adult return dates for each broodyear is outlined in Table1. Table 1: Expected return dates of juvenile winter steelhead released for broodyears 2004-2006. Brood Year
Tag Date
Smolt Release
Expected Return Year(s)
2004 2005 2006
July 2004 July 2005 July 2006
April 2005 April 2006 April 2007
Jan.-March 2007 & 2008 Jan.-March 2008 & 2009 Jan.-March 2009 & 2010
Within a release year, the following schedule will be used for sampling juvenile steelhead: July- Juvenile winter steelhead from each raceway will be fin clipped (Adipose-Right Ventral), and coded wire tags will be manually inserted into the snouts of each fish. During tagging, approximately 100 fish from each raceway will be sampled for fork length, weight, and dorsal fin height. Condition factor and density index for each group will be calculated using the equations developed by Piper et al (1982):
Condition factor K= W/L3
Where W= weight of fish L= length of fish
Density Index
D=W/(VL) Where W= weight of fish V= volume of raceway L= length of fish
7

November- 500 fish from each raceway will be sampled for tag retention. Fish will be crowded to the head of the raceway, randomly selected with a dipnet, and anethsized with MS-222. Juvenile steelhead will be visually inspected for mark (ADRV) retention and passed through coded wire tag detectors to determine tag retention rates. March- Prior to volitional release, 300 fish from each raceway will be sampled for fork length, weight, and dorsal fin height. Condition factor and density index will be calculated. Preliminary analyses of treatment groups will compare the effect of rearing density on smolt length at time of release using a single factor ANOVA. If statistical differences are found between treatment groups, Tukey’s t-test will be used to determine the statistically significant groups within each treatment. Subsequent analyses of treatment groups will be conducted in 2007 when adult steelhead from the 2004 brood return to the hatchery. Adult fish will be sampled for fork length, dorsal fin height, and to recover coded-wire tags. Adult survival between treatment groups will be tested at the 95% confidence level with a single factor ANOVA.
8
Results
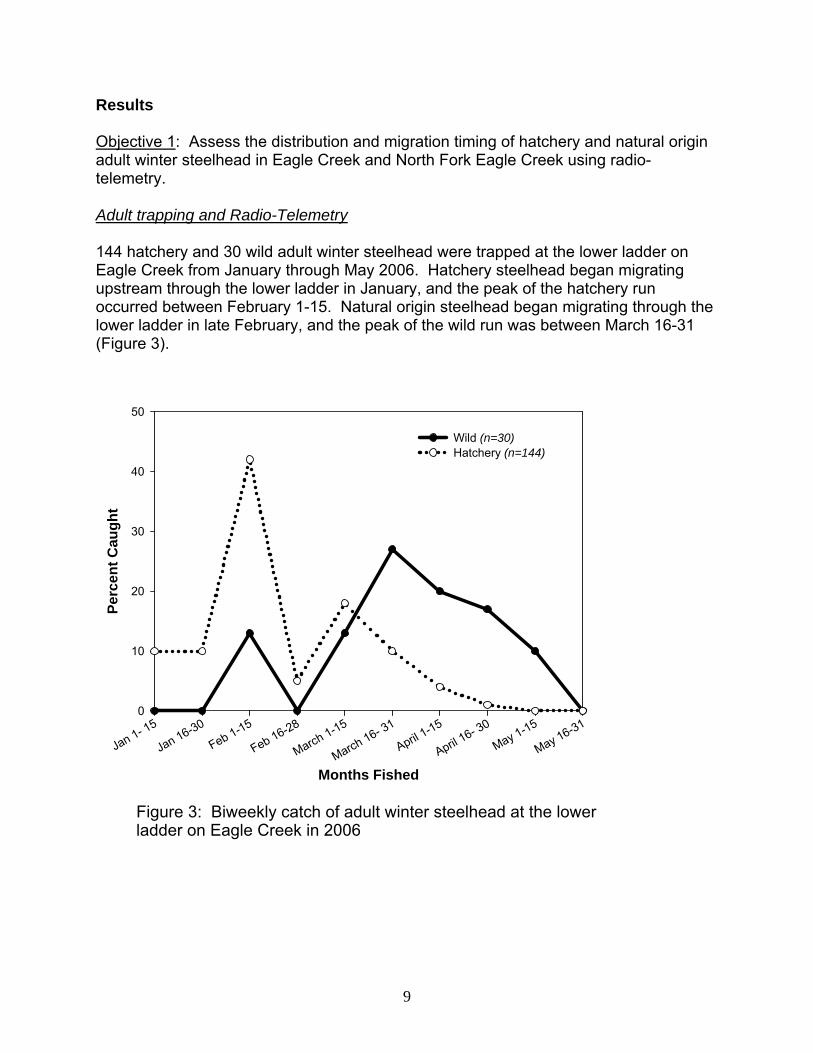
Objective 1: Assess the distribution and migration timing of hatchery and natural origin adult winter steelhead in Eagle Creek and North Fork Eagle Creek using radio-telemetry. Adult trapping and Radio-Telemetry 144 hatchery and 30 wild adult winter steelhead were trapped at the lower ladder on Eagle Creek from January through May 2006. Hatchery steelhead began migrating upstream through the lower ladder in January, and the peak of the hatchery run occurred between February 1-15. Natural origin steelhead began migrating through the lower ladder in late February, and the peak of the wild run was between March 16-31 (Figure 3).
Figure 3: Biweekly catch of adult winter steelhead at the lower ladder on Eagle Creek in 2006
Months Fished
Jan 1- 15
Jan 16-30
Feb 1-15
Feb 16-28
March 1-15
March 16- 31
April 1-15
April 16- 30
May 1-15
May 16-31
Perc
ent C
augh
t
0
10
20
30
40
50
Wild (n=30)Hatchery (n=144)
9
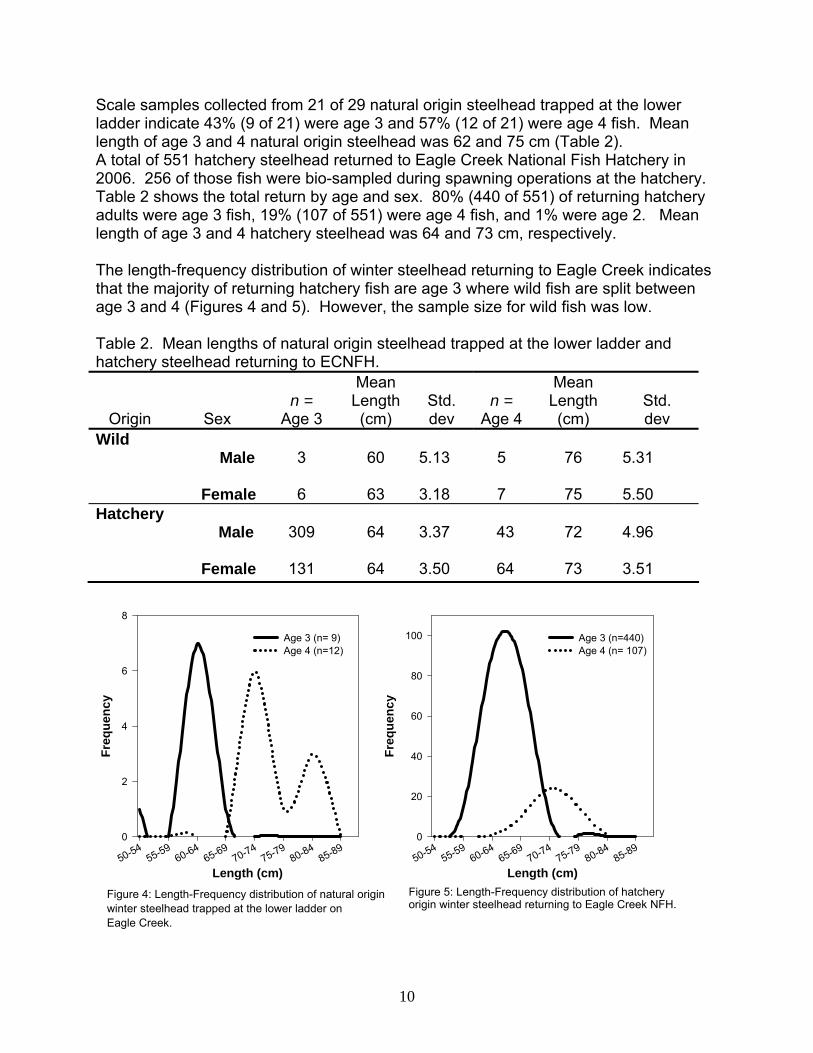
Scale samples collected from 21 of 29 natural origin steelhead trapped at the lower ladder indicate 43% (9 of 21) were age 3 and 57% (12 of 21) were age 4 fish. Mean length of age 3 and 4 natural origin steelhead was 62 and 75 cm (Table 2). A total of 551 hatchery steelhead returned to Eagle Creek National Fish Hatchery in 2006. 256 of those fish were bio-sampled during spawning operations at the hatchery. Table 2 shows the total return by age and sex. 80% (440 of 551) of returning hatchery adults were age 3 fish, 19% (107 of 551) were age 4 fish, and 1% were age 2. Mean length of age 3 and 4 hatchery steelhead was 64 and 73 cm, respectively. The length-frequency distribution of winter steelhead returning to Eagle Creek indicates that the majority of returning hatchery fish are age 3 where wild fish are split between age 3 and 4 (Figures 4 and 5). However, the sample size for wild fish was low. Table 2. Mean lengths of natural origin steelhead trapped at the lower ladder and hatchery steelhead returning to ECNFH.
Origin
Sex
n =
Age 3
Mean Length (cm)
Std. dev
n =
Age 4
Mean Length (cm)
Std. dev
Wild
Male
Female
3
6
60
63
5.13 3.18
5
7
76
75
5.31 5.50
Hatchery
Male
Female
309
131
64
64
3.37 3.50
43 64
72
73
4.96 3.51
Figure 4: Length-Frequency distribution of natural origin winter steelhead trapped at the lower ladder on Eagle Creek.
Length (cm)50-54
55-5960-64
65-6970-74
75-7980-84
85-89
Freq
uenc
y
0
2
4
6
8
Age 3 (n= 9)Age 4 (n=12)
Figure 5: Length-Frequency distribution of hatchery origin winter steelhead returning to Eagle Creek NFH.
Length (cm)50-54
55-5960-64
65-6970-74
75-7980-84
85-89
Freq
uenc
y
0
20
40
60
80
100 Age 3 (n=440)Age 4 (n= 107)
10
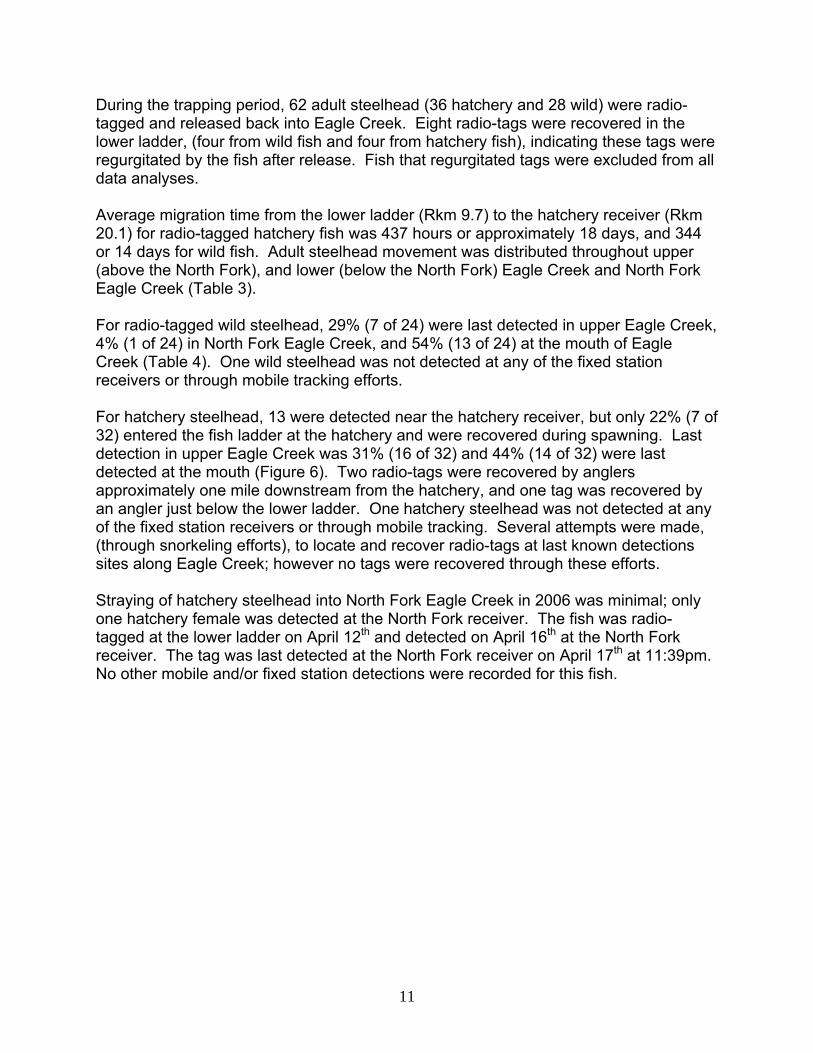
During the trapping period, 62 adult steelhead (36 hatchery and 28 wild) were radio-tagged and released back into Eagle Creek. Eight radio-tags were recovered in the lower ladder, (four from wild fish and four from hatchery fish), indicating these tags were regurgitated by the fish after release. Fish that regurgitated tags were excluded from all data analyses. Average migration time from the lower ladder (Rkm 9.7) to the hatchery receiver (Rkm 20.1) for radio-tagged hatchery fish was 437 hours or approximately 18 days, and 344 or 14 days for wild fish. Adult steelhead movement was distributed throughout upper (above the North Fork), and lower (below the North Fork) Eagle Creek and North Fork Eagle Creek (Table 3). For radio-tagged wild steelhead, 29% (7 of 24) were last detected in upper Eagle Creek, 4% (1 of 24) in North Fork Eagle Creek, and 54% (13 of 24) at the mouth of Eagle Creek (Table 4). One wild steelhead was not detected at any of the fixed station receivers or through mobile tracking efforts. For hatchery steelhead, 13 were detected near the hatchery receiver, but only 22% (7 of 32) entered the fish ladder at the hatchery and were recovered during spawning. Last detection in upper Eagle Creek was 31% (16 of 32) and 44% (14 of 32) were last detected at the mouth (Figure 6). Two radio-tags were recovered by anglers approximately one mile downstream from the hatchery, and one tag was recovered by an angler just below the lower ladder. One hatchery steelhead was not detected at any of the fixed station receivers or through mobile tracking. Several attempts were made, (through snorkeling efforts), to locate and recover radio-tags at last known detections sites along Eagle Creek; however no tags were recovered through these efforts. Straying of hatchery steelhead into North Fork Eagle Creek in 2006 was minimal; only one hatchery female was detected at the North Fork receiver. The fish was radio-tagged at the lower ladder on April 12th and detected on April 16th at the North Fork receiver. The tag was last detected at the North Fork receiver on April 17th at 11:39pm. No other mobile and/or fixed station detections were recorded for this fish.
11
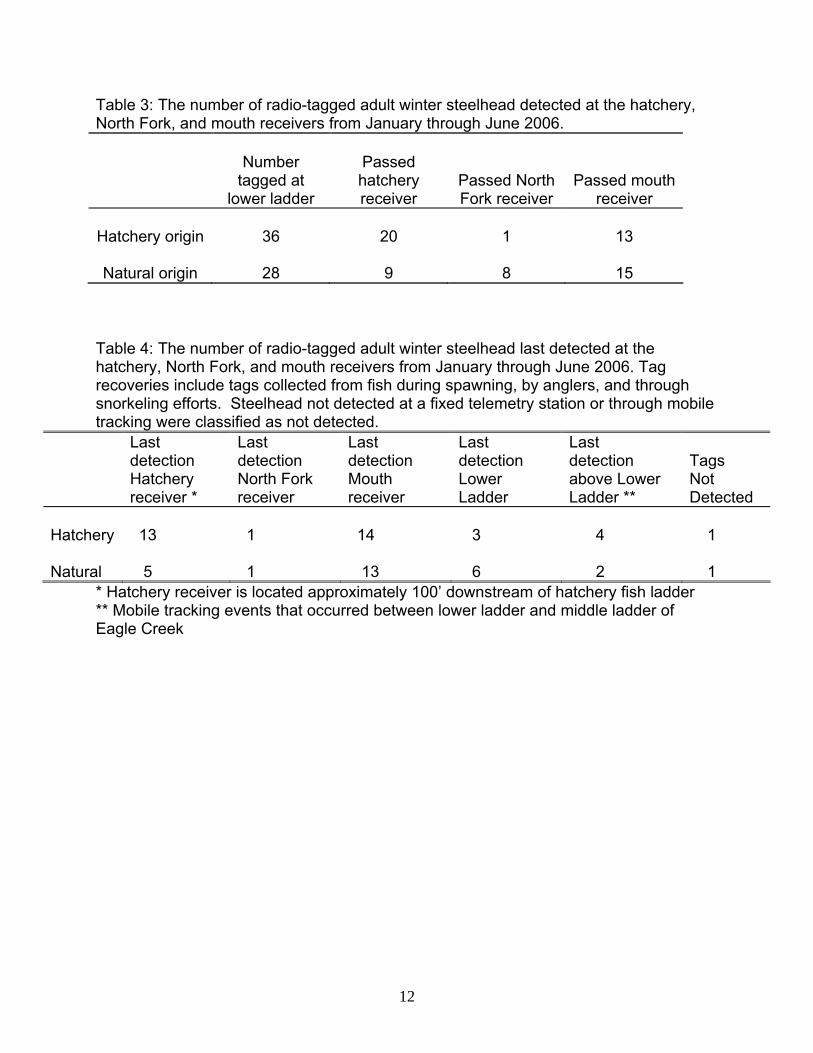
Table 3: The number of radio-tagged adult winter steelhead detected at the hatchery, North Fork, and mouth receivers from January through June 2006.
Number tagged at
lower ladder
Passed hatchery receiver
Passed North Fork receiver
Passed mouth receiver
Hatchery origin
Natural origin
36
28
20
9
1
8
13
15 Table 4: The number of radio-tagged adult winter steelhead last detected at the hatchery, North Fork, and mouth receivers from January through June 2006. Tag recoveries include tags collected from fish during spawning, by anglers, and through snorkeling efforts. Steelhead not detected at a fixed telemetry station or through mobile tracking were classified as not detected.
Last detection Hatchery receiver *
Last detection North Fork receiver
Last detection Mouth receiver
Last detection Lower Ladder
Last detection above Lower Ladder **
Tags Not Detected
Hatchery Natural
13 5
1 1
14 13
3 6
4 2
1 1
* Hatchery receiver is located approximately 100’ downstream of hatchery fish ladder ** Mobile tracking events that occurred between lower ladder and middle ladder of Eagle Creek
12
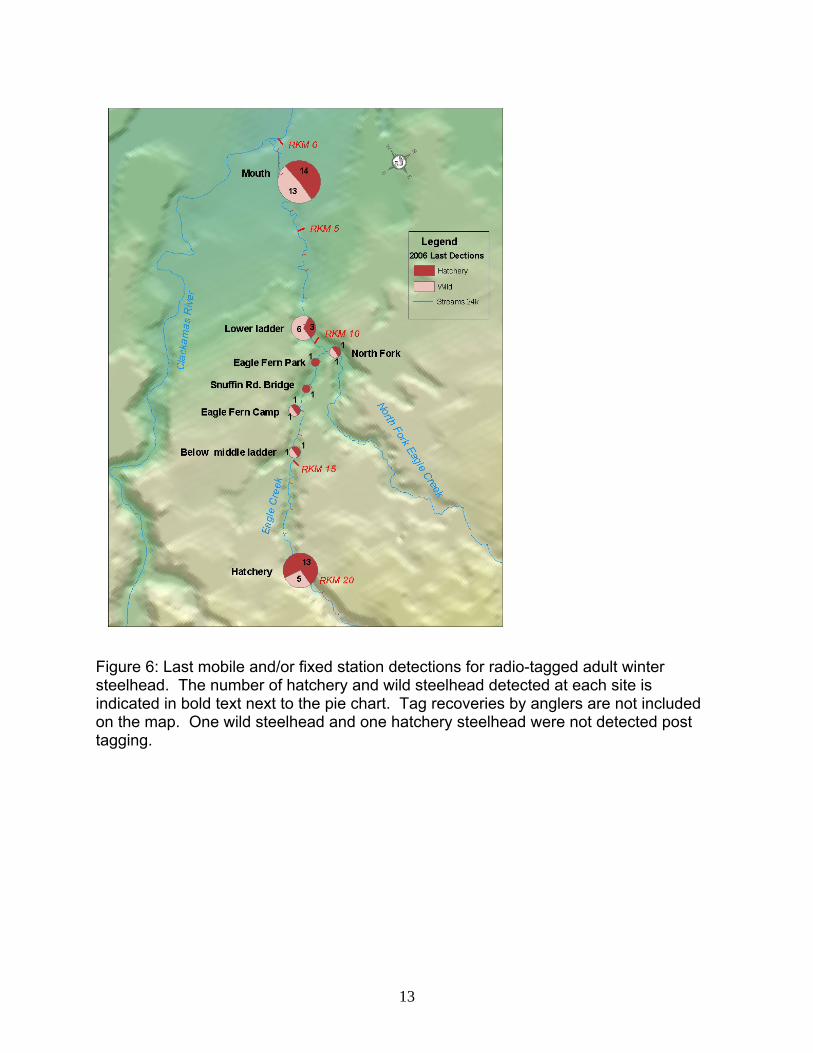
Figure 6: Last mobile and/or fixed station detections for radio-tagged adult winter steelhead. The number of hatchery and wild steelhead detected at each site is indicated in bold text next to the pie chart. Tag recoveries by anglers are not included on the map. One wild steelhead and one hatchery steelhead were not detected post tagging.
13
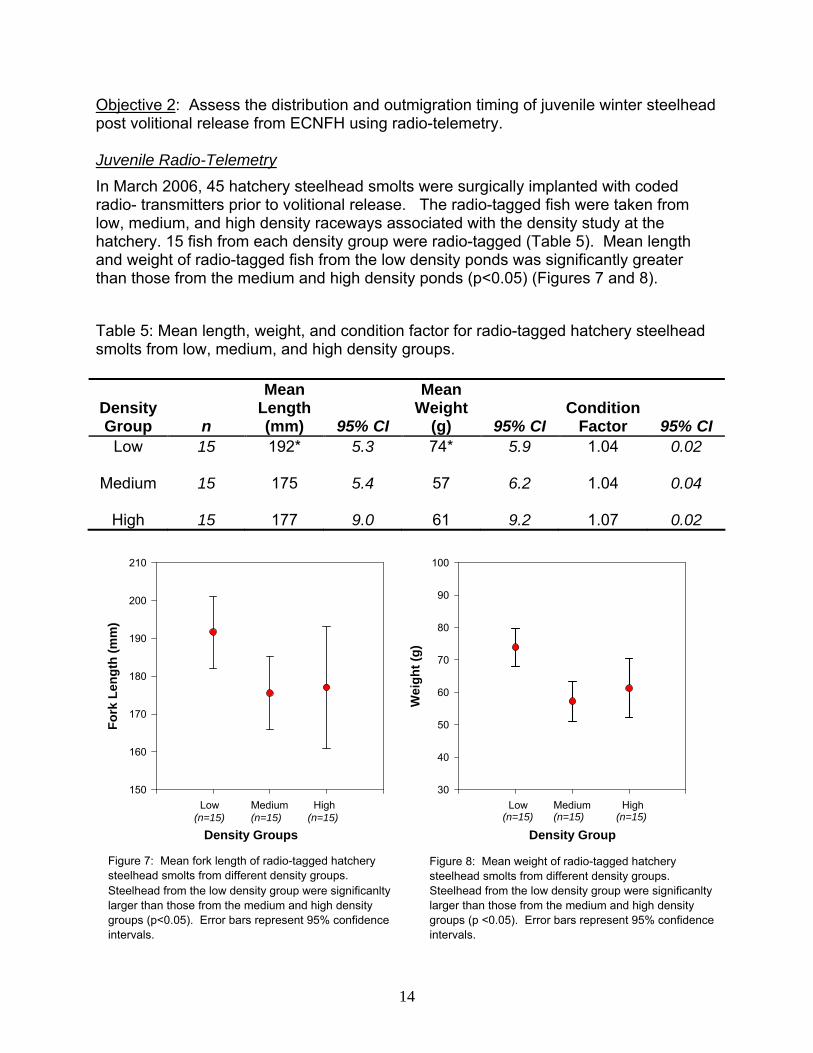
Objective 2: Assess the distribution and outmigration timing of juvenile winter steelhead post volitional release from ECNFH using radio-telemetry. Juvenile Radio-Telemetry In March 2006, 45 hatchery steelhead smolts were surgically implanted with coded radio- transmitters prior to volitional release. The radio-tagged fish were taken from low, medium, and high density raceways associated with the density study at the hatchery. 15 fish from each density group were radio-tagged (Table 5). Mean length and weight of radio-tagged fish from the low density ponds was significantly greater than those from the medium and high density ponds (p<0.05) (Figures 7 and 8).
Table 5: Mean length, weight, and condition factor for radio-tagged hatchery steelhead smolts from low, medium, and high density groups.
Figure 8: Mean weight of radio-tagged hatchery steelhead smolts from different density groups. Steelhead from the low density group were significanlty larger than those from the medium and high density groups (p <0.05). Error bars represent 95% confidenceintervals.
Density Group
Wei
ght (
g)
30
40
50
60
70
80
90
100
Low(n=15)
Medium(n=15)
High(n=15)
Figure 7: Mean fork length of radio-tagged hatchery steelhead smolts from different density groups. Steelhead from the low density group were significanlty larger than those from the medium and high density groups (p<0.05). Error bars represent 95% confidence intervals.
Density Groups
Fork
Len
gth
(mm
)
150
160
170
180
190
200
210
Low (n=15)
Medium(n=15)
High (n=15)
Density Group
n
Mean Length (mm)
95% CI
Mean Weight
(g)
95% CI
Condition
Factor
95% CI Low
Medium
High
15
15
15
192*
175
177
5.3
5.4
9.0
74*
57
61
5.9
6.2
9.2
1.04
1.04
1.07
0.02
0.04
0.02
14

A data logging receiver was set up on Eagle Creek just below the volitional release pond to detect smolts as they left the hatchery. 25 radio-tagged steelhead smolts were detected at the fixed station receiver located at the hatchery. Two smolts were detected near the middle ladder (one above and one below the fish ladder) (Rkm 14.7), and one was detected at Eagle Fern Park (Rkm 11) (Figure 9). Seven smolts were not detected at the fixed station receivers or through mobile tracking. 10 radio-tagged hatchery steelhead smolts were detected at the fixed telemetry station located near the mouth of Eagle Creek. Average migration time from the hatchery to the mouth was 148 hours or approximately 6 days (Figure 10). A linear regression showed no significant relationship between smolt size at release and migration time from the hatchery (RKM 20.1) to the fixed station at the mouth of Eagle Creek (RKM1.1)
Figure 9: Last mobile and fixed telemetry detections for hatchery steelhead smolts following volitional release from Eagle Creek National Fish Hatchery.
15
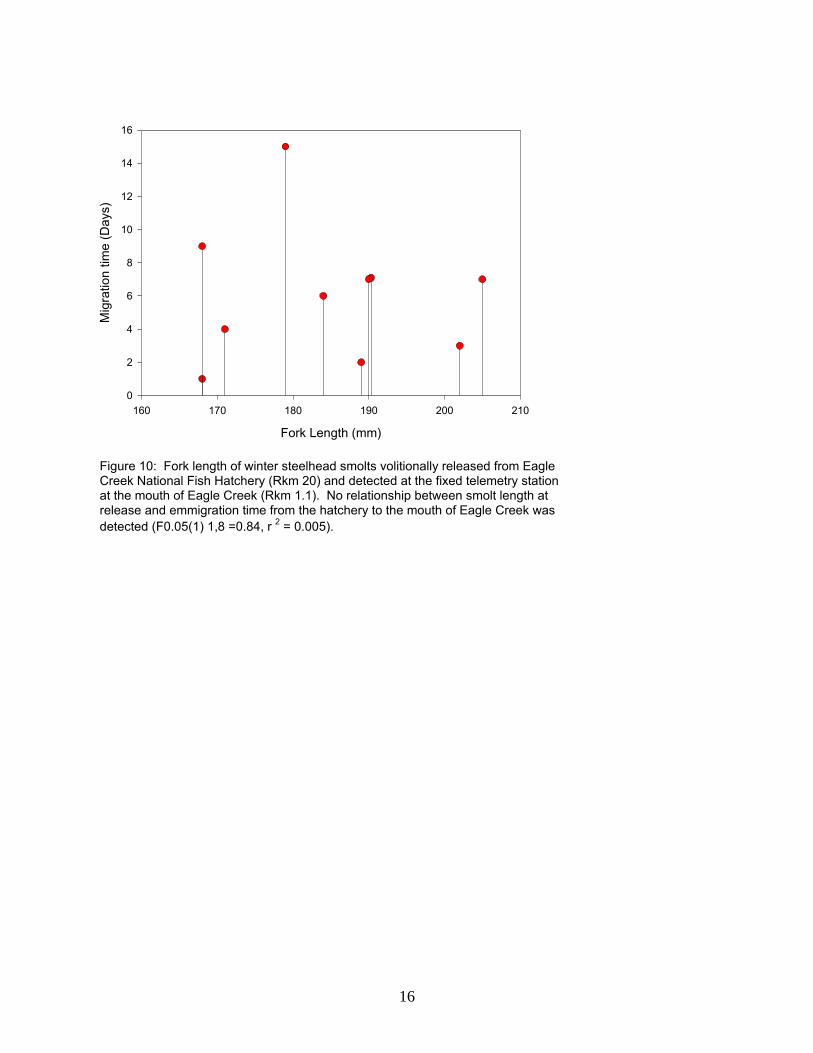
Figure 10: Fork length of winter steelhead smolts volitionally released from EagleCreek National Fish Hatchery (Rkm 20) and detected at the fixed telemetry station at the mouth of Eagle Creek (Rkm 1.1). No relationship between smolt length atrelease and emmigration time from the hatchery to the mouth of Eagle Creek wasdetected (F0.05(1) 1,8 =0.84, r 2 = 0.005).
Fork Length (mm)
160 170 180 190 200 210
Mig
ratio
n tim
e (D
ays)
0
2
4
6
8
10
12
14
16
16
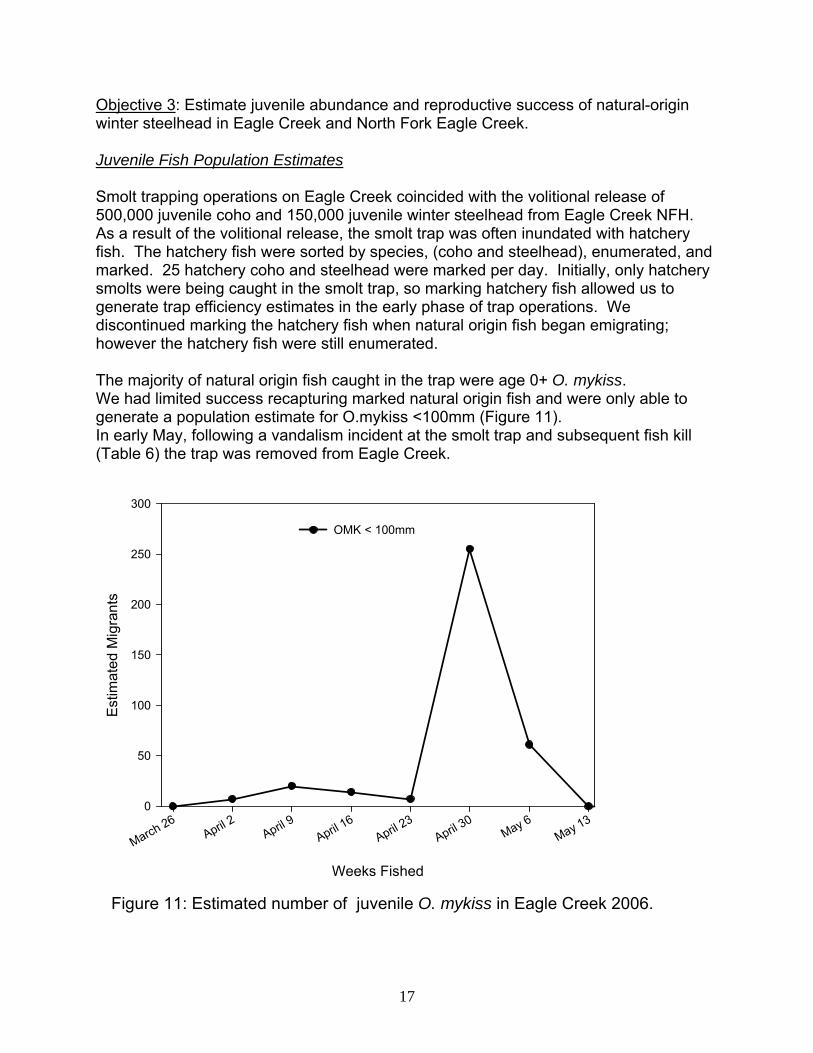
Objective 3: Estimate juvenile abundance and reproductive success of natural-origin winter steelhead in Eagle Creek and North Fork Eagle Creek. Juvenile Fish Population Estimates Smolt trapping operations on Eagle Creek coincided with the volitional release of 500,000 juvenile coho and 150,000 juvenile winter steelhead from Eagle Creek NFH. As a result of the volitional release, the smolt trap was often inundated with hatchery fish. The hatchery fish were sorted by species, (coho and steelhead), enumerated, and marked. 25 hatchery coho and steelhead were marked per day. Initially, only hatchery smolts were being caught in the smolt trap, so marking hatchery fish allowed us to generate trap efficiency estimates in the early phase of trap operations. We discontinued marking the hatchery fish when natural origin fish began emigrating; however the hatchery fish were still enumerated. The majority of natural origin fish caught in the trap were age 0+ O. mykiss. We had limited success recapturing marked natural origin fish and were only able to generate a population estimate for O.mykiss <100mm (Figure 11). In early May, following a vandalism incident at the smolt trap and subsequent fish kill (Table 6) the trap was removed from Eagle Creek.
Figure 11: Estimated number of juvenile O. mykiss in Eagle Creek 2006.
Weeks Fished
March 26April 2 April 9
April 16
April 23
April 30
May 6May 13
Estim
ated
Mig
rant
s
0
50
100
150
200
250
300
OMK < 100mm
17
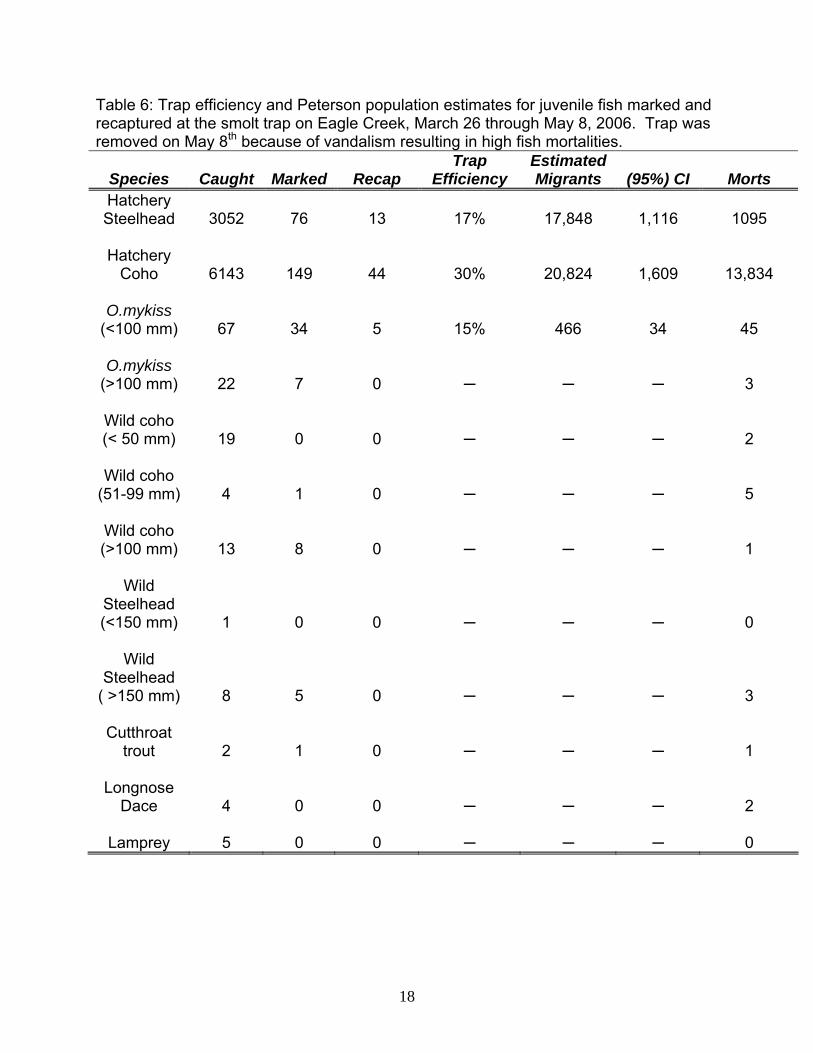
Table 6: Trap efficiency and Peterson population estimates for juvenile fish marked and recaptured at the smolt trap on Eagle Creek, March 26 through May 8, 2006. Trap was removed on May 8th because of vandalism resulting in high fish mortalities.
Species Caught Marked Recap Trap
Efficiency Estimated Migrants (95%) CI Morts
Hatchery Steelhead 3052 76 13 17% 17,848 1,116 1095
Hatchery
Coho 6143 149 44 30% 20,824 1,609 13,834
O.mykiss (<100 mm) 67 34 5 15% 466 34 45
O.mykiss
(>100 mm) 22 7 0 ─ ─ ─ 3
Wild coho (< 50 mm) 19 0 0
─
─
─ 2
Wild coho
(51-99 mm) 4 1 0
─
─
─ 5
Wild coho (>100 mm) 13 8 0
─
─
─ 1
Wild
Steelhead (<150 mm) 1 0 0
─
─
─ 0
Wild
Steelhead ( >150 mm) 8 5 0
─
─
─ 3
Cutthroat
trout 2 1 0
─
─
─ 1
Longnose
Dace 4 0 0
─
─
─ 2
Lamprey 5 0 0 ─ ─ ─ 0
18
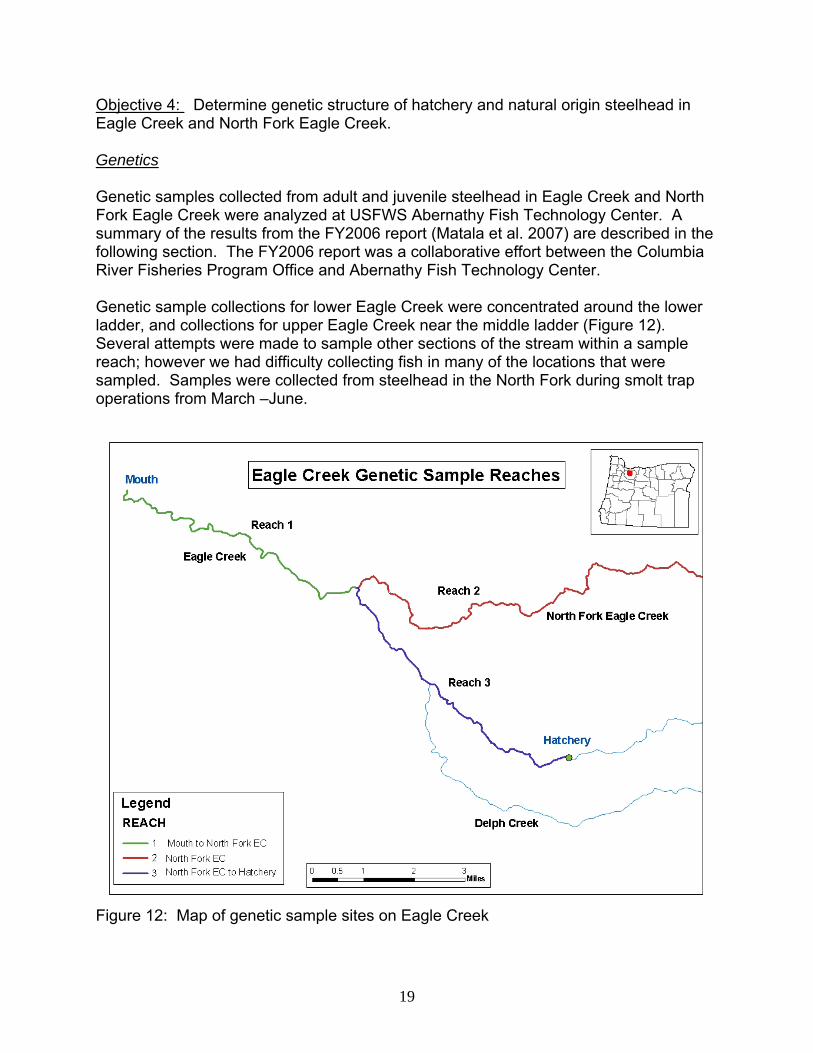
Objective 4: Determine genetic structure of hatchery and natural origin steelhead in Eagle Creek and North Fork Eagle Creek. Genetics Genetic samples collected from adult and juvenile steelhead in Eagle Creek and North Fork Eagle Creek were analyzed at USFWS Abernathy Fish Technology Center. A summary of the results from the FY2006 report (Matala et al. 2007) are described in the following section. The FY2006 report was a collaborative effort between the Columbia River Fisheries Program Office and Abernathy Fish Technology Center. Genetic sample collections for lower Eagle Creek were concentrated around the lower ladder, and collections for upper Eagle Creek near the middle ladder (Figure 12). Several attempts were made to sample other sections of the stream within a sample reach; however we had difficulty collecting fish in many of the locations that were sampled. Samples were collected from steelhead in the North Fork during smolt trap operations from March –June.
Figure 12: Map of genetic sample sites on Eagle Creek
19

For detailed information on genetic techniques and results see Matala et al. (2007). We provide the following snapshot of information from that report. ECNFH smolts (hatchery origin) and adult wild fish collected at the lower ladder (natural origin) were used as baseline groups to compare with unknown sample groups collected from upper and lower Eagle Creek and North Fork Eagle Creek (Table 7). Matala et al. (2007) calculated the probability of an individual belonging to either the natural origin or hatchery origin group using genotypic similarity assignments (Figure 13), and an assignment test assessment was used to determine the power of a particular assignment. The majority of genetic samples collected from juvenile fish in upper and lower Eagle Cr. assigned to the natural origin baseline population (79.3% and 80.9% for lower and upper Eagle Cr. respectively). 82.8% of North Fork Eagle Cr. fish assigned to the natural origin population. The proportion of hatchery assignments for naturally produced juvenile fish was small for all groups. Interesting to note that the largest proportion of hatchery assignments was in North Fork Eagle Cr.(14.5%). Table 7: The number of genetic samples collected for each sample reach in 2006. Unknown sample groups included juveniles from the North Fork and upper and lower Eagle Creek. Natural origin adults collected at the lower ladder and juveniles collected from ECNFH were used as baseline groups. Location
Life History Stage
Target #
Actual # sampled
North Fork (Reach 2)
Smolt (NOR)
50
43(smolt) 31(juvenile)
North Fork to Hatchery (Upper EC, Reach 3)
Juvenile (NOR)
50
25(smolt) 72(juvenile)
Mouth to North Fork (Lower EC, Reach 1)
Juvenile (NOR)
50
12(smolt) 17 (juvenile)
Lower Ladder
Adults (NOR)
50
29
Eagle Creek NFH
Juvenile (HOR)
50
50
.
20

21
0.00
2.00
4.00
6.00
8.00
10.00
12.00
14.00
16.00
18.00
0.00 2.00 4.00 6.00 8.00 10.00 12.00 14.00 16.00 18.00 20.00
Natural Origin
EC
NFH
Ori
gin
ECNFH
NOR adults
Lower E.C.
N. Fork E.C.
Upper E.C.
Figure 13: Population assignment plot: coordinates are assignment likelihood values (log-transformed) generated in the program WHICHRUN for all 2006 samples, where the dotted line delineates equal likelihood of NOR or HAT origin (Figure taken from Matala et al 2007).
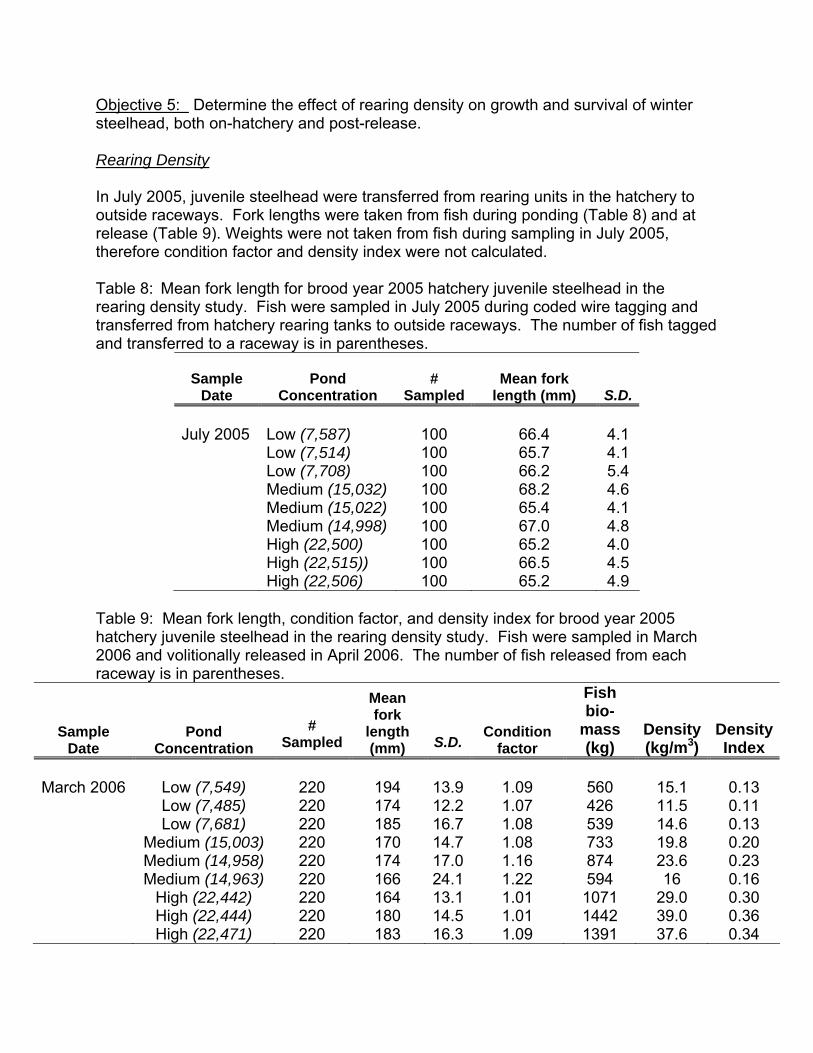
Objective 5: Determine the effect of rearing density on growth and survival of winter steelhead, both on-hatchery and post-release. Rearing Density In July 2005, juvenile steelhead were transferred from rearing units in the hatchery to outside raceways. Fork lengths were taken from fish during ponding (Table 8) and at release (Table 9). Weights were not taken from fish during sampling in July 2005, therefore condition factor and density index were not calculated. Table 8: Mean fork length for brood year 2005 hatchery juvenile steelhead in the rearing density study. Fish were sampled in July 2005 during coded wire tagging and transferred from hatchery rearing tanks to outside raceways. The number of fish tagged and transferred to a raceway is in parentheses.
Sample Date
Pond Concentration
#
SampledMean fork
length (mm)
S.D.
July 2005 Low (7,587)
100 66.4
4.1 Low (7,514) 100 65.7 4.1 Low (7,708) 100 66.2 5.4 Medium (15,032) 100 68.2 4.6 Medium (15,022) 100 65.4 4.1 Medium (14,998) 100 67.0 4.8 High (22,500) 100 65.2 4.0 High (22,515)) 100 66.5 4.5 High (22,506) 100 65.2 4.9
Table 9: Mean fork length, condition factor, and density index for brood year 2005 hatchery juvenile steelhead in the rearing density study. Fish were sampled in March 2006 and volitionally released in April 2006. The number of fish released from each raceway is in parentheses.
Sample Date
Pond Concentration
# Sampled
Mean fork
length (mm)
S.D. Condition
factor
Fish bio-
mass (kg)
Density(kg/m3)
Density Index
March 2006 Low (7,549)
220 194
13.9 1.09 560
15.1
0.13
Low (7,485) 220 174 12.2 1.07 426 11.5 0.11 Low (7,681) 220 185 16.7 1.08 539 14.6 0.13 Medium (15,003) 220 170 14.7 1.08 733 19.8 0.20 Medium (14,958) 220 174 17.0 1.16 874 23.6 0.23 Medium (14,963) 220 166 24.1 1.22 594 16 0.16 High (22,442) 220 164 13.1 1.01 1071 29.0 0.30 High (22,444) 220 180 14.5 1.01 1442 39.0 0.36 High (22,471) 220 183 16.3 1.09 1391 37.6 0.34

Steelhead from the low, medium, and high density raceway groups were pooled together and a one way ANOVA was used to compare fork lengths between density groups. No significant difference in fork length between density groups was detected during tagging or at release in 2006 (Figures 14 and 15).
Figure 14: Mean fork lengths of juvenile winter steelhead (broodyear 2005) sampled in July 2005 during coded wire tagging at Eagle Creek National Fish Hatchery. No significant difference in fork lengths between density groups was detected. Error bars representstandard deviation.
Density Group
Fork
Len
gth
(mm
)
40
50
60
70
80
90
Low n= 300
High n= 300
Medium n= 300
Figure 15: Mean fork lengths of juvenile winter steelhead (broodyear 2005) sampled in March 2006 prior to volitional release from Eagle CreekNational Fish Hatchery. No significant difference infork length was detected between density groups. Error bars represent standard deviation.
Density Group
Fork
Len
gth
(mm
)
120
140
160
180
200
220
240
Lown= 672
Medium n= 661
High n= 664
23

Acknowledgements We would like to thank the field and office staff at Eagle Creek National Fish Hatchery, especially Doug Dysart, Steve Turner, and Scott Profitt, for their help with hatchery and field support during this study. We would also like to thank Bill Ardren and Andrew Matala at Abernathy Fish Technology Center, Ken Lujan with USFWS Lower Columbia River Fish Health Center, Burke Strobel and field staff with the U.S. Forest Service, for their work with assisting in the collection and evaluation of genetic samples in Eagle Creek. We would also like to thank Steve Pastor at the USFWS Columbia River Fisheries Program Office who provided database management support for hatchery records, and the CRFPO marking crew for supervision of marking and tagging of hatchery steelhead and assistance with adult bio-sampling and aging scales.
24

25
Literature Cited Hoffman, T., Hand, D., Engle, R., Olson, D. 2003. Distribution and migration behavior of juvenile hatchery coho salmon and steelhead trout in Eagle Creek and Clackamas River, Oregon. FY 2003 summary report by the U.S. Fish and Wildlife Service, Columbia River Fisheries Program Office, Vancouver, WA. Hoffman, T., Olson, D. 2004. Distribution and migration timing of juvenile hatchery steelhead trout in Eagle Creek, Oregon. FY 2004 summary report by the U.S. Fish and Wildlife Service, Columbia River Fisheries Program Office, Vancouver, WA. Kavanagh, M., D. E. Olson, W. R. Brignon, T. Hoffman, D. Dysart, and S. Turner. 2006. Eagle Creek ecological interactions: distribution and migration of hatchery and wild steelhead and coho. United States Fish and Wildlife Service Progress Report FY 2005. Matala, A.P., Ardren, W., Olson, D, Hoffman, T., Kavanagh, M., and B. Brignon2. 2005. Population assignment tests and genetic structure analysis reveal relative productivity between hatchery origin and natural origin steelhead trout within Eagle Creek, Or. FY 2005 summary report by the U.S. Fish and Wildlife Service, Abernathy Fish Technology Center1, Longview, WA. in cooperation with the Columbia River Fisheries Program Office2, Vancouver, WA. Matala, A.P., Ardren, W1., Olson, D,. Kavanagh, M., Brignon, B and J. Hogle2. 2007. Genetic structure analysis and population assignment tests to determine differential natural productivity among hatchery-origin and natural-origin steelhead trout (Oncorhynchus mykiss) in Eagle Creek, OR. FY 2006 summary report by the U.S. Fish and Wildlife Service, Abernathy Fish Technology Center1, Longview, WA. in cooperation with the Columbia River Fisheries Program Office2, Vancouver, WA.
Piper, R.G., I.B. McElwain, L.E. Orme, J.P. McCraren, L.G. Fowler, and J.R. Leonard. 1982. Fish Hatchery Management. U.S. Fish and Wildlife Service, Washington, D.C.