
E7500 PMS MTS Rev12D - Dynamic Positioning...
24
P Dynamic Positioning Committee Marine Technology Society DYNAMIC POSITIONING CONFERENCE September 17-18, 2002 Power Session ENSCO 7500 Power Management System Design, Functionality and Testing Steve Savoy ENSCO International Inc. (Dallas, Texas)
Transcript of E7500 PMS MTS Rev12D - Dynamic Positioning...

DP Conference, Houston September 17-18, 2002 Page 18 Rev. 12A
Return to Session Directory
PDynamic Positioning Committee
Marine Technology Society
DYNAMIC POSITIONING CONFERENCE September 17-18, 2002
Power Session
ENSCO 7500 Power Management System
Design, Functionality and Testing
Steve Savoy ENSCO International Inc. (Dallas, Texas)

Steve Savoy, ENSCO International Inc. ENSCO 7500 Power Management System ____________________________________________________________________________________
____________________________________________________________________________________ DP Conference, Houston September 17-18, 2002 Page 1
Rev. 12A Return to Session Directory
Abstract The E7500 is a DPS-2 class semi-submersible. The unit has eight (8) 3000 hp thrusters for positioning and is powered by six EMD 710-G7B engines with Baylor S855YNV generators. Each generator produces 3580 kW/5114 kVA at 4160 volts with 0.7 pf for a total power plant capacity of 21.5 mW. The generators are connected to two main buses with an integral tie circuit breaker between them. The Power Management system functions are implemented in three independent control systems. They are the Dynamic Positioning, drilling DC power and the Data Management systems. In this design, each system’s power management functions work independently and have dedicated sensor inputs from the main electrical buses. The systems calculate the total power available and the total load. If the total system load exceeds pre-defined limits, they will reduce power to their respective loads. The systems will also reduce loading if any individual generator exceeds a pre-set limit. This design allows the system not to exceed the capacity of any one generator even during a reverse power situation on an individual generator or failure of a sensor component. In the event of an overload condition, the Dynamic Position and drilling DC power systems will cut back power at pre-defined limits thus reducing the bus load. The Data Management System will start additional engines to increase the main bus capacity. The systems were tested for all generator configurations. The results of this testing are presented and discussed. The issues of compliance with DPS-2, FMEA considerations and problems that were encountered during the operational phase are discussed. The combinations of the functions within this total system make it unique with respect to other similar ones. First, each system is totally independent even to the sensor hardware level. Second, the systems not only reduce power based on the total load calculations, but also on the load of an individual generator. The system response during overload conditions is fast enough to allow operation under any abnormal situation without overloading the main power distribution.

Steve Savoy, ENSCO International Inc. ENSCO 7500 Power Management System ____________________________________________________________________________________
____________________________________________________________________________________ DP Conference, Houston September 17-18, 2002 Page 2
Rev. 12A Return to Session Directory
I. ELECTRICAL SYSTEM DESCRIPTION
Medium Voltage Distribution The ENSCO 7500 is a DPS-2 classed semi-submersible drilling unit. The unit has eight (8) three thousand horsepower azimuthing thrusters for dynamic positioning. The main power plant has six (6) EMD 710-G7B turbocharged engines with Baylor S855YNV generators. Each generator produces 3580 kW/5114 kVA at 4160 volts with a 0.7 power factor. The engine/generator sets are rated for intermittent operation to 115%(4117 kW/5881 kVA). There are two engines rooms each containing three engine/generator sets. Each engine room has separate systems for auxiliary support. This includes fuel oil, low pressure air and cooling water. These systems can be cross connected. The engine cooling water system can be supplied from the raw water service system. The two groups of three generators are connected to two main medium voltage switchgear bus sections. The sections are connected by a bus tie circuit breaker. The medium voltage switchgear is housed in an area forward of the engine rooms. A schematic diagram of the system is shown in Figure 1.

Steve Savoy, ENSCO International Inc. ENSCO 7500 Power Management System ____________________________________________________________________________________
____________________________________________________________________________________ DP Conference, Houston September 17-18, 2002 Page 3
Rev. 12A Return to Session Directory
EmergencyGenerator
Figure 1. Main Electrical System Mimic
Low Voltage Distribution The main bus supplies power to two 4160/480v transformers for ship’s service power. Four 4160/600v transformers supply power to drilling SCR units. The low voltage distribution system consists of two main buses, “A” and “B”, that are fed from the main medium voltage transformers. The two buses are connected by a tie circuit breaker that is interlocked with the transformer feeder breakers. There are two distribution units located port and starboard of the main switchgear. Bus “A” is connected to the Emergency Bus located at the port forward main deck area of the rig. The distribution system is shown is Figure 1. The Emergency Bus has a 1000 kW generator. In the event of a main system power failure, the generator will automatically start, providing power to vital equipment. Emergency power can also be used to back feed to the main bus system. The low voltage distribution buses provide power to all rig auxiliary and lighting systems.

Steve Savoy, ENSCO International Inc. ENSCO 7500 Power Management System ____________________________________________________________________________________
____________________________________________________________________________________ DP Conference, Houston September 17-18, 2002 Page 4
Rev. 12A Return to Session Directory
Feeder circuit breakers supply power to eight 4160/600 vac transformers for the thruster SCR units. The transformers and SCRs are located in the column areas just below the main deck level.
Main Generator and Engine Control Configuration
Each engine/generator has independent controls and power supply. The Switchgear cubicle contains a GE Multilin SR489 generator management relay, Woodward Digital Synchronizer Load Control Module, GE 90-30 PLC with I/O interfaces, power transducers and front panel control switches with alarm displays. The engines have an EMDEC electronic control unit that provides the closed loop speed control, injector firing, start/stop functions and alarms. Each generator’s switchgear equipment and engine are supplied with 24 and 48 vdc control power from a dedicated battery/charger. The block diagram in Figure 2 shows the interconnection of the components. The engine can be started and put online with front panel manual controls. An “Auto” mode function allows the DMS to control the engine. The switchgear PLC controls the engine functions. The DSLC controls the engine/generator synchronization and load sharing.
Generator Switchgear Cubicle
Power Transducers
DSLC
PLC
DMS UPS 5DMS UPS 6
Battery/Charger 24/48 vdc
EMDEC Engine Control
DMS RPU 5DMS RPU 6
Figure 2: Engine and Generator Control Equipment Block Diagram
Engine/Generator Performance The EMD 20-710G engines are capable of withstanding full step loads with a drop of only 15 rpm for 0.8 seconds. This performance has been proven in factory load testing. This gives the system very good response to sudden load requirements. In addition to this performance, the engine/generators can run up to the rated 115% overload with the same response. The engines on the rig were load tested with the same types of loads as the factory test. .
II. CONTROL SYSTEMS GENERAL DESCRIPTION
Dynamic Positioning System
The Dynamic Positioning (DP) system is a dual redundant Nautronix ASK 4002 unit. The block diagram in Figure 3 shows the interconnection of the system units. The two main operator control consoles (ASK1 & ASK2) contain the control processors, operator keyboard and display units. The DP system can

Steve Savoy, ENSCO International Inc. ENSCO 7500 Power Management System ____________________________________________________________________________________
____________________________________________________________________________________ DP Conference, Houston September 17-18, 2002 Page 5
Rev. 12A Return to Session Directory
control up to eight 3000 hp thruster. The maximum thruster load would be 17.9 MW at full power on all eight units. DP commands azimuth and power to each online thruster that keep the rig on location. Normally, the system would be using four thrusters. The control consoles are located in the Barge Control Room (BCR). There are three Signal Processing Units (SPU1, SPU2 &SPU3) located in the Barge Control Room (BCR) at the forward part of the rig. These units process external I/O from the position sensor units, gyros, motion reference units and wind sensors. Each individual unit has an independent communication link to the main control process computers. There are two Signal Processing Units (SPU5 & SPU6) located in the Switchgear Room for power management signal processing functions. The system receives power management data from two redundant I/O interface boxes located in the switchgear room.
Sensor Input
Engine Room 2 SPU
Hwy 1
GEN2GEN1 GEN3
SPU 1
ASK 1
Hwy 1
Sensor Input
Hwy 2
SPU 2
GEN6GEN5GEN4
Hwy 2
Engine Room 2 SPU
Sensor Input
SPU 3
Hwy 3 Hwy 4
ASK 2
Barge Control Room
Switchgear Room
Figure 3: Dynamic Positioning System Interconnection Diagram
Data Management System
The Data Management System (DMS) is a PLC based control system configured in a distributed loop topology. A system block diagram is shown in Figure 4. The HMI units are the operator display and control consoles. These units communicate with PLCs located in the Remote Processor Units(RPU) via dual redundant fiber optics links. The two fiber optics transmission links are connected to fiber optics modems with self-healing features. The system will communicate with up to three faults in the system. The two Remote Processing Units located in the Switchgear Room provide interfaces to the switchgear for power management parameters and engine control functions. RPUs 5 and 6 are dual redundant hot back-up GE 90-70 PLCs. Both units receive data from all engines and generators. One serves as the master and the other the backup. In the event of a PLC failure, the watchdog circuitry will automatically transfer control to the backup unit. All power management data collection and logical control reside in

Steve Savoy, ENSCO International Inc. ENSCO 7500 Power Management System ____________________________________________________________________________________
____________________________________________________________________________________ DP Conference, Houston September 17-18, 2002 Page 6
Rev. 12A Return to Session Directory
the two redundant PLCs. In the event of an overload condition, the system will start all available engine/generators. The system reads the generator status and analog values about 100 times a second. The data is processes at a much higher rate than is required for the system response. All of the analog inputs are from dedicated switchgear transducers. All data is time stamped at processing time in the PLC.
Figure 4: Data Management System Interconnection Diagram
Drilling SCR DC Power System
The drilling SCR DC power system uses a GE 90-30 PLC to control twelve (12) DC power supplies for the drilling motors. A block diagram of the system is shown in Figure 5. The system processes data from the dedicated generator switchgear transducers. The Drilling SCR system reduces power to the drilling DC motors so that the power demand is never greater than the available bus capacity.
Each system has independent inputs from the main electrical bus. They utilize the power information from the main bus in order to determine safe operating power conditions.

Steve Savoy, ENSCO International Inc. ENSCO 7500 Power Management System ____________________________________________________________________________________
____________________________________________________________________________________ DP Conference, Houston September 17-18, 2002 Page 7
Rev. 12A Return to Session Directory
GEN3GEN1 GEN2 GEN5GEN4 GEN6
SCR A A1,A2 A3,A4
SCR B B1,B2 B3,B4
SCR C C1,C2 C3,C4
SCR D D1,D2 D3,D4
Figure 5: Drilling SCR System Interconnection Diagram
System’s Generator Input Signals
Each control system has independent transducers for generator power data. The block diagram in Figure 6 shows the switchgear transducer inputs to the systems. There are two analog transducers for each system, a kilowatt and a kilovoltampere. Each system independently monitors the main generator circuit breaker opened/closed status.

Steve Savoy, ENSCO International Inc. ENSCO 7500 Power Management System ____________________________________________________________________________________
____________________________________________________________________________________ DP Conference, Houston September 17-18, 2002 Page 8
Rev. 12A Return to Session Directory
ASK 1 ASK 2
KWTransducer
KVarTransducer
DPRPU 5 RPU 6
KWTransducer
KVarTransducer
KWTransducer
KVarTransducer
DMS SCR
GeneratorPTs/CTs
Main Distribution Bus
Generator Circuit Breaker
Three Phase Injection Test Unit
Figure 6: Generator Power Management Transducer Interconnection The systems have the following input data from each generator:
Generator “x” – kW analog (4-20 mA = 0-4296 kW) Generator “x” – kVar analog (4-20 mA = 0-4381 kVar)
Generator “x” – Opened digital Generator “x” - Cosed digital
The analog signals are scaled and calibrated for 120% of full generator load. This allows the systems to display the full range of operational data. The transducers were calibrated with a three-phase injection test unit. The results of the calibration are shown in Appendix 1. The scale values were injected into the transducers and the output signals to the systems were verified as correct. The calibration tables show the actual calibration values. The DP and DMS systems have all data inputs to the their dual redundant processors. The Drilling SCR system has one set of inputs to the single PLC controller. The DP system has signal interfaces for each generator’s data to both SPU4 and SPU5. Either unit can fail and the other will still have the necessary data for the system to function. The system does comparison and bound checks on the data. If any values are out of bounds or the values do not compare, a system alarm is generated. Additionally, the invalid value is not used in any calculations. All system data is processed every 550 milliseconds.

Steve Savoy, ENSCO International Inc. ENSCO 7500 Power Management System ____________________________________________________________________________________
____________________________________________________________________________________ DP Conference, Houston September 17-18, 2002 Page 9
Rev. 12A Return to Session Directory
The DMS has data inputs to both dual redundant processors – RPU 5 and RPU 6. The processors scale the input data and calculate all parameters. The master processor controls all engine and power functions. The backup processor calculates parameters concurrently.
DP Power Management Functional Description
System Parameters
The two ASK controllers process input data from the switchgear transducers then derive other variables for power management functions. Utilizing the generator kW and kVar data, the system calculates the kVA. The circuit breaker status determines whether the generator is online or offline. This data allows the calculation of the total system generating capacity and the total system load. The DP system calculates the thruster power loading and the drilling/hotel load. All system parameters are calculated for both kilowatt and kilovoltamp values. All of the power management parameters are displayed on the system “Power Pages” as mimic screens. The following parameters are used by the DP system for power management functions. On-Line Capacity The sum of the capacity of all online generators. If the
generator circuit breaker is closed, then it’s capacity is added to the variable.
Hotel/Drilling Load The Hotel/Drilling is a variable that is calculated as the difference between the total generator power feedback less the total thruster power feedback.
Non-Sheddable Load The maximum value of either the Hotel/Drill load or the system Reserve Kilowatt whichever is greater.
Upper Power Limit (UPL) The UPL is the On-Line Capacity minus the Non-Sheddable load. This value is the maximum amount of power that is available for thruster use.
Operator Parameter Controls
The system has parameters that the DP operator can control via the console keyboard. These parameters allow for the control of power management functions. Reserve Kilowatt An input value that provides a minimum reserve amount of
the On-Line Capacity. This value is normally set above the Hotel/Drilling load. If the value is lower than the Hotel/Drilling load, the system will use the actual Hotel/Drilling load to calculate the Upper Power Limit.
Lower Power Limit (LPL) A thirty (30) second average of thruster power required times the “Power Lower Limit Margin”
Lower Power Limit Margin An operator input variable that determines the level of the Lower Power Limit above the average thruster power. The value is input as a percentage.
Active (Operating) Power Limit (APL)
The power limit that is used for limiting thruster loading. The APL can be set to either the UPL or LPL depending on the status of the Power Limit Sustain function. Thruster power limiting takes effect at the APL and it will not exceed the limit.

Steve Savoy, ENSCO International Inc. ENSCO 7500 Power Management System ____________________________________________________________________________________
____________________________________________________________________________________ DP Conference, Houston September 17-18, 2002 Page 10
Rev. 12A Return to Session Directory
Power Limit Sustain Function An operator console pushbutton controls this function. When the function is enabled, thruster power is held to the LPL. If the function is disabled, thruster power will be limited by the LPL for ten (10) seconds. If the thruster power demand remains at the LPL of the time period, it will be released to the UPL. Thruster power demand can then rise to the UPL level if necessary. This function tends to smooth out the thruster power requirements. This also allows the operator a time period to access the power requirements and the system situation.
Thruster Bias A variable power value that adds additional power consumption to the system by running two thrusters opposing.
These system functions allow an experienced DP operator to change parameters for any operational situation, e.g., severe environment, damage or critical operations. This requires a high degree of technical understanding of the total power system. A large majority of DP problems are power related. By properly using the power limit sustain function the risk of a power drive off can be eliminated.
Software Description
The DP software program has a single thread execution. The system reads the power parameters and verifies parameter bounds. The derived variables are calculated. The Thruster Allocation Logic (TAL) determines the thrust requirements for positioning. The power management module determines if the required power is available. If the calculated requirements are greater than the available power, it is reduced so that the APL is not exceeded. The system also determines if any single generator load is greater than 100%. It also compares the generator loads so that a generator that is just put online is not considered in the full capacity calculation. If any of these conditions are true, thruster power is reduced so that no generator will be overloaded. Once these conditions are met, the TAL again re-calculates thruster commands. In a power reduction situation priority is give to heading control then position.
The graph in Figure 7 shows the operation of the power parameters. Before the five minute time the thruster load is less than the Lower Power Limit. This would be the normal operational situation. After that time, the thruster power increases due to the system’s required thrust commands. At this time the APL is equal to the LPL. The thruster load can rise to the LPL where it is restrained. If the increase thruster requirement remains past the software timeout period, the APL is released to the UPL allowing the thrust power to rise as required.
If the power limit sustain functions were enabled, the thrust power would be limited to the LPL. This situation would remain as long as the operation has the function enabled. This would allow the operator time to access the situation before the thrusters ramp up to the UPL.

Steve Savoy, ENSCO International Inc. ENSCO 7500 Power Management System ____________________________________________________________________________________
____________________________________________________________________________________ DP Conference, Houston September 17-18, 2002 Page 11
Rev. 12A Return to Session Directory
0.36 MW
APL Releases To UPL After Timeout
Thruster Load
Time (min.)
Drill/Hotel Load
Thruster Load Reaches LPL
Total Capacity - Three Generators (100%)
Reserve kW
0.72 MW
10.7 MW
LPL
UPL
APL
APL
Figure 7: Dynamic Positioning System Power Management Parameters
DMS Power Management Functional Description
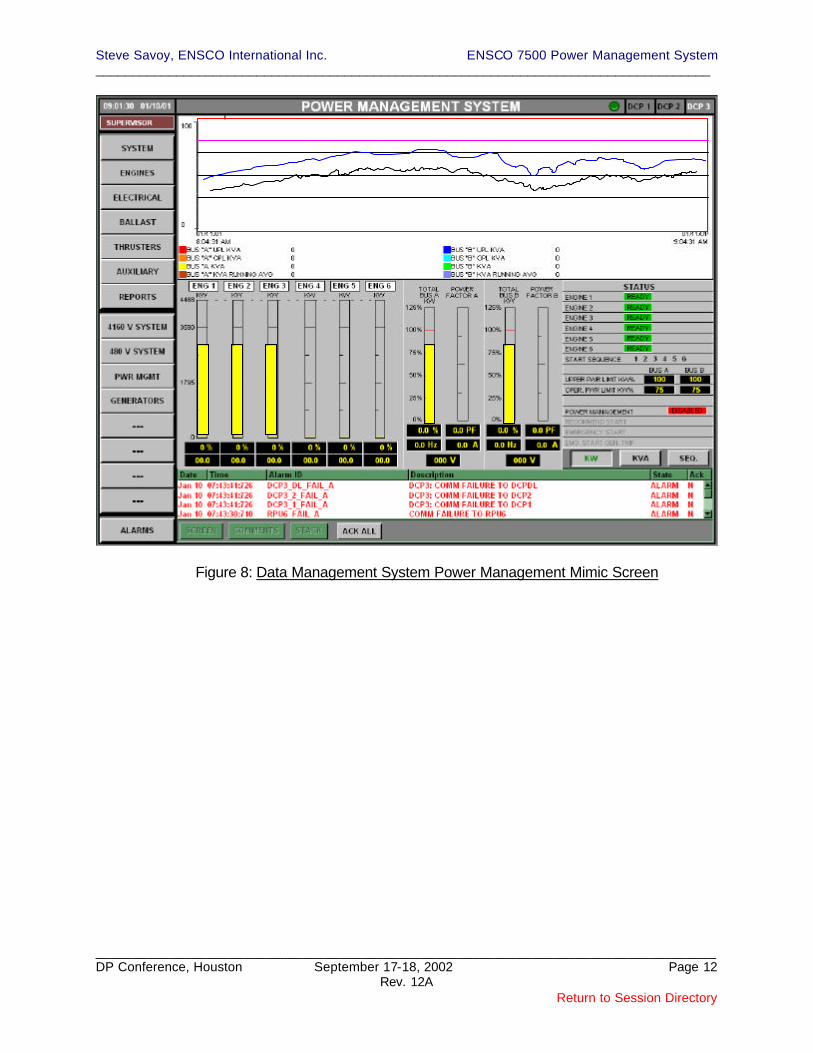
The operator can enable or disable the power management functions via the control consoles. The system reads and calculates power management limits utilizing the generator analog and digital data. Both PLCs calculate the parameters independently. The parameters are calculated for both kW and kVA. The operator sets the Upper Power Limit on the control console. This is normally set to 90%-95% of generating capacity. Once the main bus load exceeds the kW or kVA UPL, all available engines are emergency started. The switchgear control then automatically synchronizes the generator and closes the main circuit breaker. An average power that is 120% of the load is calculated. If the bus load exceeds this limit an alarm is generated. This alerts the operator of a sudden change in power requirements. All data and control functions are displayed on control console’s mimic screens. An example of the control mimic screen is shown in Figure 8. All online generator’s power levels are displayed by the bar graphs shown. The total bus power is also displayed. The display can be changed between kW and kVA. A trend graph in the top portion of the mimic displays the real time bus power and the calculated limits. The right portion shows the status of the engine/generators and the settings of the limits.
Steve Savoy, ENSCO International Inc. ENSCO 7500 Power Management System ____________________________________________________________________________________
____________________________________________________________________________________ DP Conference, Houston September 17-18, 2002 Page 12
Rev. 12A Return to Session Directory
Figure 8: Data Management System Power Management Mimic Screen

Steve Savoy, ENSCO International Inc. ENSCO 7500 Power Management System ____________________________________________________________________________________
____________________________________________________________________________________ DP Conference, Houston September 17-18, 2002 Page 13
Rev. 12A Return to Session Directory
Drilling SCR System Description
The PLC software calculates the Online Capacity utilizing the circuit breaker closed digital inputs. The total load on the generators is determined from the transducer input. It calculates the Upper Power Limit as 85% of the Online Capacity. This is a fixed value embedded within the program. The logic will reduce the throttle signals to all operating DC motors as long as the total generator load is greater than the UPL. The throttle can be reduced to zero.
Throttle SignalReduce Throttle To All Motors
Time
3580kW
7160kW
UPL (85%)
Online Capacity
Figure 9: Drilling SCR System Power Management Parameters

Steve Savoy, ENSCO International Inc. ENSCO 7500 Power Management System ____________________________________________________________________________________
____________________________________________________________________________________ DP Conference, Houston September 17-18, 2002 Page 14
Rev. 12A Return to Session Directory
III. OPERATIONAL TESTS
Test Data
The test data used in the following sections was recorded on a Data Logger system. The DMS data is read from the individual RPUs via a network connection. The ASK data is read from each processor, ASK 1 and ASK 2, by serial data connections. The data is transferred to an SQL database. The database is written to a backup tape for mass storage. The DMS power data has a one second scan interval. The ASK data has a 3.5 second scan interval. During the testing the log cycle time on the ASK system was not reduced to the one second time period. This causes the level effect on some of the traces.
Reverse Power Tests
Three generators were put online with normal thruster loading. The fuel oil supply line valve was closed to the one engine. The engine looses generating power and the circuit breaker trips on reverse power. The circuit breakers were set to trip at –200 watts reverse power with a two (2) second delay time. This test is not recommended for all engines since the loss of fuel oil could damage the injectors. These tests show that in a fuel oil starvation situation, it may take up to six (6) seconds before the reverse power protective relay function opens the main circuit breaker. The graphs in Figure 10 show the times on different engines. This means the power management system should react during the time that a generator is going into reverse power.

Steve Savoy, ENSCO International Inc. ENSCO 7500 Power Management System ____________________________________________________________________________________
____________________________________________________________________________________ DP Conference, Houston September 17-18, 2002 Page 15
Rev. 12A Return to Session Directory
Generator Reverse Power Tests
-1
-0.5
0
0.5
1
1.5
2
2.5
1 3 5 7 9 11 13 15 17 19 21 23
Time (sec.)
Po
wer
(MV
)
G1 G2 G3 G4 G5 G6
Figure 10: Reverse Power Time Tests
Thruster Phase Back Test
The purpose of the thruster phase back test is to verify that the DP system reduces thruster power requirements in an overload condition. Two generators are put online. At least one generator is ready for an emergency start. The rig is in full DP positioning control. Thruster “biasing” is used to increase the load so that the two generators have a total load of at least greater than 50% capacity. It is normally necessary to have two thrusters in manual mode running opposed so that the bus load can be increased to a high enough level for the test. A reverse power condition is forced on one generator by removing the fuel signal to the engine controller. The response of the remaining online engine is observed. The DP system should reduce the thruster power requirement. The graph in Figure 11 shows the results of a test. With this test Generators 1 and 5 are online with approximately 75% load. A reverse power condition is simulated on Generator 5. The load drops to zero and the circuit breaker trips. As generator load decreases, the load proportionally increases on Generator 2 to a maximum of 4200 kW, which is 115% of full capacity. Generator 1 reaches 100% of full load before generator 5 circuit breaker trips on reverse power. When Generator 1 reaches 100% of full capacity the DP system starts thrust power reduction. The Driller also saw a visual indication of power reduction to the drilling equipment motors. This data shows that the thrust power reduction occurs before the reverse power generator’s circuit breaker opens. If the power were not reduced at this time, the online generator’s circuit breaker would trip causing a blackout. Test were done using all engine/generators with the same results.

Steve Savoy, ENSCO International Inc. ENSCO 7500 Power Management System ____________________________________________________________________________________
____________________________________________________________________________________ DP Conference, Houston September 17-18, 2002 Page 16
Rev. 12A Return to Session Directory
ASK Thruster Phaseback 7 August
0
1000
2000
3000
4000
5000
6000
1 2 3 4 5 6 7 8 9 10 11 12 13 14 15 16Time (1 sec/div)
Po
wer
(kW
0
G1_kW G5_kWDrilling/Hotel Load Gen Bus LoadPower Limit Bus A Total Thruster CommandTotal Thruster % Feedback
Total Bus Load
Time between 100% capacity and circuit breaker opened (~ 1.5 sec.)
OPL
Total Thruster Command
G5 Reverse Power Trip
Generator 100% Capacity (3580 kW)
Upper Power Limit Online Capacity 7160 kW Reserve kW 2700 kW UPL 4460 kW
Figure 11: Dynamic Positioning System Phaseback Test Data
DMS Engine Emergency Start Test
The main electrical system is setup with two engines online. The graph in Figure 12 shows the test results. In this test Generators 1 & 2 are online. Engines 3 and 5 are ready for starting. Adding thruster bias power increases the system load. When the system load reaches the DMS Upper Power Limit of 5728 kW, Engine 3 is issued an Emergency Start command. The engine starts and the generator is online within 18 seconds. Engine 5 Emergency Starts as Generator 3 circuit breaker closes. It is online 18 seconds later. Both generators ramp-up to load share with Generators 1 and 2. The same test was done with all engine/generators. The time for the generator to come online varied from 12 to 24 seconds. The engines will start and ramp up to rated speed in approximately ten (10) seconds. The variable time for the circuit breaker to close is dependent on the synchronization of the generator to the bus.

____________________________________________________________________________________ DP Conference, Houston September 17-18, 2002 Page 17 Rev. 12A
Return to Session Directory
DMS Emergency Start Test 7 August 14:00
0
1000
2000
3000
4000
5000
6000
70001 4 7 10 13 16 19 22 25 28 31 34 37 40 43 46 49 52 55 58 61 64 67 70 73 76 79 82 85 88 91 94
Time (1 sec/div)
Po
wer
(kW
)
G1 kW G2 kW G3 kW G5 kW Total Load kW UPL kw
DMS Upper Power Limit (5728 kW)
Total Load Equal To UPL
18 sec. 18 sec.
Generator 3 Emergency Start
Generator 5Emergency Start
Figure 12: DMS Engine Emergency Start Test Data
Steve Savoy, ENSCO International Inc. ENSCO 7500 Power Management System ____________________________________________________________________________________
____________________________________________________________________________________ DP Conference, Houston September 17-18, 2002 Page 18 Rev. 12A
Return to Session Directory
IV. COMMISSIONING PROBLEMS
Transducer Calibration The switchgear power transducers (kW and kVAr) could not be adjusted to full scale values of 120% capacity. The units were tested with a three phase injection test instrument. The units could not be calibrated correctly. They also had incorrect output for power factors other than 0.7. Further testing found that there was a problem with the units design. The transducers had to be replaced with modified ones.
Software Calculations
The three-phase test unit was used to verify parameter scaling on the DP, DMS and Drilling SCR systems. One system was not calculating the kVA values correctly. The problem was traced to an incorrect calculation in the program logic.
System Scaling
The original scaling of power values was 0 – 100% of generator capacity. This scale could not display values up to the rated generator overload of 115%. The scaling was changed on all three systems. The scale was changed so that the full-scale power parameters are 0-120%. This allows the data display for rated overload operation.
Testing
The original sea trials testing did not sufficiently test all aspects of the power system. This caused problems later in the operation. Subsequent testing verified all calibrations and functions for all generator combinations. There is always pressure to complete construction and sea trials. It is important that system tests be completed before full operations commence. All scaling and calibrations, from the source to the display, should be checked. All combinations of operational conditions need to be tested and the results analyzed.
V. REGULATORY COMPLIANCE
Applicable Rules The rig complies with ABS Guide for Thrusters and Dynamic Positioning Systems DPS-2 Classification. Section 3.7 of the document applies to power systems. The DPS – 2 classification requires that the power system have the capability of withstanding a single fault bus failure so that sufficient power remains for positioning and auxiliary systems within the specified operating envelope.

Steve Savoy, ENSCO International Inc. ENSCO 7500 Power Management System ____________________________________________________________________________________
____________________________________________________________________________________ DP Conference, Houston September 17-18, 2002 Page 19
Rev. 12A Return to Session Directory
In this case, there are two buses for the main power distribution. A loss of one bus will allow the use of four (4) thrusters and all required auxiliary equipment for the thrusters and engines. The failure of an engine room would reduce the power generating capacity by half and reduce the operating envelope.

Steve Savoy, ENSCO International Inc. ENSCO 7500 Power Management System ____________________________________________________________________________________
____________________________________________________________________________________ DP Conference, Houston September 17-18, 2002 Page 20 Rev. 12A
Return to Session Directory
Power Management
Section 3.7.3 requires that a vessel with this class have a power management system. The system is “to ensure that sufficient power is available for essential operations.” This system meets the requirement. Thruster and Drilling SCR power is temporarily reduced during an overload condition. The system does not inhibit or load-shed auxiliary consumers. The amount of load that could be shed is minimal as compare to the plant as a whole. The following table gives the loads for the system. Bus “A” Capacity 10.74 MW Bus “A” Thruster Load (full power) 8.95 MW Bus “B” Capacity 10.74 MW Bus “B” Thruster Load (full power) 8.95 MW Emergency Bus Load 0.40 MW (approximately) Hotel Load 0.75 MW (approximately) Drilling Load (Three mud pumps, top drive @ 80%)
4.7 MW
Table 1: Electrical System Loads
Uninterruptable Power Supplies
The Rules require that “a UPS is to be provided for the control…systems”. This system complies with the rules since each engine/generator has its individual charger/battery DC power supply. The DP and DMS systems are supplied with individual UPS supplies. These dedicated supplies are shown in Figure 2. The ASK system has an individual UPS for ASK 1 console/processor, SPU 1, part of SPU 3, SPU 4 and one each of the two sensors. A second UPS supplies the second system as well as SPU 5. The DMS system has individua l UPSs supplying the redundant processors and HMI consoles. One dedicated UPS supplies RPU 5 and another one for RPU 6. Each HMI control console has its own dedicated UPS. The same applies to the network communications equipment. In the event of a single power failure, the system will communicate via the second network. The whole system is tolerant to any single power supply failure.
Failure Modes and Effects Analysis Considerations The system was designed with consideration of the effects of equipment failures. The use of dedicated power supplies ensures that a single failure will only affect one redundant part of any system. Major failures would be the loss of an engine room or one main distribution bus. The system has sufficient power available after a single major failure to hold position with most operational conditions. Normally, the rig operates with three engines online. In the event of a bus failure, the power management system is capable of reducing the power requirement until additional generators can be placed online.
Steve Savoy, ENSCO International Inc. ENSCO 7500 Power Management System ____________________________________________________________________________________
____________________________________________________________________________________ DP Conference, Houston September 17-18, 2002 Page 21 Rev. 12A
Return to Session Directory
VI. CONCLUSION This system works well for this particular unit. The types of techniques used in this application can be applied to other situations. Each unit’s equipment is different so the implementation of power management principles will be different. Even with these differences, the following conclusions will help in designing a robust system that will react fast enough to prevent a catastrophic power system failure.
A) The reverse power time needs to be considered in the power management system design. If only the generator circuit breaker status is used to determine available power, it can lead to a problem with long reverse power times.
B) The load of each generator needs to be considered individually in relation to other generators. This keeps any single generator from overloading regardless of the loading on the other units. The thruster and drilling equipment power reduction needs to occur when any generator reaches capacity. This will start the action before the generator circuit breaker opens.
C) Data latency should be considered since reaction times for power reduction need to occur before generator overload trips the circuit breaker.
D) Verify the calibration of all transducers and associated instrumentation with an independent test unit. A three-phase test unit should provide the calibration inputs that simulate the bus PT/CT signals. The scaling and outputs should be checked to each system. All calculations should be verified on each system. Don’t trust factory calibration.
E) Design testing procedures for each generator and operational condition. Verify the test results.

Steve Savoy, ENSCO International Inc. ENSCO 7500 Power Management System ____________________________________________________________________________________
____________________________________________________________________________________ DP Conference, Houston September 17-18, 2002 Page 22 Rev. 12A
Return to Session Directory
Appendix 1. Generator Transducer Calibration Data

Steve Savoy, ENSCO International Inc. ENSCO 7500 Power Management System ____________________________________________________________________________________
____________________________________________________________________________________ DP Conference, Houston September 17-18, 2002 Page 23 Rev. 12A
Return to Session Directory