![[15 May 97] Landfill Closure Study, Fort Richardson ... · 11/21/1997 · 5 Dee 97 . FTR 0031322 LANDFILL CLOSURE STUDY FORT RICHARDSON, ALASKA May 1997 PREPARED BY THE ALASKA DISTRICT](https://static.fdocuments.in/doc/165x107/604a18309eb51a5c0b01a7c4/15-may-97-landfill-closure-study-fort-richardson-11211997-5-dee-97-.jpg)
E6_Yanley Closure Plan February 2012 v2 - … · Yanley Closed Landfill Site Landfill Aftercare...
171
The Environmental Permitting (England and Wales) Regulations 2010 Permit BT 7272IW (Variation AP3937LL) Yanley Closed Landfill Site Landfill Aftercare Closure Plan Prepared by: Environment Team Viridor Harrison House Blackbrook Park Avenue Taunton TA1 2PX Version: 2.0 Issue Date: 29 th February 2012
-
Upload
nguyentruc -
Category
Documents
-
view
216 -
download
0
Transcript of E6_Yanley Closure Plan February 2012 v2 - … · Yanley Closed Landfill Site Landfill Aftercare...

The Environmental Permitting (England and Wales) Regulations 2010
Permit BT 7272IW (Variation AP3937LL) Yanley Closed Landfill Site
Landfill Aftercare Closure Plan
Prepared by: Environment Team
Viridor Harrison House
Blackbrook Park Avenue Taunton TA1 2PX
Version: 2.0Issue Date: 29th February 2012

Yanley Closed Landfill February 2012 Landfill Aftercare Closure Plan
Ref: Yanley_CP_2012 Page 2
EXECUTIVE SUMMARY Following cessation of waste at Yanley Landfill in 2009, Viridor Waste Management (Viridor) has duly prepared a Closure Plan for the site to comply with the requirements of the Environmental Permitting Regulations 2010 Regulation 35d Schedule 10 Paragraph 10(1). Regulatory Instruments Yanley Landfill has an Environmental Permit (formerly Waste Management Licence) that regulates the landfill during aftercare:
Environmental Permit BT7272IW refers to all phases of the site but distinguishes between the ‘modern’ southern extension and the rest of the site.
Waste Inputs Waste disposal operations at the site began in 1988 with the first part of the site being completed and restored in 2003. The most recent Waste Management Licence EAWML/27181 for the initial part of the site was issued on the 24th of February 1994. A PPC Permit application was made in October 2002 for a southern extension to the existing landfill. PPC Permit number BT7272IW was issued on the 17th March 2004, and subsequently varied on the 15th of July 2005 (PPC Permit Variation Notice DP3136SR), this has since been updated to an Environmental Permit in accordance with the Environmental Permitting Regulations. The Environmental Permit allowed Yanley Landfill to accept non-hazardous wastes only, while the variation allowed the site to accept stable non-reactive hazardous waste in the form of asbestos. Waste Volumes & Filling Timescale A summary of the deposition history is set out as follows:
Phase Filled
Phase 3 & 4 pre 1995
Phases 5 to 8 1998 - 2000
Phase 9a 2000 – 2002
Phase 9b Engineered but never filled
Southern Extension 2006 - 2009 Site Dimensions and Restoration Standards A summary of the site dimensions, design standards and restoration detail is set out as follows: Basal Engineering and Waste Thicknesses
Phase Basal Engineering Drainage Layer Depth of Waste
(metres)
Phase 3 & 4 No basal engineering, excavated
into in-situ clay No 6 – 11
Phases 5 to 9b In Situ testing of engineered basel
clay liner Yes 7 - 30
Southern Extension
Full basal engineering, 1m clay Yes 5 - 20
Yanley Closed Landfill February 2012 Landfill Aftercare Closure Plan
Ref: Yanley_CP_2012 Page 3
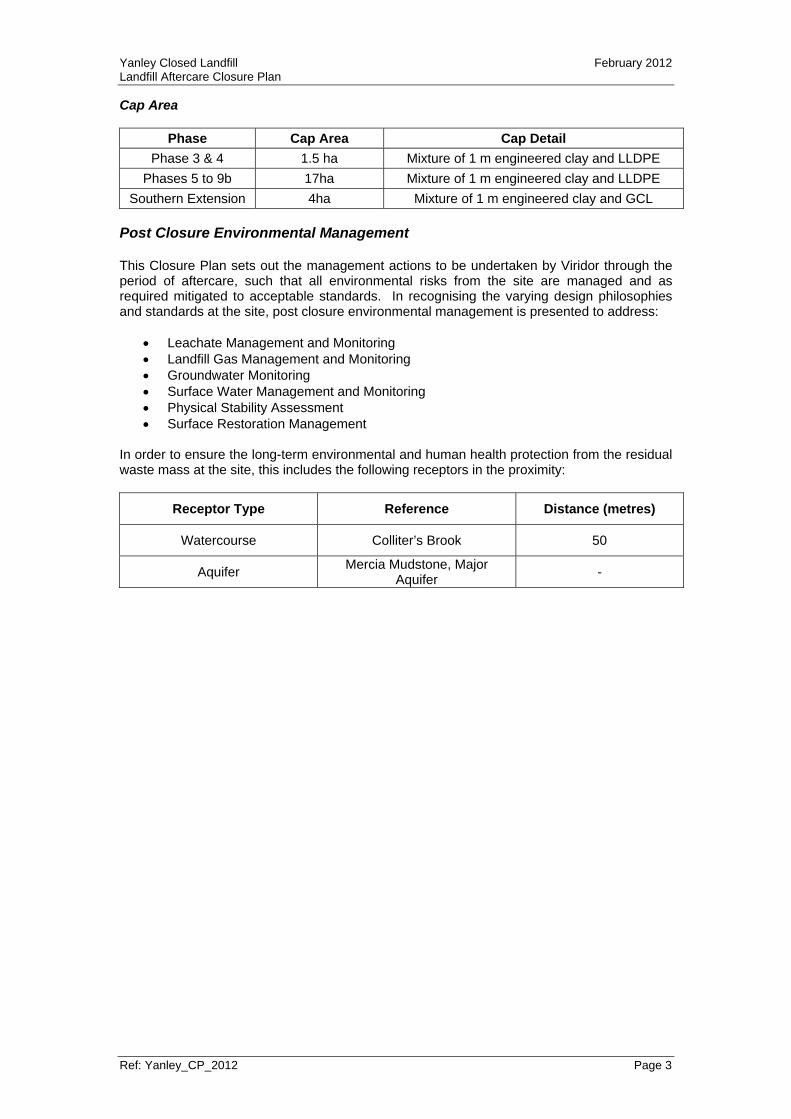
Cap Area
Phase Cap Area Cap Detail
Phase 3 & 4 1.5 ha Mixture of 1 m engineered clay and LLDPE
Phases 5 to 9b 17ha Mixture of 1 m engineered clay and LLDPE
Southern Extension 4ha Mixture of 1 m engineered clay and GCL Post Closure Environmental Management This Closure Plan sets out the management actions to be undertaken by Viridor through the period of aftercare, such that all environmental risks from the site are managed and as required mitigated to acceptable standards. In recognising the varying design philosophies and standards at the site, post closure environmental management is presented to address:
Leachate Management and Monitoring Landfill Gas Management and Monitoring Groundwater Monitoring Surface Water Management and Monitoring Physical Stability Assessment Surface Restoration Management
In order to ensure the long-term environmental and human health protection from the residual waste mass at the site, this includes the following receptors in the proximity:
Receptor Type Reference Distance (metres)
Watercourse Colliter’s Brook 50
Aquifer Mercia Mudstone, Major
Aquifer -

Yanley Closed Landfill February 2012 Landfill Aftercare Closure Plan
Ref: Yanley_CP_2012 Page 4
1 INTRODUCTION ................................................................................................................ 6
1.1 CLOSURE DEFINITION .............................................................................................. 6 1.2 INSTALLATION DETAILS ........................................................................................... 6
1.2.1 Location................................................................................................................ 6 1.2.2 Site Development ................................................................................................. 6 1.2.3 Landfill Description ............................................................................................... 7 1.2.4 Site Setting and Surroundings ............................................................................. 7
2 INTEGRATED MANAGEMENT SYSTEM (IMS) ............................................................... 9
2.1 INTRODUCTION ......................................................................................................... 9 2.2 MANAGEMENT STRUCTURE AND RESPONSIBILITIES ......................................... 9 2.3 TRAINING ................................................................................................................... 9 2.4 MANAGING DOCUMENTATION AND RECORDS ..................................................... 9 2.5 REPORTING NON-COMPLIANCE AND TAKING CORRECTIVE ACTION ............... 9 2.6 OPERATIONAL CONTROL, PREVENTATIVE MAINTENANCE AND CALIBRATION 10
3 THE SITE ......................................................................................................................... 11
3.1 SITE INFRASTRUCTURE ........................................................................................ 11 3.1.1 Containment Engineering .................................................................................. 11 3.1.2 Capping .............................................................................................................. 11 3.1.3 Leachate Storage ............................................................................................... 11 3.1.4 Gas Management Compound ............................................................................ 11 3.1.5 Sub –Surface Structures .................................................................................... 11 3.1.6 Installation Surfacing .......................................................................................... 12 3.1.7 Bunds/Fuel Storage ........................................................................................... 12 3.1.8 Road Surfacing .................................................................................................. 12 3.1.9 Site Offices and Parking Facilities ..................................................................... 12 3.1.10 Perimeter Fencing and Site Security ................................................................. 12 3.1.11 Notices and Signs .............................................................................................. 13
3.2 LEACHATE MANAGEMENT ..................................................................................... 13 3.2.1 Leachate Collection ........................................................................................... 13 3.2.2 Leachate Treatment and Disposal ..................................................................... 13 3.2.3 Maintenance of Leachate Management System ............................................... 13 3.2.4 Leachate Monitoring .......................................................................................... 15 3.2.5 Location, Design and Construction of Monitoring Points ................................... 16 3.2.6 Leachate Control and Trigger Levels ................................................................. 16 3.2.7 Leachate Contingency Action Plan .................................................................... 17
3.3 GROUNDWATER MANAGEMENT .......................................................................... 17 3.3.1 Groundwater Control .......................................................................................... 17 3.3.2 Location, Design and Construction of Monitoring Points ................................... 18 3.3.3 Groundwater Monitoring .................................................................................... 18 3.3.4 Groundwater Control and Trigger Levels ........................................................... 19 3.3.5 Groundwater Contingency Action Plan .............................................................. 20
3.4 SURFACE WATER MANAGEMENT ........................................................................ 20 3.4.1 Surface Water Collection ................................................................................... 20 3.4.2 Surface water Treatment and Disposal ............................................................. 21 3.4.3 Maintenance of the Surface Water Control System .......................................... 21 3.4.4 Surface Water Monitoring .................................................................................. 21 3.4.5 Surface Water Control and Trigger Levels ........................................................ 22 3.4.6 Surface Water Contingency Action Plan ............................................................ 22
3.5 DUST MONITORING ................................................................................................ 22 3.5.1 Control and Trigger levels .................................................................................. 22
3.6 ASBESTOS MONITORING ....................................................................................... 22 3.7 IN-WASTE LANDFILL GAS MANAGEMENT ............................................................ 22 3.8 PERIMETER LANDFILL GAS MONITORING ........................................................... 23
3.8.1 Perimeter Landfill Gas Monitoring Schedule ..................................................... 23 3.8.2 Perimeter Landfill Gas Action and Compliance Levels ...................................... 23 3.8.3 Perimeter Gas Contingency Action Plan ........................................................... 24

Yanley Closed Landfill February 2012 Landfill Aftercare Closure Plan
Ref: Yanley_CP_2012 Page 5
4 RESTORATION, MAINTENENCE AND STABILITY ...................................................... 25
4.1 LANDFILL PHASING ................................................................................................ 25 4.1.1 Phasing Layout .................................................................................................. 25 4.1.2 Construction Phasing and Development ........................................................... 25
4.2 RESTORATION SCHEME ........................................................................................ 25 4.3 SITE STABILITY AND SETTLEMENT ...................................................................... 25 4.4 SITE SURVEY ........................................................................................................... 25
4.4.1 Settlement .......................................................................................................... 25 4.4.2 Monitoring Frequency ........................................................................................ 26 4.4.3 Monitoring Methods ........................................................................................... 26 4.4.4 Data Management and Recording ..................................................................... 26 4.4.5 Site Maintenance and Repairs ........................................................................... 26
APPENDIX 1 – SITE LAYOUT PLAN ..................................................................................... 27
APPENDIX 2 – ENVIRONMENTAL MONITORING LOCATION PLAN ................................ 28
APPENDIX 3 – IN-WASTE GAS INFRASTRUCTURE PLAN ............................................... 29
APPENDIX 4 – SITE RESTORATION AND SETTLEMENT CONTOURS ............................ 30
APPENDIX 5 – ASBESTOS CELL LOCATION PLAN .......................................................... 31
APPENDIX 6 – CONTINGENCY ACTION PLANS ................................................................ 32
APPENDIX 7 – STABILITY RISK ASSESSMENT ................................................................. 33
APPENDIX 8 – HYDROGEOLOGICAL RISK ASSESSMENT REVIEW JULY 09 ................ 34

Yanley Closed Landfill February 2012 Landfill Aftercare Closure Plan
Ref: Yanley_CP_2012 Page 6
1 INTRODUCTION This Closure Plan relates to the closure and restoration of Yanley Landfill site so that the site may be regarded as ‘definitively closed’ by the Environment Agency. Landfill operators must submit such reports as required under Article 13 of the Landfill Directive (Directive 1999/31/EC). The Environment Agency must assess the submitted reports to ensure that measures are in place to monitor and control any potential hazards. This report details the site’s conceptual model of environmental setting and installation design.
1.1 CLOSURE DEFINITION The term landfill ‘closure’ relates to a site that stops operating and no longer receives controlled wastes. The ‘closure process’ therefore establishes the measures that need to be in place, following the cessation of activities, in order to ensure the appropriate level of control and monitoring of the potential hazards and risks associated with a site. The closure process is distinctly different from ‘landfill surrender’, which relates to the handing back of the licence to the Environment Agency once it can be demonstrated that the site no longer poses any potential hazard and/or risk to the environment or human health.
1.2 INSTALLATION DETAILS
1.2.1 Location
Yanley Landfill site is located approximately 3km south west of the city of Bristol, near Long Ashton in North Somerset at National Grid Reference (NGR) ST 557 697. The site covers an area of approximately 30.8 hectares.
1.2.2 Site Development
Waste disposal operations at the site began in 1988 with the first part of the site being completed and restored in 2003. The most recent Waste Management Licence EAWML/27181 for the initial part of the site was issued on the 24th of February 1994. A PPC Permit application was made in October 2002 for a southern extension to the existing landfill. PPC Permit number BT7272 was issued on the 17th March 2004, and subsequently varied on the 15th of July 2005 (PPC Permit Variation Notice DP3136SR), this has since been updated to an Environmental Permit in accordance with the Environmental Permitting Regulations. The Environmental Permit allowed Yanley Landfill to accept non-hazardous wastes only, while the variation allowed the site to accept stable non-reactive hazardous waste in the form of asbestos. The environmental permitted installation comprises the following areas; the extension area, the restored previously licensed landfill, the landfill gas management facility and the leachate storage lagoon, see Drawing YAN3000 for the extent of the land covered by this Closure Plan. The extension area to the south comprises Cell S1, Cell S2 and the Asbestos Area. The previously restored area of the site is identified as Cells 3 to 9, see Drawing YAN3000. Inert materials are currently being imported to achieve the final restoration profile above the engineered capping system.

Yanley Closed Landfill February 2012 Landfill Aftercare Closure Plan
Ref: Yanley_CP_2012 Page 7
1.2.3 Landfill Description
Yanley Landfill Site received stable non-reactive hazardous waste in the form of asbestos and non-hazardous wastes. The historic permitting and licensing is detailed in Section 1.2.2. Yanley landfill site ceased acceptance of non-hazardous waste on the 4th April 2009 and asbestos waste on the 22nd June 2009. Gas at the site is managed via a gas extraction network and gas utilisation plant. Leachate generated at the site is managed via a leachate extraction network and leachate lagoon, located on the northern boundary of the site.
1.2.4 Site Setting and Surroundings
Topography The site is located on relatively low ground, with surface elevations approximately 55m AOD at the south western boundary falling to approximately 20m AOD at the north east boundary. The topography falls steeply to the east towards Colliter’s Brook. Site Setting Yanley Landfill Site is located south west of Ashton Vale, approximately 3km south west of the centre of Bristol. The site is bounded by agricultural fields. The nearest residential properties are 300m to the east of the site boundary. Access to the site is obtained via a private road which joins the A38 Bridgwater Road approximately 1km south west of Bedminster Down, Bristol. The site is located at (NGR) ST 557 697. The boundary of the entire site is securely fenced, with vehicular access to the landfill only possible via the private entrance road. Lockable gates are installed at the site entrance and are kept locked whenever the site is not attended. The site is bound to the north by the railway line, which runs from Bristol to Weston Super Mare. Beyond that, the surrounding land use to the north is agricultural fields with the residential developments of Long Ashton and Ashton to the North West and North East respectively. The outskirts of Bristol lie to the east of the site with both commercial and residential properties. Woodsprings Golf Club lies to the south west. Surrounding Watercourses The Ordnance Survey map for the area shows a small watercourse, Colliter’s Brook, running past the site to the east. There are two large reservoirs located approximately 2km to the south west. There is also Longmoor Brook to the west of the site.

Yanley Closed Landfill February 2012 Landfill Aftercare Closure Plan
Ref: Yanley_CP_2012 Page 8
Geology Yanley Landfill Site is developed within an area of Mercia Mudstone deposits. The site is underlain by low permeability Mercia Mudstone Group, clays, mudstones and siltstones. Some fine sandstones are also present within the Mercia Mudstone Group. Also present at the site can be found small areas of Tea Green Marl, Penarth Group and Lower Coal Measures, mudstones and limestones. Aquifer Status The site is on a non-aquifer and is in an area of low groundwater resource value. Habitats Sites There are no European sites that have been identified within the vicinity of Yanley Landfill Site. A Multi Agency Governmental Information for the Countryside (MAGIC) internet search undertaken in September 2007 confirms this and identifies a Site of Special Scientific Interest (SSSI) at Ashton Court within 2km of Yanley Landfill Site. This site was designated due to its invertebrate fauna including many species, which are nationally scarce. A detailed report entitled ‘Ecology and Nature Conservation’ was produced by AERC Limited, on behalf of Viridor in 2001 as part of the Planning Application for the southern extension of the landfill. This dealt with all aspects of the site and its effect on any potentially sensitive ecological receptors in the vicinity of the landfill. An Ecological Management Plan was also produced by Viridor in May 2003 in accordance with Planning Permission reference No. 01/P/1562/F2, which was granted to allow the southern extension of the landfill.

Yanley Closed Landfill February 2012 Landfill Aftercare Closure Plan
Ref: Yanley_CP_2012 Page 9
2 INTEGRATED MANAGEMENT SYSTEM (IMS)
2.1 INTRODUCTION Viridor operates an integrated quality, environmental and health and safety management system (Business Management System, BMS), certified to ISO 9001, ISO 14001, and OHSAS 18001. Yanley Closed Landfill Site has fully adopted the BMS. The policy is published in order to strengthen the corporate commitment to:
Comply with all relevant legislation and other requirements; Continually improve performance and prevent pollution; Provides framework for setting Objectives and Targets; Communicate to employees and other interested parties.
2.2 MANAGEMENT STRUCTURE AND RESPONSIBILITIES Organisational charts showing the company structure and flow monitoring responsibilities are maintained on the Company’s Portal.
2.3 TRAINING All staff working at the installation benefit from a training programme, which ensures their professional and technical development and appropriate technical competence in the management of the site during the period of this plan. Annual assessments of training needs are carried out to identify the posts for which specific environmental awareness training is needed, and the scope and level of such training. Records of training needs and training received are maintained through the BMS.
2.4 MANAGING DOCUMENTATION AND RECORDS Document control shall be in accordance with: Viridor Procedure: 6.1 - Document Control.
2.5 REPORTING NON-COMPLIANCE AND TAKING CORRECTIVE ACTION
Preventative and corrective actions shall be in accordance with: VWM Procedure: 3.1 - Corrective and Preventative Actions. This procedure ensures that appropriate corrective and preventative action is taken in response to non-conformances identified at the installation. It also ensures that non-conformances are reported, investigated and rectified, and that failures and weaknesses are prevented.

Yanley Closed Landfill February 2012 Landfill Aftercare Closure Plan
Ref: Yanley_CP_2012 Page 10
2.6 OPERATIONAL CONTROL, PREVENTATIVE MAINTENANCE AND CALIBRATION
The BMS will complement the environmental monitoring and maintenance procedures included in this Closure Plan so as to ensure effective control of the installation during the aftercare period.

Yanley Closed Landfill February 2012 Landfill Aftercare Closure Plan
Ref: Yanley_CP_2012 Page 11
3 THE SITE
3.1 SITE INFRASTRUCTURE
3.1.1 Containment Engineering
Waste disposal operations began at the site in 1988 under the control of a Waste Management Licence, EA reference EAWML/27181. On the 17th of March 2004 PPC Permit BT7272 was issued for the southern extension of the landfill facility which became an Environmental Permit in 2008. The southern extension area (Cell S1, S2 and the asbestos cell) was constructed by the excavation of Mercia Mudstone Group strata to the south of the original landfill area. The Environmental Permitted area comprises; the extension area, the restored cells, the landfill gas management facility and the leachate storage lagoon see Drawing YAN3000 (Appendix 2). The southern extension area benefits from a geological attenuation layer along with an engineered basal liner / sealing layer. The geological barrier is provided by the natural in situ clays, silts and mudstones of the Mercia Mudstone Group. Containment is provided at the base of the restored landfill cells by engineered Mercia Mudstone clay.
3.1.2 Capping
The capping system serves to minimise the infiltration of rainwater and thus production of leachate. The capping system also serves to minimise the escape of landfill gas. Capping at Yanley Landfill Site consists of a combination of an engineered clay liner, geomembrane and geosynthetic clay liner. This will be overlain by restoration soils to a minimum depth of 1m for grassland and 1.5m for woodland.
3.1.3 Leachate Storage
The majority of leachate removed from the waste mass is pumped directly to sewer with the site’s leachate lagoon collecting additional leachate prior to disposal to sewer. Environmental Permit Condition 3.6.1 and Table S4.4 set out the monitoring requirements with respect to the leachate discharge to sewer.
3.1.4 Gas Management Compound
Landfill gas at the site is managed via two landfill gas engines and one gas flare. An active landfill gas extraction system is in operation at Yanley Landfill. The gas extraction system comprises a series of vertical gas extraction wells connected to a system of gas mains, manifolds and spurs. Landfill gas generated at the site is managed via two landfill gas engines, a Jenbacher 316 and a Jenbacher 320. This gives a maximum combined export of approximately 1700kW of electrical output. There is one high temperature flare, of enclosed design, which burns the excess gas under normal circumstances and automatically accommodates additional gas flow in the event of engine failure or shut-down. The high temperature flare is sized to be capable of burning all of the landfill gas arising from the site. The gas engines are inspected up to five times a week during normal operation with the flare subject to monthly inspections.
3.1.5 Sub –Surface Structures
Sub-surface structures at the installation include those associated with the leachate extraction network and gas collection system. Where accessible, sub-surface structures are subject to an inspection and maintenance programme.
Yanley Closed Landfill February 2012 Landfill Aftercare Closure Plan
Ref: Yanley_CP_2012 Page 12
3.1.6 Installation Surfacing
All areas of the installation (excluding the landfill containment areas) where there is potential for activities to pollute the ground or controlled waters are hard surfaced. To ensure appropriate standards are achieved, all hard surfaced areas are designed to take account of the following requirements:
Capacities; Thickness; Falls; Material of construction; Hydraulic conductivity; Strength/reinforcement; and Resistance to chemical attack.
Construction of any hard surfacing has been subject to regular inspection and maintenance. Post closure hard surfaced areas incorporate the following;
main installation access road; hard surfacing at the landfill gas management compound; car parking area and access for site maintenance visits.
3.1.7 Bunds/Fuel Storage
At present there is a fuel storage tank which is fully bunded. This will be removed from site when no longer required, and will not be on site upon completion of the restoration soils.
3.1.8 Road Surfacing
There will be no roads retained within the landfill footprint, however, access roads to the site and WtE compound will remain.
3.1.9 Site Offices and Parking Facilities
The site offices, weighbridge, waste reception area and car parking facilities lie to the south of the landfill area, within the Environmental Permit boundary near to the site entrance.
3.1.10 Perimeter Fencing and Site Security
The site is fenced at the perimeter as shown in Appendix 1 - Drawing YAN16000, and vehicular access is gained through a gate which is kept locked at all times the site is unattended. The fencing is inspected monthly for signs of damage. Any necessary repair or remedial work on the fence will be carried out within 7 days of the damage being noted. Site security is based on the following objectives and requirements;
to ensure that members of the general public do not become endangered by
unknowingly encroaching over the landfill site boundary; to positively discourage fly tipping; to minimise vandalism on the site, in particular to environmental monitoring and
control equipment.
Yanley Closed Landfill February 2012 Landfill Aftercare Closure Plan
Ref: Yanley_CP_2012 Page 13
3.1.11 Notices and Signs
A large, clearly marked notice board of durable, weather resistant design is maintained at the entrance to the installation. The notice board shows the following:
The name of the installation; The name, address and telephone number of the permit holder; The address and telephone number of the Environment Agency office responsible for
monitoring the installation; An emergency out-of-hours telephone number for the operator; An emergency telephone number for the Environment Agency.
The notice board will be maintained in a legible condition throughout the closure phase of the site’s life.
3.2 LEACHATE MANAGEMENT
3.2.1 Leachate Collection
Leachate extraction wells are installed across the site. In the older phases of the development, the leachate drainage system within each cell comprised 150mm and 200mm slotted HDPE pipe, installed within a drainage stone surround. The leachate is extracted from the sumps by a pneumatic pumping system which discharges directly to sewer. There is also a leachate lagoon which can be utilised by the leachate extraction system during periods of heavy flow or if the maximum daily discharge volume has been met. In Cells S1 and S2 leachate collection drains are arranged in the herringbone pattern, with the main drains 200mm in diameter and spur collector drains 150mm in diameter, with nominal spacing between collector drains at 50m. A leachate drainage blanket was constructed in addition to the piped leachate collection system. Formed from a nominal 5-10mm non-calcareous granular aggregate it has been placed on a separation geotextile over the engineered barrier. Within Cells S1 and S2 additional geocomposite drainage is installed.
3.2.2 Leachate Treatment and Disposal
The majority of abstracted leachate is pumped directly to sewer with additional leachate being fed to the leachate storage lagoon in the north east corner of the site prior to disposal to sewer under conditions set in the Environmental Permit. This will continue through the aftercare phase for as long as leachate is generated by the site.
3.2.3 Maintenance of Leachate Management System
The pumping maintenance schedule incorporates an annual service of moving parts, together with checks and cleaning of flow meter and level indicator equipment. The pumping systems are maintained under contract. The objectives of the leachate management system (where installed) at the site are:
To control leachate generation within the landfill; To prevent the contamination of ground and surface waters by leachate migration; To maintain the level of leachate within the landfill below the specified maximum
levels, where appropriate, in compliance with the Permit and Closure Plan; To achieve a stable biomass as early as possible. Leachate recirculation may be
utilised in order to accelerate stabilisation of the waste mass.

Yanley Closed Landfill February 2012 Landfill Aftercare Closure Plan
Ref: Yanley_CP_2012 Page 14
If the review process identifies potential shortfalls in the provision of the existing leachate management facilities at the installation, action will be taken to enhance system capability. This action may include the following:
Increase in capacity of leachate pumping facilities; and Installation of additional leachate storage facilities.
All mechanical and electrical equipment associated with the leachate extraction system is routinely inspected and was extensively tested prior to installation.

Yanley Closed Landfill February 2012 Landfill Aftercare Closure Plan
Ref: Yanley_CP_2012 Page 15
3.2.4 Leachate Monitoring
The following programme for leachate monitoring, outlined in Table 3-1, 3-2 and 3-3, will be carried out moving into the post closure phase.
Table 3-1 Leachate Monitoring Schedule (Point YN/501 Discharge to Sewer)
Monitoring Location Frequency Parameters to be Monitored
YN/501
Quarterly
pH, conductivity, ammoniacal nitrogen, chloride, BOD, COD,
alkalinity, sulphur, copper, chromium, lead, nickel, zinc,
iron, manganese, Total sulphate as SO4, Total sulphide
as S, mecoprop, xylene, toluene, mercury
Every 4 years
As quarterly plus; List 1 Screen
Table 3-2 Leachate Monitoring Schedule - In Waste
Monitoring Location Frequency Parameters to be Monitored
YN/320, YN/327,YN/332, YN/383a, YN387a,
YN/391, YNS503LM, YNS504LM
Quarterly
pH, conductivity, ammoniacal nitrogen, chloride, BOD, COD,
alkalinity, sulphur, copper, chromium, lead, nickel, zinc,
iron, manganese, total sulphate as SO4, total sulphide as S, mecoprop, xylene, toluene,
mercury
YN/327, YN387a, YN/391, YNS503LM,
YNS504LM Every 4 years As quarterly plus; List 1 screen
A continuous data monitoring plan has been submitted in February 2012 alongside this closure plan. This report has been prepared by Viridor to reflect operation and management of the leachate level management systems at the site. This document and subsequent updates to it reflect the leachate level monitoring network that will be monitored during the closure phase of the site. The table below (Table 3-3) summaries the locations that are proposed to be monitored at the site and identifies which locations will be continuously monitored and which will be manually dipped.

Yanley Closed Landfill February 2012 Landfill Aftercare Closure Plan
Ref: Yanley_CP_2012 Page 16
Table 3-3 Leachate Level Monitoring Schedule
Monitoring Location Frequency Parameters to be Monitored
YN/345a, YN/358a, YN/387a, YN/383a, YN/389a, YN/391
Quarterly average (compliance level: 5.0m
quarterly average)
Continuously monitored Leachate head (m)
YNS503LM, YNS504LM,
Quarterly average (compliance level: 2.0m
quarterly average)
Continuously monitored Leachate head (m)
YN/312, YN/313, YN/315, YN/317, YN/320, YN/327,YN/332,
YN/349b, YN/350a, YN/356a, YN/370a,
Quarterly (compliance level: 5.0m)
Manually dipped Leachate head (m)
YNS505LM, YNS506LM. Quarterly
(compliance level: 2.0m) Manually dipped
Leachate head (m)
3.2.5 Location, Design and Construction of Monitoring Points
The location of the leachate extraction and monitoring wells is illustrated in Drawing YAN3000 (Appendix 2). All monitoring installations are fitted with a sealed cap to enable samples to be obtained and level monitoring undertaken. Monitoring Procedure Monitoring of leachate quality and leachate levels is carried out in accordance with Viridor Work Instructions: 6.4.5 – Leachate Quality Sampling; and 6.4.6 – Leachate Level Monitoring. Quality Assurance Suitably trained, competent personnel will undertake leachate monitoring. Laboratory analyses of samples will be carried out at a UKAS accredited laboratory. Monitoring equipment is serviced and maintained in line with the manufacturers' recommendations. Should any of the leachate monitoring points become damaged to such an extent that the leachate levels cannot be recorded, they may be repaired if practicable. If necessary and practicable, the nature and location of any replacement, as well as the methods to be used, would be agreed with the Environment Agency prior to any works being undertaken.
3.2.6 Leachate Control and Trigger Levels
Control and trigger levels form the basis for assessing environmental monitoring data at landfill sites. These are defined as follows: Control levels are specific assessment criteria relating to leachate or other relevant parameters and are used to determine whether a landfill is performing as designed. They are levels that are intended to draw attention of site management and the Agency to the development of adverse, or unexpected, trends in the monitoring data. Control levels should be treated primarily as an early warning system to enable appropriate investigative or

Yanley Closed Landfill February 2012 Landfill Aftercare Closure Plan
Ref: Yanley_CP_2012 Page 17
corrective measures to be implemented, particularly where there is potential for a trigger level to be breached. A well-planned method of assessment, agreed between the operator and the Environment agency, will help to both protect the environment and thereby avoid breaches of trigger levels, and provide clarity and avoid ambiguity when trigger level conditions are breached. Control levels should therefore:
Highlight variations between the conceptual model (i.e. assumed behaviour) and observed conditions;
Identify unambiguous adverse trends which are indicative of leachate impacts; Allow for variation in natural water quality from baseline conditions; and Give sufficient time to take corrective or remedial action before trigger levels are
breached. Trigger levels are specific compliance levels, or regulatory standards. They are defined as criteria at which potential, or risk of future, significant adverse environmental effects and/or breaches of legislation have occurred. The HRA review undertaken by SLR on behalf of Viridor in July 20091 (Appendix 8) has proposed that the trigger levels currently set in the permit are appropriate post closure, these are detailed in Table 4 below:
Table 4: Leachate Control and Trigger Levels
Monitoring Location Control Level (metres
above cell base) Trigger Level (metres
above cell base)
YNS503LM, YNS504LM, YNS505LM, YNS506LM
1.5 m 2.0 m
YN/312, YN/313, YN/315, YN/317, YN/320,
YN/327,YN/332, YN/345a, YN/349b, YN/350a, YN/356a, YN/358a, YN/370a, YN/387a,
YN/383a, YN/389a, YN/39
4.0 m 5.0 m
3.2.7 Leachate Contingency Action Plan
In the event that control and trigger levels are exceeded at the designated monitoring locations, the various actions that may be appropriate are detailed in Contingency Action Plan 6.4.401 contained in Appendix 6.
3.3 GROUNDWATER MANAGEMENT
3.3.1 Groundwater Control
The following technical precaution was made with regards to groundwater control at the site: A 550m cut off trench was constructed in the Mercia Mudstone to prevent seepage, from a 150mm thick sandstone band within the mudstone, onto a cut face which formed the southern side of the original landfill site. The trench was constructed to prevent instability of the slope during construction.

Yanley Closed Landfill February 2012 Landfill Aftercare Closure Plan
Ref: Yanley_CP_2012 Page 18
3.3.2 Location, Design and Construction of Monitoring Points
Viridor maintain a network of groundwater monitoring boreholes at Yanley landfill site. These boreholes are used to monitor groundwater elevations and assess groundwater quality beneath the site. Groundwater is monitored at the locations shown on Drawing YAN3000 (Appendix 2). The groundwater wells are fitted with removable sealed caps to enable samples to be obtained and level monitoring to be undertaken. The boreholes are secured with lockable steel headworks fitted into a concrete surround. The steel headwork is marked with the monitoring location reference number.
3.3.3 Groundwater Monitoring
In reflecting the associated risks during the landfill aftercare phase and as set out in more detail as part of the HRA review undertaken to support this closure plan (see Appendix 8), the following programme of groundwater monitoring is proposed for the aftercare phase of the site.
Table 6: Groundwater Quality Monitoring for Mercia Mudstone
Monitoring Locations Frequency Parameters
Up-gradient:
YN/619, YN/630, YN/633,
Down-gradient: YN/603, YN/605,
YN/608,
Quarterly
pH, conductivity, ammoniacal nitrogen,
TON, nitrate, nitrite, phosphate, chloride, potassium, BOD, COD,
alkalinity, sodium, calcium, magnesium, copper, cadmium,
chromium, lead, nickel, zinc, iron, manganese, sulphate, mecoprop
Every 4 years
As quarterly plus List 1 Screen
YN/601, YN/603, YN/605, YN/608, YN/611, YN/614, YN/616, YN/619, YN/626, YN/628, YN/630, YN/633
Quarterly Groundwater level (m)

Yanley Closed Landfill February 2012 Landfill Aftercare Closure Plan
Ref: Yanley_CP_2012 Page 19
Table 7: Groundwater Quality Monitoring for Coal Measures
Monitoring Locations Frequency Parameters
Up-gradient:
YN/619A, YN/629, YN/631
Down-gradient: YN/607, YN/610,
YN/612
Quarterly
pH, conductivity, ammoniacal nitrogen, chloride
Annually
pH, conductivity, ammoniacal nitrogen, TON, nitrate, nitrite, phosphate, chloride, potassium, BOD, COD,
alkalinity, sodium, calcium, magnesium, copper, cadmium,
chromium, lead, nickel, zinc, iron, manganese, sulphate, mecoprop
4-yearly
As quarterly plus List 1 Screen
YN/602, YN/604, YN/607, YN/610, YN/612, YN/613,
YN/619A, YN/627, YN/629, YN/631,
YN/632,
Quarterly Groundwater level (m)
Following site closure the information will be stored at the Viridor head office. This information will be submitted to the Environment Agency at quarterly intervals or as otherwise agreed. The groundwater monitoring programme and results will be subject to regular review by Viridor throughout the post-closure aftercare period of the installation. Sampling frequencies and determinands will be modified and adjusted as appropriate. If stable conditions are present (levels or quality) the frequency and/or number of determinands may be reduced in consultation with the Environment Agency. Monitoring Procedure Monitoring of groundwater quality and groundwater levels is carried out in accordance with Viridor Work Instructions: 6.4.2 – Groundwater Level Monitoring 6.4.4 – Groundwater Sampling 6.4.19 – Purge Water Management 6.4.20 – Dip Meter Calibration Quality Assurance Suitably trained, competent personnel will undertake groundwater monitoring. Laboratory analyses of samples will be carried out at a UKAS accredited laboratory. Monitoring equipment is serviced and maintained in line with the manufacturers' recommendations.
3.3.4 Groundwater Control and Trigger Levels
Interim trigger levels are currently set for down gradient groundwater boreholes at Yanley Landfill Site. Proposed control and trigger levels for the modelled priority contaminants are presented in Table 8 and Table 9 below. Two down gradient boreholes monitoring have been selected as compliance locations with a third to be included once drilled. These are boreholes

Yanley Closed Landfill February 2012 Landfill Aftercare Closure Plan
Ref: Yanley_CP_2012 Page 20
YN605 and YN608, monitoring the Mercia Mudstone. The methodology for the derivation of these levels is set out in the Hydrogeological Risk Assessment Review, Appendix 8.
Table 8: Groundwater List I Quality Monitoring for Mercia Mudstone
Monitoring Location Parameter Trigger Level
YN/605, YN/608
Mecoprop 0.1ug/l
Toluene 4.0ug/l
mp-xylene 3.0ug/l
Mercury 0.4ug/l
Table 9: Groundwater List II Quality Monitoring for Mercia Mudstone
Monitoring Location Control Level Trigger Level
YN/605*
Chloride – 150 mg/l
Ammoniacal-N – 0.6 mg/l
Chloride – 250 mg/l
Ammoniacal-N – 2.0 mg/l
YN/608*
Chloride – 150 mg/l
Ammoniacal-N – 1.3 mg/l
Chloride – 250 mg/l
Ammoniacal-N – 2.0 mg/l
* A further borehole YN/634 Has been installed down-gradient of the site. Viridor are currently obtaining data from this borehole with the view to setting trigger levels for this borehole. This will be done once Viridor has obtained sufficient data.
3.3.5 Groundwater Contingency Action Plan
In the event of an exceedance of a groundwater control or trigger level once agreed, Viridor will respond by implementation of the Contingency Action Plan, which is presented in Appendix 6. More specifically, a Schedule 6 notification form will be submitted to the Environment Agency providing details of the breach without delay.
3.4 SURFACE WATER MANAGEMENT
3.4.1 Surface Water Collection
The site topography is such that there is a surface water divide between water flowing east towards Colliter’s Brook and water flowing west to a tributary of the Longmoor Brook. Surface water drains from the site to settlement lagoons before it is discharged via drainage ditches to these watercourses. The surface water management scheme is in place to;
ensure that runoff is controlled at all stages and that the drainage system has
sufficient capacity to safely discharge surface runoff without impairment to the stability of restored slopes;
ensure that there is no increase in flooding risk either at the site or downstream of the site; and
ensure that surface water discharged from the site is of a suitable quality.

Yanley Closed Landfill February 2012 Landfill Aftercare Closure Plan
Ref: Yanley_CP_2012 Page 21
Hard surfaced areas that remain at the site post closure will be subject to an inspection and maintenance programme, which ensures the continued integrity of the surface.
3.4.2 Surface water Treatment and Disposal
The surface water at the site is subject to treatment in the form of storage in lagoons to allow the settlement of any suspended solids. After treatment in the settlement lagoons surface water is discharged to the local water courses via drainage ditches. Any surface water that becomes contaminated at the site will be disposed of appropriately i.e. directed to the leachate lagoon and then discharged to sewer. This will continue during the aftercare phase of the site.
3.4.3 Maintenance of the Surface Water Control System
In the absence of the appropriate maintenance, the gradual accumulation of debris within ditches etc. could reduce capacity and effectiveness. A number of operational practices are in place to ensure that the surface water drains efficiently. These include;
good site practice, to ensure that the generation of suspended solids is minimised by
the progressive vegetation of restored slopes; site operatives routinely monitor the efficiency of surface water drainage. The
accumulation of sediment along any drainage channels will be checked and any obstructions (debris etc.) within the system removed.
3.4.4 Surface Water Monitoring
Surface water is monitored at the locations shown on Drawing: YAN3000 (Appendix 2).The following programme of surface water monitoring is proposed for the aftercare phase of the site.
Table 10: Surface Water Quality Monitoring
Monitoring Locations Frequency Parameters
YN/403, YN/404, YN/405, YNS421,
YNS422 Monthly
Ammoniacal nitrogen, Chloride,
Conductivity, pH, Suspended solids, BOD, COD
Following site closure the information will be stored at Viridor’s head office. This information will be submitted to the Environment Agency at quarterly intervals or as otherwise agreed. The surface water monitoring programme and results will be subject to regular review by Viridor throughout the post-closure aftercare period of the installation. Sampling frequencies and determinands will be modified and adjusted as appropriate. If stable conditions are present (levels or quality) the frequency and/or number of determinands may be reduced in consultation with the Environment Agency. Monitoring Procedure Monitoring of surface water quality is carried out in accordance with Viridor Work Instruction: 6.4.3 - Surface Water Monitoring

Yanley Closed Landfill February 2012 Landfill Aftercare Closure Plan
Ref: Yanley_CP_2012 Page 22
Quality Assurance Suitably trained, competent personnel will undertake surface water monitoring. Laboratory analyses of samples will be carried out at a UKAS accredited laboratory. Monitoring equipment is serviced and maintained in line with the manufacturers' recommendations.
3.4.5 Surface Water Control and Trigger Levels
Control and trigger levels form the basis for assessing surface water monitoring data at the installation. The proposed trigger levels for the site are detailed in Table 11 below. After a period of 18 months following the completion of the restoration a review of the data obtained will be carried out with the view to remove the trigger level if appropriate.
Table 11: Surface Water Control & Trigger Levels
Monitoring Location Trigger
YNS421, YNS422
Suspended Solids – 100 mg/l
3.4.6 Surface Water Contingency Action Plan
In the event of an exceedance of a surface water trigger level proposed above, Viridor will respond by implementation of the Contingency Action Plan, which is presented in Appendix 6. More specifically, a closed site trigger breach notification form will be submitted to the Environment Agency providing details of the breach without delay.
3.5 DUST MONITORING
3.5.1 Control and Trigger levels
No control or trigger levels are set within the Permit with regards to dust monitoring at the site, however, dust monitoring will continue to be assessed against Viridor’s internal trigger level based on the widely used figure of 200mg/m2/day. Following the completion of the restoration a review of the data obtained will be carried out with the view to remove this monitoring requirement if appropriate.
3.6 ASBESTOS MONITORING From the 22nd June 2009 the site no longer accepted asbestos waste. As a result of this all ambient air asbestos monitoring has ceased. A plan showing the asbestos cell at the site is included in Appendix 5.
3.7 IN-WASTE LANDFILL GAS MANAGEMENT A Closed Site Gas Management Plan (GMP) has been prepared for the site and details current and proposed measures for the long-term control of landfill gas to minimise

Yanley Closed Landfill February 2012 Landfill Aftercare Closure Plan
Ref: Yanley_CP_2012 Page 23
uncontrolled emissions beyond the landfill and to minimise uncontrolled emissions of landfill gases to the atmosphere. A copy of the GMP is kept onsite and is available electronically.
3.8 PERIMETER LANDFILL GAS MONITORING Landfill gas monitoring is routinely undertaken at perimeter gas monitoring wells to ensure that landfill gas control measures remain effective and no significant risk exists with respect to off-site impact at potential receptors. The locations of the perimeter gas wells are shown on drawing YAN3000 in Appendix 2. The monitoring boreholes are fitted with a gas tight cap that is equipped with a gas-sampling tap suitable for connection to the sampling equipment to be used at the site. Boreholes are secured with lockable steel headworks. The borehole number is marked on the headworks. Monitoring of perimeter gas concentrations is carried out in accordance with GMP Work Instruction: 7.3.4 – Perimeter Gas Borehole Monitoring Procedure.
3.8.1 Perimeter Landfill Gas Monitoring Schedule
The following programme of perimeter gas monitoring is proposed for the aftercare phase of the site:
Table 11: Perimeter Gas Monitoring Schedule
Monitoring Locations Frequency Parameters
YN601GM, YN602GM, YN603GM, YN604GM, YN605GM, YN606GM, YN607GM, YN608GM, YN610GM, YN611GM, YN612GM, YN613GM, YN614GM, YN616GM, YN617GM, YN619AGM YN626GM, YN627GM, YN628GM, YN629GM, YN630GM, YN631GM, YN632GM, YN633GM.
Monthly
CH4; CO2; O2;
Atmospheric pressure (mbar)
Results of perimeter landfill gas monitoring will be submitted to the Environment Agency at quarterly intervals or as otherwise agreed with the Environment Agency. Suitably trained and experienced personnel will undertake gas monitoring. The gas monitoring equipment is calibrated, serviced and maintained in line with the manufacturer’s recommendations. Calibration certificates are retained by Viridor.
3.8.2 Perimeter Landfill Gas Action and Compliance Levels
Action and compliance levels form the basis for assessing perimeter landfill gas monitoring data at landfill sites. An updated soil gas management level review has been submitted in February 2012 alongside this closure plan. This report has been prepared by Viridor to reflect the contemporary approach to the management of perimeter gas concentrations that have been progressed with the Environment Agency up to January 2011. This document and any subsequent updates to it reflect the perimeter network that will be monitored during the

Yanley Closed Landfill February 2012 Landfill Aftercare Closure Plan
Ref: Yanley_CP_2012 Page 24
closure phase of the site in addition to outlining appropriate action and trigger levels for each location.
3.8.3 Perimeter Gas Contingency Action Plan
Contingency Action Plan 7.4.2 Perimeter Gas Exceedance as set out in the site GMP will be followed in the event of a gas concentration being recorded within a perimeter gas monitoring borehole in excess of the trigger levels set out in Table 12 above. More specifically, a closed site trigger breach notification form will be submitted to the Environment Agency providing details of the perimeter gas breach without delay.

Yanley Closed Landfill February 2012 Landfill Aftercare Closure Plan
Ref: Yanley_CP_2012 Page 25
4 RESTORATION, MAINTENENCE AND STABILITY
4.1 LANDFILL PHASING
4.1.1 Phasing Layout
The layout of the site is illustrated in Appendix 1.
4.1.2 Construction Phasing and Development
All waste inputs to the site ceased as of June 2009, and only restoration soils have been received at the site subsequent to this date.
4.2 RESTORATION SCHEME The restoration scheme maximises the potential contribution that the installation can make to improving landscape quality, ecological enhancement and public access. The proposed after use and restoration does not conflict with the requirements to ensure continued access for monitoring and maintenance of environmental monitoring and management systems. The installation has been progressively restored in accordance with the approved restoration plan, as illustrated in Appendix 4. This provides for the creation of a sympathetic landform in keeping with the topography of the surrounding area, and minimises the visual impact of the development. Restoration consists of in excess of 200,000 tonnes of restoration soil being imported onto the site. This process has been ongoing since the site closed for waste acceptance. The intention is to cover the entire site with a minimum of 300mm of restoration soils by April 2011 in order to protect the underlying engineered cap.
4.3 SITE STABILITY AND SETTLEMENT The site stability and settlement is addressed in a Stability Risk Assessment for the site, which is included as Appendix 7 of this report.
4.4 SITE SURVEY Measures are taken to record the structure and composition of the landfill body as detailed below;
4.4.1 Settlement
The final restored profile of the site which takes into account the likely settlement of the deposited wastes is presented within Appendix 4.

Yanley Closed Landfill February 2012 Landfill Aftercare Closure Plan
Ref: Yanley_CP_2012 Page 26
4.4.2 Monitoring Frequency
During the aftercare phase, settlement will continue to be monitored at regular intervals to monitor settlement against the post settlement contours agreed with the planning authority.
4.4.3 Monitoring Methods
Ground control is established for each survey, and is checked as appropriate to ensure continued accuracy.
4.4.4 Data Management and Recording
All data collected during the surveys is stored electronically, and used to generate paper plans as required by Viridor. Copies of the most recent survey data are available on request
4.4.5 Site Maintenance and Repairs
Inspection Programme To ensure all necessary maintenance is carried out during the aftercare period, a regular inspection programme is implemented. The scope of the inspection programme is as follows:
Inspection of fencing and gates; Inspection of ‘above ground’ components of landfill including monitoring boreholes,
pipework, wellheads; Inspection of public access features, i.e. public right of way; Inspection of leachate treatment and landfill gas plant; and Inspection of landfill topography for signs of differential settlement.
Maintenance Programme All plant and equipment utilised during the post closure period will be maintained in accordance with the manufacturers’ requirements. The plant and equipment that will be subject to this maintenance is as follows:
Fencing and gates; Monitoring boreholes (gas, leachate, groundwater); Landfill gas infrastructure (wells, pipework); Landfill gas plant (power generation equipment, gas flare); and Leachate pumping and treatment plant equipment.
In addition to the planned maintenance programme, unplanned maintenance will be carried out in response to unexpected damage identified during the course of the routine inspection programme. In addition, the restored landform will be maintained if required to remedy any differential settlement that may jeopardize the integrity of the capping or drainage system Some degradation of the management systems (gas and leachate) is expected, which would reduce their efficacy. However, any degradation would be assessed and the appropriate remedial work would be undertaken throughout the aftercare phase of the sites life.

Yanley Closed Landfill February 2012 Landfill Aftercare Closure Plan
Ref: Yanley_CP_2012 Page 27
APPENDIX 1 – Site Layout Plan

YES
REVIEW
FENCE FLOW CHART
FENCE 7CHAIN LINK FENCE
Is the site close to schools and/orhigh density housing ? YES Is there a history of trespass
and/or vandilism ? YES
NOIs the site close to a publicfootpath or bridleway ?
Have neighbouring properties hada history of vandilism or trespass ?
NONO
YES
Does the Site present anysignificant risks, ie falling fromheights, or is it heavily used ?
YESYES
NO
NOAre there other land uses, eg
farmland or waste recycling, nextto the site.
NO YES
Consideration of animals gainingaccess to the site and other
public/landowner access rights?YES
NO
Is the site next toa public highway ? YES
Are there aesthetic considerationsdue to location of the site and the
surrounding area ?
NO
Is the site open as a publicright of access/use ?
YES NO
FENCE 1STRAND PLAIN WIRE FENCE
FENCE 3POST AND RAIL FENCE
FENCE 2STOCK PROOF FENCE
FENCE 4STRAND BARB WIRE FENCE
FENCE 5SECURE STOCK PROOF FENCE
FENCE 6MEATAL PALISADE FENCE
NO
WOODLAND - UNABLE TO SURVEY
UNABLE TO SURVEY
355500E
355400E
355300E
355200E
170000N
169900N
169800N
355500E
355400E
169700N
169600N
355300E
355200E
169500N
356000E
355800E
355700E
355900E
355800E
355700E
355900E
355600E355600E
356000E
169700N
169600N
169500N
LAGOON
STRAND PLAIN WIRE FENCE 1
STOCK PROOF FENCE 2
POST RAIL FENCE 3
STRAND BARB WIRE FENCE 4
SECURE STOCK PROOF FENCE 5
METAL PALISADE FENCE 6
CHAINLINK FENCE 7
PROPOSED FENCE
NO FENCE REQUIRED SUBSEQUENT TORISK ASSESSMENT 8
S
W E
N
ORIGINAL SHEET SIZE A3
NO UNAUTHORISED REPRODUCTION OR DISTRIBUTION OF THIS DRAWING WILL BE ALLOWED WITHOUT PRIOR PERMISSION OF THE VIRIDOR DRAWING OFFICE. TEL:01732 229200
ALL PENETRATIONS OF THE CAPPINGHAVE A 2.2m RADIUS ATEX ZONE 2AROUND THEM
OFF SITE BOREHOLES HAVE A 0.3mRADIUS ATEX ZONE 2 AROUND THEM
INTERNALLY, ALL ARE SUBJECT TOZONE 1 UNLESS OTHERWISE MARKED
42 KINGS HILL AVENUEKINGS HILL, WEST MALLING
KENT, ME19 4AJTel : 01732 229200Fax : 01732 229280
YANLEYLANDFILL
SITEFENCEPLAN
YAN 16000NTS
JAN 2010
MTGS
MLOGAN
YAN048s 12/01/10
Yanley Closed Landfill February 2012 Landfill Aftercare Closure Plan
Ref: Yanley_CP_2012 Page 28
APPENDIX 2 – Environmental Monitoring Location Plan

ASBESTOSAREA
WOODLAND - UNABLE TO SURVEY
UNABLE TO SURVEY
355500E
355400E
355300E
355200E
355500E
355400E
355300E
355200E
356000E
355800E
355700E
355900E
355800E
355700E
355900E
355600E355600E
356000E
170000N
169900N
169800N
169700N
169600N
169500N
YN606GM16.32 (CL)15.70 (GL)
YN356ALM41.03 (CL)39.22 (GL)
LAGOON
Weir
Col
liter
's Br
ook
Drain
FB
Collit
er's
Broo
k
Pond
FBWell
66.4m
SMSM
Hanging Hill Wood
SM
SM
LEACHATE MONITORING POINT
GAS MONITORING POINT
GROUND WATER MONITORING POINT
SURFACE WATER MONITORING POINT
NOISE MONITORING POSITION
(PL)
(CL)
(GL)
PLINTH LEVEL
COVER LEVEL
GROUND LEVEL
LEACHATE SUMP
AE
D
AD ASBESTOS FIBRE MONITORING
AERIAL EMISSIONS
DUST MONITORING
(DP) DIP LEVEL
DUAL GAS / GROUND WATER MONITORING POINT
F.I.D MONITORING POINT
DEPOSITIONAL DUST GUAGEDDG
25
AIR QUALITY MONITORING POINT
ORIGINAL SHEET SIZE A3 EMLP
BOREHOLE (MONITORING NOT REQUIRED)
S
GROUNDWATER PUMP CHAMBERSP
É
NO UNAUTHORISED REPRODUCTION OR DISTRIBUTION OF THIS DRAWING WILL BE ALLOWED WITHOUT PRIOR PERMISSION OF THE VIRIDOR DRAWING OFFICE. TEL:01732 229200
ALL PENETRATIONS OF THE CAPPINGHAVE A 2.2m RADIUS ATEX ZONE 2AROUND THEM
OFF SITE BOREHOLES HAVE A 0.3mRADIUS ATEX ZONE 2 AROUND THEM
INTERNALLY, ALL ARE SUBJECT TOZONE 1 UNLESS OTHERWISE MARKED
42 KINGS HILL AVENUEKINGS HILL, WEST MALLING
KENT, ME19 4AJTel : 01732 229200Fax : 01732 229280
YANLEYLANDFILL
ENVIRONMENTALMONITORING
LOCATION PLAN
YAN30001:2500
JAN 2010
MTGS
GS
A AQUIFER INFO ADDED
AT GS 03/06/10
YAN48/JAN'10
N
CELL BOUNDARYLICENSED AREA
S
W E
EP BOUNDARY
ENLARGED AREA

Yanley Closed Landfill February 2012 Landfill Aftercare Closure Plan
Ref: Yanley_CP_2012 Page 29
APPENDIX 3 – In-waste Gas Infrastructure Plan

LAGOONLAGOONLAGOON
WOODLAND - UNABLE TO SURVEY
355500E
355400E
355300E
355200E
170000N
169900N
169800N
355500E
355400E
169700N
169600N
355300E
355200E
169500N
356000E
355800E
355700E
355900E
355800E
355700E
355900E
355600E355600E
356000E
170000N
169900N
169800N
169700N
169600N
169500N
UN ABLE TO SURVEYUN ABLE TO SURVEY
YN606GM16.32 (CL)15.70 (GL)
1YN359CV
1YN367CV
1YN368CV
1YN354CV
LOCATIONS OF ALLSERVICES IS INDICATIVE ONLY.CAUTION MUST BE USED WHEN
WORKING IN THESE AREAS.
ORIGINAL SHEET SIZE A3
REDUCER
ISOLATION VALVE
400mm PIPE
KNOCKOUT POTS
SOAKAWAYNEW SOAKAWAYS IN APPROX POSITION
FLOW MONITORING BOX
NEW WELLS IN APPROX POSITION
LEACHATE MONITORING
GAS CONTROL WELL
125mm PIPE
315mm PIPE250mm PIPE
180mm PIPE
MANIFOLD
63mm PIPE90mm PIPE
NOTES1. ALL PIPE SIZES ARE O.D.2. POSITIONS OF ALL PIPEWORK AND NEW WELLSARE INDICATIVE ONLY
110mm PIPE
GAS CONTROL WELL (BURIED)
450mm PIPE
355mm PIPE
220mm PIPE
100mm PIPE
50mm PIPE32mm PIPE
MANIFOLD (BURIED)
PROPOSED PIPEWORK
BURIED PIPEWORK
GAS PIN WELL
AS FROM 20/03/07 THE FORMAT FOR GAS WELLIDENTIFICATION (AS APPROVED BY IAN MORRISH)WILL NOT BE SITE SPECIFIC AND TAKE THE FOLLOWING GENERIC FORM : SITE ID (3CHARACTERS OR 1 No. AND 2 CHARACTERS)
TYPE (2 CHARACTERS) IE: 1PK/001/CV (OR CH/TV/TH/TP)WELL No.(3 No.S) & WELL
GAS CONTROL WELL (DECOMMISSIONED)
HORIZONTAL PIPEWORKHORIZ
LEACHATE LEACHATE PIPEWORKCON CONDENSATE LINESAIR AIR LINES
500mm PIPE
S
SP
LEACHATE SUMPGROUNDWATER PUMP CHAMBER
NO UNAUTHORISED REPRODUCTION OR DISTRIBUTION OF THIS DRAWING WILL BE ALLOWED WITHOUT PRIOR PERMISSION OF THE VIRIDOR DRAWING OFFICE. TEL:01732 229200
ALL PENETRATIONS OF THE CAPPINGHAVE A 2.2m RADIUS ATEX ZONE 2AROUND THEM
OFF SITE BOREHOLES HAVE A 0.3mRADIUS ATEX ZONE 2 AROUND THEM
INTERNALLY, ALL ARE SUBJECT TOZONE 1 UNLESS OTHERWISE MARKED
42 KINGS HILL AVENUEKINGS HILL, WEST MALLING
KENT, ME19 4AJTel : 01732 229200Fax : 01732 229280
LEACHATE RECIRCULATION
YANLEYLANDFILL
GASLAYOUT
PLAN
YAN 4000NTS
JAN 2010
MTGS
JW
C REMOVED AND RENAMED WELLS.
MTGS JW APRIL 2011
YAN053s JAN 11
S
W E
N

Yanley Closed Landfill February 2012 Landfill Aftercare Closure Plan
Ref: Yanley_CP_2012 Page 30
APPENDIX 4 – Site Restoration and Settlement Contours

65
60
55
50
45
40
35
30
25
ORIGINAL SHEET SIZE A3
É
NO UNAUTHORISED REPRODUCTION OR DISTRIBUTION OF THIS DRAWING WILL BE ALLOWED WITHOUT PRIOR PERMISSION OF THE VIRIDOR DRAWING OFFICE. TEL:01732 229200
ALL PENETRATIONS OF THE CAPPINGHAVE A 2.2m RADIUS ATEX ZONE 2AROUND THEM
OFF SITE BOREHOLES HAVE A 0.3mRADIUS ATEX ZONE 2 AROUND THEM
INTERNALLY, ALL ARE SUBJECT TOZONE 1 UNLESS OTHERWISE MARKED
42 KINGS HILL AVENUEKINGS HILL, WEST MALLING
KENT, ME19 4AJTel : 01732 229200Fax : 01732 229280
YANLEYLANDFILL
APPROVED POSTSETTLEMENT
RESTORATION PLAN
YAN 110001:2500@A3
JAN 2010
MTGS
MLOGAN
YAN048s 12/01/10
S
W E
N
APPROVED POST SETTLEMENTRESTORATION CONTOURS
Yanley Closed Landfill February 2012 Landfill Aftercare Closure Plan
Ref: Yanley_CP_2012 Page 31
APPENDIX 5 – Asbestos Cell Location Plan


Yanley Closed Landfill February 2012 Landfill Aftercare Closure Plan
Ref: Yanley_CP_2012 Page 32
APPENDIX 6 – Contingency Action Plans

BUSINESS MANAGEMENT SYSTEM 6.4.410 Contingency Action Plan – Surface Water Quality - Visual
Group: Development and Technical Compliance Section: Environmental Compliance
Author: Beth DuffenApproval Status: APPROVED (CD)
Issue Status: One (1) 11/10/10Any updates will be shown in RED Reviewed: 11/10/10 (CD)Replaces N/A Next Review: 1Q2012
Purpose and Scope Routine monitoring of a site is a critical activity to ensure that the surface water quality standards are maintained and risks appropriately managed. A detailed assessment of the site risks will have been undertaken through the site’s Hydrogeological Risk Assessment, which includes an associated risk of the adjacent/receiving surface water environment. This Action Plan has been written to ensure that Viridor’s monitoring and management personnel are fully aware of the actions to take on observing a visible issue in a surface water network during routine or ad hoc monitoring visits/data analysis. Essential Starting Knowledge The requirement for contingency monitoring may be triggered by any of the following: the Unit Manager, the ESO, 3rd party concern (Environment Agency or call from member of the general public). It is essential that the Unit Manager and ESO establish: (a) what the concern is (suspended solids/oils/chemical); and (b) what watercourses are or could be affected by the incident, so that: (c) an immediate assessment of the likely risk arising from the incident is made, documented and actioned accordingly. It is essential that both the Unit Manager and ESO know the connecting routes/pathways and direction of movement along the routes for all surface water drainage off the site into the surrounding surface water environment and up to 1km away from the site. Essential Contacts If supplementary or contingency sampling of the surface water network is required, the ESO or Unit Manager must contact the Regional Environmental Manager to secure use of the contingency sampling kit retained in each region. The Regional Landfill Manager, Compliance Manager and Environment Manager should also be notified. Contingency Kit This kit should comprise: 50 PET 1 litre bottles 2 x permanent marker pens GPS Unit Hannah Instruments portable Ammoniacal Nitrogen meter Digital Camera
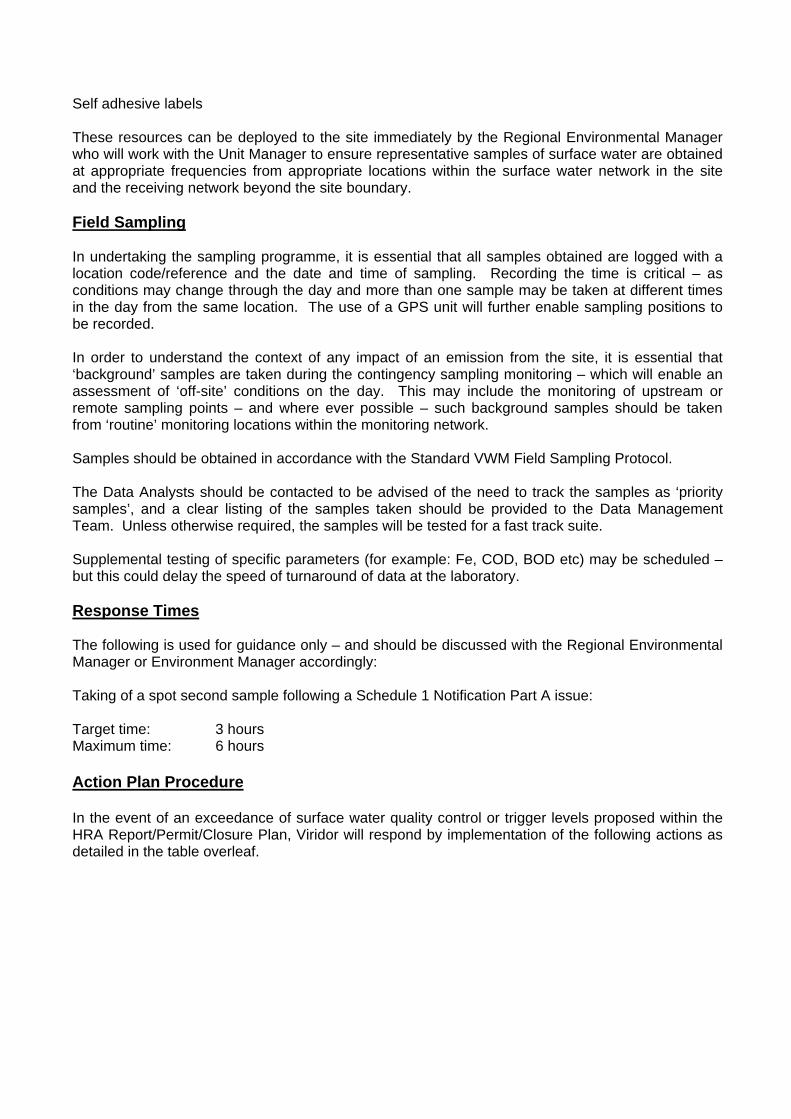
Self adhesive labels These resources can be deployed to the site immediately by the Regional Environmental Manager who will work with the Unit Manager to ensure representative samples of surface water are obtained at appropriate frequencies from appropriate locations within the surface water network in the site and the receiving network beyond the site boundary.
Field Sampling In undertaking the sampling programme, it is essential that all samples obtained are logged with a location code/reference and the date and time of sampling. Recording the time is critical – as conditions may change through the day and more than one sample may be taken at different times in the day from the same location. The use of a GPS unit will further enable sampling positions to be recorded. In order to understand the context of any impact of an emission from the site, it is essential that ‘background’ samples are taken during the contingency sampling monitoring – which will enable an assessment of ‘off-site’ conditions on the day. This may include the monitoring of upstream or remote sampling points – and where ever possible – such background samples should be taken from ‘routine’ monitoring locations within the monitoring network. Samples should be obtained in accordance with the Standard VWM Field Sampling Protocol. The Data Analysts should be contacted to be advised of the need to track the samples as ‘priority samples’, and a clear listing of the samples taken should be provided to the Data Management Team. Unless otherwise required, the samples will be tested for a fast track suite. Supplemental testing of specific parameters (for example: Fe, COD, BOD etc) may be scheduled – but this could delay the speed of turnaround of data at the laboratory. Response Times The following is used for guidance only – and should be discussed with the Regional Environmental Manager or Environment Manager accordingly: Taking of a spot second sample following a Schedule 1 Notification Part A issue: Target time: 3 hours Maximum time: 6 hours
Action Plan Procedure In the event of an exceedance of surface water quality control or trigger levels proposed within the HRA Report/Permit/Closure Plan, Viridor will respond by implementation of the following actions as detailed in the table overleaf.

Following exceedence of a Contingency Actions
Control Level Trigger Level
1 Notify Site Management and Environment Team
Management
2 Ensure closure of all affected surface water discharge
points and attempt to isolate affected area using storage / attenuation capacity within site
3 Undertake prompt visual inspection and sampling of the site’s surface water system(s) and discharge point(s) to further assess any issues at the site.
4 Confirm via inspection whether there has been any discernible offsite release of visual substances(s) into
the receiving watercourse
5 Notify Environment Agency via a Schedule 6 Notification (Part A)
6 Review data, site management and operations, and implement any actions that may prevent future
reoccurrence of the incident
7 Make appropriate arrangements to remove any residual visual substances from the system prior to re-
establishing discharge from the site
8 Notify Environment Agency of findings via a Schedule 6 Notification (Part B) that the contingency management and monitoring activities associated with the incident
have demonstrated that the issue has been addressed and the environmental risk posed by the site has
returned to “normal”
Key Performance Data Review Viridor will review and report via the Part B Schedule 1 / 6 Notification key performance data that may be related to an emission from the landfill installation including (but not limited to): The anomalous presence of any hazardous (List 1) Substances in surface water; Any rising trend in key List 2/non listed Substances (ammoniacal nitrogen/chloride); Any unexpected change in surface water flow rates; Any anomalous climatic event prior to the incident; and Any identified VWM or third party activity in the vicinity of the surface water
environment. Laboratory Retesting and Sampling In the event of a trigger breach event, Viridor will request the laboratory and field sampling teams to undertake the following works: Review of sample data for fundamental reporting or analysis error; and/or As required: Retest the original sample at the laboratory in order to confirm the
reported result; and/or

As required: Arrange for a second (re) sample to be obtained to assess a second result from key routine monitoring locations.
In the event that a contingency sample taken in the period identifies that the surface water quality has returned to be within the normal concentration range, the matter will be considered to be closed. Should, however, contingency sampling identify that the trigger breach persists or VWM identify anomalous performance of the key performance data (above), then Viridor will commence a programme of ‘supplementary’ actions that would be detailed in a “Monitoring Plan” prepared and issued by Viridor in response to the issue arising. Record Keeping It is essential to obtain and write up an accurate account of the incident, and the response instructions and times at which subsequent sampling was undertaken. Through the ‘priority samples’ protocol, there should be confirmation that the samples have been received at the laboratory and that the analysis is progressing.
Records
Record Responsibility Location Retention Time Authority for
Disposal MonitorPro Data
Base Environment and Aftercare Team
Server at Aintree House
7 Years
END

BUSINESS MANAGEMENT SYSTEM 6.4.402 Contingency Action Plan – Groundwater Quality
Group: Development and Technical Compliance Section: Environmental Compliance
Author: Chris DussekApproval Status: APPROVED (initials)
Issue Status: Two (2) 11/10/10Any updates will be shown in RED Reviewed: 11/10/10 (CI)Replaces N/A Next Review: 1Q2012
Purpose and Scope Routine monitoring of a site is a critical activity to ensure that the groundwater quality standards are maintained and risks appropriately managed. A detailed assessment of the site risks will have been undertaken through the site’s Hydrogeological Risk Assessment. This Action Plan has been written to ensure that Viridor’s monitoring and management personnel are fully aware of the actions to take on recording a groundwater quality exceedence during routine or ad hoc monitoring visits/data analysis.
Action Plan Procedure In the event of an exceedance of a groundwater quality control or trigger level proposed within the HRA Report/Permit/Closure Plan, Viridor will respond by implementation of the following actions as detailed in the table below.
Following exceedence of a Contingency Actions
Control Level Trigger Level
1 Notify Site Management and Environment Team
Management
2 Notify Environment Agency via a Schedule 6 Notification (Part A)
3 Review key performance monitoring information
4 Undertake laboratory QA review and, as required, undertake resampling if result differs from established
data set
5 Review data, site management and operations, and implement any actions to that may prevent future
failure of a control level
6 Notify Environment Agency of findings via a Schedule 6 Notification (Part B) and as required prepare and issue a “Monitoring Plan” for the period of any supplementary
monitoring
7 Undertake supplementary monitoring programme and report in accordance with the “Monitoring Plan”
8 Review (as required) existing conceptual model and hydrogeological risk assessment, control and trigger levels with regard to change in risks and source term management. If risks are unacceptable set in place procedures for implementing corrective measures in

consultation with and as required by the agency.
Key Performance Data Review Viridor will review and report via the Part B Schedule 1 / 6 Notification key performance data that may be related to an emission from the landfill installation including (but not limited to): The anomalous presence of any other Hazardous (List 1) Substances in groundwater; Any rising trend in key List 2/non listed Substances (ammoniacal nitrogen/chloride); Any unexpected change in groundwater levels; An unexpected and rapid change in leachate levels within the site (either positive or
negative); Any anomalous climatic event prior to the incident; and Any identified VWM or third party activity in the vicinity of the monitoring installation. Laboratory Retesting and Sampling In the event of a trigger breach event, Viridor will request the laboratory and field sampling teams to undertake the following works: Review of sample data for fundamental reporting or analysis error; and/or As required: Retest the original sample at the laboratory in order to confirm the
reported result; and/or As required: Arrange for a second (re) sample to be obtained to assess a second
result from the monitoring borehole. Due to retest turn around times, this data (where available) may not be reportable within the target 10 day turnaround time for production and submission of the Part B Schedule 1 / 6 Notification. In the event that a contingency sample taken in the period identifies that the groundwater quality has returned to be within the normal concentration range, the matter will be considered to be closed. Should, however, contingency sampling identify that the trigger breach persists or VWM identify anomalous performance of the key performance data (above), then Viridor will commence a programme of ‘supplementary’ actions that would be detailed in a “Monitoring Plan” prepared and issued by Viridor in response to the issue arising.
Records
Record Responsibility Location Retention Time Authority for
Disposal MonitorPro Data
Base Environment and Aftercare Team
Server at Aintree House
7 Years
END

BUSINESS MANAGEMENT SYSTEM 6.4.403 Contingency Action Plan – Surface Water Quality
Group: Development and Technical Compliance Section: Environmental Compliance
Author: Beth DuffenApproval Status: APPROVED (CD)
Issue Status: One (1) 11/10/10Any updates will be shown in RED Reviewed: 11/10/10 (CD)Replaces N/A Next Review: 1Q2012
Purpose and Scope Routine monitoring of a site is a critical activity to ensure that the surface water quality standards are maintained and risks appropriately managed. A detailed assessment of the site risks will have been undertaken through the site’s Hydrogeological Risk Assessment, which includes an associated risk of the adjacent/receiving surface water environment. This Action Plan has been written to ensure that Viridor’s monitoring and management personnel are fully aware of the actions to take on recording a surface water quality exceedence during routine or ad hoc monitoring visits/data analysis. Essential Starting Knowledge The requirement for contingency monitoring may be triggered by any of the following: the Unit Manager, the ESO, 3rd party concern (Environment Agency or call from member of the general public). It is essential that the Unit Manager and ESO establish: (a) what the concern is (suspended solids/oils/chemical); and (b) what watercourses are or could be affected by the incident, so that: (c) an immediate assessment of the likely risk arising from the incident is made, documented and actioned accordingly. It is essential that both the Unit Manager and ESO know the connecting routes/pathways and direction of movement along the routes for all surface water drainage off the site into the surrounding surface water environment and up to 1km away from the site. Essential Contacts If supplementary or contingency sampling of the surface water network is required, the ESO or Unit Manager must contact the Regional Environmental Manager to secure use of the contingency sampling kit retained in each region. The Regional Landfill Manager, Compliance Manager and Environment Manager should also be notified. Contingency Kit This kit should comprise: 50 PET 1 litre bottles 2 x permanent marker pens GPS Unit Hannah Instruments portable Ammoniacal Nitrogen meter Digital Camera

Self adhesive labels These resources can be deployed to the site immediately by the Regional Environmental Manager who will work with the Unit Manager to ensure representative samples of surface water are obtained at appropriate frequencies from appropriate locations within the surface water network in the site and the receiving network beyond the site boundary.
Field Sampling In undertaking the sampling programme, it is essential that all samples obtained are logged with a location code/reference and the date and time of sampling. Recording the time is critical – as conditions may change through the day and more than one sample may be taken at different times in the day from the same location. The use of a GPS unit will further enable sampling positions to be recorded. In order to understand the context of any impact of an emission from the site, it is essential that ‘background’ samples are taken during the contingency sampling monitoring – which will enable an assessment of ‘off-site’ conditions on the day. This may include the monitoring of upstream or remote sampling points – and where ever possible – such background samples should be taken from ‘routine’ monitoring locations within the monitoring network. Samples should be obtained in accordance with the Standard VWM Field Sampling Protocol. The Data Analysts should be contacted to be advised of the need to track the samples as ‘priority samples’, and a clear listing of the samples taken should be provided to the Data Management Team. Unless otherwise required, the samples will be tested for a fast track suite. Supplemental testing of specific parameters (for example: Fe, COD, BOD etc) may be scheduled – but this could delay the speed of turnaround of data at the laboratory. Response Times The following is used for guidance only – and should be discussed with the Regional Environmental Manager or Environment Manager accordingly: Taking of a spot second sample following a Schedule 1 Notification Part A issue: Target time: 24 hours Maximum time: 48 hours
Action Plan Procedure In the event of an exceedance of surface water quality control or trigger levels proposed within the HRA Report/Permit/Closure Plan, Viridor will respond by implementation of the following actions as detailed in the table below.
Following exceedence of a Contingency Actions
Control Level Trigger Level
1 Notify Site Management and Environment Team
Management, and initiate on-site isolation procedures
2 Notify Environment Agency via a Schedule 6 Notification (Part A)

3 Review key performance monitoring information,
4 Where required, arrange for prompt visual inspection and sampling of the site’s surface water system(s), discharge point(s) and receiving watercourse(s) to
further assess any issues at the site.
5 Undertake laboratory QA review and, as required, undertake resampling if result differs from established
data set
6 Review data, site management and operations, and implement any actions that may prevent future failure
of a control level
7 Notify Environment Agency of findings via a Schedule 6 Notification (Part B) and as required prepare and issue a “Monitoring Plan” for the period of any supplementary
monitoring
8 Review (as required) existing conceptual model and hydrogeological risk assessment, control and trigger levels with regard to change in risks and source term management. If risks are unacceptable set in place procedures for implementing corrective measures in
consultation with and as required by the agency.
Key Performance Data Review Viridor will review and report via the Part B Schedule 1 / 6 Notification key performance data that may be related to an emission from the landfill installation including (but not limited to): The anomalous presence of any hazardous (List 1) Substances in surface water; Any rising trend in key List 2/non listed Substances (ammoniacal nitrogen/chloride); Any unexpected change in surface water flow rates; Any anomalous climatic event prior to the incident; and Any identified VWM or third party activity in the vicinity of the surface water
environment. Laboratory Retesting and Sampling In the event of a trigger breach event, Viridor will request the laboratory and field sampling teams to undertake the following works: Review of sample data for fundamental reporting or analysis error; and/or As required: Retest the original sample at the laboratory in order to confirm the
reported result; and/or As required: Arrange for a second (re) sample to be obtained to assess a second
result from key routine monitoring locations. In the event that a contingency sample taken in the period identifies that the surface water quality has returned to be within the normal concentration range, the matter will be considered to be closed. Should, however, contingency sampling identify that the trigger breach persists or VWM identify anomalous performance of the key performance data (above), then Viridor will commence

a programme of ‘supplementary’ actions that would be detailed in a “Monitoring Plan” prepared and issued by Viridor in response to the issue arising. Record Keeping It is essential to obtain and write up an accurate account of the incident, and the response instructions and times at which subsequent sampling was undertaken. Through the ‘priority samples’ protocol, there should be confirmation that the samples have been received at the laboratory and that the analysis is progressing. Information Release Data obtained from any contingency sampling should only be released with the permission of the Environment Manager or Director of Environmental Compliance.
Records
Record Responsibility Location Retention Time Authority for
Disposal MonitorPro Data
Base Environment and Aftercare Team
Server at Aintree House
7 Years
END

BUSINESS MANAGEMENT SYSTEM 6.4.401 Contingency Action Plan – Leachate Levels
Group: Development and Technical Compliance Section: Environmental Compliance
Author: Chris DussekApproval Status: APPROVED (BD)
Issue Status: Two (2) 14/10/10Any updates will be shown in RED Reviewed: 14/10/10 (BD)Replaces N/A Next Review: 1Q2012
Purpose and Scope Routine monitoring of a site is a critical activity to ensure that the leachate levels on site are known and risks appropriately managed. This Action Plan has been written to ensure that Viridor’s monitoring and management personnel are fully aware of the actions to take on recording a leachate level exceedence during routine or ad hoc monitoring visits/data analysis. Action Plan Procedure In the event of an exceedance of a leachate head control or trigger level proposed within the HRA Report/Permit/Closure Plan and – where prepared – Leachate Systems Management Plan, Viridor will respond by implementation of the following actions as detailed in the table below.
Following exceedence of a Contingency Actions
Control Level Trigger Level
1 Notify Site Management and Environment Team
Management
2 Notify Environment Agency via a Schedule 6 Notification (Part A)
3 Review existing management systems monitoring
information including leachate head changes, pumping volumes, system performance and associated works
on site
4 Review site management and operations, and implement actions to prevent future exceedence of a
management level.
5 Review the assumptions incorporated into the site water balance/leachate production rates/leachate
extraction rates
6 Identify timescale for reduction of head(s)
7 Notify Environment Agency of findings via a Schedule 6 Notification (Part B) and as required prepare and issue a “Monitoring Plan” for the period of any supplementary
monitoring
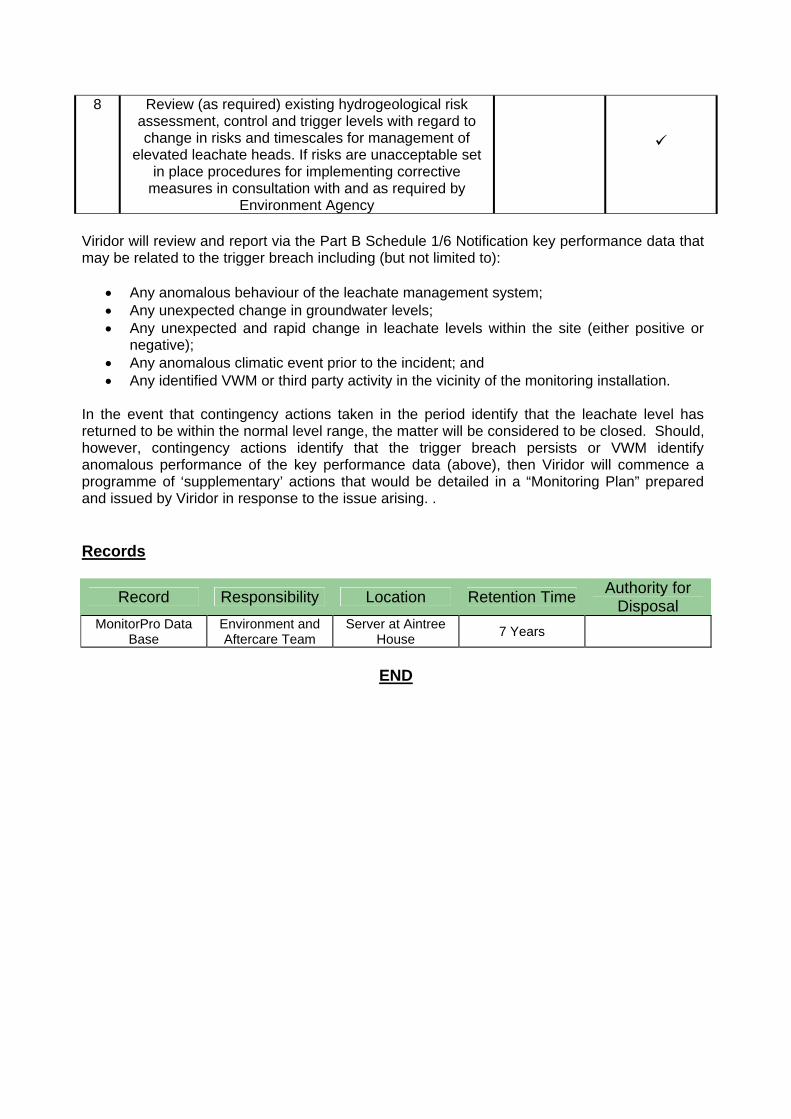
8 Review (as required) existing hydrogeological risk assessment, control and trigger levels with regard to change in risks and timescales for management of
elevated leachate heads. If risks are unacceptable set in place procedures for implementing corrective
measures in consultation with and as required by Environment Agency
Viridor will review and report via the Part B Schedule 1/6 Notification key performance data that may be related to the trigger breach including (but not limited to):
Any anomalous behaviour of the leachate management system; Any unexpected change in groundwater levels; Any unexpected and rapid change in leachate levels within the site (either positive or
negative); Any anomalous climatic event prior to the incident; and Any identified VWM or third party activity in the vicinity of the monitoring installation.
In the event that contingency actions taken in the period identify that the leachate level has returned to be within the normal level range, the matter will be considered to be closed. Should, however, contingency actions identify that the trigger breach persists or VWM identify anomalous performance of the key performance data (above), then Viridor will commence a programme of ‘supplementary’ actions that would be detailed in a “Monitoring Plan” prepared and issued by Viridor in response to the issue arising. .
Records
Record Responsibility Location Retention Time Authority for
Disposal MonitorPro Data
Base Environment and Aftercare Team
Server at Aintree House
7 Years
END
Yanley Closed Landfill February 2012 Landfill Aftercare Closure Plan
Ref: Yanley_CP_2012 Page 33
APPENDIX 7 – Stability Risk Assessment

Viridor Waste Management Limited i SLR Ref: 402-0036-00322 Yanley Landfill Closure Plan SRA October 2007
SLR
YANLEY LANDFILL CLOSURE PLAN
STABILITY RISK ASSESSMENT
CONTENTS
1.0 INTRODUCTION AND SUMMARY ............................................................................... 1 2.0 WASTE MASS STABILITY ........................................................................................... 2
2.1 Waste Mass Stability Risk Screening............................................................... 2 2.2 Slope Stability..................................................................................................... 2 2.3 Volumetric Stability (Settlement) ...................................................................... 7 2.4 Site Infrastructure .............................................................................................. 7 2.5 Restored Surface Monitoring ............................................................................ 8
TABLES
Table 2-1 Geotechnical Parameter Values.......................................................................... 3 Table -2-2 Interface Parameters........................................................................................... 3 Table 2-3 Summary of Waste Stability Analysis for Mode 1 ............................................. 5
APPENDICES
Appendix 1: Waste Mass Stability Analyses Appendix 2: Capping Stability Analyses

Viridor Waste Management Limited 1 SLR Ref: 402-0036-00322 Yanley Landfill Closure Plan SRA October 2007
SLR
1.0 INTRODUCTION AND SUMMARY
This report constitutes the Stability Risk Assessment (SRA) of the closure plan for Yanley non-hazardous waste landfill (hereon referred to as Yanley). It has been carried out to assess the long term stability of the waste mass and capping system.
The site was originally operated under a waste management licence until 2003 when the site area was completed and restored. A subsequent IPPC permit granted in 2004 allowed the extension of the site to the south and overtipping of existing waste.
An asbestos monocell is present in the southern corner of the extension area.
Areas of stockpile are currently present over restored areas of the landfill. These are being processed and will be removed prior to definitive closure.

Viridor Waste Management Limited 2 SLR Ref: 402-0036-00322 Yanley Landfill Closure Plan SRA October 2007
SLR
2.0 WASTE MASS STABILITY
For the purposes of this report, the physical stability of a waste mass is deemed to require consideration of:
• The stability of any slopes present and/or the stability of any capping materials placed upon the waste slopes.
• The volumetric stability of the overall waste mass i.e. the degree of settlement that could occur in the long term and its potential effect on site infrastructure such as gas/leachate extraction systems.
2.1 Waste Mass Stability Risk Screening
2.1.1 General Waste Characteristics
The landfill contains household and non-hazardous commercial and industrial wastes. The asbestos monocell in the southern corner of the site contains all forms of waste identified as containing asbestos.
2.2 Slope Stability
The Yanley restoration slopes are defined as those which are permanent and will be capped. These slopes occur both within the centre and along the flanks of the site.
2.2.1 Description of Critical Slopes and Capping Systems
The critical restoration slopes are located on the northwest edge of the southern extension area. Here the pre-settled slopes are formed at a maximum inclination of approximately 1V:2.6H, to a maximum height of 20m.
To date restoration slopes have been capped with a lower regulation layer, an 1000mm thick engineered clay cap with a maximum permeability of 1x10⁻⁹ms-1 and with a minimum 1000mm of overlying restoration soils. Land drains are installed at regular intervals in the restoration soils to maintain a low Parallel Submerged Ratio (PSR) within the capping system and aid stability.
As an alternative to a mineral capping system, a geosynthetic cap has also been considered. This comprises the following elements:
• 300-700mm thick site derived topsoil • 500mm thick subsoil or regulation layer composed of site derived subsoil / reworked
Mercia Mudstone
• 300mm thick further regulation layer composed of reworked Mercia Mudstone • 1mm thick textured VFPE geomembrane • 300mm regulation layer composed of reworked Mercia Mudstone
2.2.2 Assessment Requirements
It is considered necessary to undertake assessment of the long-term stability of the restoration slopes and capping systems placed against these slopes.
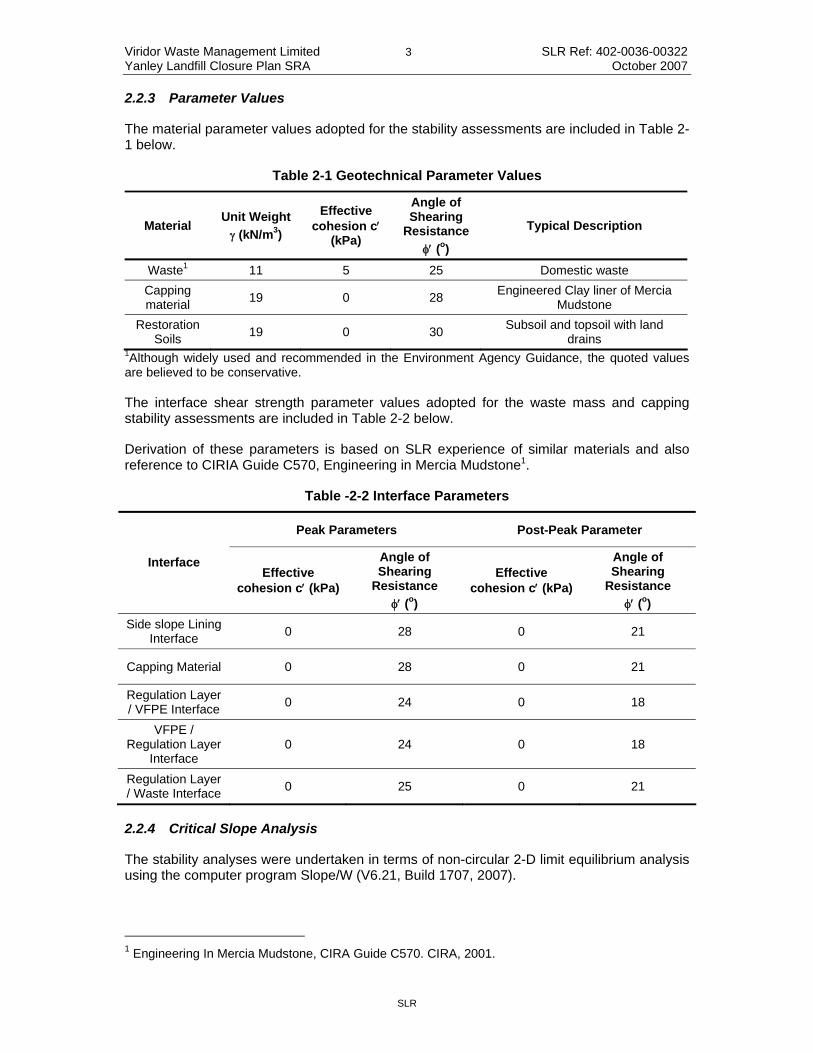
Viridor Waste Management Limited 3 SLR Ref: 402-0036-00322 Yanley Landfill Closure Plan SRA October 2007
SLR
2.2.3 Parameter Values
The material parameter values adopted for the stability assessments are included in Table 2-1 below.
Table 2-1 Geotechnical Parameter Values
Material Unit Weight
γ (kN/m3)
Effective cohesion c′
(kPa)
Angle of Shearing
Resistance
φ′ (o)
Typical Description
Waste1 11 5 25 Domestic waste
Capping material
19 0 28 Engineered Clay liner of Mercia
Mudstone
Restoration Soils
19 0 30 Subsoil and topsoil with land
drains 1Although widely used and recommended in the Environment Agency Guidance, the quoted values are believed to be conservative.
The interface shear strength parameter values adopted for the waste mass and capping stability assessments are included in Table 2-2 below.
Derivation of these parameters is based on SLR experience of similar materials and also reference to CIRIA Guide C570, Engineering in Mercia Mudstone1.
Table -2-2 Interface Parameters
Peak Parameters Post-Peak Parameter
Interface Effective
cohesion c′ (kPa)
Angle of Shearing
Resistance
φ′ (o)
Effective cohesion c′ (kPa)
Angle of Shearing
Resistance
φ′ (o)
Side slope Lining Interface
0 28 0 21
Capping Material 0 28 0 21
Regulation Layer / VFPE Interface
0 24 0 18
VFPE / Regulation Layer
Interface 0 24 0 18
Regulation Layer / Waste Interface
0 25 0 21
2.2.4 Critical Slope Analysis
The stability analyses were undertaken in terms of non-circular 2-D limit equilibrium analysis using the computer program Slope/W (V6.21, Build 1707, 2007).
1 Engineering In Mercia Mudstone, CIRA Guide C570. CIRA, 2001.

Viridor Waste Management Limited 4 SLR Ref: 402-0036-00322 Yanley Landfill Closure Plan SRA October 2007
SLR
Waste Mass Restoration Slopes
The critical restoration slopes modelled are formed on the north western flank of the southern extension area. The model incorporates:
• A Mercia Mudstone base and side slope (modelled at an inclination of 1V:5H). • A side slope and basal liner interface representing a zone of weakness within the lining
system.
• A composite waste slope incorporating a 20m high, 1V:2.6H inclination lower slope; a 4m high, 1V:4.25H inclination mid-slope; and a horizontal slope crest.
• Conservative effective shear strength parameters have been adopted for all materials in the waste mass and interfaces within the lining system (see Tables 2-1 and 2-2 above).
In considering the stability of the waste mass, the stability and integrity of the lining system would normally be considered as they are intrinsically linked. The three potential modes of failure considered are:
• Mode 1 - Critical slip surfaces passing solely through the waste. • Mode 2 - Critical slip surfaces passing through the waste and along the basal liner. • Mode 3 - Critical slip surfaces passing down through the side slope lining system and
along the basal lining system.
Inspection of the worst case restoration profile indicates that Mode 3 failure is not considered a possible failure scenario. Mode 1 and Mode 2 analyses have been considered for a long term residual condition.
It has been noted that the current leachate trigger level is set at 1m above the base of the landfill. However, subject to agreement, this may be raised to 5m. Therefore a more conservative leachate head of 5m has been applied to the models in the analyses.
Whilst it has been assumed that the leachate head on the base of the landfill is controlled to a maximum level of 5m, within the body of the waste, pore fluid pressures may exist. Pore fluid pressure is the combined effect of water and gas pressures. The distribution of pore fluid pressure varies within the waste mass due to a number of factors, including under drainage, nature of the waste, presence of perched water tables and the presence of a gas extraction system. In order to model the pore fluid pressures in the waste mass, the analysis has assumed that the pore water pressures within the waste will either:
• simply reflect the basal leachate level; or, • be represented by a pore water pressure ratio (ru) of 0.1 to allow for pore fluid
pressures to build up within the waste mass above the basal leachate level. The critical basal interface is always assumed to have a pore water pressure equal to the assumed leachate level.
The output plots from the analyses are presented as Appendix 1.

Viridor Waste Management Limited 5 SLR Ref: 402-0036-00322 Yanley Landfill Closure Plan SRA October 2007
SLR
Mode 1 Waste Mass Analysis
The results of the Mode 1 analysis is summarised in Table 2-3 below with outputs presented in Appendix 1.
Table 2-3 Summary of Waste Stability Analysis for Mode 1
Figure File Method Pore Water Pressure Ratio ru
Factor of Safety
Comments
1-1 YANCPWM01A Drained Circular
0 1.623 Failure wholly within waste mass. Acceptable (FOS >1.3).
1-2 YANCPWM01B Drained Circular
0.1 1.611 Failure wholly within waste mass. Acceptable (FOS >1.3).
Cases 1-1 and 1-2 assessed the stability of the waste mass where failure surfaces were modelled wholly within the waste. The analysis was used to assess the reduction in the factor of safety between the anticipated effective stresses for varying pore fluid pressure conditions within the waste mass. Both analyses returned acceptable factors of safety for failure solely within the waste mass.
Mode 2 Waste Mass Analysis
As a final check a stability analysis considering failure through the waste mass and along the basal and side slope lining system.
The pore fluid pressures in the waste, as previously assumed for the Mode 1 analysis, have been applied for the investigation of Mode 2. A worst case long term scenario has been considered, with post peak shear strength parameters for the interface within the lining system and elevated pore pressures within the waste. This is presented as Case 1-3 in Appendix 1 and results in a factor of safety of 1.556 which is considered acceptable.
2.2.5 Capping System Stability/Integrity Analyses
The critical restoration slope for capping is considered to be the same as in the waste mass analysis. The same limit equilibrium model has been used in the analyses.
Mineral Capping System
An initial analysis, presented as Case 2-1, was carried out with capping materials placed directly on the 20m high presettlement gradient of 1V:2.6H. A piezometric surface 0.4m above the base of the placed the restoration soils (equivalent to a PSR of 0.4) has also been included to demonstrate the effect of the land drains within the cap. This returns an unacceptable factor of safety of 1.155. Therefore two options will be available at the time of restoration.
• Cap the waste mass temporarily until the waste has settled to a sufficiently shallow gradient. (this could be achieved with a geomembrane weighted with tyres or sand bags).
• Regrade the waste to a shallower gradient prior to capping and restoration.
To demonstrate the stability of the capping system in both scenarios detailed above a second model, Case 2-2, has been analysed using peak effective strength parameters within

Viridor Waste Management Limited 6 SLR Ref: 402-0036-00322 Yanley Landfill Closure Plan SRA October 2007
SLR
the capping system. A reduction of the waste height by 4m results in a reduced gradient of 1V:3.2H. With the same groundwater conditions applied, a factor of safety of 1.478 is achieved and this is considered acceptable.
The analysis carried out in Case 2-2 is not the minimum condition that will achieve an acceptable factor of safety with peak conditions. The worst case geometry is driven by the post peak condition. A final analysis has been carried out to demonstrate the long term stability of post settlement restoration slopes. The model used in Case 2-2 has been used with post-peak strength parameters for the engineered cap and ru of 0.2 in this material to represent long term partial saturation. This model is considered to demonstrate a post-settlement condition if no regrading of the waste is carried out.
Case 2-3, described above returns a factor of safety of 1.004. This is above unity, and is therefore considered acceptable for long term conditions where post peak parameters are used.
Geomembrane Capping System
The geomembrane capping assessment was undertaken using the methods proposed by Jones and Dixon2 and Jones and Pine3. The equations developed by these authors were input into Microsoft Excel spreadsheets for processing. The analysis of the effects of construction plant on the geomembrane component of the capping system was undertaken using the method proposed by Kerkes4 and the equations developed were input into Microsoft Excel Spreadsheets for processing.
The same maximum presettlement slopes were applied in this scenario as were used in the mineral capping analyses; a vertical slope height of 20m at a gradient of 1V:2.6H. A Parallel Submerged Ratio (PSR) of 0.5 was used in the analyses to demonstrate the impact of the relatively poor draining Mercia Mudstone regulation layer.
The impermeable barrier is provided by a 1mm textured VFPE geomembrane. The results of the analysis are presented in Table 2-1 in Appendix 2. Case 1 demonstrates the factors of safety achieved for the individual interfaced at the proposed capping gradient. These are all below the acceptable value of 1.3 for peak conditions.
Subsequent analyses, – Cases 2 to 4, – demonstrate slacker gradients. Acceptable factors of safety are achieved at a gradient of 1V:4H. This is equivalent to 7m of settlement across the entire waste mass. Post peak analyses have also been carried out and acceptable factors of safety are also achieved at a gradient of 1V:4H.
An analysis has also been undertaken to determine if construction plant can be operated on a 1V:4H gradient without causing instability. This condition has been assessed assuming a limiting tension in the geomembrane of 5kN/m and a typical unit of plant for such work, such as a CAT D6D LGP bulldozer.
2 Jones, D.R.V. & Dixon, N, ‘The stability of geosynthetic landfill lining systems’ Geotechnical Engineering of Landfills, Thomas Telford, London, 1998. 3 Jones, D.R.V. & Pine, R.J., ‘design of inclined geosynthetic lining systems for vertical landfill expansion’ Proc. 8th Int. Waste Management and Landfill Symposium, 2001. 4 Kerkes, D.J., (1999), ‘Analysis of equipment loads on geocomposite liner systems’, Proc. Geosynthetics 1999.

Viridor Waste Management Limited 7 SLR Ref: 402-0036-00322 Yanley Landfill Closure Plan SRA October 2007
SLR
A summary of the analysis is presented as Table 2-2 in Appendix 2. The analysis indicates a factor of safety of 1.31 is achieved for an initial layer thickness of 0.6m, which is considered acceptable.
Based on the assessment of the two alternative capping systems, a mineral cap can be placed on a steeper waste gradient; therefore, from a stability perspective, this is the more favourable option.
2.3 Volumetric Stability (Settlement)
2.3.1 Waste Consolidation/Settlement Characteristics
The placement of the waste in layers results in the mixing of the different materials which reduces the risk that a large volume of a particular type of waste will be concentrated in a single area. In this sense, the non-hazardous waste mass can be considered effectively homogenous, hence the risk of significant differential settlement occurring is minimised and with it the potential for loss of integrity of the cap. A summary of data reported in the Environment Agency Guidance indicates that a reasonable figure for total settlement would be 25%.
Settlement of stable non-reactive hazardous waste within the asbestos monocell in the south of the site will not be as great. A predicted figure for total settlement of this material is 10%. As a result final presettlement levels will be reduced in this cell to accommodate the reduced degree of settlement. This will ensure post-settlement contours are uniform in both waste areas and will prevent the build up of excessive strains that may compromise the integrity of the capping system.
2.3.2 Assessment Requirements
In overall terms, the degree of settlement that could occur in the future at the site is considered to be within the limitations allowed for in the original design. For example, the low permeability element of the cap can sustain considerable straining and remoulding as a result of differential settlements before the integrity of the material would be compromised. Furthermore, the routing of gas extraction pipework is designed to accommodate differential settlements where the pipework crosses from the waste to non-waste areas.
Given the foregoing, it is concluded that there is no requirement to consider the potential influence of volumetric stability on the capping system or site infrastructure.
2.4 Site Infrastructure
2.4.1 Slope Stability
There is no requirement to present any proposals for restored surface infrastructure management relating to slope stability issues since the need to do so has been considered in Section 2.2 above.
2.4.2 Settlement (Volumetric Stability)
There is no requirement to present any proposals for restored surface infrastructure management relating to settlement issues since the need to do so has been screened out in Section 2.3.2 above.

Viridor Waste Management Limited 8 SLR Ref: 402-0036-00322 Yanley Landfill Closure Plan SRA October 2007
SLR
2.5 Restored Surface Monitoring
2.5.1 Slope Stability
The long term factors of safety of the capped critical slopes have been determined to be acceptable and measures to ensure stability of the capping in the short term have been presented (Section 2.2 above). Depending on the approach taken to capping the site different monitoring requirements will be necessary. If the waste is to be temporarily capped until sufficiently shallow gradients are achieved, regular surveys will be required to identify when the waste mass reaches the necessary gradient for permanent capping works to be undertaken.
If the waste mass is to be regraded prior to capping no further monitoring of the capping system will be necessary.
2.5.2 Settlement (Volumetric Stability)
There is no identifiable requirement to present any proposals for restored surface monitoring relating to settlement since the need to do so has been screened out in Section 2.3.2 above. Notwithstanding this, Schedule 3 to the Landfill Regulations 2002 stipulates that the 'settling behaviour of the landfill body' should be subject to topographical monitoring on a yearly basis.

Yanley Closed Landfill February 2012 Landfill Aftercare Closure Plan
Ref: Yanley_CP_2012 Page 34
APPENDIX 8 – Hydrogeological Risk Assessment Review July 09

Yanley Landfill Long Ashton, North Somerset
Hydrogeological Risk Assessment
402-0036-00304-20
July 2009

Viridor Waste Management i 402.0036.00304.20 Yanley Landfill: Hydrogeological Risk Assessment July 2009
SLR
CONTENTS
1.0 INTRODUCTION............................................................................................................ 1 1.1 Report Context ................................................................................................... 1 1.2 Project Objectives and Structure...................................................................... 2
2.0 CONCEPTUAL HYDROGEOLOGICAL SITE MODEL ................................................. 3 2.1 Source ................................................................................................................. 3 2.2 Development of the Installation ........................................................................ 3 2.3 Containment System Design and Construction .............................................. 3 2.4 Pathways............................................................................................................. 7 2.5 Receptors.......................................................................................................... 12 2.6 Summary of Site Conceptual Model ............................................................... 13
3.0 HYDROGEOLOGICAL RISK ASSESSMENT............................................................. 15 3.1 The Nature of the Hydrogeological Risk Assessment .................................. 15 3.2 The proposed Assessment Scenarios ........................................................... 15 3.3 Numerical Modelling ........................................................................................ 16 3.4 Model Parameterisation................................................................................... 16 3.5 Emissions to Groundwater.............................................................................. 17
4.0 REQUISITE SURVEILLANCE..................................................................................... 18 4.1 Leachate Monitoring Schedule ....................................................................... 18 4.2 Groundwater Monitoring Schedule................................................................. 19 4.3 Surface Water Monitoring Schedule............................................................... 22
5.0 CONCLUSIONS........................................................................................................... 23
TABLES
Table 2-1 Comparison of Modelled Source Term Concentrations and Leachate Monitoring Data to Date...................................................................................... 5
Table 2-2 List I Substances Detected in Leachate............................................................. 6 Table 2-3 Summary of Background Groundwater Quality Data ..................................... 10 Table 2-4 Derivation of Environmental Assessment Limits, for the Mercia Mudstone
Aquifer................................................................................................................ 13 Table 2-5 Summary of Conceptual Hydrogeological Model............................................ 14 Table 3-1 List I Substances: Maximum Predicted 95%ile Concentrations at the Base of
the Unsaturated Zone (mg/l)............................................................................. 17 Table 3-2 List II Substances: Maximum Predicted 95%ile Concentrations in
Groundwater beneath the Ashton / Longmoor Brooks (mg/l)....................... 17 Table 4-1 Current and Proposed Leachate Monitoring Schedule .................................. 18 Table 4-2 Current and Proposed Groundwater Monitoring Schedule........................... 20 Table 4-3 Revised Trigger Levels for List I Substances................................................. 21 Table 4-4 Revised Control and Trigger Levels for List II Substances............................ 21 Table 4-5 Proposed Surface Water Monitoring Schedule ............................................... 22

Viridor Waste Management ii 402.0036.00304.20 Yanley Landfill: Hydrogeological Risk Assessment July 2009
SLR
DRAWINGS
Drawing HRA1 Conceptual Hydrogeological Site Model 1
Drawing HRA2 Conceptual Hydrogeological Site Model 2
APPENDICES
Appendix HRA1 Leachate Quality Data and Times Series Plots Appendix HRA2 Leachate Hydrographs Appendix HRA3 Groundwater Hydrographs Appendix HRA4 Groundwater Quality Data and Times Series Plots Appendix HRA5 Model Parameterisation Tables Appendix HRA6 Electronic copies of all Models, Inputs and Results Appendix HRA7 Groundwater Contingency Action Plan Appendix HRA8 Drawing No. YAN3000, which shows the location of the
environmental monitoring points
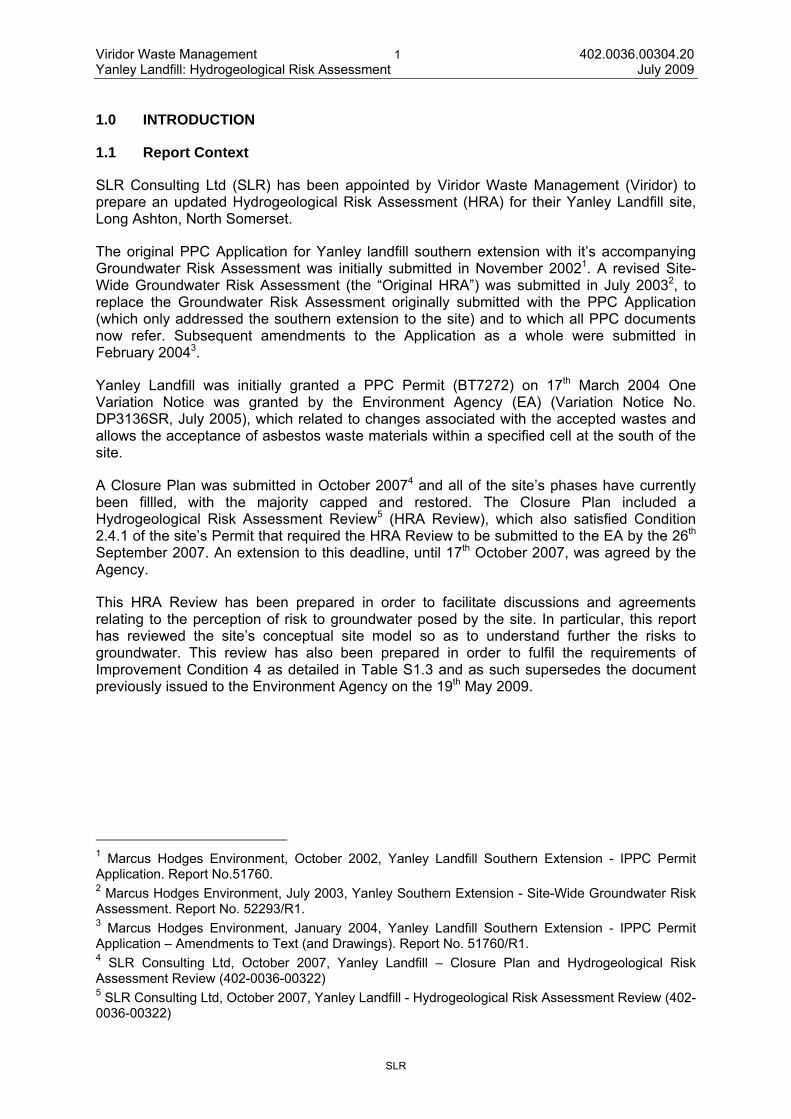
Viridor Waste Management 1 402.0036.00304.20 Yanley Landfill: Hydrogeological Risk Assessment July 2009
SLR
1.0 INTRODUCTION
1.1 Report Context
SLR Consulting Ltd (SLR) has been appointed by Viridor Waste Management (Viridor) to prepare an updated Hydrogeological Risk Assessment (HRA) for their Yanley Landfill site, Long Ashton, North Somerset.
The original PPC Application for Yanley landfill southern extension with it’s accompanying Groundwater Risk Assessment was initially submitted in November 20021. A revised Site-Wide Groundwater Risk Assessment (the “Original HRA”) was submitted in July 20032, to replace the Groundwater Risk Assessment originally submitted with the PPC Application (which only addressed the southern extension to the site) and to which all PPC documents now refer. Subsequent amendments to the Application as a whole were submitted in February 20043.
Yanley Landfill was initially granted a PPC Permit (BT7272) on 17th March 2004 One Variation Notice was granted by the Environment Agency (EA) (Variation Notice No. DP3136SR, July 2005), which related to changes associated with the accepted wastes and allows the acceptance of asbestos waste materials within a specified cell at the south of the site.
A Closure Plan was submitted in October 20074 and all of the site’s phases have currently been fillled, with the majority capped and restored. The Closure Plan included a Hydrogeological Risk Assessment Review5 (HRA Review), which also satisfied Condition 2.4.1 of the site’s Permit that required the HRA Review to be submitted to the EA by the 26th September 2007. An extension to this deadline, until 17th October 2007, was agreed by the Agency.
This HRA Review has been prepared in order to facilitate discussions and agreements relating to the perception of risk to groundwater posed by the site. In particular, this report has reviewed the site’s conceptual site model so as to understand further the risks to groundwater. This review has also been prepared in order to fulfil the requirements of Improvement Condition 4 as detailed in Table S1.3 and as such supersedes the document previously issued to the Environment Agency on the 19th May 2009.
1 Marcus Hodges Environment, October 2002, Yanley Landfill Southern Extension - IPPC Permit Application. Report No.51760. 2 Marcus Hodges Environment, July 2003, Yanley Southern Extension - Site-Wide Groundwater Risk Assessment. Report No. 52293/R1. 3 Marcus Hodges Environment, January 2004, Yanley Landfill Southern Extension - IPPC Permit Application – Amendments to Text (and Drawings). Report No. 51760/R1. 4 SLR Consulting Ltd, October 2007, Yanley Landfill – Closure Plan and Hydrogeological Risk Assessment Review (402-0036-00322) 5 SLR Consulting Ltd, October 2007, Yanley Landfill - Hydrogeological Risk Assessment Review (402-0036-00322)

Viridor Waste Management 2 402.0036.00304.20 Yanley Landfill: Hydrogeological Risk Assessment July 2009
SLR
1.2 Project Objectives and Structure
1.2.1 Project Objectives
This report reviews the previously submitted HRA Review5 and, in line with the EA’s standard requirements for Closure Plans6, establishes that;
• the infrastructure and procedures are in place for the management and monitoring of leachate and groundwater during the aftercare phase; and that
• procedures are in place for reporting any significant environmental effects during the aftercare phase.
This review also provides an appropriate opportunity to determine whether the requisite surveillance originally proposed in 2007 remains relevant, particularly within the context of reviewing the site’s hydrogeological conceptual model.
1.2.2 Defining Significant Environmental Effects
It is considered that significant environmental effects for Yanley Landfill should be determined, for the purposes of this report, by the landfill’s compliance with the requirements of the Groundwater Regulations, 1998 i.e. that there will be no entry of List I Substances to groundwater and no pollution of groundwater by List II Substances. However, it should be recognised that there is ongoing debate regarding the applicability of the Groundwater Regulations, 1998, for closed landfills sites.
Another relevant aspect is that the Groundwater Regulations, 1998, are due to be replaced this year by revised 2009 Regulations and these do have revised requirements.
This document should be read in conjunction with the associated commentary provided in the Annual Environmental Reviews submitted to the EA by Viridor and covering the following dates:
• 2006 Annual Environmental Review covering the period 1st January 2006 to 31st March 2007;
• 2007 Annual Environmental Review covering the period 1st January 2007 to 31st December 2007; and
• 2008 Annual Environmental Review covering the period 1st January 2008 to 31st December 2008.
For ease of reference, the environmental monitoring plan is also presented in Appendix HRA7, which shows the location of the discussed monitoring points.
6 For example, as set out in Section 8 of Environment Agency, March 2008, Understanding the Landfill Directive RGN No LFD 1 and Environment Agency, April 2007, Guidance for the Landfill Sector. 9 Yanley Landfill Site 2006. Southern Extension Side Slope Lining. Cells S1 & S2 (Lifts 2&3), and Cell S3 (Lifts 2&3) CQA Reports. Both prepared by Hyder Consulting Ltd.

Viridor Waste Management 3 402.0036.00304.20 Yanley Landfill: Hydrogeological Risk Assessment July 2009
SLR
2.0 CONCEPTUAL HYDROGEOLOGICAL SITE MODEL
2.1 Source With regards to the landfill source, it is considered that three key components exist, which are the site design and construction, leachate management and leachate quality. Each of these is considered in more detail below.
2.2 Development of the Installation
Waste disposal operations at the site began in 1988 with the first part of the site being completed and restored in 2003. The most recent Waste Management Licence (WML) EAWML/27181 for the initial part of the site was issued in February 1994. A PPC Permit application was made in October 2002 for a southern extension to the existing landfill. PPC Permit number BT7272 was issued on the 17th March 2004, and subsequently varied in July 2005 (Variation Notice DP3136SR). The PPC Permit allowed Yanley landfill to accept non-hazardous wastes only, whilst the variation granted the site permission to accept stable non-reactive hazardous waste in the form of asbestos. The permitted area comprises the extension area, the restored previously licensed landfill, the landfill gas management facility and the leachate storage lagoon.
Waste disposal operations have ceased at the site and capping and restoration are currently under way.
2.3 Containment System Design and Construction
Yanley Landfill comprises 14 separate cells, five of which have been surcharged in conjunction with the southern extension of the site.
To date all cells have been filled, with the majority capped and restored. The southern extension area hosts the completed Cells S1, S2 and the designated asbestos cell S3.
All cells in the southern extension have been constructed in accordance with the designs initially presented within the PPC Application.
With regards to the nature of the sidewall lining system, the CQA Reports9 prepared for Cells S1, S2 and S3 confirm that the site has been constructed in the manner assumed by the Original HRA. Such detail, for example, includes the thickness and permeability of the attenuation layer.
2.3.1 Under Drainage System
A groundwater under drainage system was installed under the southern extension Cells S1 and S2 to control basal water pressures during the early years of filling. Originally, groundwater intercepted by this drain flowed westwards and was monitored at monitoring point YN615 until January 2003, during the construction of the southern extension when this monitoring point was sealed. The drain currently runs to be point to the south east of the site where it is intercepted by a manhole and discharges into the surface water lagoon.
2.3.2 Clay Mineral Liner
Natural clay deposits at the site are excavated, placed and compacted at a controlled moisture content to form a minimum 1m thick clay liner with a permeability of less than or equal to 1 x 10⁻⁹ m/s. Clay source materials at Yanley Landfill have undergone laboratory

Viridor Waste Management 4 402.0036.00304.20 Yanley Landfill: Hydrogeological Risk Assessment July 2009
SLR
testing and these results have confirmed that the site won clay can be compacted to achieve the required permeability10.
2.3.3 Leachate Drainage Blanket
It is understood from drilling records and design drawings that the northern section of the site was developed with a herringbone drainage layout and a partial drainage blanket comprising shredded tyres. The leachate drains to collection chambers and is removed by active pumping.
Within the southern extension cells S1, S2 and S3, a system of leachate collection drains comprising 150mm and 200mm diameter slotted HDPE pipe is emplaced within a herringbone pattern. This is embedded within a stone drainage blanket formed from a nominal 5-10mm non-calcareous granular aggregate placed on a protection geotextile over the engineered barrier. The leachate drains flow to leachate collection chambers located at the lowest point of each cell and is removed by active pumping.
2.3.4 Leachate Levels
Levels in the leachate monitoring points have been monitored on a monthly basis. Data are available for 23 of the 24 monitoring points installed, with YN314 being subject to restricted access.
Time series plots for each cell are presented in Appendix HRA2 and show the following;
• leachate levels in Cells 4 to 9 have fluctuated between 15maOD and 30maOD throughout the monitoring period. It is considered that some of these leachate levels will be perched and do not represent actual heads acting on the base of the site.; and
• leachate levels in the southern extension Cells S1 and S2 demonstrate fluctuation between 28maOD and 36maOD.
It is considered that the installation of the new extraction system has greatly facilitated the management of on-site leachate levels and heads.
2.3.5 Leachate Quality and Priority Contaminants
Leachate quality data are available for several leachate monitoring points as follows;
• YN501, the discharge point to sewer, and YN502, the leachate lagoon, both provide a composite sample of leachate, with data available from November 1995 to June 2009;
• YNS503LM and YNS504LM, in cells S1 and S2 respectively, with data available from April 2006 to June 2009;
• YN383A, YN387A and YN391LM in cells 7A, 7B and 8B respectively, with data available from April 2008 to June 2009; and
• Data for YN345A, YN346A and YN370A in cells 7A and 6 respectively.
10 Laboratory results are presented in Appendix A of the October 2002 Southern Extension Groundwater Risk Assessment by Marcus Hodges Environment.

Viridor Waste Management 5 402.0036.00304.20 Yanley Landfill: Hydrogeological Risk Assessment July 2009
SLR
The leachate data have been reviewed and data are presented in Appendix HRA1 along with time series graphs. This information is summarised in Table 2-1 and is discussed in more detail below. Table 2-1 demonstrates that some of the monitoring data to date are comparable with the concentrations assumed for the October 2007 HRA Review, although several of the monitored concentrations do not fall within the assumed probability distributions. These include ammoniacal nitrogen, chloride and mercury, which were recorded at higher concentrations than those originally modelled.
Table 2-1 Comparison of Modelled Source Term Concentrations and
Leachate Monitoring Data to Date
Parameter Leachate Composition
Modelled in October 2007 HRA Review (mg/l)
Summary of Monitoring Data to Date (mg/l)1
Min 0.11 0.11 Mean 265 383 Ammoniacal
nitrogen Max 887 2010 Min 21 21
Mean 788 889 Chloride Max 1724 38002 Min 1 x 10-30 0.0048
Mean 0.025 - Toluene Max 0.0512 0.0512 Min 1 x 10-30 0.0000575
Mean 4.25 x 10⁻⁵ 0.0198 Mercury Max 8.5 x 10⁻⁵ 0.121 Min 1 x 10-30 0.0032
Mean 0.0035 - Benzene Max 0.005 0.0032 Min 1 x 10-30 0.003 (0.003)
Mean 0.01 - mp-xylene (o-xylene)
Max 0.03 0.027 (0.016) Note: 1. Where less than 50% of the recorded values were above detection limits, an average has
not been presented here, but for modelling purposes an average has been calculated using the approach that any undetected values are given half the value of the detection limit. 2. An outlier of 5541mg/l recorded in YN501 on 6th April 1999 was removed from the dataset on application of the Dixon “Q Test” for the whole dataset.
With regard to List I substances, Table 2-2 presents those that have been detected in the leachate at individual monitoring points at concentrations above their appropriate Lower Reporting Limits11 (LRLs).
11 As defined in Appendix 6, Environment Agency, 2003. Hydrogeological Risk Assessments for Landfill and the Derivation of Groundwater Control and Trigger Levels.

Viridor Waste Management 6 402.0036.00304.20 Yanley Landfill: Hydrogeological Risk Assessment July 2009
SLR
Table 2-2 List I Substances Detected in Leachate
Determinand No. of
Samples
No. above detection
limit Maximum
Concentration (µg/l)
o-Xylene 9 3 15.8 mp-Xylene 9 4 26.8
Mercury 9 6 120.1 Toluene 9 3 51.2
Ethyl benzene 9 3 40.1 Cadmium 305 62 18.7
MCPP (Mecoprop) 99 98 308 Naphthalene 6 1 61.2
2,4 Dinitrotoluene 6 2 490 4-Methylphenol 6 1 32.1
It is noted that analyses for the majority of List I substances have been undertaken on either one or two occasions (17/06/08, 01/07/08 or 17/07/08) and so it is not possible to undertake statistical analysis to ascertain the presence of outliers.
Cadmium has been detected on 62 occasions (20% of samples) in the landfill leachate. At all other times (80% of samples) it has remained undetected, and since the detection limit has been lowered to below the LRL of 1µg/l in 2008, the majority of detected results still remain below the LRL. It is therefore considered that cadmium is not typically present in the landfill leachate at concentrations above the LRL, and therefore not appropriate for inclusion in the modelled source term. As mercury is to be included in the model as an inorganic List I substance owing to its detection in 67% of samples and high maximum concentration, it is considered that the omission of cadmium is appropriate.
With regards to previously modelled List I organic substances, it is no longer considered appropriate to model benzene as it was only detected on a single occasion in leachate at 3.2µg/l which is below the LRL. Mecoprop was not detected in the leachate at the time of the Original HRA. However, it is considered that it should be added to the modelled leachate source term given that it has been detected in the leachate at the site on almost every sampling occasion.
In the light of the available data and the discussions above, it is considered appropriate to include the following determinands as priority contaminants in the hydrogeological modelling;
List I substances;
• mecoprop (acid herbicide);
• xylene; (List I hydrocarbon)
• toluene; (List I hydrocarbon); and
• mercury (mobile metallic ion)
List II Substances;
• ammoniacal nitrogen (inorganic cation); and
• chloride (conservative inorganic anion).
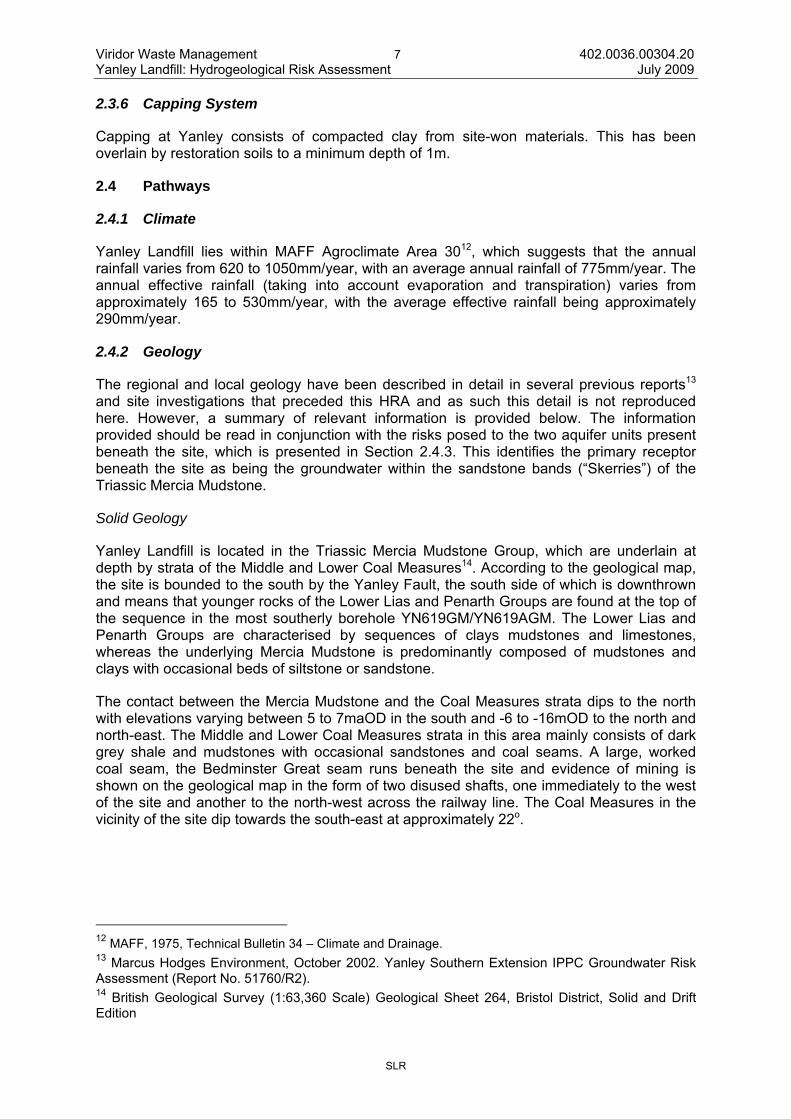
Viridor Waste Management 7 402.0036.00304.20 Yanley Landfill: Hydrogeological Risk Assessment July 2009
SLR
2.3.6 Capping System
Capping at Yanley consists of compacted clay from site-won materials. This has been overlain by restoration soils to a minimum depth of 1m.
2.4 Pathways
2.4.1 Climate
Yanley Landfill lies within MAFF Agroclimate Area 3012, which suggests that the annual rainfall varies from 620 to 1050mm/year, with an average annual rainfall of 775mm/year. The annual effective rainfall (taking into account evaporation and transpiration) varies from approximately 165 to 530mm/year, with the average effective rainfall being approximately 290mm/year.
2.4.2 Geology
The regional and local geology have been described in detail in several previous reports13 and site investigations that preceded this HRA and as such this detail is not reproduced here. However, a summary of relevant information is provided below. The information provided should be read in conjunction with the risks posed to the two aquifer units present beneath the site, which is presented in Section 2.4.3. This identifies the primary receptor beneath the site as being the groundwater within the sandstone bands (“Skerries”) of the Triassic Mercia Mudstone.
Solid Geology
Yanley Landfill is located in the Triassic Mercia Mudstone Group, which are underlain at depth by strata of the Middle and Lower Coal Measures14. According to the geological map, the site is bounded to the south by the Yanley Fault, the south side of which is downthrown and means that younger rocks of the Lower Lias and Penarth Groups are found at the top of the sequence in the most southerly borehole YN619GM/YN619AGM. The Lower Lias and Penarth Groups are characterised by sequences of clays mudstones and limestones, whereas the underlying Mercia Mudstone is predominantly composed of mudstones and clays with occasional beds of siltstone or sandstone.
The contact between the Mercia Mudstone and the Coal Measures strata dips to the north with elevations varying between 5 to 7maOD in the south and -6 to -16mOD to the north and north-east. The Middle and Lower Coal Measures strata in this area mainly consists of dark grey shale and mudstones with occasional sandstones and coal seams. A large, worked coal seam, the Bedminster Great seam runs beneath the site and evidence of mining is shown on the geological map in the form of two disused shafts, one immediately to the west of the site and another to the north-west across the railway line. The Coal Measures in the vicinity of the site dip towards the south-east at approximately 22o.
12 MAFF, 1975, Technical Bulletin 34 – Climate and Drainage. 13 Marcus Hodges Environment, October 2002. Yanley Southern Extension IPPC Groundwater Risk Assessment (Report No. 51760/R2). 14 British Geological Survey (1:63,360 Scale) Geological Sheet 264, Bristol District, Solid and Drift Edition

Viridor Waste Management 8 402.0036.00304.20 Yanley Landfill: Hydrogeological Risk Assessment July 2009
SLR
Drift/Superficial Geology The geological map indicates that the superficial geology in the vicinity of the site comprises Head and First Terrace (Loam) or Higher Alluvium, however, the majority of these deposits have been removed in the vicinity of the site. Detail regarding the geology beneath the site is presented within the cross-section that is presented in Drawing HRA2.
2.4.3 Hydrogeology
Whilst all aspects of hydrogeological risk have been reviewed and assessed as part of this HRA Review update, it is the site’s geology and hydrogeology that has received particular attention. This attention has focused on the identification and characterisation of the two geological units; the Mercia Mudstone Group and the Coal Measures, which are present beneath the site. This is because the hydraulic interactions between the site and these two strata are crucial in understanding, assessing and monitoring the hydrogeological risks that are associated with the site.
Previous risk assessments have considered the Mercia Mudstone Group and Coal Measures to be a single hydrogeological unit and this may have allowed a higher perception of risk than may actually occur.
Aquifer Characteristics
The Mercia Mudstones are classified as a Non Aquifer15 and as such are considered to contain insignificant quantities of groundwater. However, some groundwater flow does occur within the Mercia Mudstones and this is generally controlled by fractured, impersistent bands of sandstone known as skerries. Groundwater within these bands is confined by the mudstones above and below which have a very low permeability16. Permeabilities within the sandstone bands were measured during packer testing by Marcus Hodges Environment17 and provided values in the order of 1x10⁻⁵m/s. Falling head test data, which would be controlled by the mudstone element of the strata indicate a horizontal permeability values of between 1x10⁻⁷ and 1x10⁻⁹m/s in the Mercia Mudstone to the north of Yanley Landfill. It is anticipated that vertical permeabilities in the Mercia mudstone will be approximately an order of magnitude lower than those in the horizontal direction.
The Coal Measures form a multilayered Minor Aquifer, with the predominant argillaceous strata acting as aquitards or aquicludes, isolating the occasional thicker sandstone units that may act as separate aquifers and may support locally important groundwater supplies. The majority of the Coal Measures in the vicinity of the site consist of shales and mudstones.
Groundwater Levels and Flow
Groundwater levels have been monitored on a monthly basis at perimeter boreholes installed in the Mercia Mudstone as well as the underlying Coal Measures. Time series plots
15 National Rivers Authority, 1995, Groundwater Vulnerability Map 37, Southern Cotswolds 16 British Geological Survey, 2000. The physical properties of minor aquifers in England and Wales. EA R&D Publication 68 17 Marcus Hodges Environment, October 2002. Yanley Southern Extension IPPC Groundwater Risk Assessment (Report No. 51760/R2).

Viridor Waste Management 9 402.0036.00304.20 Yanley Landfill: Hydrogeological Risk Assessment July 2009
SLR
are presented in Appendix HRA 2 and groundwater contours for the Mercia Mudstone and Coal Measures are demonstrated in Drawing HRA3.
Data for the period November 2001 to April 2009 show that groundwater levels in the Mercia Mudstones in the immediate vicinity of the Yanley site have fluctuated between;
• circa 30maOD and 49maOD immediately up-gradient of the site; and
• circa 13maOD and 15maOD down-gradient of the site.
In the Coal Measures underlying the site groundwater levels have fluctuated as follows;
• between circa 16maOD and 35maOD immediately up-gradient of the site; and
• between circa -1mOD and 19maOD down-gradient of the site.
The groundwater levels demonstrate that groundwater flows in a north-easterly direction, reflecting topography, in both the Coal Measures and the Mercia Mudstone Group. The piezometric head of the confined Coal Measures consistently remains below that of the overlying Mercia Mudstone. Review of monitoring data gathered on-site since July 2003 demonstrates that there has been no material variation of the groundwater levels monitored at the site and this therefore demonstrates that the hydraulic relationship of both groundwater units is in a steady state.
The basal elevations of Cell S1 and Cell S2 at the lowest points are 35maOD and 30maOD respectively. The bases of the northern cells are at a generally lower level and vary between 13maOD and 22maOD. The increased permeability of the under-drainage system is considered to have resulted in the localised flattening of groundwater levels in the vicinity of the southern extension cells (Drawing HRA1).
Groundwater Quality
Groundwater quality is routinely monitored at perimeter boreholes completed within the Coal Measures and the Mercia Mudstone. Monitoring locations are shown in Appendix HRA7 and a summary of the monitoring information is presented in Appendix HRA4.
Background groundwater quality in the Mercia Mudstones is characterised by data from boreholes YN601, YN628, YN630 and YN633. These data show that the background (up-gradient) water quality exceeds UK Drinking Water Standard (DWS) for a number of determinands including ammoniacal nitrogen. Maximum concentrations of ammoniacal nitrogen and chloride are 2.0mg/l and 61mg/l respectively.
Background groundwater quality in the Coal Measures is characterised by data from boreholes YN614, YN616, YN629, YN631 and YN632. These data again show that concentrations of a number of determinands are also elevated with respect to UK DWS. These data are discussed further below.
The boreholes listed in Table 2-3 are located up the groundwater hydraulic gradient of the Yanley Landfill.

Viridor Waste Management 10 402.0036.00304.20 Yanley Landfill: Hydrogeological Risk Assessment July 2009
SLR
Table 2-3 Summary of Background Groundwater Quality Data
Mercia Mudstones Coal Measures
Boreholes/ Determinands
YN601, YN628, YN633 YN616, YN629, YN631, YN632
Ammoniacal nitrogen (mg/l)
Min Mean Max
0.025 0.24 2.0
0.025 0.22 2.518
Chloride (mg/l) Min
Mean Max
4 19 61
7 20 55
Toluene (μg/l) Not detected Not detected Mecoprop (µg/l) Not detected Not detected
m,p-xylene & o-xylene (μg/l)19
Not detected Single Detection at 0.12
Mercury (μg/l) 20 Min Max
0.0989 0.3
Detected on two occasions at 0.2
For the purposes of the modelling, the groundwater quality within the Coal Measures has been discounted, as the primary receptor of concern is groundwater quality within the Mercia Mudstones, and if the risk to the Mercia Mudstones is negligible then it stands to reason that the potential risks to the Coal Measures are also negligible.
Comparison of Up-gradient and Down-gradient Groundwater Quality
With regards to groundwater quality in the Mercia Mudstone in the vicinity of Yanley landfill, the following observations are made;
• the data for the Mercia Mudstone show that groundwater in the vicinity of the site is generally of fair quality. Chloride concentrations have consistently remained well below the UK Drinking Water Standard (DWS) in boreholes both up and down gradient of the site. Background concentrations are typically found at concentrations below 50mg/l to a maximum recorded at 60.6mg/l. Down and across gradient of the landfill, concentrations of chloride are similar to those of background boreholes, with the majority of data below 60mg/l to a maximum of 81.5mg/l;
• background concentrations of ammoniacal nitrogen have generally remained below the UK DWS of 0.39mg/l, although several exceedences are observed in both YN601 and YN633, with a maximum concentration of 2.0mg/l being recorded in borehole
18 Outliers at YN616 of 11.3mg/l removed from data set as an outlier. 19 M,p-Xylene has only been detected on a single occasion in up-gradient groundwater in the Coal Measures and is therefore not incuded in any modelling of background groundwater quality. 20 It is noted that mercury is detected in up-gradient groundwater in both the Coal Measures and Mercia Mudstone on two separate occasions, and because it has not been detected on any other occasion it is therefore not included in the modelling of background groundwater quality.

Viridor Waste Management 11 402.0036.00304.20 Yanley Landfill: Hydrogeological Risk Assessment July 2009
SLR
YN601. Down and across gradient from the site, concentrations tend to fall in a similar range also with several exceedences of the UK DWS and a maximum excluding outliers21 of 2.1mg/l;
• with regard to other monitored determinands, several others have exceeded UK DWS on at least one occasion in several boreholes. Manganese and iron in particular are recorded at concentrations in excess of the UK DWS in the vicinity of the site in filtered samples. This may reflect the natural geochemistry of the Mercia Mudstone.
Whilst it is recognised that groundwater within the Coal Measures is not at risk owing to the presence of the overlying Mercia Mudstone, and the impermeable geologies that are associated with it, groundwater quality monitoring in the Coal Measures in the vicinity of Yanley landfill demonstrates the following;
• quality data for the Coal Measures indicates that groundwater in this aquifer is of variable quality, although a number of the determinands exceed the UK DWS as detailed below;
• chloride concentrations in up-gradient monitoring boreholes record concentrations up to 55mg/l with all concentrations significantly below the UK DWS of 250mg/l although boreholes YN632 and YN629 do show a gradual upward trend. Down-gradient of the site, chloride concentrations exceed the UK DWS of 250mg/l on a number of occasions in boreholes YN607, YN610 and YN612 to a maximum recorded of 526mg/l in April 2003. There is no obvious increasing trend in the chloride data, and discussion of the groundwater quality results are presented below;
• ammoniacal nitrogen concentrations have generally remained below the UK DWS of 0.39mg/l on the majority of occasions in the up-gradient boreholes, although they do demonstrate at least one exceedence in all monitoring points. The exceedences seem to be spikes and not part of a particular trend, and indicate a deal of variability in the Coal Measures groundwater quality. Down-gradient of the site, ammoniacal nitrogen concentrations are generally recorded above the UK DWS of 0.39mg/l with a maximum recorded (excluding outliers22) value of 10.5mg/l in borehole YN602. Further discussion of groundwater quality in the Coal Measures is presented below;
• With regard to other monitored determinands, several determinands have been recorded at above the UK DWS. Dissolved manganese, iron and cadmium are recorded at concentrations in excess of the UK DWS of 0.05mg/l, 0.2mg/l and the MRV of 0.1µg/l respectively on a number of occasions both up and down-gradient of the landfill. Sulphate is also found in elevated concentrations both up and down-gradient of the landfill. This may again reflect the natural and heterogeneous geochemistry of the aquifer; and
• List I substance mercury is detected up-gradient of the landfill at a concentration above the MRV with 0.2µg/l on a single occasion in both boreholes YN616 and YN632. Down-gradient of the landfill it has only been detected on a single occasion at 0.2µg/l in borehole YN612, indicating that there is no impact on mercury concentrations from the landfill which is demonstrated in line with the following risk assessment. Mecoprop has not been detected up-gradient of the landfill and exceeds
21 An outlier of 3.83mg/l recorded on 19th June 2003 was excluded from the data on application of the Dixons “Q test”. 22 An outlier of 16.7mg/l recorded on 28th May 2003 was excluded from the data on application of the Dixons “Q Test”.

Viridor Waste Management 12 402.0036.00304.20 Yanley Landfill: Hydrogeological Risk Assessment July 2009
SLR
the MRV of 0.04µg/l on several occasions within boreholes YN610 and YN627 to a maximum of 1.83µg/l in borehole YN627.
It is noted that although concentrations of ammoniacal nitrogen and chloride down-gradient of the landfill exceed those of up-gradient in the Coal Measures, it is considered that there are a number of effects that could possibly be influencing the results. Firstly, concentrations of chlorides and metals in the shales of the Coal measures are thought to have a high natural variability owing to the marine depositional environment and potential influence of mine workings and coal seams in the vicinity of the site. Secondly, the Coal Measures are a complex layered aquifer with potentially numerous different flow pathways within it. It is not clear from the available borehole logs whether the Coal Measures boreholes are all monitoring the same aquifer horizons, as the majority seem to penetrate the surface of the Coal Measures and are therefore completed at different topographic levels. This, combined with the presence of mine workings and coal seams in the area does not give a high degree of confidence in the comparison between up-gradient and down-gradient groundwater quality.
Finally, it is also considered that the landfill poses negligible risks to the Coal Measures owing to the thickness of impermeable Mercia Mudstone deposits that are present between the base of the site and this geology.
2.4.4 Hydrology
Yanley Landfill site is located on a ridge of land that runs east-west and drains into the catchments of Colliter’s, Longmoor and Ashton Brooks. These three brooks all drain into the tidal River Avon approximately 3km to the north-east of the site.
The closest of the three nearby water courses is Colliter’s Brook which runs parallel to the eastern boundary of the site and flows in a north-easterly direction until it meets the Ashton Brook.
Surface water drainage from the site flows to settlement ponds on the eastern and western sides of the site which discharge to the Colliter’s and Longmoor Brooks respectively.
2.5 Receptors
2.5.1 Receptor Locations
The primary receptors assumed for the Original HRA were the compliance points as required by the Groundwater Regulations, 1998. These were as follows:
• for List I Substances, the potential receptor was assumed to be groundwater at the base of the unsaturated zone beneath the landfill site (prior to any dilution occurring); while
• for List II Substances, the potential receptor has been assumed to be the groundwater beneath the Ashton/Longmoor Brooks (as requested by the Agency).
It is considered that these receptors remain appropriate for the Yanley Landfill site.
2.5.2 Environmental Assessment Limits
Compliance with the Groundwater Regulations, 1998, requires that the landfill will not result in discernible discharges of List I substances entering the groundwater and will not cause pollution of groundwater by List II Substances.

Viridor Waste Management 13 402.0036.00304.20 Yanley Landfill: Hydrogeological Risk Assessment July 2009
SLR
With regards to List I Substances, the appropriate EALs are the levels at which they become “discernible” in groundwater.
With regards to List II Substances, in order to provide the greatest level of protection, the appropriate EAL for each considered contaminant was determined to be the most stringent applicable standard, except where background concentrations in groundwater exceed these standards, in which case the EAL was set at the maximum background groundwater concentration. The standards that were considered to be appropriate were the Drinking Water Standard (DWS) and the Environmental Quality Standards (EQS)23. Table 2-4 shows the derivation of the appropriate EALs for the Superficial Deposits.
Table 2-4 Derivation of Environmental Assessment Limits, for the Mercia Mudstone Aquifer
Determinand UK Drinking
Water Standard (mg/l)
Environmental Quality
Standard (mg/l)
(freshwater)24
MRV25 (mg/l)
Maximum Concentrations in Background Groundwater26
(mg/l)
Resultant EAL
(mg/l)
Ammoniacal-N 0.39 0.015 - 2.0 2.0 Chloride 250 250 - 61 250
Mecoprop 0.0001 0.2 0.000127 Not detected 0.0001 Toluene - 0.5 0.004 Not detected 0.004 Mercury 0.0001 0.0001 0.000125 0.000328 0.0003 Xylene - 0.03 0.003 Not detected 0.003
2.6 Summary of Site Conceptual Model
A summary of the hydrogeological conceptual model for the site is given in Table 2-6 overleaf.
23These were determined to be appropriate after considering Figure 3.1, Determination of Target Concentrations in Groundwater. Environment Agency, October 1999, Methodology for the Derivation of Remedial Targets for Soil and Groundwater to Protect Water Resources, R&D P20. 24 For EQSs that depend upon alkalinity (CaCO3), values appropriate to 200 to 250 mg/l were used (based on general monitoring of groundwater) 25 MRVs as specified in Appendix 7 “Minimum Reporting Values for selected List I Substances in clean water” of the Environment Agency’s 2003, Hydrogeological Risk Assessments for Landfills and the Derivation of Groundwater Control and Trigger Levels for similar substances. 26 Background water quality derived from data for Boreholes YN601, YN628 and YN633. 27 MRV as specified in Environment Agency Factsheet, dated 30 April 2008, Groundwater trigger levels, minimum reporting values and limits of detection 28 Based on laboratory detection limit achieved to date.

Viridor Waste Management 14 402.0036.00304.20 Yanley Landfill: Hydrogeological Risk Assessment July 2009
SLR
Table 2-5 Summary of Conceptual Hydrogeological Model
Hazard Source Potential Primary (Unsaturated) Pathways
Potential Secondary (Saturated) Pathways Potential Receptors Compliance Point
Leachate generated within Cells 3 to 9b and Cells S1 to
S3 The site has a leachate
quality that is typical for a landfill that has received a mixture of non-hazardous wastes (although the inert
phases have also been allowed for).
The site represents a potential hazard to ground and surface
water resources in that it contains List I and List II
substances. The development falls,
therefore, within the scope of the Groundwater Directive
Operational phase and Long Term Post Closure
The cells are developed under the principal of containment with the historical cells being
provided a reworked natural geological barrier by the
Mercia Mudstone and Cells S1 to S3 being provided by an engineered clay liner.
Operational phase and Long Term Post Closure:
Vertical unsaturated zone flow within the Mercia Mudstone deposits beneath the site is
modelled as a worst case scenario. In reality the under drainage system would capture any potentially contaminated
groundwater and prevent flow.
Long Term Post Closure: Vertical unsaturated zone flow
through the engineered side wall liner and within the superficial deposits adjacent to the site.
Operational phase and Long Term Post Closure:
Diffuse groundwater flow
within the Mercia Mudstone sand bands (Skerries)
Groundwater flow is in a north-easterly direction
For List I Substances – the groundwater within the
Skerries directly beneath the site.
For List II Substances –
groundwater beneath the Ashton/Longmoor Brooks (as
requested by the Agency).
For List I and List II Substances –
groundwater at the down-gradient site
boundary.

Viridor Waste Management 15 402.0036.00304.20 Yanley Landfill: Hydrogeological Risk Assessment July 2009
SLR
3.0 HYDROGEOLOGICAL RISK ASSESSMENT
3.1 The Nature of the Hydrogeological Risk Assessment
The EA’s technical guidance29 states that;
Complex risk assessments should be carried out where complete source-pathway-receptor terms are present and where either:
• the site setting is sufficiently sensitive to warrant detailed assessment e.g. on permeable strata (e.g. Major Aquifer); within a Source Protection Zone; or close to surface water bodies; or
• there is uncertainty relating to any of the source, pathway or receptor terms e.g. variable leachate quality, or an undefined groundwater flow pattern that can not be overcome by the adoption of conservative inputs or assumptions.
Given the nature of Yanley Landfill and the site’s environmental setting, it was considered that a complex risk assessment in support of the previous was required. It is considered that this level of complexity remains applicable, however the information that has been gathered since the closure plan submission has not given any cause to revise the level of risk assessment required.
3.2 The proposed Assessment Scenarios
3.2.1 Life Cycle Phases
It is recognised that the hydrogeological risk assessment must assess the proposed development’s compliance with the requirements of the Groundwater Regulations, 1998, throughout the lifecycle of the landfill i.e. from the start of the operational phases until the point at which the landfill no longer is capable of posing an unacceptable environmental risk. One scenario has been considered that takes into account the operational, post closure and long term post closure life-cycle phases.
Throughout the operational and post closure scenarios leachate levels will be controlled by the leachate management system and an outward gradient between the landfill leachate and external groundwater in the Mercia Mudstone will be present. This outward gradient will be maintained in the long term following the cessation of leachate management and the resultant increased leachate elevations.
The Coal Measures are not considered as a potential receptor as these strata are overlain by the impermeable Mercia Mudstone deposits. In addition, if the site can be shown not to pose a risk to groundwater in the sandstone bands (skerries) of the Mercia Mudstone, the risk to groundwater in the Coal Measures is precluded.
Modelling results for List I substances are assessed at the top of the uppermost sandstone bands in the Mercia Mudstone and List II substances are assessed in the groundwater beneath the Ashton/Longmoor Brooks (as requested by the Agency).
29 Environment Agency, 2003. Hydrogeological Risk Assessments for Landfill and the Derivation of Groundwater Control and Trigger Levels.

Viridor Waste Management 16 402.0036.00304.20 Yanley Landfill: Hydrogeological Risk Assessment July 2009
SLR
3.3 Numerical Modelling
3.3.1 Justification for Modelling Approach
Following the development of the conceptual model, the hydrogeological risk assessment has been carried out using conservative assumptions regarding the pathways and receptors.
For all scenarios, outward gradients between the landfill leachate and the external groundwater in the Mercia Mudstone will be present. Therefore the potential for advective migration of contaminants from the landfill to groundwater will exist, so the Environment Agency’s LandSim2.5 software was used to provide an estimate of the potential risks associated with the development. This software was used for the following reasons: • it used Monte Carlo (stochastic) techniques and so allows a probabilistic appreciation of
the landfill’s performance; • it provides a consistent approach to the estimation of hydrogeological risks in respect to
landfills and groundwater; • it provides an audited and verified code that is widely accessible; • it aids comprehensive reporting of input values, assumptions and results; • the model provides a good indication of the potential leakage rates; • it allowed the appreciation of the differing performance of the proposed development
through the varying phases of the site’s lifecycle; • it allowed the estimation of the potential attenuation of contaminants;; • it allowed for dilution and retardation of potential contaminants through the
conceptualised pathways.
All modelling carried out for this risk assessment has been carried out in a stochastic fashion. Throughout this assessment the acceptable probability of an undesirable outcome occurring is set at the 95%ile for stochastic estimations carried out for a complex hydrogeological risk assessment. In addition, the 95%ile is commonly selected as a reasonable worst case, against which it is acceptable to make decisions taking into account the assumptions and limitations of the modelling process.
3.4 Model Parameterisation
The nature of all of the input parameters used, together with the appropriate probability distributions used to describe them are presented in the following:
• Appendix HRA5: which presents the tabulated model input parameters; and
• Appendix HRA6: which contains electronic copies of all models and parameters used in this assessment.
Parameter values were determined from information directly measured at site wherever possible. If no site data were available, conservative parameter values were taken from

Viridor Waste Management 17 402.0036.00304.20 Yanley Landfill: Hydrogeological Risk Assessment July 2009
SLR
authoritative sources. Log triangular distributions were used to parameterise leachate concentrations.
3.5 Emissions to Groundwater
The predicted discharge from the development has been assessed against the EALs presented in Table 2-4 in order to determine whether the site complies with the requirements of the Groundwater Regulations 1998.
3.5.1 Mercia Mudstone Skerry Bands
List I Substances
List I substances have been assessed at the top of the uppermost skerry band (base of the unsaturated zone) prior to any dilution occurring. These resultant concentrations reflect the degree of decay each substance undergoes as it passes through the mineral liner (if present) and unsaturated zone. Results are presented in Table 3-1 below.
Table 3-1 List I Substances: Maximum Predicted 95%ile Concentrations at the Base of the
Unsaturated Zone (mg/l)
Determinand Concentration (mg/l) EAL (mg/l)
Mercury 1 x 10⁻⁴ 0.0003 Mecoprop <1 x 10⁻¹⁰ 0.0001 Toluene <1 x 10⁻¹⁰ 0.004 Xylene 1.2 x 10⁻⁸ 0.003
Table 3-2 demonstrates that the resultant concentrations are significantly lower than the concentrations that have been determined to be discernible. Therefore, for the modelled scenarios, it is considered that the modelling shows that there would be no unacceptable discharges of List I substances to groundwater and that there would be no significant environmental effects.
List II Substances
List II substances have been assessed at the down-gradient compliance point (at the down gradient site boundary). Results are presented in Table 3-2.
Table 3-2 List II Substances: Maximum Predicted 95%ile Concentrations in Groundwater
beneath the Ashton / Longmoor Brooks (mg/l)
Determinand Concentration (mg/l) EAL (mg/l)
Ammoniacal Nitrogen 2.1 2.0 Chloride 90 250
Table 3-3 demonstrates that the predicted resultant concentrations are lower than the appropriate EALs. It is therefore considered that the modelling has shown that the discharge of List II substances will be sufficiently limited so as to avoid pollution and that there would be no significant environmental effects.

Viridor Waste Management 18 402.0036.00304.20 Yanley Landfill: Hydrogeological Risk Assessment July 2009
SLR
4.0 REQUISITE SURVEILLANCE
4.1 Leachate Monitoring Schedule
The current and proposed Post Closure leachate monitoring schedule for Yanley Landfill site is presented in Table 4-1 below. It is considered that due to the maturity of the leachate across the majority of the site following closure of the site that the number of leachate monitoring points should be reduced. Boreholes to be monitored post closure are shown in Table 4-1 below in bold, and include all the leachate sumps. It is also considered that as the discharge to sewer from the leachate lagoon is to be monitored, that is unnecessary to continue to monitor leachate quality within the lagoon itself. YN/502, the leachate lagoon has therefore been removed from the schedule.
Table 4-1 Current and Proposed Leachate Monitoring Schedule
Monitoring Point Parameter Current
Frequency of Monitoring36
Proposed Frequency of Monitoring Post
Closure
YN/320, YN/327,YN/332,
YN/383a, YN387a, YN/391,
YNS503LM, YNS504LM
pH, conductivity, ammoniacal nitrogen, chloride, BOD, COD, alkalinity, sulphur,
copper, cadmium, chromium, lead, nickel, zinc, iron,
manganese, total sulphate as SO4, total sulphide as S,
mecoprop, mercury
Quarterly Quarterly
YN/320, YN/327,YN/332,
YN/383a, YN387a, YN/391,
YNS503LM, YNS504LM
As quarterly plus; List I and List II screen
Annually Annually
(those locations shown in bold)
pH, conductivity, ammoniacal nitrogen, chloride, BOD, COD, alkalinity, sulphur,
copper, cadmium, chromium, lead, nickel, zinc, iron,
manganese, total sulphate as SO4, total sulphide as S,
mecoprop, mercury
Quarterly
YN/501 (Discharge to Sewer)
As quarterly plus; List I and List II screen
Annually Annually
YN/312, YN/313, YN/315, YN/317,
YN/320, YN/327,YN/332,
Leachate head (m)
Monthly (compliance level:
5m above cell base)
Quarterly (compliance level: 5m
above cell base)
36 Based on Tables S4.1 and S4.9 of Permit Variation number AP3937LL
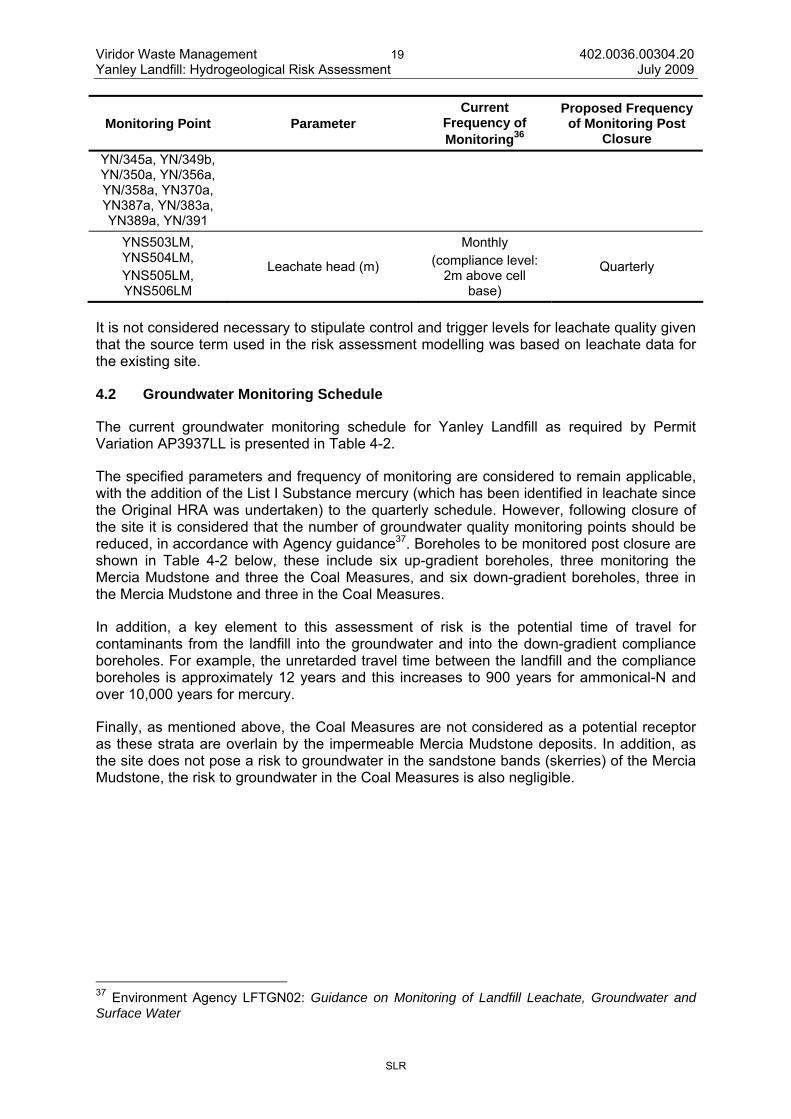
Viridor Waste Management 19 402.0036.00304.20 Yanley Landfill: Hydrogeological Risk Assessment July 2009
SLR
Monitoring Point Parameter Current
Frequency of Monitoring36
Proposed Frequency of Monitoring Post
Closure
YN/345a, YN/349b, YN/350a, YN/356a, YN/358a, YN370a, YN387a, YN/383a, YN389a, YN/391
YNS503LM, YNS504LM, YNS505LM, YNS506LM
Leachate head (m)
Monthly (compliance level:
2m above cell base)
Quarterly
It is not considered necessary to stipulate control and trigger levels for leachate quality given that the source term used in the risk assessment modelling was based on leachate data for the existing site.
4.2 Groundwater Monitoring Schedule
The current groundwater monitoring schedule for Yanley Landfill as required by Permit Variation AP3937LL is presented in Table 4-2.
The specified parameters and frequency of monitoring are considered to remain applicable, with the addition of the List I Substance mercury (which has been identified in leachate since the Original HRA was undertaken) to the quarterly schedule. However, following closure of the site it is considered that the number of groundwater quality monitoring points should be reduced, in accordance with Agency guidance37. Boreholes to be monitored post closure are shown in Table 4-2 below, these include six up-gradient boreholes, three monitoring the Mercia Mudstone and three the Coal Measures, and six down-gradient boreholes, three in the Mercia Mudstone and three in the Coal Measures.
In addition, a key element to this assessment of risk is the potential time of travel for contaminants from the landfill into the groundwater and into the down-gradient compliance boreholes. For example, the unretarded travel time between the landfill and the compliance boreholes is approximately 12 years and this increases to 900 years for ammonical-N and over 10,000 years for mercury.
Finally, as mentioned above, the Coal Measures are not considered as a potential receptor as these strata are overlain by the impermeable Mercia Mudstone deposits. In addition, as the site does not pose a risk to groundwater in the sandstone bands (skerries) of the Mercia Mudstone, the risk to groundwater in the Coal Measures is also negligible.
37 Environment Agency LFTGN02: Guidance on Monitoring of Landfill Leachate, Groundwater and Surface Water

Viridor Waste Management 20 402.0036.00304.20 Yanley Landfill: Hydrogeological Risk Assessment July 2009
SLR
Table 4-2 Current and Proposed Groundwater Monitoring Schedule
Mercia Mudstone
Current Monitoring
Point
Proposed Quality Monitoring Points
Parameter Frequency
of Monitoring
pH, conductivity, ammoniacal nitrogen, TON, nitrate, nitrite, phosphate, chloride,
potassium, BOD, COD, alkalinity, sodium, calcium, magnesium, copper, cadmium,
chromium, lead, nickel, zinc, iron, manganese, sulphate, mecoprop
Quarterly
Up-gradient:
YN/619, YN/630, YN/633
Down-gradient
YN/603, YN/605,
YN/608 As quarterly plus; List I and List II screen
Annually
YN/601, YN/603, YN/605, YN/608, YN/611, YN/614, YN/616, YN/619, YN/626, YN/628, YN/630, YN/633
Groundwater level (m) Quarterly
Coal Measures
Current Monitoring
Point
Proposed Quality Monitoring Points
Parameter Frequency
of Monitoring
pH, conductivity, ammoniacal nitrogen, chloride
Proposed: Quartely
pH, conductivity, ammoniacal nitrogen, TON, nitrate, nitrite, phosphate, chloride,
potassium, BOD, COD, alkalinity, sodium, calcium, magnesium, copper, cadmium,
chromium, lead, nickel, zinc, iron, manganese, sulphate, mecoprop
Current: Quarterly Proposed: Annually
Up-gradient:
YN/619A, YN/629, YN/631
Down-gradient
YN/607,YN/610,
YN/612 As quarterly plus;
List I and List II screen
Current: Annually
Proposed: 4-yearly
YN/602, YN/604, YN/607, YN/610, YN/612, YN/613,
YN/615, YN/619A,
YN/627, YN/629, YN/631, YN/632,
Groundwater level (m) Quarterly
Current control and trigger levels are set for Yanley landfill in Permit Variation Number AP3937LL. As it is considered that where groundwater quality in the Mercia Mudstones is not impacted by the landfill that this will preclude any impacts on the underlying Coal Measures, proposed control and trigger levels are only set for the Mercia Mudstones. These control and trigger levels for the Mercia Mudstone modelled priority contaminants are presented in Table 4-3 and Table 4-4 below. Three down-gradient monitoring boreholes have been selected as compliance locations. These are boreholes YN603, YN605 and YN608 in the Mercia Mudstones.
Trigger levels for List I substances are set at the discernible concentrations for that substance or the maximum concentration detected in up-gradient groundwater, which are reflected in the setting of the revised EALs in Section 3.3.1. If maximum background groundwater concentrations at a compliance location exceed this EAL, the trigger level is set

Viridor Waste Management 21 402.0036.00304.20 Yanley Landfill: Hydrogeological Risk Assessment July 2009
SLR
at the maximum concentration at that location plus 20% to allow for fluctuations in water quality.
Control levels for List II substances are set at midway between the highest resultant model concentration and the EAL for that substance, with the exception of ammoniacal nitrogen, which is set at the maximum concentration recorded at that location. Trigger levels for List II substances have been set at the EAL for the substance.
Table 4-3 Revised Trigger Levels for List I Substances
Compliance Location
Determinand Proposed
EAL
Maximum Concentration Recorded at Compliance Locations
Trigger Level (µg/l)
Mecoprop (µg/l)
0.1 n/a 0.1
Toluene (µg/l)
4 n/a 4
Mp-xylene (µg/l)
3 n/a 3
YN603, YN605, YN608
Mercury (µg/l)
0.3 n/a 0.3
Table 4-4 Revised Control and Trigger Levels for List II Substances
Compliance Point
Proposal Resultant EAL
Maximum Concentration at
Compliance Borehole
Control Level (mg/l)
Trigger Level (mg/l)
Ammoniacal Nitrogen (mg/l)
YN603 1.82 1.8 2.0
YN605 0.58 0.6 2.0
YN608
2.0
1.34 1.3 2.0
Chloride (mg/l)
YN603 41.9 150 250
YN605 38.1 150 250
YN608
250
56.1 150 250
In the event of an exceedence of a groundwater control or trigger level proposed above, Viridor will respond by implementation of the Contingency Action Plan, which is presented in Appendix HRA7. This Action Plan supersedes any other Groundwater Contingency Action Plan that is presented in the site’s current Operations, Development and Management Plan (ODMP).

Viridor Waste Management 22 402.0036.00304.20 Yanley Landfill: Hydrogeological Risk Assessment July 2009
SLR
4.3 Surface Water Monitoring Schedule
The proposed surface water monitoring schedule for Yanley Landfill is presented in Table 4-5 below. This suite is considered relevant as it contains the main indicators of landfill pollution (ammoniacal nitrogen, chloride, pH, conductivity BOD and COD) as well as the main test of efficacy of the surface water settlement scheme (suspended solids).
Table 4-5 Proposed Surface Water Monitoring Schedule
Monitoring Point Parameter Frequency of Monitoring
YN/403, YN/404, YN/405, YNS421,
YNS422.
Ammoniacal nitrogen, Chloride, Conductivity, pH, Suspended solids,
BOD, COD
Monthly

Viridor Waste Management 23 402.0036.00304.20 Yanley Landfill: Hydrogeological Risk Assessment July 2009
SLR
5.0 CONCLUSIONS
This report has reviewed the previously submitted HRA submissions and, in line with the EA’s standard requirements for Closure Plans, has established that;
• the infrastructure and procedures are in place for the management and monitoring of leachate and groundwater during the aftercare phase; and that
• procedures are in place for reporting any significant environmental effects during the aftercare phase.
In addition, this Review has also provided an appropriate opportunity to determine whether the requisite surveillance originally proposed in 2007 remains relevant, particularly within the context of reviewing the site’s hydrogeological conceptual model.

SLR
DRAWINGS
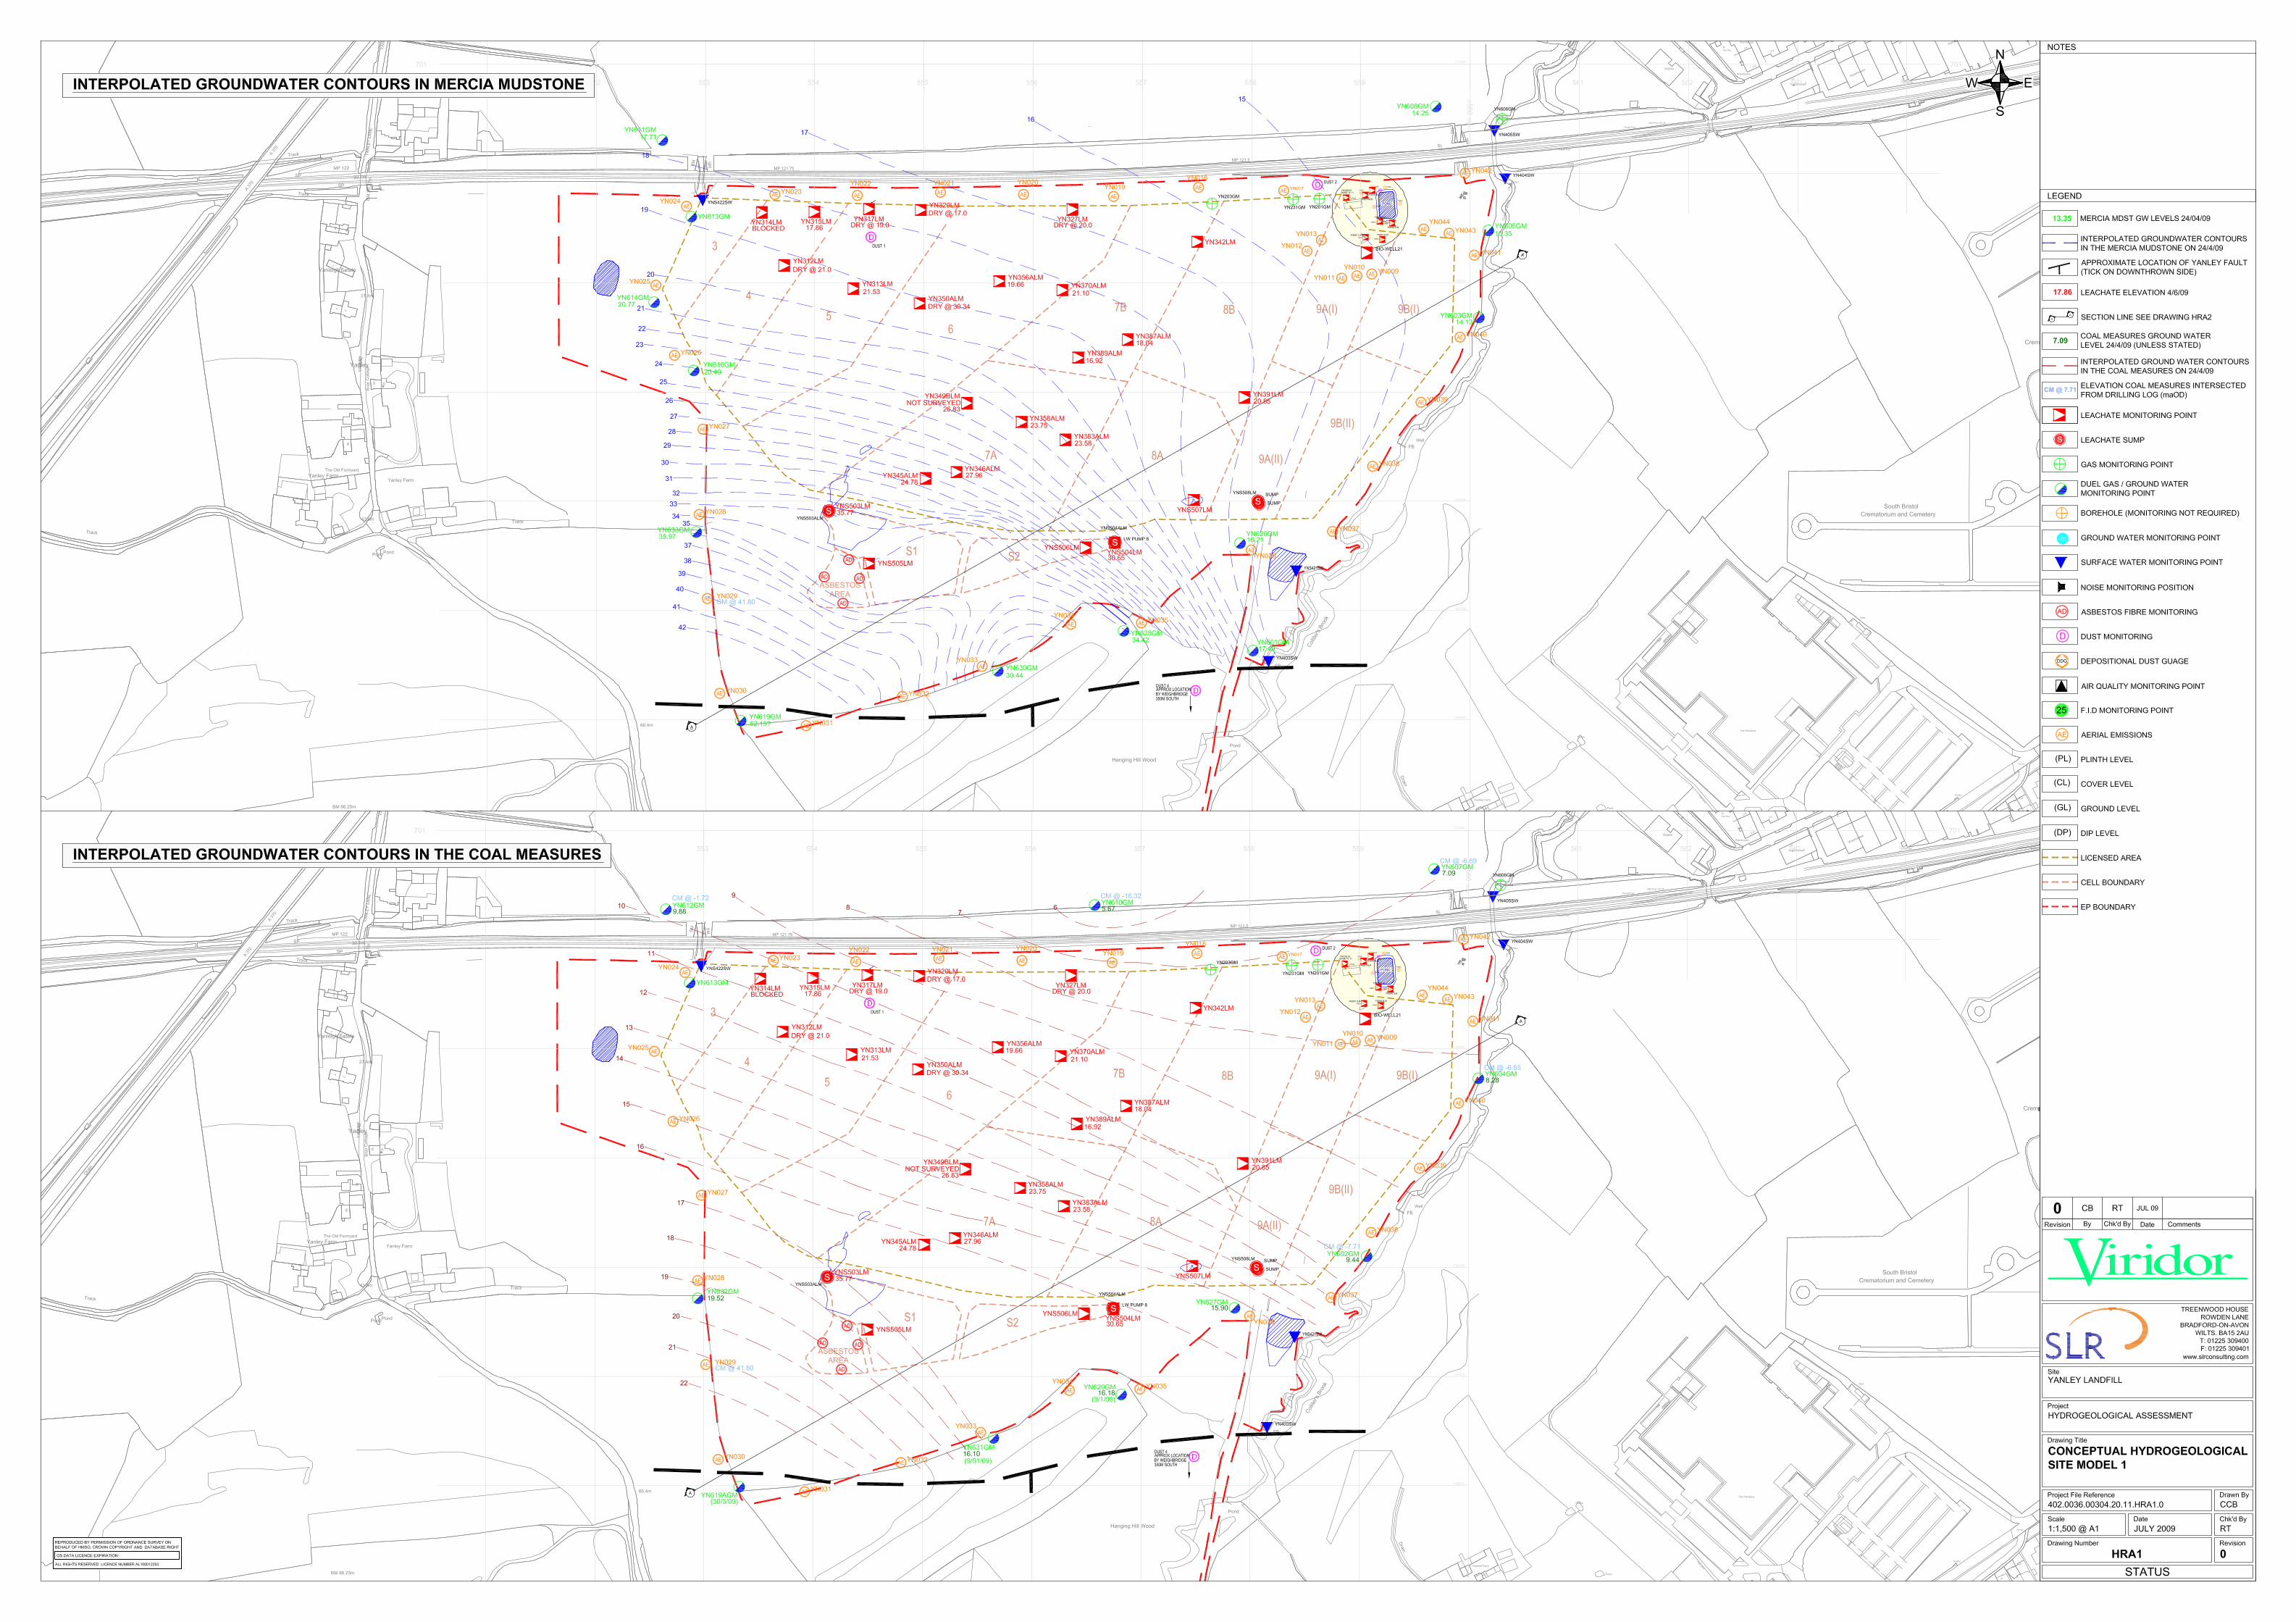


SLR
APPENDICES

SLR
APPENDIX HRA1

Viridor Waste ManagementYanley Landfill HRA
SLR Ref:402-0036-00304-20July 2009
SLR
Ammoniacal Nitrogen Concentrations in Leachate
0
500
1000
1500
2000
2500
Dec-93 Dec-95 Dec-97 Dec-99 Dec-01 Dec-03 Dec-05 Dec-07 Dec-09
Date
Co
nce
ntr
atio
n (
N:m
g/l)
YN/501
YN/502
YN345A
YN346A
YN370A
YN383A
YN387A
YN391LM
YNS503LM
YNS504LM

Viridor Waste ManagementYanley Landfill HRA
SLR Ref:402-0036-00304-20July 2009
SLR
Chloride Concentrations in Leachate
0
1000
2000
3000
4000
5000
6000
Dec-93 Dec-95 Dec-97 Dec-99 Dec-01 Dec-03 Dec-05 Dec-07 Dec-09
Date
Co
nce
ntr
atio
n (
mg
/l)
YN/501
YN/502
YN345A
YN346A
YN370A
YN383A
YN387A
YN391LM
YNS503LM
YNS504LM

Viridor Waste ManagementYanley Landfill HRA
SLR Ref:402-0036-00304-20July 2009
SLR
Mecoprop Concentrations in Leachate
0
50
100
150
200
250
300
350
Dec-93 Dec-95 Dec-97 Dec-99 Dec-01 Dec-03 Dec-05 Dec-07 Dec-09
Date
Co
nce
ntr
atio
n (
ug
/l)
YN/501
YN/502
YN345A
YN346A
YN370A
YN383A
YN387A
YN391LM
YNS503LM
YNS504LM

Viridor Waste ManagementYanley Landfill HRA
SLR Ref:402-0036-00304-20July 2009
SLR
Mercury Concentrations in Leachate
0
20
40
60
80
100
120
140
Dec-93 Dec-95 Dec-97 Dec-99 Dec-01 Dec-03 Dec-05 Dec-07 Dec-09
Date
Co
nce
ntr
atio
n (
ug
/l)
YN/501
YN/502
YN345A
YN346A
YN370A
YN383A
YN387A
YN391LM
YNS503LM
YNS504LM

Viridor Waste ManagementYanley Landfill HRA
SLR Ref:402-0036-00304-20July 2009
SLR
Cadmium Concentrations in Leachate
0
2
4
6
8
10
12
14
16
18
20
Dec-93 Dec-95 Dec-97 Dec-99 Dec-01 Dec-03 Dec-05 Dec-07 Dec-09
Date
Co
nce
ntr
atio
n (
ug
/l)
YN/501
YN/502
YN345A
YN346A
YN370A
YN383A
YN387A
YN391LM
YNS503LM
YNS504LM

Viridor Waste ManagementYanley Landfill HRA
SLR Ref:402-0036-00304-20July 2009
SLR
o-Xylene Concentrations in Leachate
0
2
4
6
8
10
12
14
16
18
Dec-93 Dec-95 Dec-97 Dec-99 Dec-01 Dec-03 Dec-05 Dec-07 Dec-09
Date
Co
nce
ntr
atio
n (
ug
/l)
YN/501
YN/502
YN345A
YN346A
YN370A
YN383A
YN387A
YN391LM
YNS503LM
YNS504LM

Viridor Waste ManagementYanley Landfill HRA
SLR Ref:402-0036-00304-20July 2009
SLR
m,p-Xylene Concentrations in Leachate
0
5
10
15
20
25
30
Dec-93 Dec-95 Dec-97 Dec-99 Dec-01 Dec-03 Dec-05 Dec-07 Dec-09
Date
Co
nce
ntr
atio
n (
ug
/l)
YN/501
YN/502
YN345A
YN346A
YN370A
YN383A
YN387A
YN391LM
YNS503LM
YNS504LM
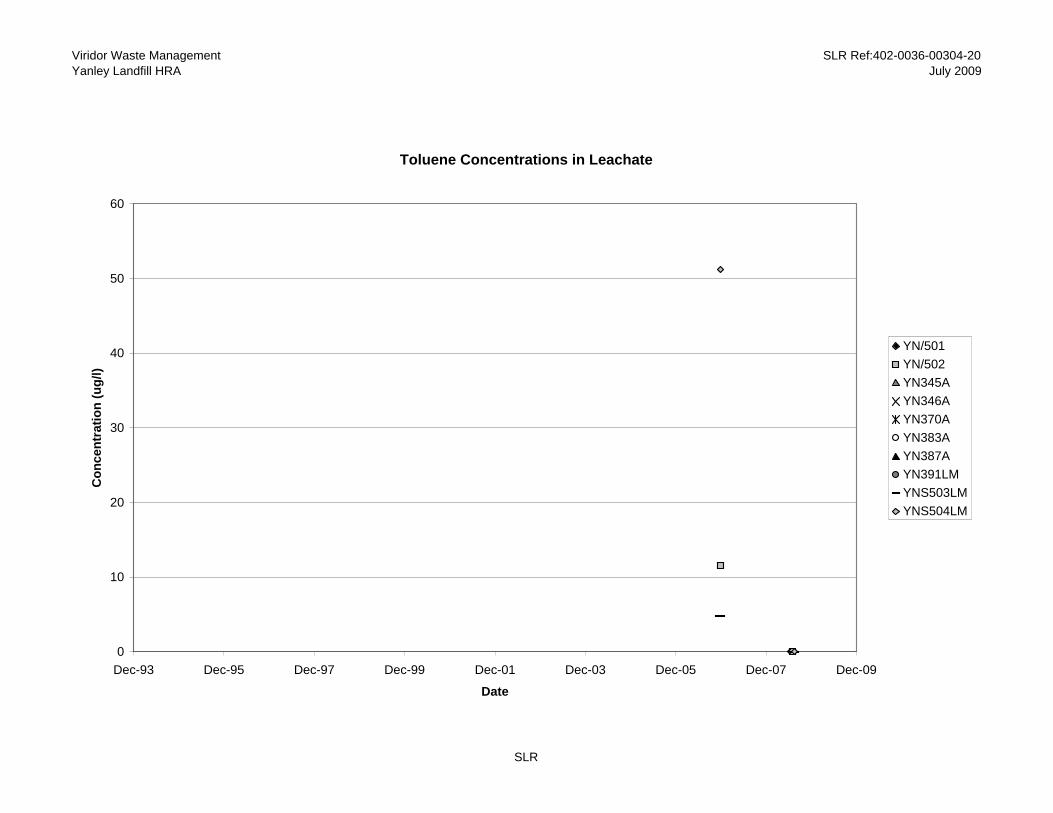
Viridor Waste ManagementYanley Landfill HRA
SLR Ref:402-0036-00304-20July 2009
SLR
Toluene Concentrations in Leachate
0
10
20
30
40
50
60
Dec-93 Dec-95 Dec-97 Dec-99 Dec-01 Dec-03 Dec-05 Dec-07 Dec-09
Date
Co
nce
ntr
atio
n (
ug
/l)
YN/501
YN/502
YN345A
YN346A
YN370A
YN383A
YN387A
YN391LM
YNS503LM
YNS504LM

Viridor Waste ManagementYanley landfill HRA
SLR Ref:402-0036-00304-20July 2009
Date
MCPP (Mecoprop
)ug/lo-Xylene
(ug/l)Chloride
(mg/l)mp-Xylene
(ug/l)Cadmium
(ug/l)Toluene
(ug/l)
Ammoniacal Nitrogen
(mg/l)Mercury
(ug/l)
09/11/1995 20830/01/1996 518 < 0.5 14401/04/1996 820 22408/04/1996 24715/04/1996 2022/04/1996 24605/09/1997 407 < 3 9224/03/1998 30117/04/1998 881 < 3 22722/04/1998 844 < 3 20428/04/1998 839 < 3 21529/10/1998 770 < 20 22706/04/1999 5541 < 20 30109/06/1999 < 20 8615/06/1999 78 < 20 0.1622/06/1999 < 20 35430/06/1999 < 20 16506/07/1999 586 < 20 18314/07/1999 559 < 20 17720/07/1999 851 < 20 25127/07/1999 744 < 20 23027/08/1999 < 20 10312/01/2000 469 < 20 16202/02/2000 917 < 20 32615/03/2000 789 < 20 2702/05/2000 730 < 20 26012/06/2000 1100 < 20 41003/07/2000 1120 < 20 43010/08/2000 1220 < 20 41007/09/2000 1100 < 10 40001/11/2000 515 < 10 20129/11/2000 336 < 10 17927/12/2000 818 < 10 34825/01/2001 405 < 10 19220/02/2001 462 < 10 18422/03/2001 341 < 10 15019/04/2001 667 < 5 27229/05/2001 735 < 5 32921/06/2001 927 < 5 34320/07/2001 983 < 5 50217/08/2001 618 < 5 26.527/09/2001 1140 < 5 54530/10/2001 831 < 5 44405/12/2001 1100 < 5 54120/12/2001 1120 < 5 56130/01/2002 236 < 5 11706/03/2002 937 < 5 40428/04/2002 125 < 5 73624/05/2002 1140 < 5 47728/06/2002 971 < 5 42830/07/2002 1360 < 5 581
YN/501
SLR

Viridor Waste ManagementYanley landfill HRA
SLR Ref:402-0036-00304-20July 2009
Date
MCPP (Mecoprop
)ug/lo-Xylene
(ug/l)Chloride
(mg/l)mp-Xylene
(ug/l)Cadmium
(ug/l)Toluene
(ug/l)
Ammoniacal Nitrogen
(mg/l)Mercury
(ug/l)
28/08/2002 1350 < 5 46419/09/2002 1360 < 5 62804/10/2002 1380 < 5 72418/11/2002 827 < 5 46120/12/2002 1110 < 5 30621/01/2003 398 < 5 19012/02/2003 331 < 5 14311/03/2003 276 < 5 81.209/04/2003 929 < 5 45412/05/2003 53.5 < 5 44212/06/2003 1110 < 5 46811/07/2003 1300 13.3 39413/08/2003 1240 < 5 36816/09/2003 1280 5.73 58515/10/2003 1590 < 5 56206/11/2003 1010 < 5 45302/12/2003 318 < 5 16112/02/2004 672 < 5 33009/03/2004 964 < 5 47607/04/2004 865 < 5 50506/05/2004 671 < 5 45529/06/2004 941 < 5 57020/07/2004 1180 < 5 60131/08/2004 1240 < 5 64118/09/2004 1340 66815/03/2005 1040 <5 51913/04/2005 1180 <5 50412/05/2005 899 <5 46616/06/2005 929 <5 40812/07/2005 1430 <5 58301/08/2005 1180 <5 53411/08/2005 <5 53420/10/2005 <5 38615/11/2005 935 <5 38414/12/2005 1160 <5 65518/01/2006 898 <5 41627/02/2006 984 <5 40030/03/2006 420 <5 13527/04/2006 936 <5 37617/05/2006 921 <5 38427/06/2006 779 <5 28325/07/2006 870 <5 27522/08/2006 750 <5 20326/09/2006 1020 <5 39531/10/2006 827 <5 26525/11/2006 327 <5 13621/12/2006 604 <5 13831/01/2007 839 <5 33401/03/2007 356 < 5 11902/04/2007 1090 < 5 41617/04/2007 954 < 5 38214/06/2007 917 11.8 412
SLR

Viridor Waste ManagementYanley landfill HRA
SLR Ref:402-0036-00304-20July 2009
Date
MCPP (Mecoprop
)ug/lo-Xylene
(ug/l)Chloride
(mg/l)mp-Xylene
(ug/l)Cadmium
(ug/l)Toluene
(ug/l)
Ammoniacal Nitrogen
(mg/l)Mercury
(ug/l)
23/07/2007 460 < 5 17922/08/2007 653 6.4 21126/09/2007 500 < 5 19022/10/2007 1090 47919/12/2007 717 36717/01/2008 794 37418/03/2008 480 < 0.00514/04/2008 38.4 876 1.9 26719/05/2008 36.6 1010 0.9 40217/06/2008 39.3 <10.0 901 <10.0 0.7 <10.0 353 <0.101/07/2008 45.3 <20.0 1060 <20.0 1.7 <20.0 385 3315/08/2008 24.4 593 0.9 14418/09/2008 3.12 144 <0.5 25.921/10/2008 4.47 234 <0.3 48.906/11/2008 1.91 118 <0.3 20.404/12/2008 0.67 58 <0.3 5.808/01/2009 52.4 1060 3.8 48013/02/2009 25.4 746 1 35705/03/2009 40.9 948 0.5 45706/04/2009 43 924 2 41701/05/2009 40.4 1060 <0.3 37204/06/2009 52.4 1370 <0.3 578
Date
MCPP (Mecoprop
)ug/lo-Xylene
(ug/l)Chloride
(mg/l)mp-Xylene
(ug/l)Cadmium
(ug/l)Toluene
(ug/l)
Ammoniacal Nitrogen
(mg/l)Mercury
(ug/l)
07/12/1995 1300 15621/12/1995 223 3204/01/1996 430 16518/01/1996 760 20015/02/1996 1300 34229/02/1996 21 3.208/03/1996 408 5802/05/1996 167 < 0.5 3116/05/1996 231 < 0.5 12013/06/1996 1060 < 0.5 29725/07/1996 952 < 0.5 0.3308/08/1996 960 < 0.5 88722/08/1996 1097 < 0.5 29605/09/1996 978 < 0.5 28403/10/1996 860 < 0.5 25717/10/1996 947 < 0.5 17631/10/1996 860 < 0.5 19914/11/1996 980 < 0.5 24428/11/1996 775 < 3 23012/12/1996 960 < 3 27223/12/1996 932 < 3 26708/01/1997 1006 < 3 28422/01/1997 874 < 3 27205/02/1997 1347 < 3 310
YN/502
SLR

Viridor Waste ManagementYanley landfill HRA
SLR Ref:402-0036-00304-20July 2009
Date
MCPP (Mecoprop
)ug/lo-Xylene
(ug/l)Chloride
(mg/l)mp-Xylene
(ug/l)Cadmium
(ug/l)Toluene
(ug/l)
Ammoniacal Nitrogen
(mg/l)Mercury
(ug/l)
21/02/1997 1030 < 3 26006/03/1997 970 < 3 26401/04/1997 1127 < 3 30701/05/1997 1118 < 3 31829/05/1997 721 < 3 19427/06/1997 81 < 3 14424/07/1997 < 10 < 3 3327/08/1997 962 < 3 33622/09/1997 972 < 3 32120/10/1997 1030 < 3 33819/11/1997 369 < 3 10723/12/1997 < 319/01/1998 321 < 3 10320/05/1998 964 < 3 27117/06/1998 1330 14 49414/07/1998 1220 < 3 35415/08/1998 1390 5 36924/09/1998 1724 < 3 38219/10/1998 1260 < 20 5824/11/1998 814 < 20 19421/12/1998 49 < 20 6.926/01/1999 48 < 20 8.724/02/1999 1170 < 20 34624/03/1999 1080 < 20 30705/05/1999 < 20 34030/06/1999 527 < 20 16317/08/1999 502 < 20 15029/09/1999 272 < 20 8701/11/1999 < 20 13401/12/1999 < 20 13701/01/2000 364 < 20 12125/02/2000 793 < 20 28416/03/2000 853 < 20 29314/04/2000 600 < 20 24025/05/2000 1130 < 20 43030/03/2006 381 <5 14717/05/2006 788 <5 29522/08/2006 734 <5 19126/09/2006 1100 <5 41031/10/2006 856 <5 28525/11/2006 267 <5 10927/11/2006 3 356 8.8 <5 11.6 122 0.057521/12/2006 477 <5 10531/01/2007 846 <5 34201/03/2007 358 < 5 10502/04/2007 768 < 5 18217/04/2007 942 < 5 40414/06/2007 1010 18.7 43923/07/2007 615 < 5 23322/08/2007 585 < 5 20626/09/2007 578 < 5 24523/10/2007 936 379
SLR

Viridor Waste ManagementYanley landfill HRA
SLR Ref:402-0036-00304-20July 2009
Date
MCPP (Mecoprop
)ug/lo-Xylene
(ug/l)Chloride
(mg/l)mp-Xylene
(ug/l)Cadmium
(ug/l)Toluene
(ug/l)
Ammoniacal Nitrogen
(mg/l)Mercury
(ug/l)
19/12/2007 638 36017/01/2008 813 35318/03/2008 447 < 0.00514/04/2008 33.1 863 <0.5 34719/05/2008 34.4 1010 <0.5 37417/06/2008 40.6 930 <0.5 37401/07/2008 49.9 <20.0 1110 <20.0 <0.5 <20.0 368 120.115/08/2008 1.82 860 0.6 23218/09/2008 9.04 474 0.6 90.721/10/2008 4.33 427 <0.3 82.306/11/2008 3.68 269 <0.3 59.304/12/2008 2.3 218 <0.3 50.313/02/2009 1.01 53 <0.3 18.405/03/2009 2.69 138 0.9 45.906/04/2009 3.49 172 1.7 25.201/05/2009 2.33 187 <0.3 36.204/06/2009 1.34 210 <0.3 19.7
Date
MCPP (Mecoprop
)ug/lo-Xylene
(ug/l)Chloride
(mg/l)mp-Xylene
(ug/l)Cadmium
(ug/l)Toluene
(ug/l)
Ammoniacal Nitrogen
(mg/l)Mercury
(ug/l)
17/01/2008 2000 118019/03/2008 1890 < 0.005
Date
MCPP (Mecoprop
)ug/lo-Xylene
(ug/l)Chloride
(mg/l)mp-Xylene
(ug/l)Cadmium
(ug/l)Toluene
(ug/l)
Ammoniacal Nitrogen
(mg/l)Mercury
(ug/l)
17/01/2008 1400 82419/03/2008 1280 < 0.005
Date
MCPP (Mecoprop
)ug/lo-Xylene
(ug/l)Chloride
(mg/l)mp-Xylene
(ug/l)Cadmium
(ug/l)Toluene
(ug/l)
Ammoniacal Nitrogen
(mg/l)Mercury
(ug/l)
19/12/2007 >2000 201017/01/2008 3800 200019/03/2008 3620 < 0.005
YN345A
YN346A
YN370A
YN383A
SLR

Viridor Waste ManagementYanley landfill HRA
SLR Ref:402-0036-00304-20July 2009
Date
MCPP (Mecoprop
)ug/lo-Xylene
(ug/l)Chloride
(mg/l)mp-Xylene
(ug/l)Cadmium
(ug/l)Toluene
(ug/l)
Ammoniacal Nitrogen
(mg/l)Mercury
(ug/l)
14/04/2008 133 1410 <0.5 49317/06/2008 86.2 1490 <0.5 60801/07/2008 148 <20.0 1570 <20.0 <0.5 <20.0 605 25.515/08/2008 129 1840 1.1 92918/09/2008 211 1700 <0.5 72921/10/2008 95.3 1710 <0.3 83406/11/2008 94.7 1570 0.4 81304/12/2008 87.9 1740 <0.3 88708/01/2009 96.4 1730 3.6 83104/02/2009 78 1790 <0.3 89013/02/2009 77.9 1760 <0.3 84105/03/2009 90.5 1820 1.5 90406/04/2009 97.6 1890 1.6 92901/05/2009 87.7 1860 <0.3 83604/06/2009 82.5 1830 0.4 767
Date
MCPP (Mecoprop
)ug/lo-Xylene
(ug/l)Chloride
(mg/l)mp-Xylene
(ug/l)Cadmium
(ug/l)Toluene
(ug/l)
Ammoniacal Nitrogen
(mg/l)Mercury
(ug/l)
19/05/2008 155 2390 0.9 150015/08/2008 186 2390 2.3 178018/09/2008 184 2400 1.1 152021/10/2008 176 2280 0.0007 146006/11/2008 167 2230 14 137004/12/2008 158 2210 <0.3 146008/01/2009 169 2310 5.7 163013/02/2009 124 2320 <0.3 178005/03/2009 147 2320 1.5 176006/04/2009 160 2470 2.5 178001/05/2009 161 2370 0.4 1510
Date
MCPP (Mecoprop
)ug/lo-Xylene
(ug/l)Chloride
(mg/l)mp-Xylene
(ug/l)Cadmium
(ug/l)Toluene
(ug/l)
Ammoniacal Nitrogen
(mg/l)Mercury
(ug/l)
14/04/2008 183 1500 1.2 100019/05/2008 264 1330 1.9 139017/06/2008 195 2080 0.8 91815/08/2008 276 1550 2.8 164018/09/2008 244 1610 1.3 132021/10/2008 308 1380 <0.3 143006/11/2008 241 1490 1.3 128004/12/2008 227 1370 0.7 149008/01/2009 270 1520 3 147013/02/2009 207 1510 <0.3 164005/03/2009 261 1610 2.6 174001/05/2009 258 1660 <0.3 162004/06/2009 245 1650 3.2 1360
YN503LM
YN387A
YN391LM
SLR

Viridor Waste ManagementYanley landfill HRA
SLR Ref:402-0036-00304-20July 2009
Date
MCPP (Mecoprop
)ug/lo-Xylene
(ug/l)Chloride
(mg/l)mp-Xylene
(ug/l)Cadmium
(ug/l)Toluene
(ug/l)
Ammoniacal Nitrogen
(mg/l)Mercury
(ug/l)
27/04/2006 277 <5 0.29117/05/2006 425 <5 1.4926/09/2006 547 <5 76.631/10/2006 502 <5 9525/11/2006 134 <5 18.127/11/2006 <2 130 3 <5 4.8 15.7 0.084821/12/2006 621 <5 10431/01/2007 607 <5 11601/03/2007 317 < 5 66.402/04/2007 560 < 5 12717/04/2007 535 < 5 97.116/06/2007 541 < 5 14424/07/2007 323 < 5 79.922/08/2007 377 < 5 68.726/09/2007 1220 < 5 3.3124/10/2007 448 57.419/12/2007 341 85.117/01/2008 562 12619/03/2008 367 < 0.00514/04/2008 8.63 392 0.6 85.319/05/2008 7.49 398 <0.5 81.717/06/2008 9.45 595 1.6 10117/07/2008 8.46 <10.0 416 <10.0 1 <10.0 71.7 <0.118/09/2008 9.57 445 0.5 79.521/10/2008 14.6 460 <0.3 11306/11/2008 18.3 603 <0.3 15904/12/2008 18.5 441 2.9 94.708/01/2009 30.8 815 2 19613/02/2009 22.8 579 <0.3 14905/03/2009 19.4 561 1.7 15806/04/2009 31 774 3.4 18401/05/2009 26.9 851 <0.3 20204/06/2009 36.2 950 <0.3 158
Date
MCPP (Mecoprop
)ug/lo-Xylene
(ug/l)Chloride
(mg/l)mp-Xylene
(ug/l)Cadmium
(ug/l)Toluene
(ug/l)
Ammoniacal Nitrogen
(mg/l)Mercury
(ug/l)
27/04/2006 162 <5 0.10617/05/2006 154 <5 1.1327/06/2006 179 <5 20.525/07/2006 719 <5 70.822/08/2006 588 <5 61.926/09/2006 731 <5 76.931/10/2006 769 <5 18225/11/2006 130 <5 21.227/11/2006 5.6 109 16 <5 51.2 19.4 0.072521/12/2006 586 <5 16831/01/2007 671 <5 141
YN504LM
SLR

Viridor Waste ManagementYanley landfill HRA
SLR Ref:402-0036-00304-20July 2009
Date
MCPP (Mecoprop
)ug/lo-Xylene
(ug/l)Chloride
(mg/l)mp-Xylene
(ug/l)Cadmium
(ug/l)Toluene
(ug/l)
Ammoniacal Nitrogen
(mg/l)Mercury
(ug/l)
01/03/2007 201 < 5 24.402/04/2007 648 < 5 16517/04/2007 772 < 5 15316/06/2007 673 < 5 16824/07/2007 224 < 5 20.522/08/2007 512 < 5 10126/09/2007 883 < 5 20322/10/2007 < 1024/10/2007 66117/01/2008 15014/04/2008 23.1 732 0.5 24119/05/2008 15.5 598 <0.5 19717/06/2008 19.5 748 <0.5 26117/07/2008 21.6 15.8 594 26.8 0.7 <10.0 263 <0.114/08/2008 0.05 45 <0.5 <0.318/09/2008 53.2 1050 0.8 30521/10/2008 2.82 246 <0.3 49.306/11/2008 8.09 184 0.5 52.604/12/2008 1.32 91 <0.3 0.908/01/2009 37.3 1030 6.9 45304/02/2009 4.27 251 <0.3 58.813/02/2009 13.9 487 <0.3 31605/03/2009 1.04 148 1.3 11.406/04/2009 19.6 553 3.4 26701/05/2009 27.7 901 0.4 37704/06/2009 51.8 1730 1.2 715
SLR

SLR
APPENDIX HRA2
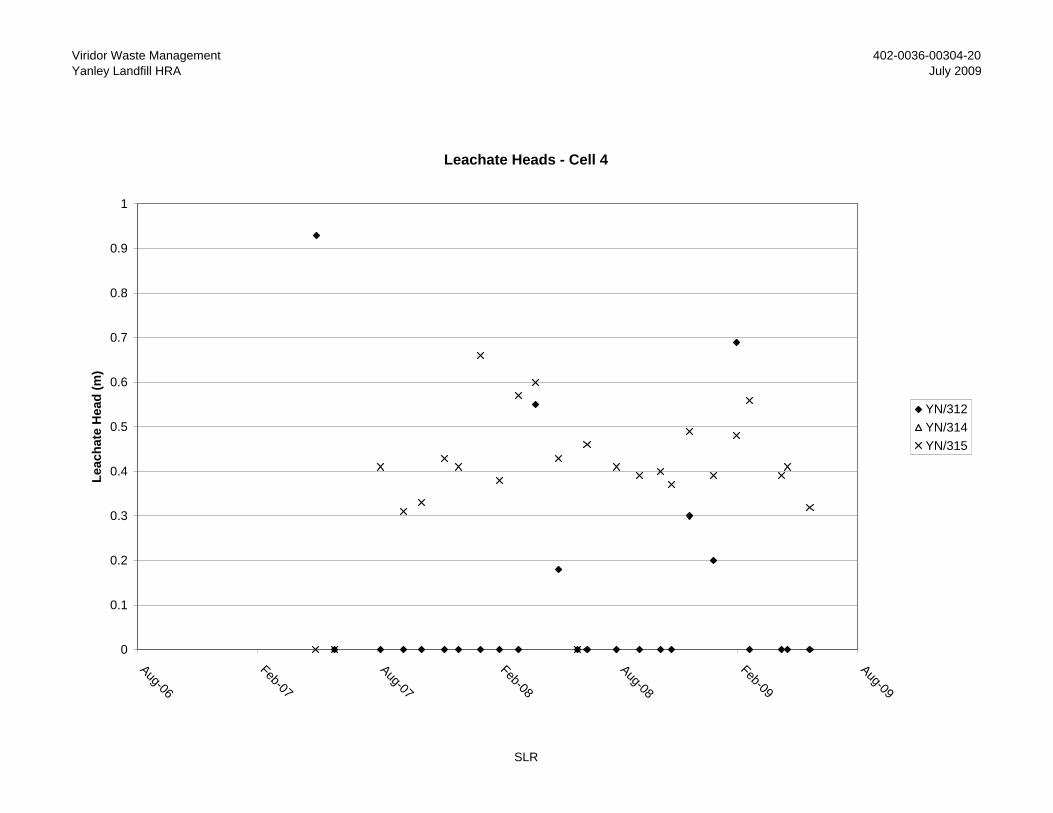
Viridor Waste ManagementYanley Landfill HRA
402-0036-00304-20July 2009
SLR
Leachate Heads - Cell 4
0
0.1
0.2
0.3
0.4
0.5
0.6
0.7
0.8
0.9
1
Aug-06
Feb-07
Aug-07
Feb-08
Aug-08
Feb-09
Aug-09
Lea
chat
e H
ead
(m
)
YN/312
YN/314
YN/315

Viridor Waste ManagementYanley Landfill HRA
402-0036-00304-20July 2009
SLR
Leachate Elevations - Cell 4
0.00
5.00
10.00
15.00
20.00
25.00
30.00
35.00
Aug-06
Feb-07
Aug-07
Feb-08
Aug-08
Feb-09
Aug-09
Lea
chat
e E
leva
tio
n (
maO
D)
YN/312
YN/314
YN/315

Viridor Waste ManagementYanley Landfill HRA
402-0036-00304-20July 2009
SLR
Leachate Heads - Cell 5
0
0.1
0.2
0.3
0.4
0.5
0.6
Aug-06
Feb-07
Aug-07
Feb-08
Aug-08
Feb-09
Aug-09
Lea
chat
e H
ead
(m
)
YN/313
YN/317
YN/320

Viridor Waste ManagementYanley Landfill HRA
402-0036-00304-20July 2009
SLR
Leachate Elevations - Cell 5
0.00
5.00
10.00
15.00
20.00
25.00
30.00
35.00
Aug-06
Feb-07
Aug-07
Feb-08
Aug-08
Feb-09
Aug-09
Lea
chat
e E
leva
tio
n (
maO
D)
YN/313
YN/317
YN/320

Viridor Waste ManagementYanley Landfill HRA
402-0036-00304-20July 2009
SLR
Leachate Heads - Cell 6
0
0.5
1
1.5
2
2.5
3
3.5
4
Aug-06
Feb-07
Aug-07
Feb-08
Aug-08
Feb-09
Aug-09
Lea
chat
e H
ead
(m
)
YN/327
YN356A
YN370A

Viridor Waste ManagementYanley Landfill HRA
402-0036-00304-20July 2009
SLR
Leachate Elevations - Cell 6
0
5
10
15
20
25
30
Aug-06
Feb-07
Aug-07
Feb-08
Aug-08
Feb-09
Aug-09
Lea
chat
e E
leva
tio
n (
maO
D)
YN/327
YN356A
YN370A

Viridor Waste ManagementYanley Landfill HRA
402-0036-00304-20July 2009
SLR
Leachate Heads - Cell 7a
0
1
2
3
4
5
6
7
8
9
10
Aug-07
Feb-08
Aug-08
Feb-09
Aug-09
Lea
chat
e H
ead
(m
) YN345A
YN346A
YN349A
YN349B
YN358A
YN383A

Viridor Waste ManagementYanley Landfill HRA
402-0036-00304-20July 2009
SLR
Leachate Elevations - Cell 7a
0
5
10
15
20
25
30
35
40
Aug-07
Feb-08
Aug-08
Feb-09
Aug-09
Lea
chat
e E
leva
tio
n (
maO
D)
YN345A
YN346A
YN349A
YN349B
YN358A
YN383A

Viridor Waste ManagementYanley Landfill HRA
402-0036-00304-20July 2009
SLR
Leachate Heads - Cell 7b
0
1
2
3
4
5
6
7
8
9
10
Aug-07
Feb-08
Aug-08
Feb-09
Aug-09
Lea
chat
e H
ead
(m
)
YN387A
YN389A

Viridor Waste ManagementYanley Landfill HRA
402-0036-00304-20July 2009
SLR
Leachate Elevations - Cell 7b
0
5
10
15
20
25
30
Aug-07
Feb-08
Aug-08
Feb-09
Aug-09
Lea
chat
e E
leva
tio
n (
maO
D)
YN387A
YN389A

Viridor Waste ManagementYanley Landfill HRA
402-0036-00304-20July 2009
SLR
Leachate Heads - Cell 8a
0
2
4
6
8
10
12
Aug-07
Feb-08
Aug-08
Feb-09
Aug-09
Lea
chat
e H
ead
(m
)
YN391LM

Viridor Waste ManagementYanley Landfill HRA
402-0036-00304-20July 2009
SLR
Leachate Elevations - Cell 8a
0.00
5.00
10.00
15.00
20.00
25.00
30.00
Aug-07
Feb-08
Aug-08
Feb-09
Aug-09
Lea
chat
e E
leva
tio
n (
maO
D)
YN391LM

Viridor Waste ManagementYanley Landfill HRA
402-0036-00304-20July 2009
SLR
Leachate Heads - Cell S1
0
0.2
0.4
0.6
0.8
1
1.2
1.4
1.6
1.8
Aug-06
Feb-07
Aug-07
Feb-08
Aug-08
Feb-09
Aug-09
Lea
chat
e H
ead
(m
)
YNS503LM
YNS505LM

Viridor Waste ManagementYanley Landfill HRA
402-0036-00304-20July 2009
SLR
Leachate Elevations - Cell S1
31
32
33
34
35
36
37
Aug-06
Feb-07
Aug-07
Feb-08
Aug-08
Feb-09
Aug-09
Lea
chat
e E
leva
tio
n (
maO
D)
YNS503LM
YNS505LM

Viridor Waste ManagementYanley Landfill HRA
402-0036-00304-20July 2009
SLR
Leachate Heads - Cell S2
0
0.5
1
1.5
2
2.5
3
3.5
Aug-06
Feb-07
Aug-07
Feb-08
Aug-08
Feb-09
Aug-09
Lea
chat
e H
ead
s (m
)
YNS504LM
YNS506LM
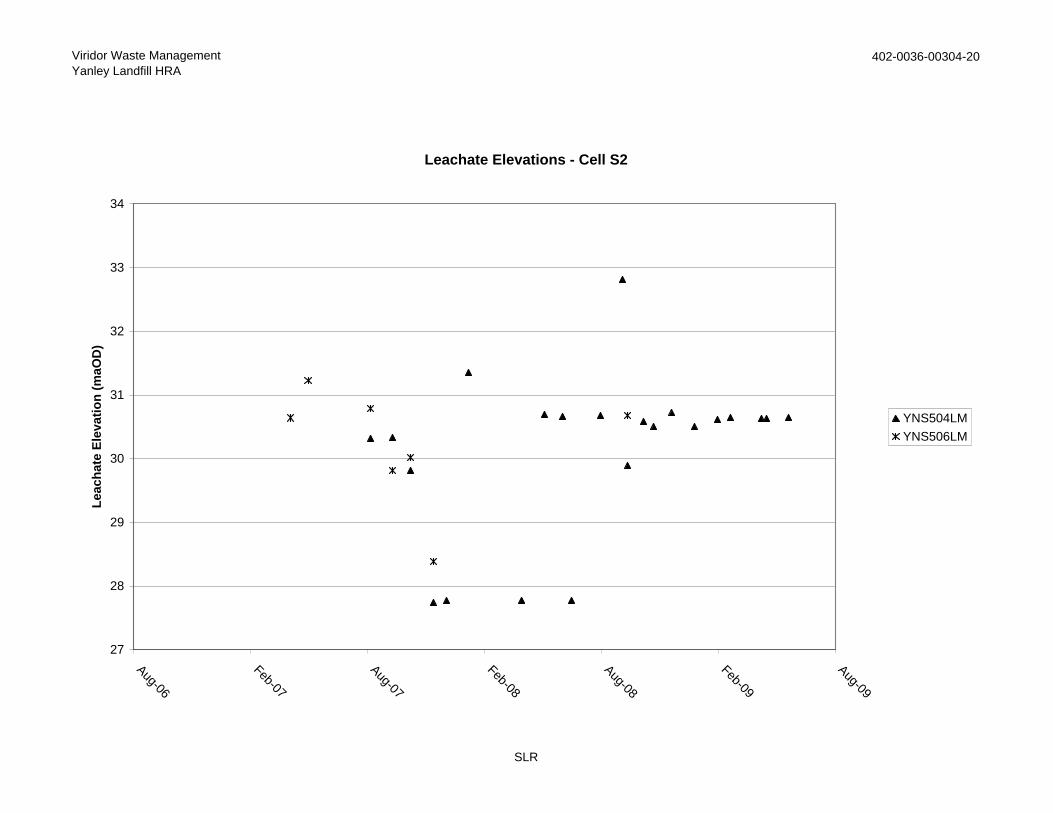
Viridor Waste ManagementYanley Landfill HRA
402-0036-00304-20
SLR
Leachate Elevations - Cell S2
27
28
29
30
31
32
33
34
Aug-06
Feb-07
Aug-07
Feb-08
Aug-08
Feb-09
Aug-09
Lea
chat
e E
leva
tio
n (
maO
D)
YNS504LM
YNS506LM

SLR
APPENDIX HRA3

Viridor Waste ManagementYanley Landfill HRA
402-0036-00304-20
SLR
Groundwater Levels - Coal Measures (Up-gradient)
0.00
5.00
10.00
15.00
20.00
25.00
30.00
35.00
40.00
45.00
50.00
Dec-00
Dec-01
Dec-02
Dec-03
Dec-04
Dec-05
Dec-06
Dec-07
Dec-08
Dec-09
Gro
un
dw
ater
Ele
vati
on
(m
aOD
)
YN/629 YN/631 YN/632 YN/619A

Viridor Waste ManagementYanley Landfill HRA
402-0036-00304-20
SLR
Groundwater Levels - Coal Measures (Down-gradient and Cross-gradient)
-5.00
0.00
5.00
10.00
15.00
20.00
Dec-92Dec-93Dec-94Dec-95Dec-96Dec-97Dec-98Dec-99Dec-00Dec-01Dec-02Dec-03Dec-04Dec-05Dec-06Dec-07Dec-08Dec-09Dec-10
Gro
un
dw
ater
Ele
vati
on
(m
aOD
)
YN/602 YN/604 YN/607 YN/610 YN/612 YN/627

Viridor Waste ManagementYanley Landfill HRA
402-0036-00304-20July 2009
SLR
Groundwater Levels - Mercia Mudstone (Up-gradient)
0.00
10.00
20.00
30.00
40.00
50.00
60.00
70.00
Dec-00
Dec-01
Dec-02
Dec-03
Dec-04
Dec-05
Dec-06
Dec-07
Dec-08
Dec-09
Gro
un
dw
ater
Ele
vati
on
(m
aOD
)
YN/618
YN/619
YN/630
YN/633

Viridor Waste ManagementYanley Landfill HRA
402-0036-00304-20July 2009
SLR
Groundwater Levels - Mercia Mudstone (Down-gradient and Cross-gradient)
0.00
5.00
10.00
15.00
20.00
25.00
30.00
Dec-02
Dec-03
Dec-04
Dec-05
Dec-06
Dec-07
Dec-08
Dec-09
Gro
un
dw
ater
Ele
vati
on
(m
aOD
)
YN/601
YN/603
YN/605
YN/608
YN/611
YN/613
YN/614
YN/616

SLR
APPENDIX HRA4

Viridor Waste ManagementYanley Landfill HRA
SLR Ref:402-0036-00304-20July 2009
SLR
Ammoniacal Nitrogen Concentrations in Coal measures Up-Gradient of Site
0
0.5
1
1.5
2
2.5
3
Dec-01 Dec-03 Dec-05 Dec-07 Dec-09
Date
Co
nce
ntr
atio
n (
mg
/l)
YN/629
YN/631
YN/632
YN/616

Viridor Waste ManagementYanley Landfill HRA
SLR Ref:402-0036-00304-20July 2009
SLR
Ammoniacal Nitrogen Concentrations in Coal measures Down-Gradient and Cross-gradient of Site
0
2
4
6
8
10
12
14
16
18
Dec-95 Dec-97 Dec-99 Dec-01 Dec-03 Dec-05 Dec-07 Dec-09
Date
Co
nce
ntr
atio
n (
mg
/l)
YN/602
YN/604
YN/607
YN/610
YN/612
YN/627

Viridor Waste ManagementYanley Landfill HRA
SLR Ref:402-0036-00304-20July 2009
SLR
Chloride Concentrations in Coal measures Up-Gradient of Site
0
10
20
30
40
50
60
Dec-01 Dec-03 Dec-05 Dec-07 Dec-09
Date
Co
nce
ntr
atio
n (
mg
/l)
YN/629
YN/631
YN/632
YN/616
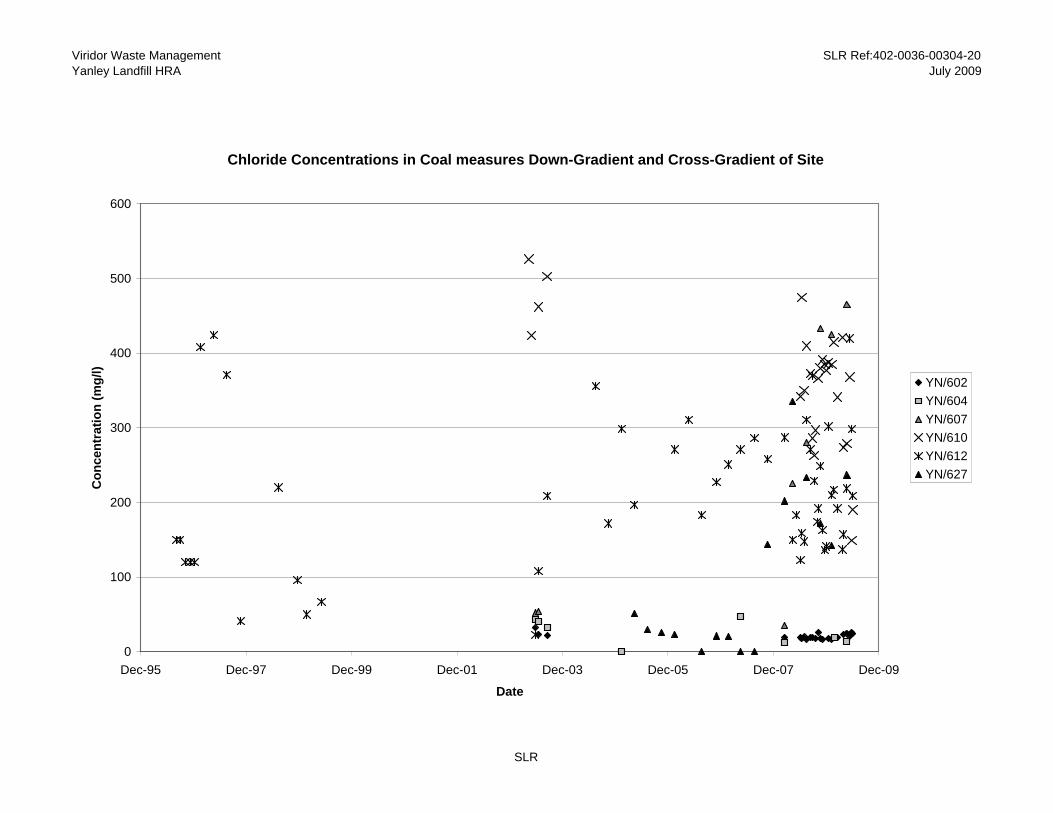
Viridor Waste ManagementYanley Landfill HRA
SLR Ref:402-0036-00304-20July 2009
SLR
Chloride Concentrations in Coal measures Down-Gradient and Cross-Gradient of Site
0
100
200
300
400
500
600
Dec-95 Dec-97 Dec-99 Dec-01 Dec-03 Dec-05 Dec-07 Dec-09
Date
Co
nce
ntr
atio
n (
mg
/l)
YN/602
YN/604
YN/607
YN/610
YN/612
YN/627
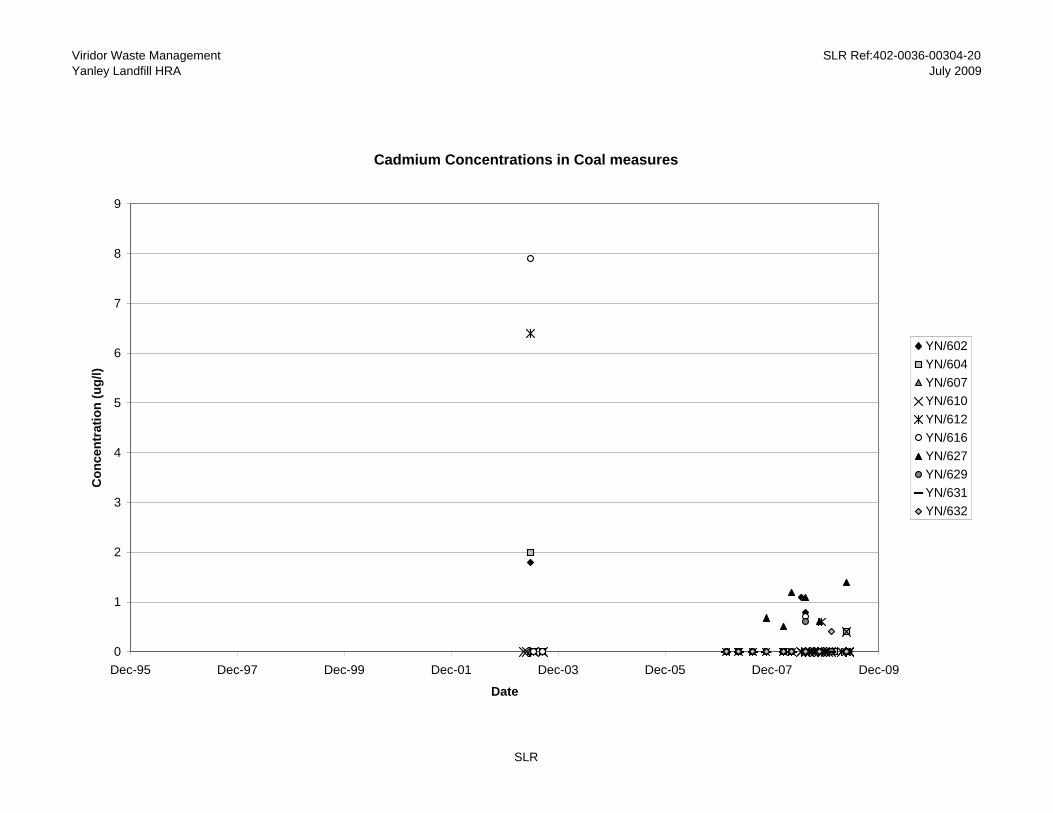
Viridor Waste ManagementYanley Landfill HRA
SLR Ref:402-0036-00304-20July 2009
SLR
Cadmium Concentrations in Coal measures
0
1
2
3
4
5
6
7
8
9
Dec-95 Dec-97 Dec-99 Dec-01 Dec-03 Dec-05 Dec-07 Dec-09
Date
Co
nce
ntr
atio
n (
ug
/l)
YN/602
YN/604
YN/607
YN/610
YN/612
YN/616
YN/627
YN/629
YN/631
YN/632

Viridor Waste ManagementYanley Landfill HRA
SLR Ref:402-0036-00304-20July 2009
SLR
Mecoprop Concentrations in Coal measures
0
0.2
0.4
0.6
0.8
1
1.2
1.4
1.6
1.8
2
Dec-95 Dec-97 Dec-99 Dec-01 Dec-03 Dec-05 Dec-07 Dec-09
Date
Co
nce
ntr
atio
n (
ug
/l)
YN/602
YN/604
YN/607
YN/610
YN/612
YN/616
YN/627
YN/629
YN/631
YN/632
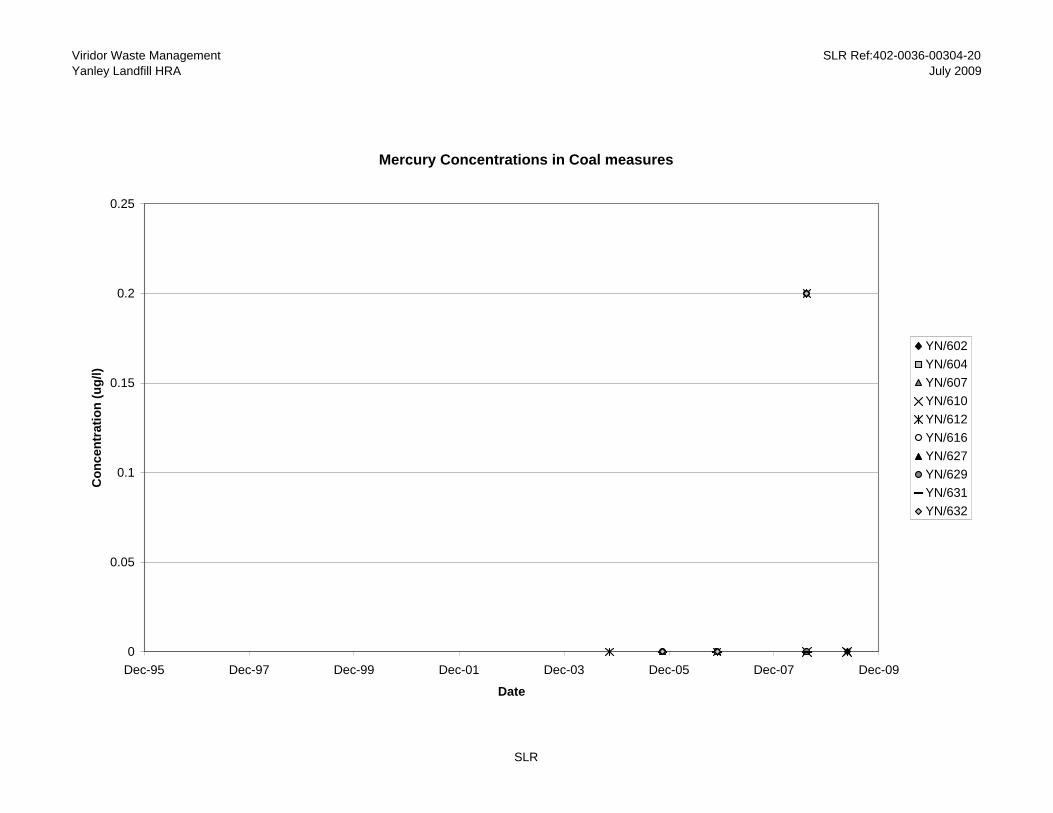
Viridor Waste ManagementYanley Landfill HRA
SLR Ref:402-0036-00304-20July 2009
SLR
Mercury Concentrations in Coal measures
0
0.05
0.1
0.15
0.2
0.25
Dec-95 Dec-97 Dec-99 Dec-01 Dec-03 Dec-05 Dec-07 Dec-09
Date
Co
nce
ntr
atio
n (
ug
/l)
YN/602
YN/604
YN/607
YN/610
YN/612
YN/616
YN/627
YN/629
YN/631
YN/632

Viridor Waste managementYanley Landfill HRA
SLR Ref:402-0036-00304-20July 2009
DateCadmium (ug/l)
Chloride (mg/l)
Ammoniacal Nitrogen (mg/l)
Mercury (ug/l)
Toluene (ug/l)
mp-Xylene (ug/l)
o-Xylene (ug/l)
MCPP (Mecoprop)ug/l
28/05/2003 1.8 32 16.719/06/2003 < 0.2 23.8 10.220/08/2003 < 0.2 21.9 1.7919/02/2008 < 0.22 19.515/04/200807/05/200805/06/2008 19 3.317/06/2008 1.1 18 10.501/07/2008 20 3.617/07/200818/07/2008 0.8 17 2.4 <0.1 <0.10 <0.10 <0.1014/08/2008 <0.5 19 4.127/08/2008 19 1.808/09/200818/09/2008 <0.5 18 2.406/10/2008 26 220/10/2008 <0.3 18 1.6 <0.0406/11/2008 17 1.718/12/2008 <0.3 18 <0.308/01/2009 <0.3 17 1.5 <0.0422/01/2009 19 117/02/2009 19 0.530/03/2009 23 0.824/04/2009 <0.3 25 0.7 <0.1 <0.10 <0.10 <0.10 <0.0414/05/2009 <0.3 21 0.927/05/2009 26 2.804/06/2009 24 1.8
DateCadmium (ug/l)
Chloride (mg/l)
Ammoniacal Nitrogen (mg/l)
Mercury (ug/l)
Toluene (ug/l)
mp-Xylene (ug/l)
o-Xylene (ug/l)
MCPP (Mecoprop)ug/l
28/05/2003 2 43.1 7.6419/06/2003 < 0.2 40.8 10.420/08/2003 < 0.2 32 9.7318/01/2005 <20 0.06218/04/2007 <0.55 47.3 <0.0523/10/200719/02/2008 < 0.22 12.915/04/200818/07/200820/10/200808/01/200930/01/2009 <0.3 19 <0.3 <0.0824/04/2009 0.4 14 1.6 <0.04
YN/602
YN/604
SLR

Viridor Waste managementYanley Landfill HRA
SLR Ref:402-0036-00304-20July 2009
DateCadmium (ug/l)
Chloride (mg/l)
Ammoniacal Nitrogen (mg/l)
Mercury (ug/l)
Toluene (ug/l)
mp-Xylene (ug/l)
o-Xylene (ug/l)
MCPP (Mecoprop)ug/l
28/05/2003 < 0.2 52 3.3519/06/2003 < 0.2 54.6 < 0.0523/10/200719/02/2008 < 0.22 35.215/04/2008 <0.5 225 0.4 <0.0418/07/2008 <0.5 280 0.7 <0.1 <0.10 0.1 <0.1020/10/2008 <0.3 433 2.3 <0.0408/01/2009 <0.3 425 3.4 <0.0424/04/2009 <0.3 466 2.7 <0.04
DateCadmium (ug/l)
Chloride (mg/l)
Ammoniacal Nitrogen (mg/l)
Mercury (ug/l)
Toluene (ug/l)
mp-Xylene (ug/l)
o-Xylene (ug/l)
MCPP (Mecoprop)ug/l
14/04/2003 < 0.2 526 3.1302/05/2003 < 0.2 424 1.75 <2.019/06/2003 < 0.2 462 0.7520/08/2003 < 0.2 503 0.4523/10/200715/04/200807/05/200805/06/2008 342 <0.317/06/2008 <0.5 475 7.501/07/2008 350 117/07/200818/07/2008 <0.5 410 0.6 <0.1 <0.10 <0.10 <0.1014/08/2008 <0.5 373 1.727/08/2008 286 <0.308/09/2008 263 <0.318/09/2008 <0.5 297 <0.306/10/2008 366 0.420/10/2008 <0.3 380 <0.3 0.3706/11/2008 <0.3 391 2.721/11/2008 385 <0.302/12/2008 <0.3 377 <0.318/12/2008 <0.3 387 <0.309/01/2009 <0.3 385 2.5 0.4322/01/2009 415 <0.317/02/2009 341 0.423/03/2009 <0.3 421 <0.330/03/2009 274 0.524/04/2009 0.4 279 <0.3 <0.1 <0.10 <0.10 <0.10 0.9314/05/2009 <0.3 368 0.527/05/2009 149 2.504/06/2009 190 <0.3
YN/607
YN/610
SLR

Viridor Waste managementYanley Landfill HRA
SLR Ref:402-0036-00304-20July 2009
DateCadmium (ug/l)
Chloride (mg/l)
Ammoniacal Nitrogen (mg/l)
Mercury (ug/l)
Toluene (ug/l)
mp-Xylene (ug/l)
o-Xylene (ug/l)
MCPP (Mecoprop)ug/l
08/08/1996 150 1.504/09/1996 150 0.9310/10/1996 120 1.213/11/1996 120 1.211/12/1996 120 < 0.00822/01/1997 408 2.125/04/1997 424 2.124/07/1997 371 1.120/10/199730/10/1997 41 0.0219/01/199805/05/199816/07/1998 220 1.725/11/1998 96 1.229/01/1999 50 0.3311/05/1999 67 0.6628/05/2003 6.4 22.6 0.66 <2.019/06/2003 < 0.2 108 0.5520/08/2003 < 0.2 209 0.9420/07/2004 356 1.7613/10/2004 172 1.38 < 0.053 <218/01/2005 299 1.713/04/2005 197 1.4319/01/2006 271 1.4427/04/2006 311 1.7425/07/2006 183 0.79502/11/2006 227 1.29 <0.05 <2 <2 <223/01/2007 <0.55 251 0.64418/04/2007 <0.55 271 0.15924/07/2007 <0.55 286 1.2523/10/2007 <0.400 258 1.6119/02/2008 < 0.22 28715/04/2008 <0.5 150 <0.3 <0.0407/05/2008 183 1.505/06/2008 123 <0.317/06/2008 <0.5 159 0.501/07/2008 148 0.617/07/200818/07/2008 <0.5 311 1.3 0.2 <0.10 <0.10 <0.1014/08/2008 <0.5 271 1.327/08/2008 370 1.108/09/2008 229 1.419/09/200829/09/2008 174 2.3 <0.0406/10/2008 192 120/10/2008 <0.3 249 0.3 <0.0406/11/2008 0.6 163 1.921/11/2008 136 102/12/2008 <0.3 141 0.418/12/2008 <0.3 302 <0.309/01/2009 <0.3 210 2.1 <0.04
YN/612
SLR

Viridor Waste managementYanley Landfill HRA
SLR Ref:402-0036-00304-20July 2009
DateCadmium (ug/l)
Chloride (mg/l)
Ammoniacal Nitrogen (mg/l)
Mercury (ug/l)
Toluene (ug/l)
mp-Xylene (ug/l)
o-Xylene (ug/l)
MCPP (Mecoprop)ug/l
22/01/2009 217 0.917/02/2009 192 4.923/03/2009 <0.3 137 0.730/03/2009 157 0.724/04/2009 <0.3 219 0.7 <0.1 <0.10 <0.10 <0.10 <0.0414/05/2009 <0.3 420 1.427/05/2009 298 204/06/2009 209 1.1
DateCadmium (ug/l)
Chloride (mg/l)
Ammoniacal Nitrogen (mg/l)
Mercury (ug/l)
Toluene (ug/l)
mp-Xylene (ug/l)
o-Xylene (ug/l)
MCPP (Mecoprop)ug/l
28/05/2003 7.9 20.8 0.12 <2.019/06/2003 < 0.2 < 20 11.320/08/2003 < 0.2 < 20 0.0920/07/2004 < 20 0.06513/04/2005 22.1 <0.0519/01/2006 <20 0.07327/04/2006 21.8 0.0725/07/2006 <20 0.27502/11/2006 20.1 0.513 <0.05 <2 <2 <223/01/2007 <0.55 21.3 <0.0519/04/2007 <0.55 <20 <0.0523/07/2007 <0.55 <20 <0.0523/10/2007 <0.400 18.5 2.119/02/2008 < 0.22 22.615/04/2008 <0.5 23 <0.3 <0.0418/07/2008 0.7 20 <0.3 0.2 <0.10 0.12 <0.1020/10/2008 <0.3 22 <0.3 <0.0409/01/2009 <0.3 19 <0.3 <0.0424/04/2009 <0.3 17 1.2 <0.04
DateCadmium (ug/l)
Chloride (mg/l)
Ammoniacal Nitrogen (mg/l)
Mercury (ug/l)
Toluene (ug/l)
mp-Xylene (ug/l)
o-Xylene (ug/l)
MCPP (Mecoprop)ug/l
13/04/2005 51.2 <0.0512/07/2005 29.4 <0.0520/10/2005 25.5 <0.05 <0.05 <2 <2 <219/01/2006 23 <0.0525/07/2006 <20 <0.0502/11/2006 21.2 0.089 <0.05 <2 <2 <223/01/2007 <0.55 20.8 <0.0518/04/2007 <0.55 <20 <0.0524/07/2007 <0.55 <20 0.18624/10/2007 0.68 144 1.4319/02/2008 0.504 20215/04/2008 1.2 335 0.8 0.65
YN/612 continued
YN/616
YN/627
SLR

Viridor Waste managementYanley Landfill HRA
SLR Ref:402-0036-00304-20July 2009
DateCadmium (ug/l)
Chloride (mg/l)
Ammoniacal Nitrogen (mg/l)
Mercury (ug/l)
Toluene (ug/l)
mp-Xylene (ug/l)
o-Xylene (ug/l)
MCPP (Mecoprop)ug/l
18/07/2008 1.1 234 0.9 <0.1 <0.10 <0.10 <0.1020/10/2008 0.6 172 1.8 1.8309/01/2009 <0.3 142 3 1.4824/04/2009 1.4 237 1.2 1.11
DateCadmium (ug/l)
Chloride (mg/l)
Ammoniacal Nitrogen (mg/l)
Mercury (ug/l)
Toluene (ug/l)
mp-Xylene (ug/l)
o-Xylene (ug/l)
MCPP (Mecoprop)ug/l
15/03/2005 26.6 <0.0512/04/2005 35.5 <0.0512/07/2005 42.5 0.08719/10/2005 42.1 <0.05 <0.05 <2 <2 <219/01/2006 <20 <0.0527/04/2006 <20 <0.0525/07/2006 25.1 0.05502/11/2006 40.2 <0.05 <0.05 <2 <2 <223/01/2007 <0.55 23.8 <0.0519/04/2007 <0.55 22 <0.0524/07/2007 <0.55 34.6 <0.0523/10/2007 <0.400 30.8 <0.20020/02/2008 < 0.22 47.715/04/2008 <0.5 34 <0.3 <0.0418/07/2008 0.6 55 <0.3 <0.1 <0.10 <0.10 <0.1020/10/2008 <0.3 53 <0.3 <0.0409/01/2009 <0.3 43 2 <0.0424/04/2009 <0.3 47 <0.3 <0.04
DateCadmium (ug/l)
Chloride (mg/l)
Ammoniacal Nitrogen (mg/l)
Mercury (ug/l)
Toluene (ug/l)
mp-Xylene (ug/l)
o-Xylene (ug/l)
MCPP (Mecoprop)ug/l
12/04/2005 <20 <0.0512/07/2005 23.8 0.07419/10/2005 <20 0.093 <0.05 <2 <2 <219/01/2006 <20 <0.0527/04/2006 <20 0.06525/07/2006 <20 <0.0502/11/2006 22.7 <0.05 <0.05 <2 <2 <223/01/2007 <0.55 23.1 <0.0519/04/2007 <0.55 27.7 <0.0524/07/2007 <0.55 <20 <0.0523/10/2007 <0.400 18.2 <0.20020/02/2008 < 0.22 25.415/04/2008 <0.5 25 <0.3 <0.0418/07/2008 <0.5 26 <0.3 <0.1 <0.10 <0.10 <0.1020/10/2008 <0.3 40 <0.3 <0.0409/01/2009 <0.3 22 1.6 <0.04
YN/631
YN/627 Continued
YN/629
SLR

Viridor Waste managementYanley Landfill HRA
SLR Ref:402-0036-00304-20July 2009
DateCadmium (ug/l)
Chloride (mg/l)
Ammoniacal Nitrogen (mg/l)
Mercury (ug/l)
Toluene (ug/l)
mp-Xylene (ug/l)
o-Xylene (ug/l)
MCPP (Mecoprop)ug/l
12/04/2005 <20 <0.0512/07/2005 <20 <0.0520/10/2005 <20 <0.05 <0.05 <2 <2 <219/01/2006 <20 <0.0527/04/2006 <20 0.06425/07/2006 <20 <0.0502/11/2006 <20 <0.05 <0.05 <2 <2 <223/01/2007 <0.55 <20 <0.0517/04/2007 <0.55 <20 <0.0524/07/2007 <0.55 <20 <0.0524/10/2007 <0.400 12.2 <0.20020/02/2008 < 0.22 8.915/04/2008 <0.5 9 <0.3 <0.0418/07/2008 <0.5 9 <0.3 0.2 <0.10 <0.10 <0.1020/10/2008 <0.3 12 <0.3 <0.0409/01/2009 0.4 7 2.5 <0.0424/04/2009 <0.3 10 <0.3 <0.04
YN/632
SLR

Ammoniacal Nitrogen Concentrations in Mercia Mudstone Up-Gradient of Site
0
0.5
1
1.5
2
2.5
Dec-02 Dec-03 Dec-04 Dec-05 Dec-06 Dec-07 Dec-08 Dec-09
Date
Co
nce
ntr
atio
n (
mg
/l)
YN/601
YN/628
YN/633

Ammoniacal Nitrogen Concentrations in Mercia Mudstone Down-Gradient and Cross-Gradient of Site
0
0.5
1
1.5
2
2.5
3
3.5
4
4.5
Dec-01 Dec-02 Dec-03 Dec-04 Dec-05 Dec-06 Dec-07 Dec-08 Dec-09
Date
Co
nce
ntr
atio
n (
mg
/l)
YN/603
YN/605
YN/608
YN/611
YN/613
YN/626

Chloride Concentrations in Mercia Mudstone Up-Gradient of Site
0
10
20
30
40
50
60
Dec-00 Dec-01 Dec-02 Dec-03 Dec-04 Dec-05 Dec-06 Dec-07 Dec-08 Dec-09
Date
Co
nce
ntr
atio
n (
mg
/l)
YN/619
YN/628
YN/633
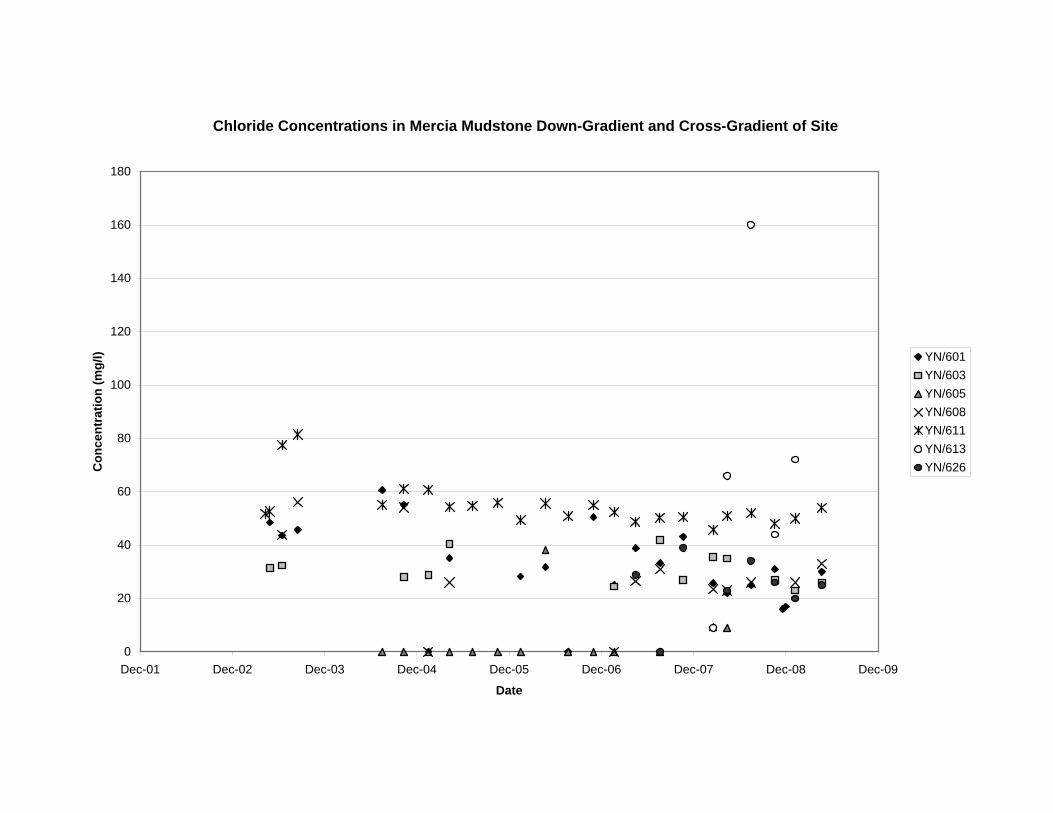
Chloride Concentrations in Mercia Mudstone Down-Gradient and Cross-Gradient of Site
0
20
40
60
80
100
120
140
160
180
Dec-01 Dec-02 Dec-03 Dec-04 Dec-05 Dec-06 Dec-07 Dec-08 Dec-09
Date
Co
nce
ntr
atio
n (
mg
/l) YN/601
YN/603
YN/605
YN/608
YN/611
YN/613
YN/626

Cadmium Concentrations in Mercia Mudstone
0
20
40
60
80
100
120
140
Dec-00 Dec-01 Dec-02 Dec-03 Dec-04 Dec-05 Dec-06 Dec-07 Dec-08 Dec-09
Date
Co
nce
ntr
atio
n (
ug
/l)
YN/601
YN/603
YN/605
YN/608
YN/611
YN/613
YN/619
YN/626
YN/628
YN/633

Mercury Concentrations in Mercia Mudstone
0
0.05
0.1
0.15
0.2
0.25
0.3
0.35
0.4
0.45
Dec-00 Dec-01 Dec-02 Dec-03 Dec-04 Dec-05 Dec-06 Dec-07 Dec-08 Dec-09
Date
Co
nce
ntr
atio
n (
ug
/l)
YN/601
YN/603
YN/605
YN/608
YN/611
YN/613
YN/619
YN/626
YN/628
YN/633

Mecoprop Concentrations in Mercia Mudstone
0
0.1
0.2
0.3
0.4
0.5
0.6
0.7
0.8
0.9
1
Dec-00 Dec-01 Dec-02 Dec-03 Dec-04 Dec-05 Dec-06 Dec-07 Dec-08 Dec-09
Date
Co
nce
ntr
atio
n (
ug
/l)
YN/601
YN/603
YN/605
YN/608
YN/611
YN/613
YN/619
YN/626
YN/628
YN/633

Viridor Waste ManagementYanley Landfill HRA
SLR Ref: 402-0036-00304-20July 2009
DateCadmium (ug/l)
Chloride (mg/l)
Ammoniacal Nitrogen (mg/l)
o-Xylene (ug/l)
Mercury (ug/l)
Toluene (ug/l)
mp-Xylene (ug/l)
MCPP (Mecoprop) ug/l
02/05/2003 10.20 48.50 0.48 <2.019/06/2003 116.00 43.60 0.1520/08/2003 21.90 45.70 < 0.0520/07/2004 9.10 60.60 < 0.0513/10/2004 10.60 55.10 0.07 0.10 <218/01/2005 <5 <20 <0.0512/04/2005 <5 35.10 <0.0518/01/2006 11.70 28.20 <0.0527/04/2006 <5 31.70 <0.0525/07/2006 <5 <20 <0.0502/11/2006 <5 50.40 <0.05 <2 <0.05 <2 <223/01/2007 25.00 0.2019/04/2007 38.80 <0.0524/07/2007 33.20 <0.0523/10/2007 43.10 <0.20019/02/2008 25.7015/04/2008 22.00 0.60 <0.0418/07/2008 25.00 1.20 <0.10 <0.1 <0.10 <0.1020/10/2008 31.00 <0.3 <0.0421/11/2008 16.00 2.0002/12/2008 17.00 0.9008/01/2009 23.00 1.60 <0.0424/04/2009 30.00 <0.3 <0.04
DateCadmium (ug/l)
Chloride (mg/l)
Ammoniacal Nitrogen (mg/l)
o-Xylene (ug/l)
Mercury (ug/l)
Toluene (ug/l)
mp-Xylene (ug/l)
MCPP (Mecoprop) ug/l
02/05/2003 8.33 31.40 0.54 <2.019/06/2003 18.10 32.30 1.8213/10/2004 < 5 28.00 < 0.05 < 0.05318/01/2005 <5 28.80 <0.0512/04/2005 <5 40.40 <0.0523/01/2007 24.40 <0.0523/07/2007 41.90 <0.0523/10/2007 27.0019/02/2008 35.5015/04/2008 35.00 <0.3 <0.0420/10/2008 27.00 <0.3 <0.0408/01/2009 23.00 0.60 <0.0424/04/2009 26.00 <0.3 <0.04
Borehole YN/603
Borehole YN/601
SLR

Viridor Waste ManagementYanley Landfill HRA
SLR Ref: 402-0036-00304-20July 2009
DateCadmium (ug/l)
Chloride (mg/l)
Ammoniacal Nitrogen (mg/l)
o-Xylene (ug/l)
Mercury (ug/l)
Toluene (ug/l)
mp-Xylene (ug/l)
MCPP (Mecoprop) ug/l
20/07/2004 8.40 < 20 < 0.0513/10/2004 27.30 < 20 0.58 < 0.053 <218/01/2005 <5 <20 <0.0512/04/2005 <5 <20 0.0512/07/2005 <5 <20 0.0520/10/2005 21.40 <20 0.07 <2 <0.05 <2 <219/01/2006 <5 <20 <0.0527/04/2006 6.00 38.10 <0.0525/07/2006 8.30 <20 0.0602/11/2006 6.40 <20 <0.05 <2 <0.05 <2 <223/01/2007 <20 <0.0523/07/2007 <20 <0.0519/02/2008 9.4015/04/2008 9.00 <0.3 <0.20
DateCadmium (ug/l)
Chloride (mg/l)
Ammoniacal Nitrogen (mg/l)
o-Xylene (ug/l)
Mercury (ug/l)
Toluene (ug/l)
mp-Xylene (ug/l)
MCPP (Mecoprop) ug/l
19/06/2003 < 5 43.80 1.3420/08/2003 < 5 56.10 0.6413/10/2004 < 5 54.10 < 0.05 < 0.5318/01/2005 <5 <20 <0.0512/04/2005 <5 26.00 <0.0523/01/2007 <20 <0.0518/04/2007 26.50 <0.0524/07/2007 31.00 <0.0519/02/2008 23.5015/04/2008 23.00 <0.3 <0.0418/07/2008 26.00 <0.3 <0.10 <0.1 <0.10 <0.1020/10/200808/01/2009 26.00 0.50 <0.0424/04/2009 33.00 <0.3 <0.10 <0.1 <0.10 <0.10 <0.04
DateCadmium (ug/l)
Chloride (mg/l)
Ammoniacal Nitrogen (mg/l)
o-Xylene (ug/l)
Mercury (ug/l)
Toluene (ug/l)
mp-Xylene (ug/l)
MCPP (Mecoprop) ug/l
21/03/2003 <2.014/04/2003 < 5 51.70 < 0.0502/05/2003 < 5 52.60 0.37 <2.019/06/2003 < 5 77.50 3.8320/08/2003 < 5 81.50 0.3020/07/2004 < 5 55.10 0.2013/10/2004 < 5 61.10 0.18 < 0.053 <218/01/2005 <5 60.70 0.3013/04/2005 <5 54.30 <0.0512/07/2005 <5 54.70 0.0620/10/2005 <5 55.80 0.19 <2 <0.05 <2 <219/01/2006 <5 49.30 <0.0527/04/2006 <5 55.60 1.18
Borehole YN/608
Borehole YN/605
Borehole YN/611
SLR

Viridor Waste ManagementYanley Landfill HRA
SLR Ref: 402-0036-00304-20July 2009
DateCadmium (ug/l)
Chloride (mg/l)
Ammoniacal Nitrogen (mg/l)
o-Xylene (ug/l)
Mercury (ug/l)
Toluene (ug/l)
mp-Xylene (ug/l)
MCPP (Mecoprop) ug/l
25/07/2006 <5 50.90 1.5002/11/2006 <5 55.00 0.60 <2 <0.05 <2 <223/01/2007 52.30 0.3117/04/2007 48.80 0.0823/07/2007 50.20 <0.0523/10/2007 50.50 0.3819/02/2008 45.7015/04/2008 51.00 0.50 <0.0418/07/2008 52.00 <0.3 <0.10 <0.1 <0.10 <0.1020/10/2008 48.00 <0.3 <0.0409/01/2009 50.00 <0.3 <0.0424/04/2009 54.00 <0.3 <0.04
DateCadmium (ug/l)
Chloride (mg/l)
Ammoniacal Nitrogen (mg/l)
o-Xylene (ug/l)
Mercury (ug/l)
Toluene (ug/l)
mp-Xylene (ug/l)
MCPP (Mecoprop) ug/l
19/02/2008 8.9015/04/2008 66.00 <0.3 <0.0418/07/2008 160.00 2.10 <0.10 0.40 <0.10 <0.1020/10/2008 44.00 <0.3 <0.0409/01/2009 72.00 <0.3 <0.04
DateCadmium (ug/l)
Chloride (mg/l)
Ammoniacal Nitrogen (mg/l)
o-Xylene (ug/l)
Mercury (ug/l)
Toluene (ug/l)
mp-Xylene (ug/l)
MCPP (Mecoprop) ug/l
31/05/2001 < 5 < 20 0.5020/06/2001 < 5 20.70 < 0.0505/07/2001 < 5 < 20 < 0.0530/01/2002 < 5 < 20 < 0.0506/03/2002 < 5 < 20 < 0.0528/04/2002 < 5 < 20 0.1724/05/2002 < 5 < 20 0.0828/06/2002 < 5 < 20 0.3730/07/2002 < 5 < 20 < 0.0528/08/2002 < 5 < 20 0.0719/09/2002 < 5 < 20 < 0.0504/10/2002 < 5 < 20 0.1318/11/2002 < 5 < 20 < 0.0520/12/2002 < 5 < 20 0.0621/01/2003 < 5 < 20 0.0612/02/2003 < 5 < 20 0.2811/03/2003 < 5 < 20 0.1109/04/2003 < 5 < 20 3.1212/05/2003 < 5 < 20 < 0.612/06/2003 < 5 < 20 0.3113/08/2003 < 5 52.70 0.2116/09/2003 < 5 < 20 0.6615/10/2003 < 5 21.90 0.2802/12/2003 < 5 < 20 1.0019/01/2004 < 5 < 20 0.17
Borehole YN/619
Borehole YN/613
SLR

Viridor Waste ManagementYanley Landfill HRA
SLR Ref: 402-0036-00304-20July 2009
DateCadmium (ug/l)
Chloride (mg/l)
Ammoniacal Nitrogen (mg/l)
o-Xylene (ug/l)
Mercury (ug/l)
Toluene (ug/l)
mp-Xylene (ug/l)
MCPP (Mecoprop) ug/l
12/02/2004 < 5 < 20 < 0.0509/03/2004 < 5 < 20 0.0807/04/2004 < 5 < 20 < 0.0520/07/2004 < 5 < 20 < 0.0513/10/2004 < 5 < 20 0.23 < 0.53 <218/01/2005 <5 <20 0.7712/04/2005 <5 <20 <0.0512/07/2005 <5 21.80 0.7019/10/2005 12.70 <20 1.41 <2 <0.05 <2 <219/01/2006 <5 <20 <0.0527/04/2006 <5 21.10 <0.0525/07/2006 <5 <20 <0.0502/11/2006 <5 <20 <0.05 <2 <0.05 <2 <223/01/2007 <20 <0.0517/04/2007 23.20 <0.0524/07/2007 <20 0.0724/10/2007 16.80 <0.20020/02/2008 18.5015/04/2008 19.00 <0.3 <0.0418/07/2008 16.00 <0.3 <0.10 <0.1 <0.10 <0.1020/10/2008 17.00 <0.3 <0.0409/01/2009 18.00 <0.3 <0.0424/04/2009 24.00 <0.3 <0.04
DateCadmium (ug/l)
Chloride (mg/l)
Ammoniacal Nitrogen (mg/l)
o-Xylene (ug/l)
Mercury (ug/l)
Toluene (ug/l)
mp-Xylene (ug/l)
MCPP (Mecoprop) ug/l
19/04/2007 28.80 <0.0524/07/2007 <20 <0.0523/10/2007 39.00 <0.20015/04/2008 23.00 <0.3 <0.0418/07/2008 34.00 <0.3 <0.10 <0.1 <0.10 <0.1020/10/2008 26.00 <0.3 <0.0409/01/2009 20.00 <0.3 <0.0424/04/2009 25.00 <0.3 <0.04
Borehole YN/626
SLR

Viridor Waste ManagementYanley Landfill HRA
SLR Ref: 402-0036-00304-20July 2009
DateCadmium (ug/l)
Chloride (mg/l)
Ammoniacal Nitrogen (mg/l)
o-Xylene (ug/l)
Mercury (ug/l)
Toluene (ug/l)
mp-Xylene (ug/l)
MCPP (Mecoprop) ug/l
12/04/2005 <5 <20 <0.0512/07/2005 6.30 <20 <0.0519/10/2005 22.90 <20 <0.05 <2 <0.05 <2 <219/01/2006 5.80 <20 <0.0527/04/2006 <5 <20 <0.0525/07/2006 5.30 <20 <0.0502/11/2006 6.70 <20 <0.05 <2 <0.05 <2 <223/01/2007 <20 <0.0519/04/2007 <20 <0.0524/07/2007 <20 <0.0520/02/2008 9.8015/04/2008 11.00 <0.3 <0.0418/07/2008 13.00 <0.3 <0.10 <0.1 <0.10 <0.1020/10/2008 9.00 <0.3 <0.0409/01/2009 10.00 <0.3 <0.0424/04/2009 14.00 <0.3 <0.04
DateCadmium (ug/l)
Chloride (mg/l)
Ammoniacal Nitrogen (mg/l)
o-Xylene (ug/l)
Mercury (ug/l)
Toluene (ug/l)
mp-Xylene (ug/l)
MCPP (Mecoprop) ug/l
12/04/2005 <5 <20 <0.0512/07/2005 <5 <20 <0.0520/10/2005 18.00 <20 <0.05 <2 <0.05 <2 <219/01/2006 16.80 <20 <0.0527/04/2006 11.80 <20 <0.0525/07/2006 <5 <20 <0.0502/11/2006 16.70 <20 1.29 <2 <0.05 <2 <223/01/2007 <20 <0.0517/04/2007 <20 <0.0524/07/2007 <20 <0.0524/10/2007 7.10 <0.20020/02/2008 5.8015/04/2008 7.00 <0.3 <0.0418/07/2008 5.00 <0.3 <0.10 0.30 <0.10 <0.1020/10/2008 6.00 <0.3 <0.0409/01/2009 4.00 1.70 <0.0424/04/2009 9.00 <0.3 <0.04
Borehole YN/633
Borehole YN/628
SLR

SLR
APPENDIX HRA5
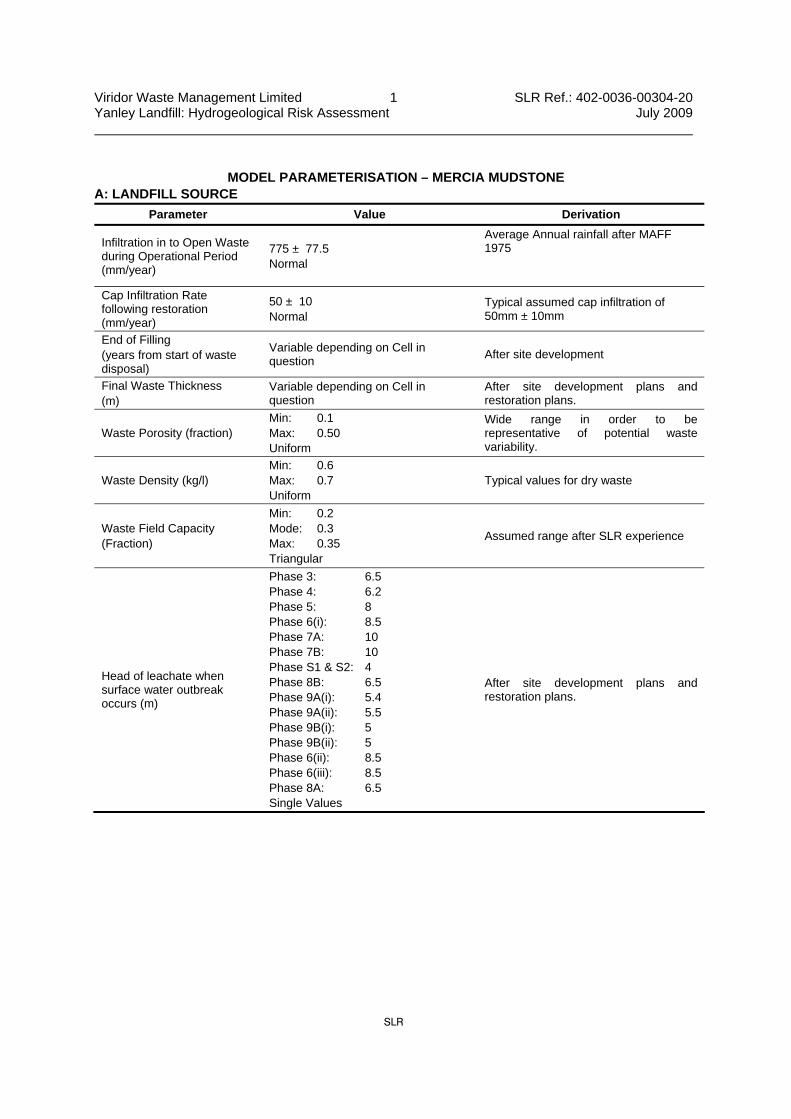
Viridor Waste Management Limited 1 SLR Ref.: 402-0036-00304-20 Yanley Landfill: Hydrogeological Risk Assessment July 2009
SLR
MODEL PARAMETERISATION – MERCIA MUDSTONE
A: LANDFILL SOURCE
Parameter Value Derivation
Infiltration in to Open Waste during Operational Period (mm/year)
775 ± 77.5 Normal
Average Annual rainfall after MAFF 1975
Cap Infiltration Rate following restoration (mm/year)
50 ± 10 Normal
Typical assumed cap infiltration of 50mm ± 10mm
End of Filling (years from start of waste disposal)
Variable depending on Cell in question
After site development
Final Waste Thickness (m)
Variable depending on Cell in question
After site development plans and restoration plans.
Waste Porosity (fraction) Min: 0.1 Max: 0.50 Uniform
Wide range in order to be representative of potential waste variability.
Waste Density (kg/l) Min: 0.6 Max: 0.7 Uniform
Typical values for dry waste
Waste Field Capacity (Fraction)
Min: 0.2 Mode: 0.3 Max: 0.35
Triangular
Assumed range after SLR experience
Head of leachate when surface water outbreak occurs (m)
Phase 3: 6.5 Phase 4: 6.2 Phase 5: 8 Phase 6(i): 8.5 Phase 7A: 10 Phase 7B: 10 Phase S1 & S2: 4 Phase 8B: 6.5 Phase 9A(i): 5.4 Phase 9A(ii): 5.5 Phase 9B(i): 5 Phase 9B(ii): 5 Phase 6(ii): 8.5 Phase 6(iii): 8.5 Phase 8A: 6.5 Single Values
After site development plans and restoration plans.

Viridor Waste Management Limited 2 SLR Ref.: 402-0036-00304-20 Yanley Landfill: Hydrogeological Risk Assessment July 2009
SLR
Parameter Value Derivation
Total Basal Area of Pit (Ha) 16.3 Single Value
Based on site surveys and CQA plans
Total Landfill Cap Area (Ha) 22.9 Single Value
Based on site surveys and CQA plans.
Specified Leachate Head (m)
Min Mode Max Phase 3: 0 0.4 0.93 Phase 4: 0 0.4 0.93 Phase 5: 0 0.3 0.48 Phase 6(i): 0 3.14 3.5 Phase 7A: 0.5 3.0 9.03 Phase 7B: 0.5 2.15 8.88 Phase S1 & S2: 0 2.54 2.99 Phase 8B: 0.63 2.64 11.36 Phase 9A(i): 0 0.95 1.89 Phase 9A(ii): 0 0.95 1.89 Phase 9B(i): 0 0.95 1.89 Phase 9B(ii): 0 0.95 1.89 Phase 6(ii): 3.2 3.97 4.74 Phase 6(iii): 3.2 3.97 4.74 Phase 8A: 0.63 2.64 11.36 Triangular
Monitoring results provided by Viridor
Duration of management control (years from start of waste disposal)
Variable depending on Cell in question
Based on site development and assuming 60 years post closure management.
B: LEACHATE QUALITY DATA
Parameter Value Derivation
Ammoniacal-N (mg/l)
Min: 0.11 Mode: 383 Max: 2010 Log Triangular
Based on site data as worst case.
Chloride (mg/l)
Min: 21 Mode: 889 Max: 3800 Log Triangular
Based on site data as worst case.
Mecoprop (mg/l)
Min: 0.00005 Mode: 0.078 Max: 0.308 Log Triangular
Based on site data as worst case.
Mercury (mg/l)
Min: 0.0000575 Mode: 0.0198 Max: 0.121 Log Triangular
Based on site data as worst case.

Viridor Waste Management Limited 3 SLR Ref.: 402-0036-00304-20 Yanley Landfill: Hydrogeological Risk Assessment July 2009
SLR
Parameter Value Derivation
Toluene (mg/l)
Min: 0.0048 Mode: 0.0135 Max: 0.0512 Log Triangular
Based on site data as worst case.
Xylene (mg/l)
Min: 0.003 Mode: 0.01 Max: 0.03 Log Triangular
Based on site data as worst case.
C: LEACHATE SOURCE TERM KAPPA VALUES AND HALF LIVES
Parameter Value Derivation
Values of m and c used to calculate the kappa value
Ammoniacal-N (kg/l) m = 0 c = 0.59
After LandSim 2.5 default values.
Chloride (kg/l) m = 0.0298 c = 0.2919
After LandSim 2.5 default values.
Mecoprop (kg/l) m = 0.0298 c = 0.2919
Values for Chloride assumed as worst case scenario
Mercury (kg/l) m = 0.0767 c = -0.1643
After LandSim 2.5 default values.
Half Lives
Xylene (years)
Toluene (years)
10 Fixed value
After LandSim 2.5 default values.

Viridor Waste Management Limited 4 SLR Ref.: 402-0036-00304-20 Yanley Landfill: Hydrogeological Risk Assessment July 2009
SLR
D: BASAL LINING SYSTEM (Artificial Mineral Liner)
Parameter Value Derivation
Engineered Mineral Liner Thickness (m)
1.0 +/- 0.01 Normal
Existing design as detailed in CQA reports for Phases S1, S2 and S3. No EBS assumed for older phases as worst case
Liner Permeability (m/s) Min: 1 x 10⁻¹⁰ Max: 1 x 10⁻⁹
Uniform Distribution Range of values from CQA reports
Density (kg/l) Min: 1.5 Max: 1.8
Uniform Distribution
Based on CQA reports and assumed range for clay.
Moisture Content (fraction) Min: 0.01 Max: 0.3 Uniform
Based on CQA reports and typical range for clay.
Longitudinal Dispersion 0.10 +/- 0.001 Normal
LandSim approach (10% of pathway length).
E: BIODEGRADATION AND RETARDATION PARAMETERS ASSUMED WITHIN THE ENGINEERED CLAY LINING SYSTEM
Parameter Value Derivation
Organic Carbon Content (fraction)
Min: 0.002 Max: 0.0039 Uniform
Site Investigation
Retardation Coefficient
Retardation Coefficient - Ammoniacal-N (Kd) (l/kg)
Min: 6.5 Max: 14.0 Uniform
AERC
Retardation Coefficient -Chloride (Kd) (l/kg)
0 Single Value
LandSim default values.
Retardation Coefficient - Mercury (Kd) (l/kg)
Min: 52 Mode: 450 Max: 3835 Uniform
Based on LandSim default values with lowest value at 52 for conservatism.

Viridor Waste Management Limited 5 SLR Ref.: 402-0036-00304-20 Yanley Landfill: Hydrogeological Risk Assessment July 2009
SLR
Parameter Value Derivation
Retardation Coefficient –Xylene (Koc) (l/kg)
Min: 158 Mode: 196 Max: 258 Triangular
Retardation Coefficient –Toluene (Koc) (l/kg)
Min: 94 Mode: 140 Max: 247 Triangular
US EPA
Retardation Coefficient –Mecoprop (Koc) (l/kg)
Min: 0 Mode: 10 Max: 60 Triangular
Value sourced from EA Attenuation of Mecoprop paper1.
Half Lives
Degradation Half Life - Ammoniacal-N (years)
1 x 10⁹ Single
Degradation Half Life – Chloride (years)
1 x 10⁹ Single Value
Degradation Half Life – Mercury (years)
1 x 10⁹ Single Value
No degradation assumed.
Degradation Half Life – Xylene (years)
Min: 0.038 Max: 0.986 Uniform
Representative data
Degradation Half Life – Toluene (years)
Min: 0.019 Max: 0.077 Uniform
Representative data
Degradation Half Life – Mecoprop (years)
Min: 0.08 Max: 0.5 Uniform
After Howard et. al. (1991) Handbook of Environmental Degradation Rates, and reflect range for aqueous anaerobic biodegradation.

Viridor Waste Management Limited 6 SLR Ref.: 402-0036-00304-20 Yanley Landfill: Hydrogeological Risk Assessment July 2009
SLR
F: UNSATURATED PATHWAY (CLAY AND MUDSTONE IN MERCIA MDST FORMATION)
Parameter Value Derivation
Thickness below landfill (m) Variable depending on Cell in question
Based on site investigation data and a skerry band zone at 10maOD.
Pathway Density (fraction) Min: 1.5 Max: 1.8 Uniform
Based on typical range for clay.
Vertical Hydraulic Conductivity (m/s)
Min: 1x10⁻¹⁰
Mode 1x10⁻⁹ Max: 1x10⁻⁸
Log Triangular
Derived from slug test data for the site by assuming vertical conductivity an order of magnitude lower than horizontal.
Longitudinal Dispersion (m) Variable depending on Cell in question
Based on 10% of pathway length
G: BIODEGRADATION AND RETARDATION PARAMETERS ASSUMED WITHIN THE UNSATURATED PATHWAY
Parameter Value Derivation
Organic Carbon Content (fraction)
Min: 0.002 Max: 0.0039 Uniform
Site Investigation
Retardation Coefficient
Retardation Coefficient - Ammoniacal-N (Kd) (l/kg)
Min: 6.5
Mode 11 Max: 14
Triangular
AERC
Retardation Coefficient -Chloride (Kd) (l/kg)
0 Single Value Landsim defaults
Retardation Coefficient - Mercury (Kd) (l/kg)
Min: 52 Mode: 450 Max: 3835 Uniform
Based on LandSim default values with lowest value at 52 for conservatism.
Retardation Coefficient –Xylene (Koc) (l/kg)
Min: 158
Mode 196 Max: 258
Triangular
Retardation Coefficient –Toluene (Koc) (l/kg)
Min: 94
Mode 140 Max: 247
Triangular
US EPA
Retardation Coefficient –Mecoprop (Koc) (l/kg)
Min: 0 Mode: 50 Max: 5700 Triangular
Value sourced from EA Guidance9
Half Lives
Degradation Half Life - Ammoniacal-N (years)
1 x 10⁹ Single Value
No degradation assumed
Degradation Half Life – Chloride (years)
1 x 10⁹ Single Value
No degradation assumed

Viridor Waste Management Limited 7 SLR Ref.: 402-0036-00304-20 Yanley Landfill: Hydrogeological Risk Assessment July 2009
SLR
Parameter Value Derivation
Degradation Half Life – Mercury (years)
1 x 10⁹ Single Value
No degradation assumed
Degradation Half Life – Xylene (years)
Min: 0.038 Max: 0.986 Uniform
Representative data
Degradation Half Life – Toluene (years)
Min: 0.019 Max: 0.077 Uniform
Representative data
Degradation Half Life – Mecoprop (years)
Min: 0.08 Max: 0.5 Uniform
After Howard et. al. (1991) Handbook of Environmental Degradation Rates, and reflect range for aqueous anaerobic biodegradation.
H: AQUIFER PATHWAY WITHIN THE MERCIA MUDSTONE SKERRY BANDS
Parameter Value Derivation
Hydraulic Conductivity (m/s)
Min: 5x10⁻⁶
Mode 5x10⁻⁵ Max: 1x10⁻⁴
Log Triangular
Derived based on packer tests for the skerry bands at Yanley Landfill.
Pathway Length (m) Variable depending on Cell in question
After site plans and assuming compliance point is groundwater beneath the Ashton / Longmoor Brooks.
Pathway Width (m) Variable depending on Cell in question
After site plans and assuming compliance point is groundwater beneath the Ashton / Longmoor Brooks.
Regional Gradient Min: 0.078 Max: 0.116 Uniform
Values based on groundwater monitoring data.
Mixing Zone Thickness (m)
Min: 1
Mode 1.5 Max: 2.0
Triangular
Values based on monitoring data, and borehole logs for site.
Pathway Porosity (fraction) Min: 0.05 Max: 0.15 Uniform
Representative values for a fractured sandstone used
Parameter Value Derivation
Longitudinal Dispersivity Variable depending on Cell in question
LandSim approach (10% of pathway length).
Transverse Dispersivity Variable depending on Cell in question
LandSim approach (3% of pathway length).

Viridor Waste Management Limited 8 SLR Ref.: 402-0036-00304-20 Yanley Landfill: Hydrogeological Risk Assessment July 2009
SLR
I: BIODEGRADATION AND RETARDATION PARAMETERS ASSUMED WITHIN THE AQUIFER PATHWAY
Parameter Value Derivation
Retardation Coefficient
Retardation Coefficient - Ammoniacal-N (Kd) (l/kg)
Min: 0
Mode 0.2 Max: 0.6
Triangular
Based on figure for Sherwood Sandstone (fractured sandstone) from EA Guidance
Retardation Coefficient -Chloride (Kd) (l/kg)
0 Single Value
Retardation Coefficient - Mercury (Kd) (l/kg)
0 Single Value
Retardation Coefficient -Mecoprop (Kd) (l/kg)
0 Single Value
Retardation Coefficient -Toluene (Kd) (l/kg)
0 Single Value
Retardation Coefficient -Xylene (Kd) (l/kg)
0 Single Value
No retardation in aquifer pathway
Half Lives
Degradation Half Life - Ammoniacal-N (years)
Min: 5 Max: 10 Uniform
Based on EA Guidance
K: BACKGROUND GROUNDWATER QUALITY DATA
Parameter Value Derivation
Ammoniacal-N (mg/l)
Min: 0.025 Mode: 0.1 Max: 2.0 Log Triangular
Chloride (mg/l)
Min: 4 Mode: 19 Max: 61 Triangular
After site monitoring data.
All List 1 Substances (mg/l) 0 Fixed value
Assumed zero as worst case scenario

SLR
APPENDIX HRA6

SLR
APPENDIX HRA7
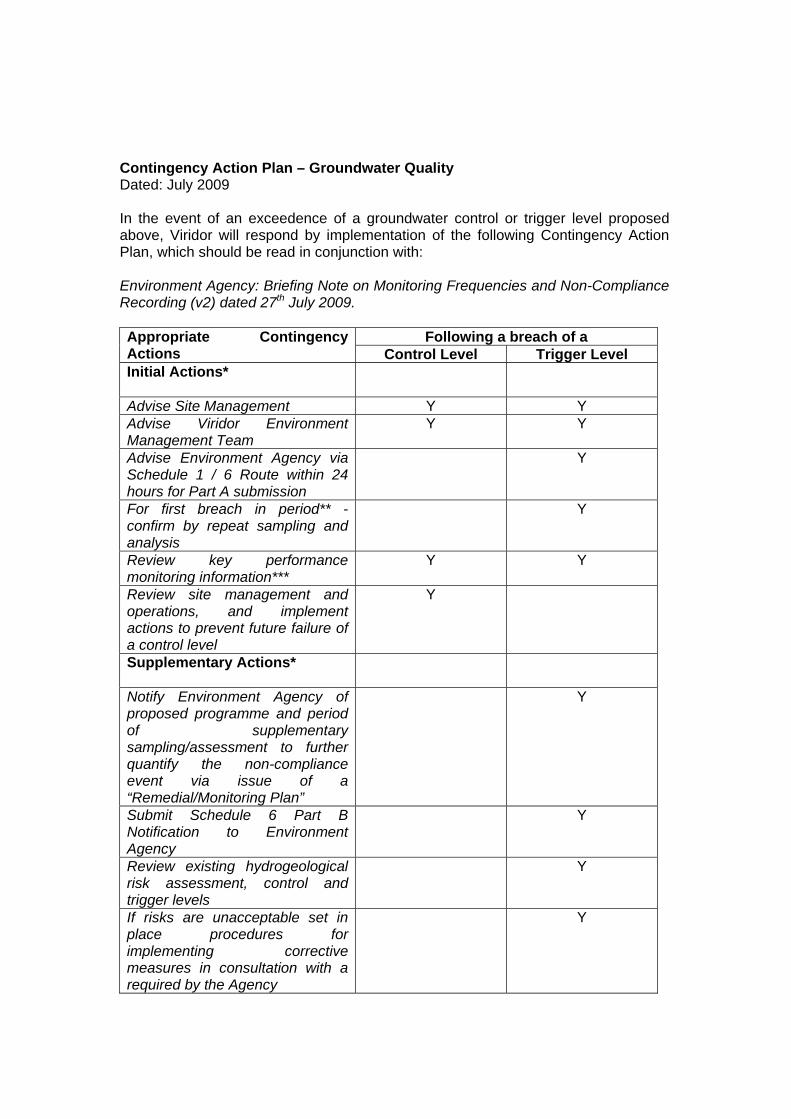
Contingency Action Plan – Groundwater Quality Dated: July 2009 In the event of an exceedence of a groundwater control or trigger level proposed above, Viridor will respond by implementation of the following Contingency Action Plan, which should be read in conjunction with: Environment Agency: Briefing Note on Monitoring Frequencies and Non-Compliance Recording (v2) dated 27th July 2009.
Following a breach of a Appropriate Contingency Actions Control Level Trigger Level Initial Actions*
Advise Site Management Y Y Advise Viridor Environment Management Team
Y Y
Advise Environment Agency via Schedule 1 / 6 Route within 24 hours for Part A submission
Y
For first breach in period** - confirm by repeat sampling and analysis
Y
Review key performance monitoring information***
Y Y
Review site management and operations, and implement actions to prevent future failure of a control level
Y
Supplementary Actions*
Notify Environment Agency of proposed programme and period of supplementary sampling/assessment to further quantify the non-compliance event via issue of a “Remedial/Monitoring Plan”
Y
Submit Schedule 6 Part B Notification to Environment Agency
Y
Review existing hydrogeological risk assessment, control and trigger levels
Y
If risks are unacceptable set in place procedures for implementing corrective measures in consultation with a required by the Agency
Y

Key Definitions within the Contingency Action Plan *: Initial Actions / Supplementary Actions Viridor propose a two stage assessment and action process which is set out within the table and the notes (below). The two stage process – linked into the EPR/PPC Schedule 1 / 6 Notification Process – has been developed to ensure appropriate responses are undertaken in a consistent and timely manner by Viridor. **: Period: In ensuring an appropriate response, potentially resulting in a resampling event, is initiated by Viridor, Viridor have proposed the following assessment period in which contingency sampling events will be triggered. Frequency of Routine Sampling Programme
Assessment “Period” Contingency Sampling Response Time
Weekly One Calendar Month n/a* Monthly One Calendar Quarter Within 14 days Quarterly One Calendar Year Within one month Annual One Calendar Year Within one month
*: At such high frequency sampling, any contingency sampling event will be absorbed into the routine sampling programme. In the event of a second trigger breach in the period (above), Viridor may obtain a contingency sample, subject to the findings of the key performance data review (below) arising from the first breach event in the period. ***: Key Performance Data Viridor will review and report via the Part B Schedule 1 / 6 Notification key performance data that may be related to an emission from the landfill installation including (but not limited to): • The anomalous presence of any other List 1 Substances in groundwater; • Any rising trend in key List 2/non listed Substances (ammoniacal
nitrogen/chloride); • Any unexpected change in groundwater levels; • An unexpected and rapid change in leachate levels within the site (either
positive or negative); • Any anomalous climatic event prior to the incident; and • Any identified VWM or third party activity in the vicinity of the monitoring
installation. Viridor may also request the laboratory to retest the original sample at the laboratory in order to confirm the reported result. Due to retest turn around times, this data (where available) may not be reportable within the target 10 day turnaround time for production and submission of the Part B Schedule 1 / 6 Notification.

In the event that a contingency sample taken in the period identifies that the groundwater quality has returned to be within the normal concentration range, the matter will be considered to be closed. Should, however, contingency sampling identify that the trigger breach persists or VWM identify anomalous performance of the key performance data (above), then Viridor will commence a programme of ‘supplementary’ actions detailed in the Contingency Action Plan (above). Supplementary Note: The proposed Contingency Action Plan presented within this report has been derived in response to the proposed Control and Trigger Levels set out in this report, taking into account the baseline groundwater conditions within the natural environment. In the event that either the final Control or Trigger Levels are subsequently amended prior to their inclusion in the Permit, Viridor reserve the right to revise the Contingency Actions accordingly.

SLR
APPENDIX HRA8