Malware, con’t original slides provided by Prof. Vern Paxson University of California, Berkeley.
date post
21-Dec-2015Category
view
216download
0
E2E Routing Behavior in the Internet
Vern Paxson
Sigcomm 1996
Slides are adopted from Ion Stoica’s lecture at UCB

Internet Routing
• Internet organized as a two level hierarchy• First level – autonomous systems (AS’s)
–AS – region of network under a single administrative domain
• AS’s run an intra-domain routing protocols–Distance Vector, e.g., RIP–Link State, e.g., OSPF
• Between AS’s runs inter-domain routing protocols, e.g., Border Gateway Routing (BGP)–De facto standard today, BGP-4

Example
AS-1
AS-2
AS-3
Interior router
BGP router

Intra-domain Routing Protocols• Based on unreliable datagram delivery• Distance vector
– Routing Information Protocol (RIP), based on Bellman-Ford– Each neighbor periodically exchange reachability information
to its neighbors– Minimal communication overhead, but it takes long to
converge, i.e., in proportion to the maximum path length• Link state
– Open Shortest Path First Protocol (OSPF), based on Dijkstra– Each network periodically floods immediate reachability
information to other routers– Fast convergence, but high communication and computation
overhead
Inter-domain Routing
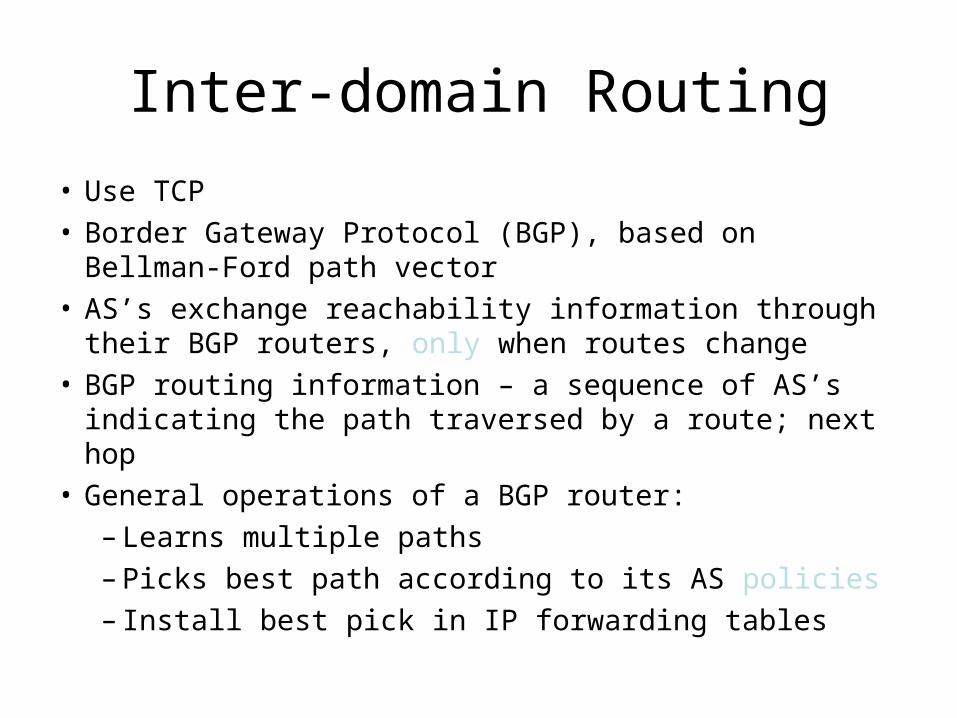
• Use TCP• Border Gateway Protocol (BGP), based on Bellman-Ford
path vector• AS’s exchange reachability information through their
BGP routers, only when routes change• BGP routing information – a sequence of AS’s indicating
the path traversed by a route; next hop• General operations of a BGP router:
– Learns multiple paths– Picks best path according to its AS policies– Install best pick in IP forwarding tables

End-to-End Routing Behavior in the Internet [Paxson ’96]
• Idea: use end-to-end measurements to determine–Route pathologies –Route stability –Route symmetry
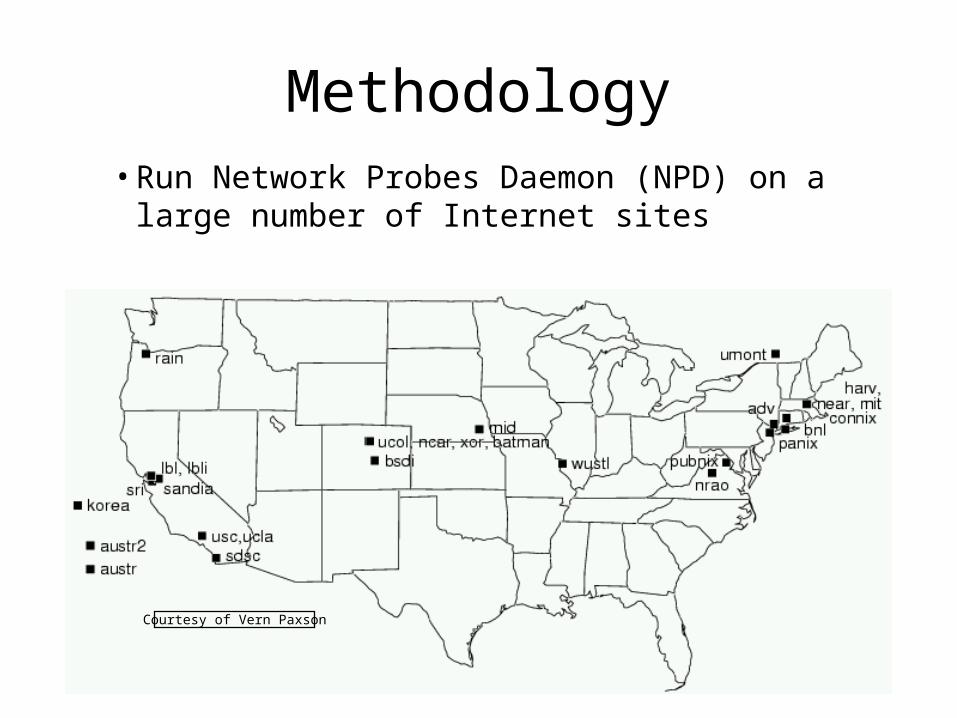
Methodology• Run Network Probes Daemon (NPD) on a
large number of Internet sites
Courtesy of Vern Paxson
Methodology
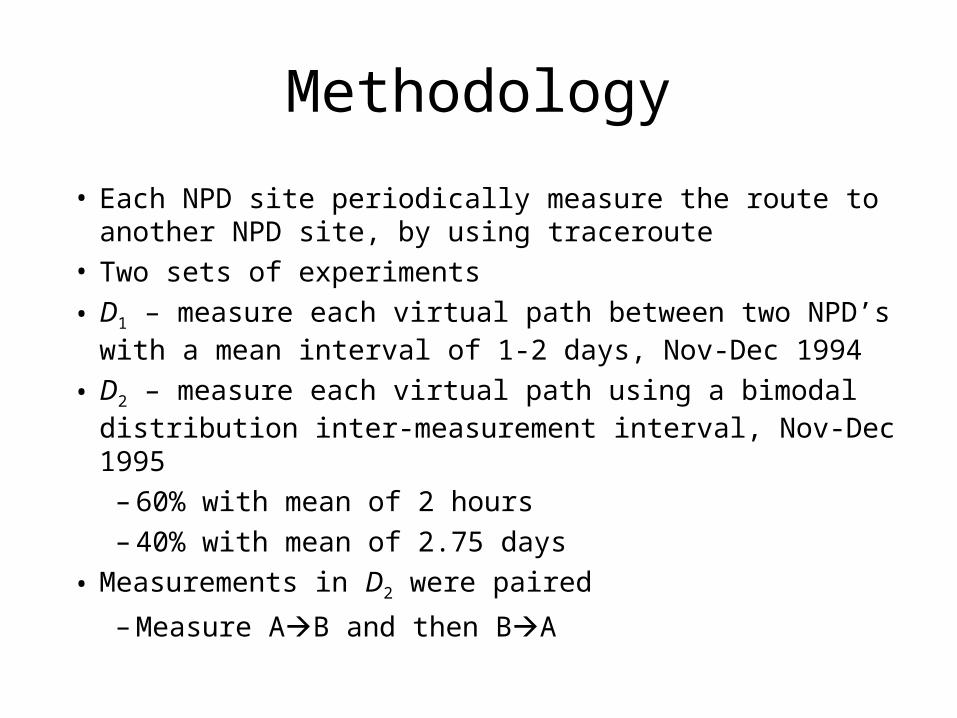
• Each NPD site periodically measure the route to another NPD site, by using traceroute
• Two sets of experiments
• D1 – measure each virtual path between two NPD’s with a mean interval of 1-2 days, Nov-Dec 1994
• D2 – measure each virtual path using a bimodal distribution inter-measurement interval, Nov-Dec 1995
– 60% with mean of 2 hours– 40% with mean of 2.75 days
• Measurements in D2 were paired
– Measure AB and then BA
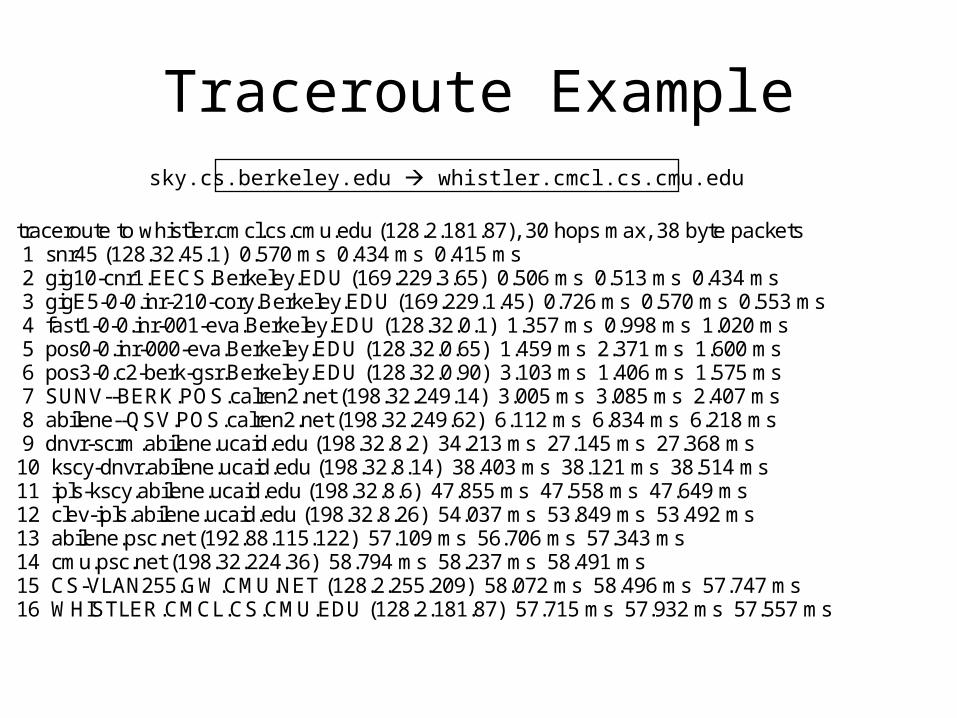
Traceroute Example
traceroute to whistler.cmcl.cs.cmu.edu (128.2.181.87), 30 hops max, 38 byte packets 1 snr45 (128.32.45.1) 0.570 ms 0.434 ms 0.415 ms 2 gig10-cnr1.EECS.Berkeley.EDU (169.229.3.65) 0.506 ms 0.513 ms 0.434 ms 3 gigE5-0-0.inr-210-cory.Berkeley.EDU (169.229.1.45) 0.726 ms 0.570 ms 0.553 ms 4 fast1-0-0.inr-001-eva.Berkeley.EDU (128.32.0.1) 1.357 ms 0.998 ms 1.020 ms 5 pos0-0.inr-000-eva.Berkeley.EDU (128.32.0.65) 1.459 ms 2.371 ms 1.600 ms 6 pos3-0.c2-berk-gsr.Berkeley.EDU (128.32.0.90) 3.103 ms 1.406 ms 1.575 ms 7 SUNV--BERK.POS.calren2.net (198.32.249.14) 3.005 ms 3.085 ms 2.407 ms 8 abilene--QSV.POS.calren2.net (198.32.249.62) 6.112 ms 6.834 ms 6.218 ms 9 dnvr-scrm.abilene.ucaid.edu (198.32.8.2) 34.213 ms 27.145 ms 27.368 ms10 kscy-dnvr.abilene.ucaid.edu (198.32.8.14) 38.403 ms 38.121 ms 38.514 ms11 ipls-kscy.abilene.ucaid.edu (198.32.8.6) 47.855 ms 47.558 ms 47.649 ms12 clev-ipls.abilene.ucaid.edu (198.32.8.26) 54.037 ms 53.849 ms 53.492 ms13 abilene.psc.net (192.88.115.122) 57.109 ms 56.706 ms 57.343 ms14 cmu.psc.net (198.32.224.36) 58.794 ms 58.237 ms 58.491 ms15 CS-VLAN255.GW.CMU.NET (128.2.255.209) 58.072 ms 58.496 ms 57.747 ms16 WHISTLER.CMCL.CS.CMU.EDU (128.2.181.87) 57.715 ms 57.932 ms 57.557 ms
sky.cs.berkeley.edu whistler.cmcl.cs.cmu.edu
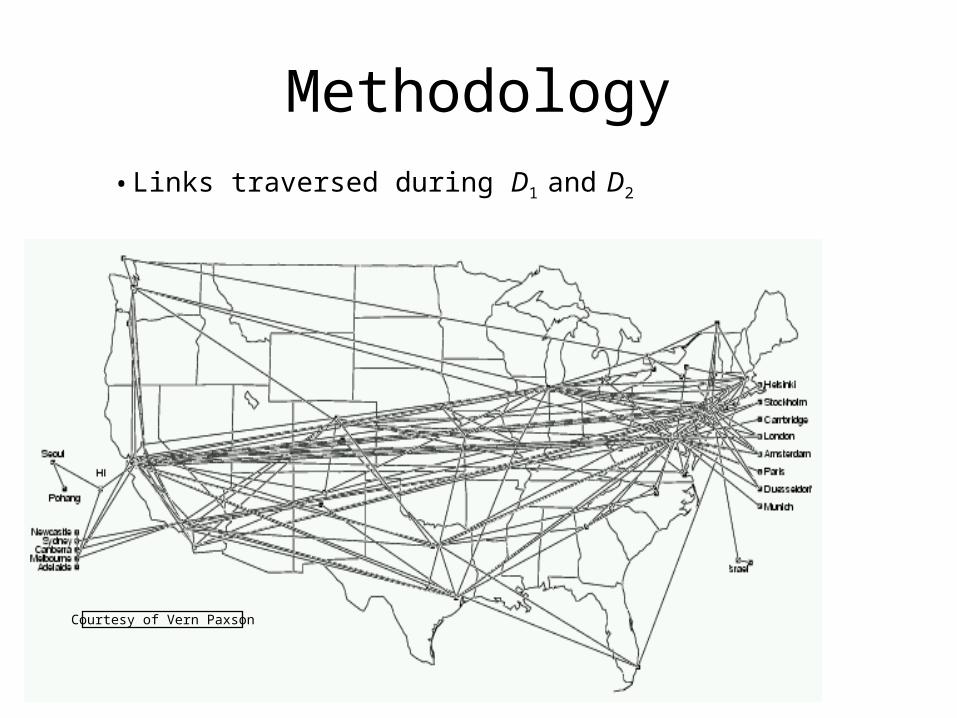
Methodology
• Links traversed during D1 and D2
Courtesy of Vern Paxson

Methodology
• Exponential sampling–Unbiased sampling – measures instantaneous
signal with equal probability–PASTA principle – Poisson Arrivals See Time
Averages
• Is data representative?–Argue that sampled AS’s are on half of the Internet
routes
• Confidence intervals for probability that an event occurs

Limitations
• Just a small subset of Internet paths
• Just two points at a time
• Difficult to say why is something happened, only with end-to-end measurements
• 5%-8% of time couldn’t connect to NPD’s Introduces bias toward underestimation, why?
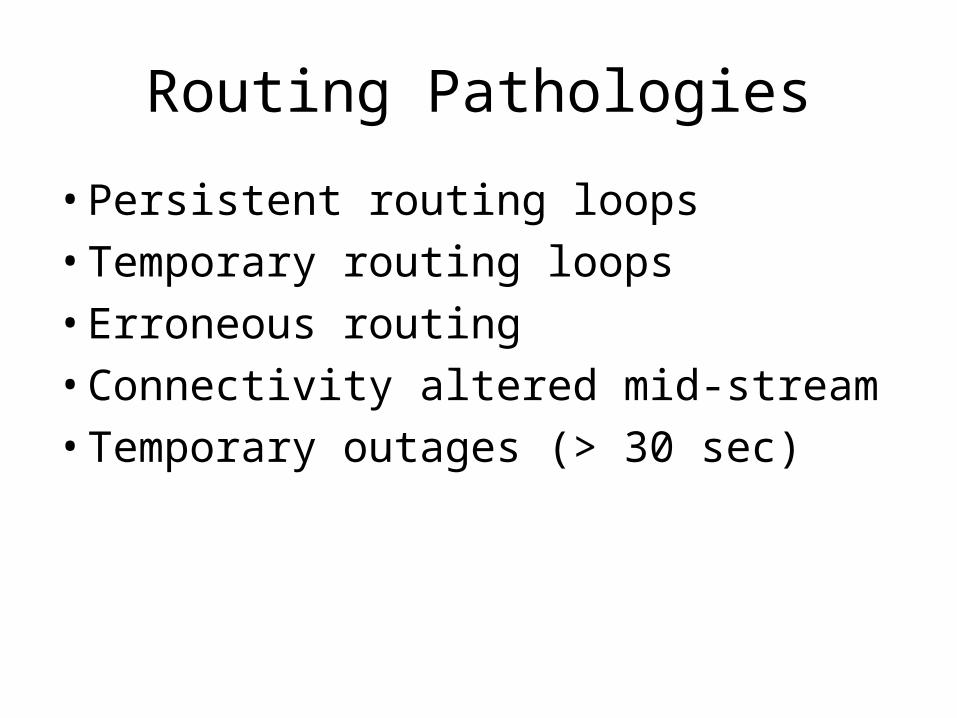
Routing Pathologies
• Persistent routing loops
• Temporary routing loops
• Erroneous routing
• Connectivity altered mid-stream
• Temporary outages (> 30 sec)

Routing Loops & Erroneous Routing
• Persistent routing loops (10 in D1 and 50 in D2)
–Several hours long (e.g., > 10 hours)–Largest: 5 routers–All loops intra-domain
• Transient routing loops (2 in D1 and 24 in D2)
–Several seconds–Usually occur after outages
• Erroneous routing (one in D1)
–A route UKUSA goes through Israel
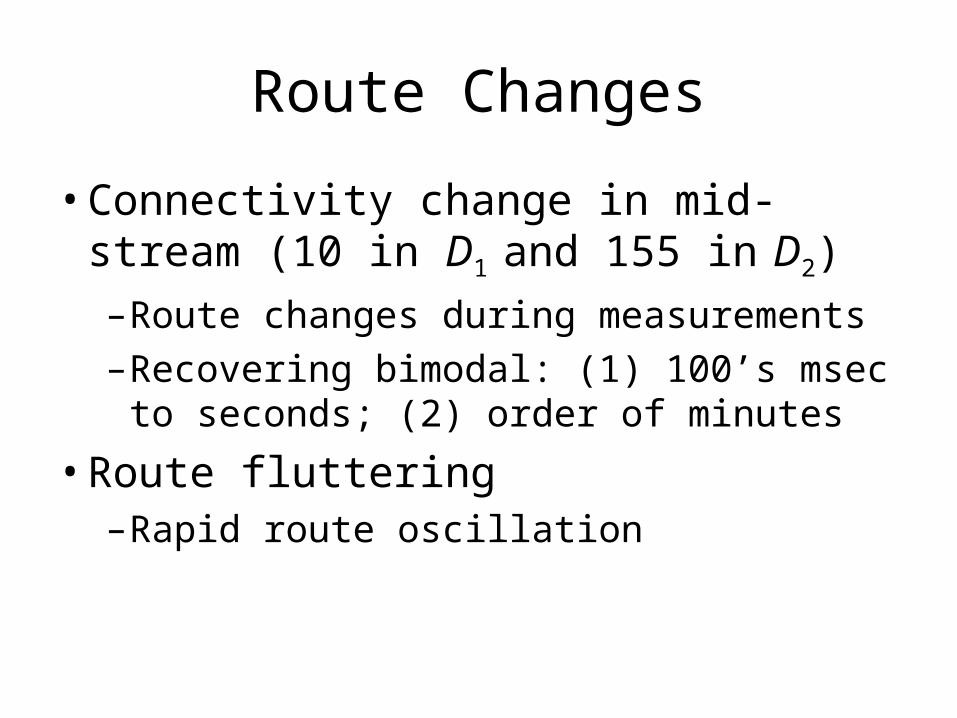
Route Changes
• Connectivity change in mid-stream (10 in D1 and 155 in D2)
–Route changes during measurements–Recovering bimodal: (1) 100’s msec to
seconds; (2) order of minutes
• Route fluttering–Rapid route oscillation

Example of Route Fluttering
Courtesy of Vern Paxson
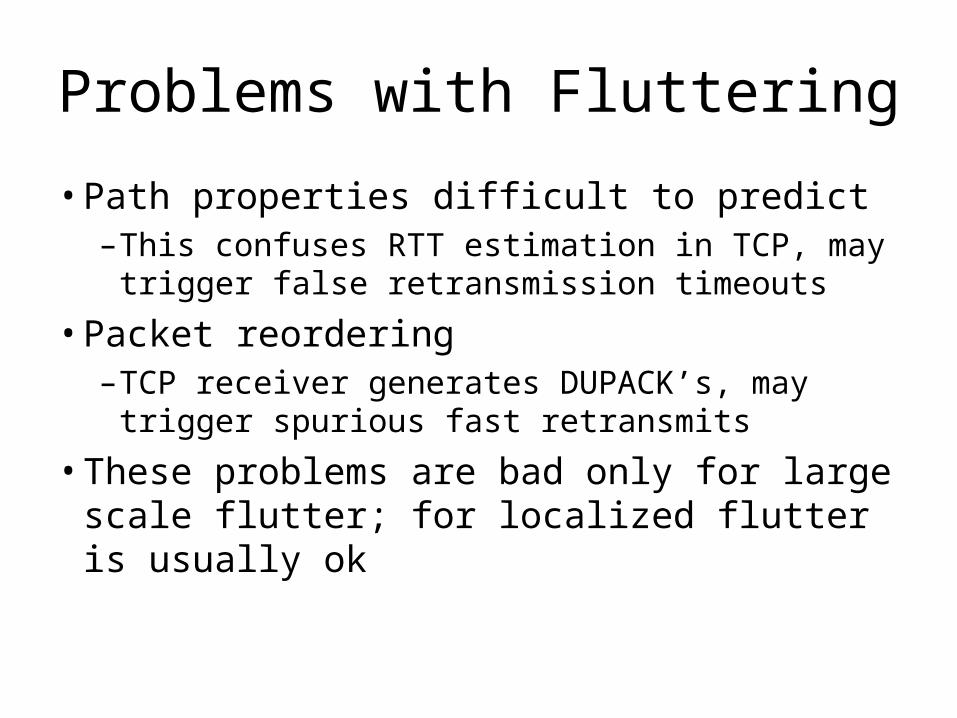
Problems with Fluttering
• Path properties difficult to predict–This confuses RTT estimation in TCP, may
trigger false retransmission timeouts
• Packet reordering–TCP receiver generates DUPACK’s, may
trigger spurious fast retransmits
• These problems are bad only for large scale flutter; for localized flutter is usually ok
Infrastructure Failures
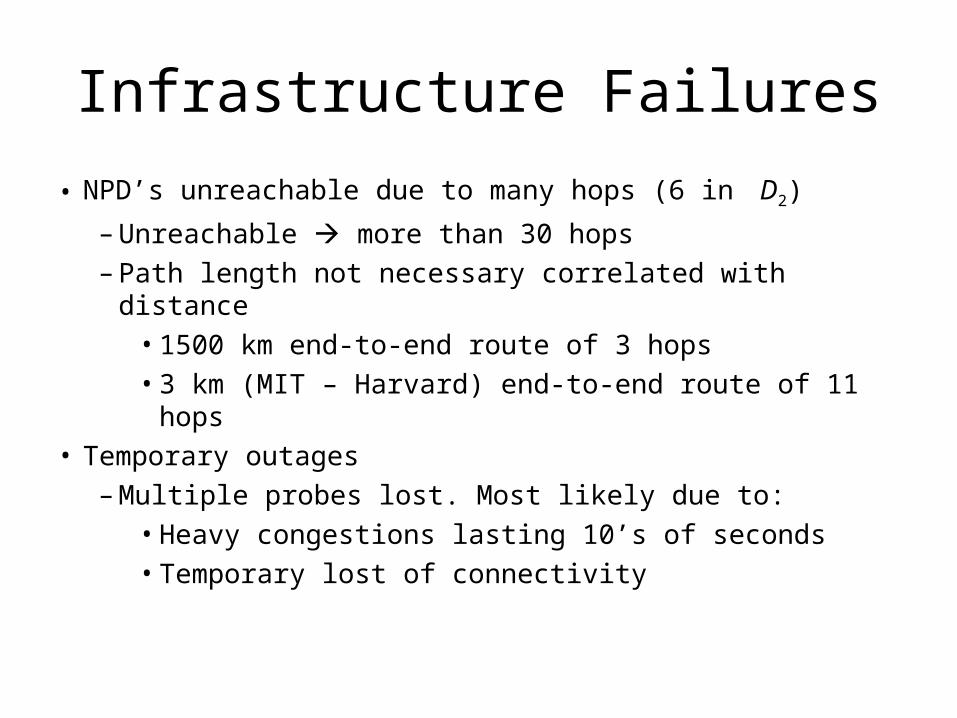
• NPD’s unreachable due to many hops (6 in D2)
– Unreachable more than 30 hops– Path length not necessary correlated with distance
• 1500 km end-to-end route of 3 hops• 3 km (MIT – Harvard) end-to-end route of 11 hops
• Temporary outages– Multiple probes lost. Most likely due to:
• Heavy congestions lasting 10’s of seconds • Temporary lost of connectivity
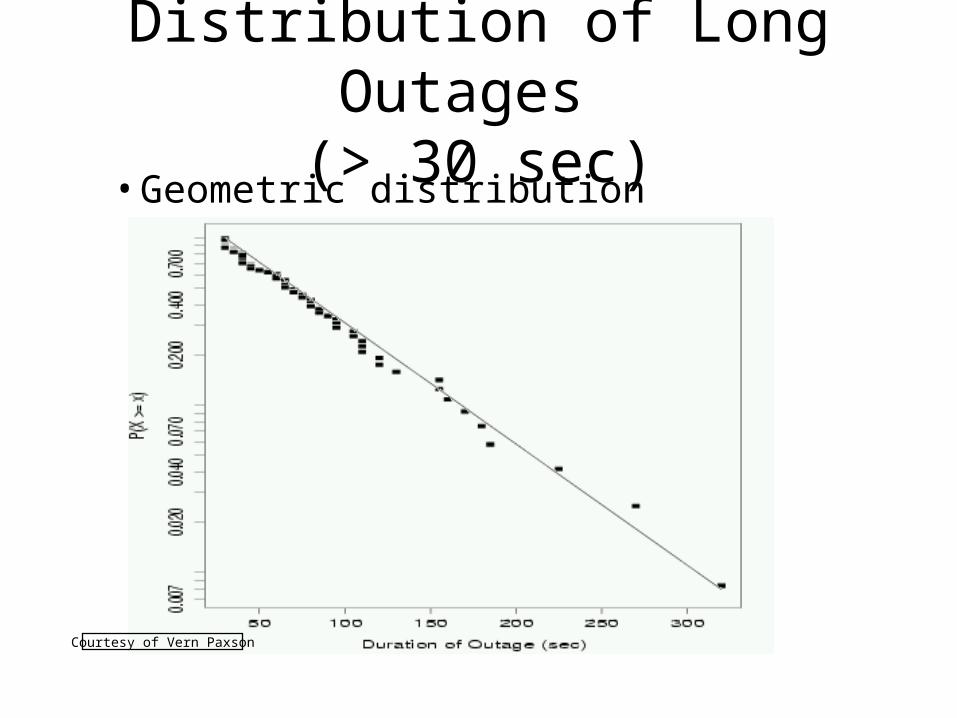
Distribution of Long Outages (> 30 sec)
• Geometric distribution
Courtesy of Vern Paxson

Pathology Summary

Routing Stability
• Prevalence: likelihood to observe a particular route– Steady state probability that a virtual path at an
arbitrary point in time uses a particular route– Conclusion: In general Internet paths are strongly
dominated by a single route• Persistence: how long a route remains unchanged
– Affects utility of storing state in routers– Conclusion: routing changes occur over a wide
range of time scales, i.e., from minutes to days
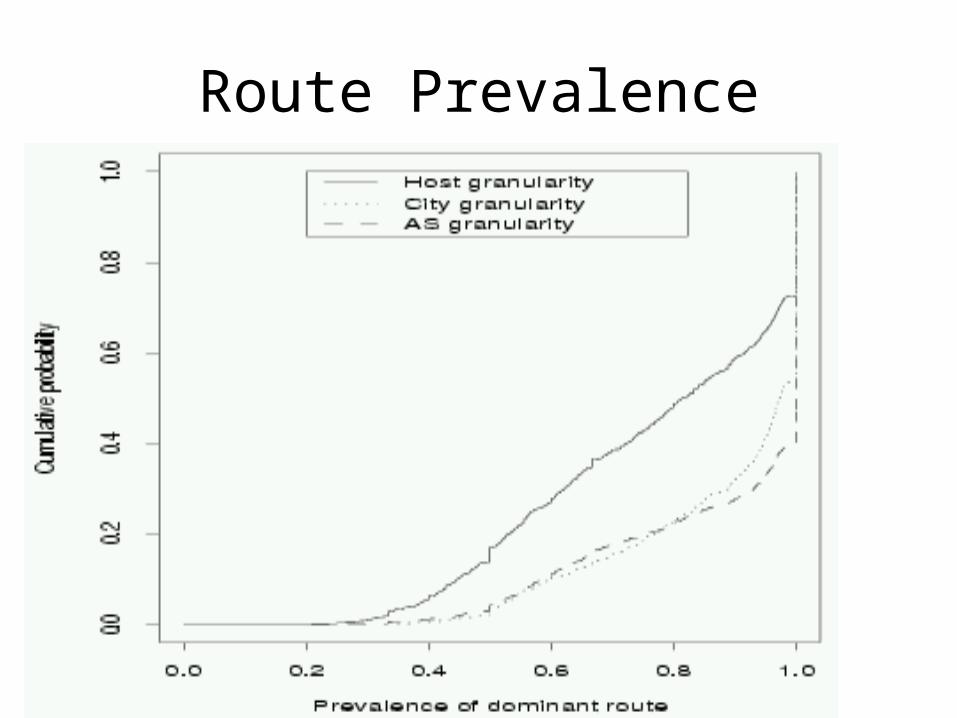
Route Prevalence
• I
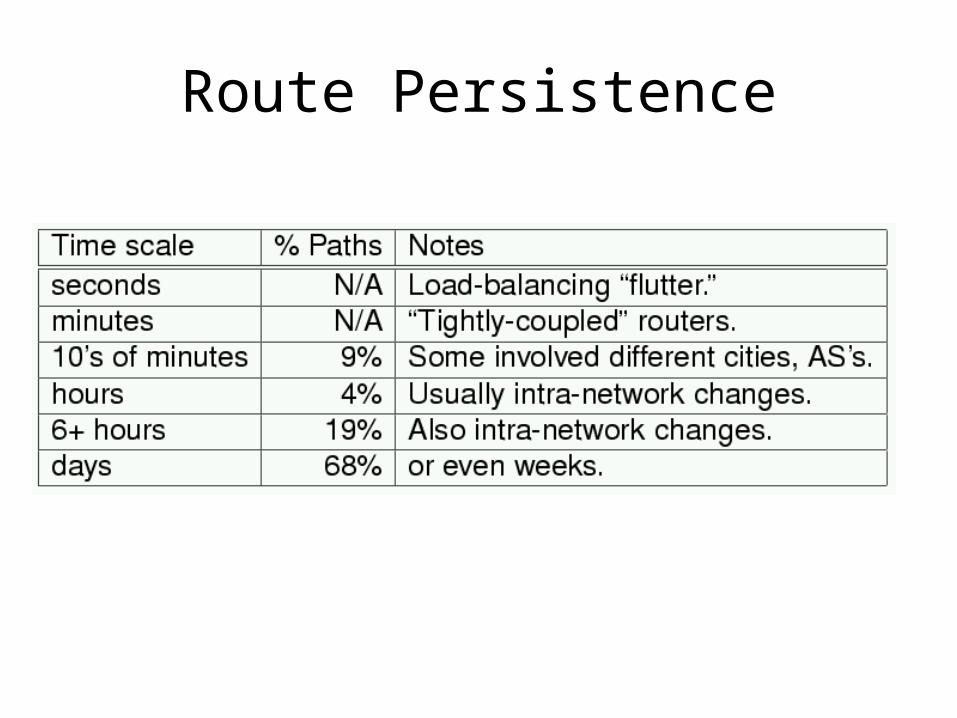
Route Persistence
Route Symmetry
• 30% of the paths in D1 and 50% in D2 visited different cities
• 30% of the paths in D2 visited different AS’s
• Problems:–Break assumption that one-way latency is
RTT/2

Summary of Paxson’s Findings
• Pathologies doubled during 1995
• Asymmetries nearly doubled during 1995
• Paths heavily dominated by a single route
• Over 2/3 of Internet paths are reasonable stable (> days). The other 1/3 varies over many time scales