
E00 program-level modeling and simulation experiences
28
Experiences with Program-level Modeling and Simulation Nitin Patel, Ph.D. Chairman, Co-Founder and CTO Cytel Inc.
-
Upload
therealreverendbayes -
Category
Documents
-
view
25 -
download
3
Transcript of E00 program-level modeling and simulation experiences
Experiences with Program-level Modeling and Simulation
Nitin Patel, Ph.D. Chairman, Co-Founder and CTO Cytel Inc.
Disclaimer
• The views and opinions expressed in the following PowerPoint slides are those of the individual presenter and should not be attributed to Drug Information Association, Inc. (“DIA”), its directors, officers, employees, volunteers, members, chapters, councils, Communities (formerly known as SIACs) or affiliates, or any organization with which the presenter is employed or affiliated.
• These PowerPoint slides are the intellectual property of the individual presenter and are protected under the copyright laws of the United States of America and other countries. Used by permission. All rights reserved. Drug Information Association, Drug Information Association Inc., DIA and DIA logo are registered trademarks. All other trademarks are the property of their respective owners.
2
Acknowledgements • Jaydeep Bhattacharya, Cytel inc. • Armaan Pai, U. Penn. for their excellent support in developing and
running simulations • My colleagues in the DIA Scientific Working
Group on Adaptive Programs chaired by Carl-Fredrik Burman, especially Jim Bolognese and Christy Chuang-Stein
3
Outline
• Case study of neuropathic pain Phase 2 study design using simulation of Ph2-Ph3-RevenueModel
• Advantages and challenges of program level design modeling and simulation (M&S)
4
Program level M&S experiences • Vehicle for constructive dialog between various
stakeholders in drug development process (NEWDIGS project at MIT)
• Optimizing drug development process for pharma cos. – Early stage studies:
• Ph1 PoC based on biomarkers to dose selection for Ph 3 (with Merck & co)
• Asset development for multi-indication oncology drug – Late stage studies: Ph2 to Ph3 to launch (DIA ADSWG, Adaptive
Programs team – Carl-Fredrik Burman (chair). Subteams on applications:
• Neuropathic pain (led by Nitin Patel) • Diabetes (led by Zoran Antonijevic) • Oncology (led by Olga Marchenko) • Papers published in 2012- 2013
5
Neuropathic Pain • Investigate impact of various factors on a
Ph2+Ph3 development program for Neuropathic Pain – Different methods for selecting dose for Ph3 – Ph2 sample size
• Hybrid Bayesian/Frequentist approach
– Statistical analysis of trial data from regulatory perspective is frequentist,
– Go/NoGo decision making and dose selection for Ph3 trials by sponsor analysis is Bayesian with non-informative prior
– Posterior distribution of true mean response at each dose and isotonic estimate of pr(AE) from Ph2 data used to choose dose(s) for Ph3
6
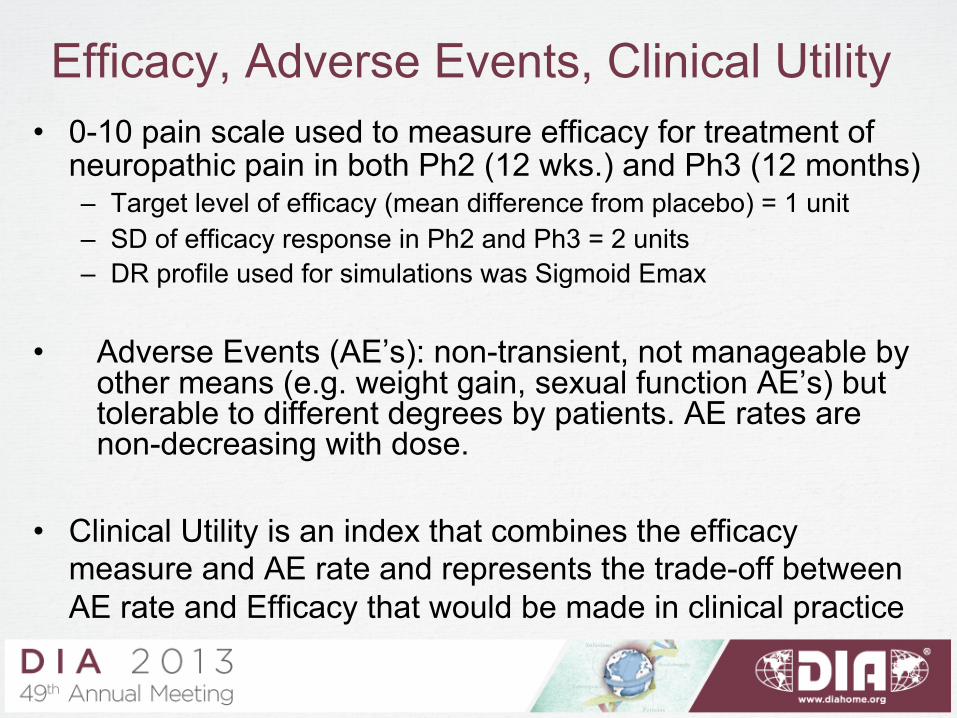
Efficacy, Adverse Events, Clinical Utility • 0-10 pain scale used to measure efficacy for treatment of
neuropathic pain in both Ph2 (12 wks.) and Ph3 (12 months) – Target level of efficacy (mean difference from placebo) = 1 unit – SD of efficacy response in Ph2 and Ph3 = 2 units – DR profile used for simulations was Sigmoid Emax
• Adverse Events (AE’s): non-transient, not manageable by other means (e.g. weight gain, sexual function AE’s) but tolerable to different degrees by patients. AE rates are non-decreasing with dose.
• Clinical Utility is an index that combines the efficacy measure and AE rate and represents the trade-off between AE rate and Efficacy that would be made in clinical practice
7
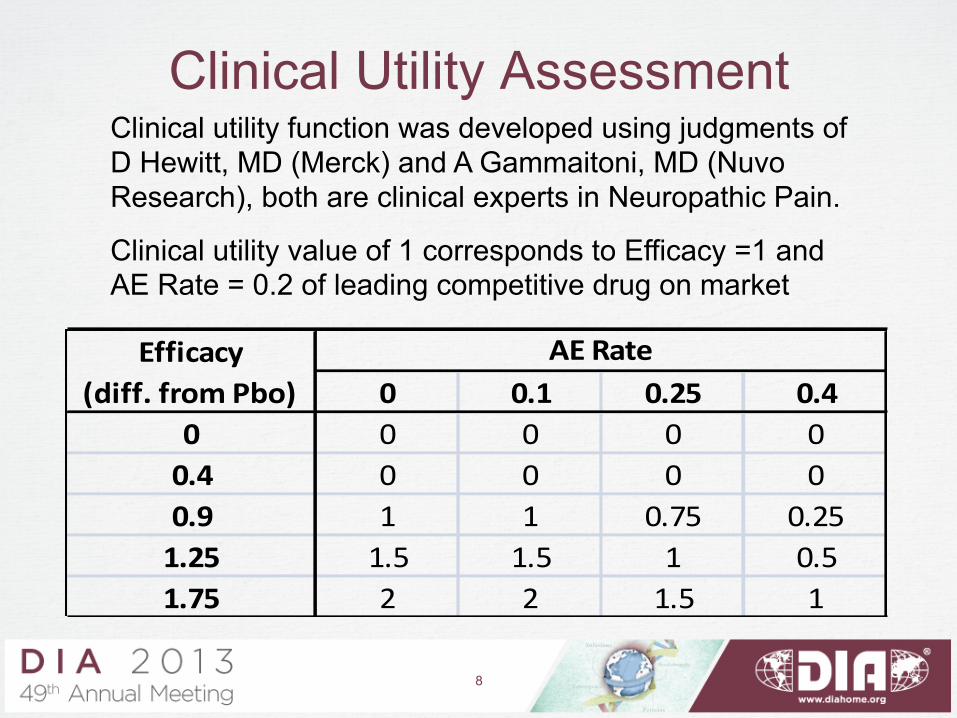
Clinical Utility Assessment Clinical utility function was developed using judgments of D Hewitt, MD (Merck) and A Gammaitoni, MD (Nuvo Research), both are clinical experts in Neuropathic Pain.
Clinical utility value of 1 corresponds to Efficacy =1 and AE Rate = 0.2 of leading competitive drug on market
8
0 0.1 0.25 0.40 0 0 0 00.4 0 0 0 00.9 1 1 0.75 0.251.25 1.5 1.5 1 0.51.75 2 2 1.5 1
AE RateEfficacy (diff. from Pbo)
8
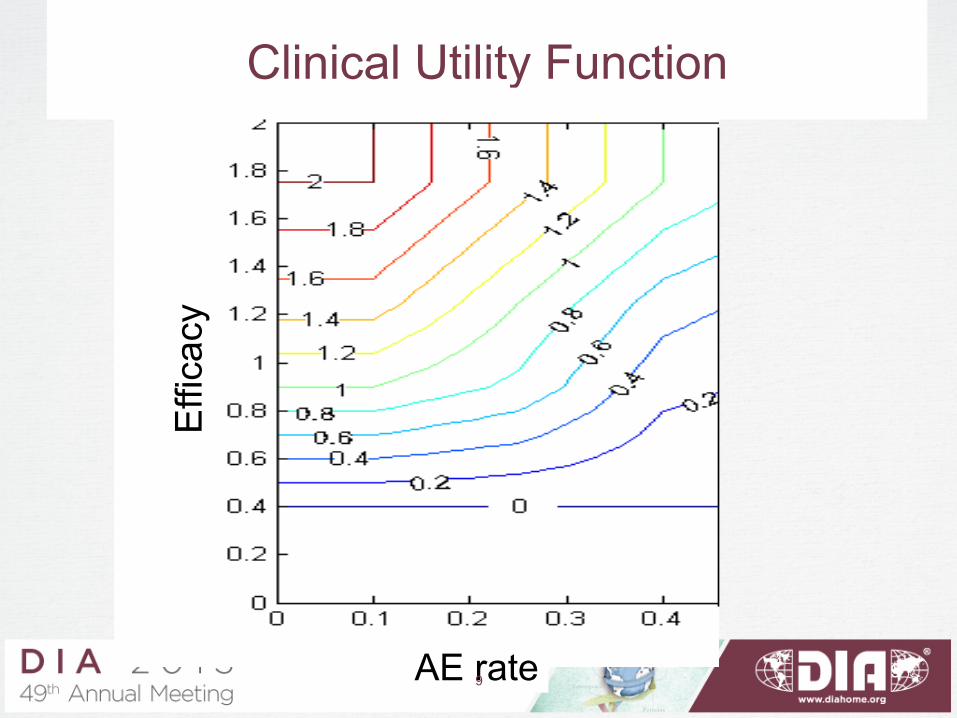
Clinical Utility Function
Effi
cacy
AE rate 9 9
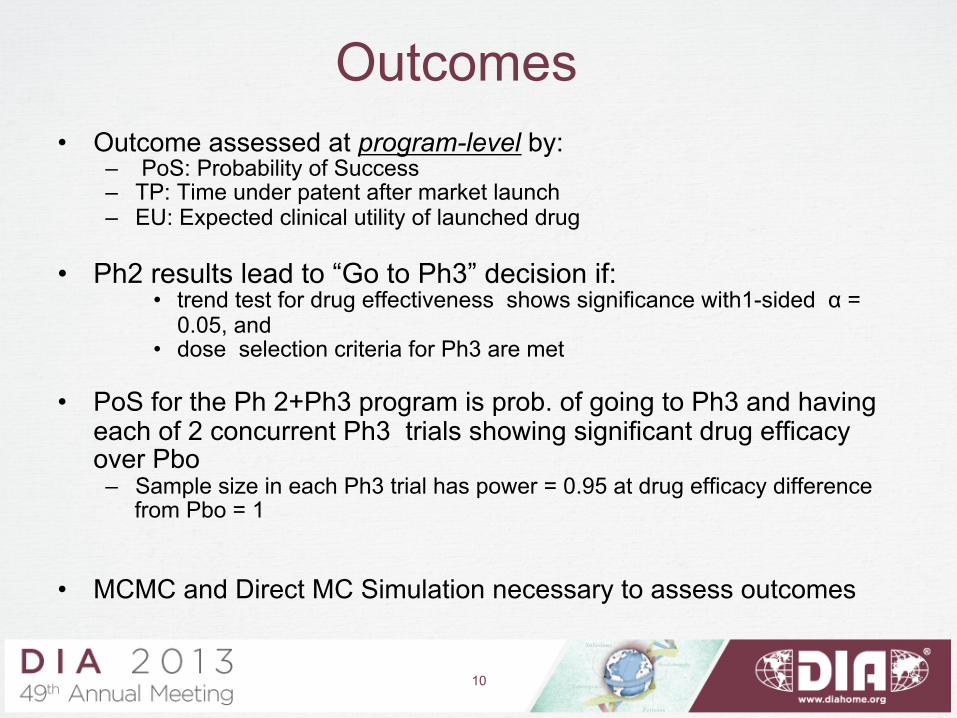
• Outcome assessed at program-level by: – PoS: Probability of Success – TP: Time under patent after market launch – EU: Expected clinical utility of launched drug
• Ph2 results lead to “Go to Ph3” decision if:
• trend test for drug effectiveness shows significance with1-sided α = 0.05, and
• dose selection criteria for Ph3 are met
• PoS for the Ph 2+Ph3 program is prob. of going to Ph3 and having each of 2 concurrent Ph3 trials showing significant drug efficacy over Pbo – Sample size in each Ph3 trial has power = 0.95 at drug efficacy difference
from Pbo = 1
• MCMC and Direct MC Simulation necessary to assess outcomes
Outcomes
10
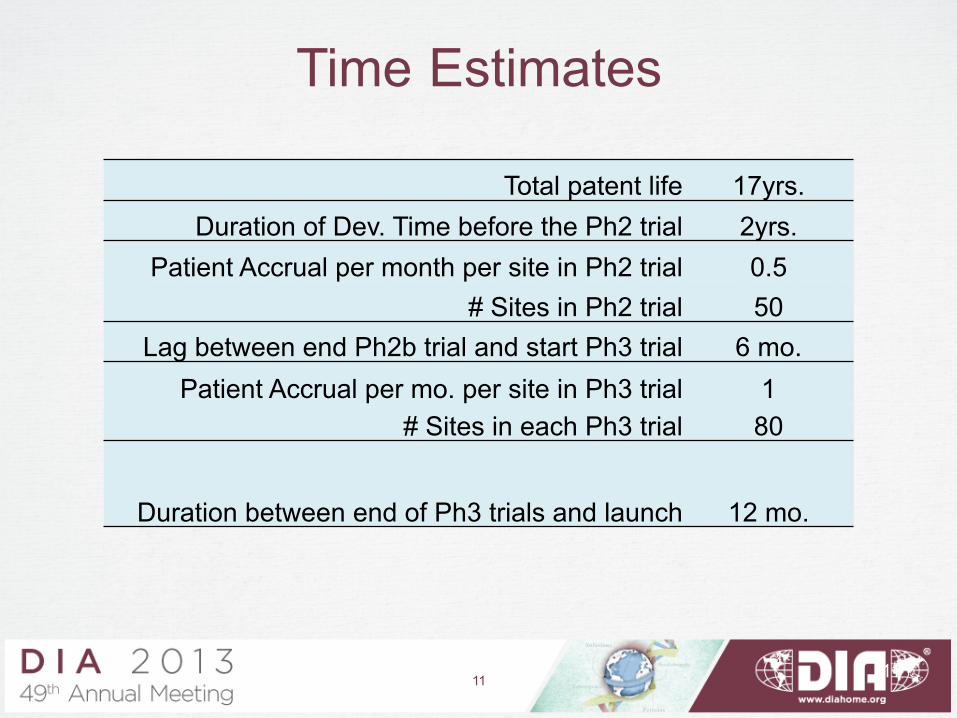
Time Estimates
Total patent life 17yrs. Duration of Dev. Time before the Ph2 trial 2yrs.
Patient Accrual per month per site in Ph2 trial 0.5 # Sites in Ph2 trial 50
Lag between end Ph2b trial and start Ph3 trial 6 mo. Patient Accrual per mo. per site in Ph3 trial 1
# Sites in each Ph3 trial 80
Duration between end of Ph3 trials and launch 12 mo.
11 11
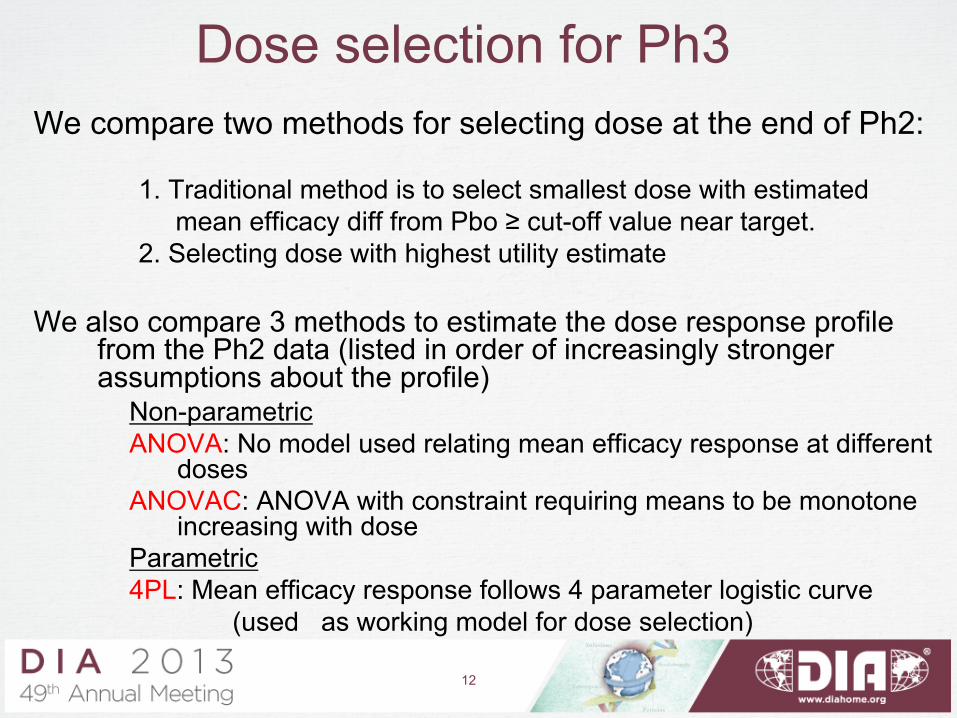
Dose selection for Ph3 We compare two methods for selecting dose at the end of Ph2:
1. Traditional method is to select smallest dose with estimated mean efficacy diff from Pbo ≥ cut-off value near target. 2. Selecting dose with highest utility estimate
We also compare 3 methods to estimate the dose response profile
from the Ph2 data (listed in order of increasingly stronger assumptions about the profile)
Non-parametric ANOVA: No model used relating mean efficacy response at different
doses ANOVAC: ANOVA with constraint requiring means to be monotone
increasing with dose Parametric 4PL: Mean efficacy response follows 4 parameter logistic curve
(used as working model for dose selection)
12
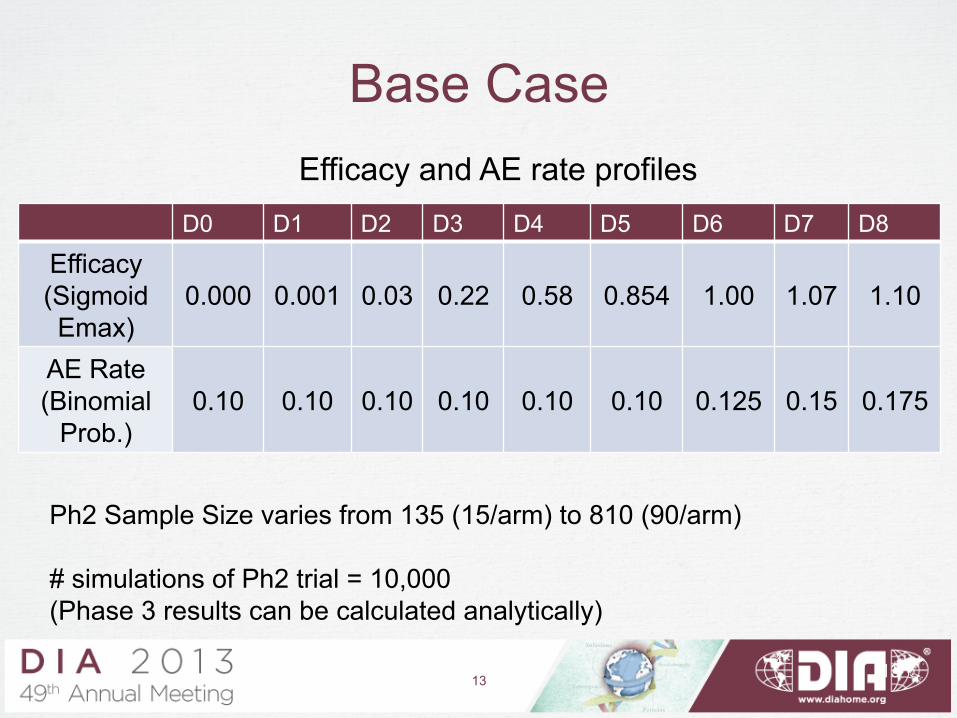
Base Case
D0 D1 D2 D3 D4 D5 D6 D7 D8
Efficacy (Sigmoid Emax)
0.000
0.001
0.03
0.22
0.58
0.854
1.00
1.07
1.10
AE Rate (Binomial
Prob.)
0.10
0.10
0.10
0.10
0.10
0.10
0.125
0.15
0.175
Ph2 Sample Size varies from 135 (15/arm) to 810 (90/arm) # simulations of Ph2 trial = 10,000 (Phase 3 results can be calculated analytically)
Efficacy and AE rate profiles
13 13

PoS: Traditional vs. Utility Max. dose selection
Utility maximization is much better – PoS is almost double for any sample size and across all 3 assumptions for the efficacy profile
Note: The cut-off value for traditional method = 0.8 was chosen to maximize PoS
14
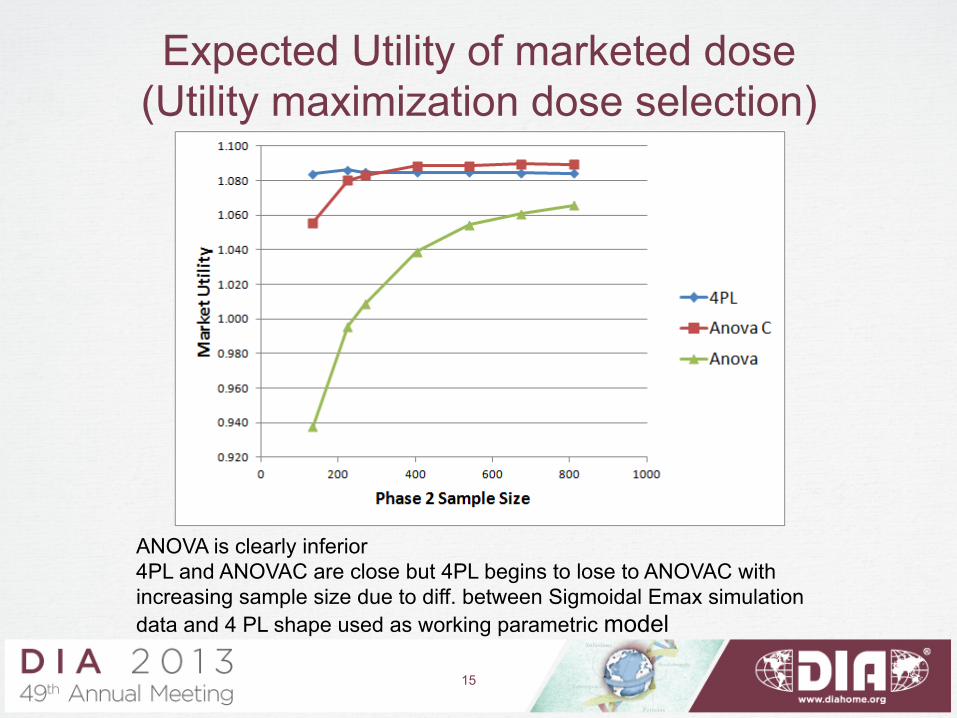
Expected Utility of marketed dose (Utility maximization dose selection)
ANOVA is clearly inferior 4PL and ANOVAC are close but 4PL begins to lose to ANOVAC with increasing sample size due to diff. between Sigmoidal Emax simulation data and 4 PL shape used as working parametric model
15
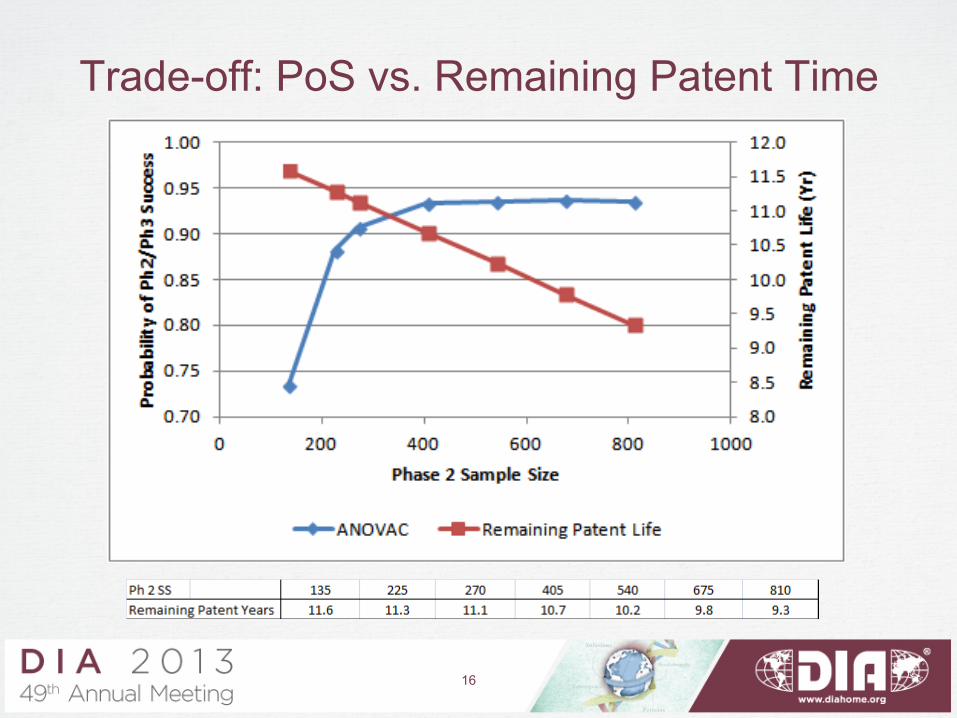
Trade-off: PoS vs. Remaining Patent Time
16
• Commonly used criterion that strikes balance increasing Ph2 SS and reducing time on market under patent:
– expected Net Present Value (NPV)
– NPV is cash flow (Revenue – Cost) that is discounted over time by the discount rate used by a firm to evaluate investments.
• Also need to consider – Probability of Success (PoS) of program – Expected Utility of marketed dose
Outcome Assessment
17
18
REVENUE
0.00.1
0.20.3
0.40.50.60.70.8
0.91.0
1.11.2
1.3
YEAR
0 10 20
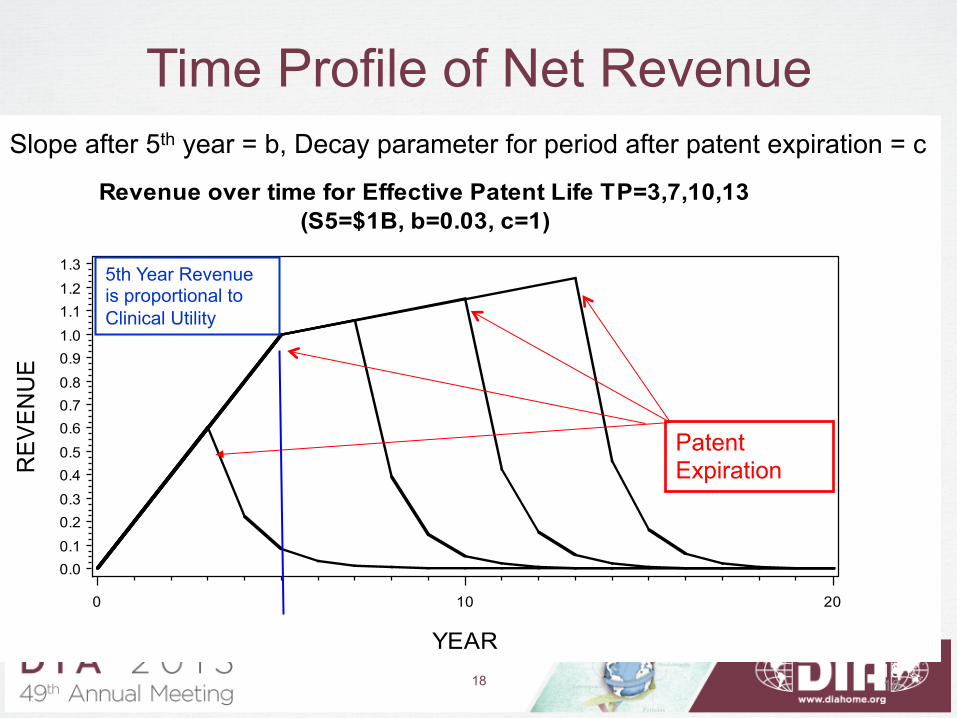
Revenue over time for Effective Patent Life TP=3,7,10,13(S5=$1B, b=0.03, c=1)
Time Profile of Net Revenue
Patent Expiration
Slope after 5th year = b, Decay parameter for period after patent expiration = c
5th Year Revenue is proportional to Clinical Utility
18
5
18
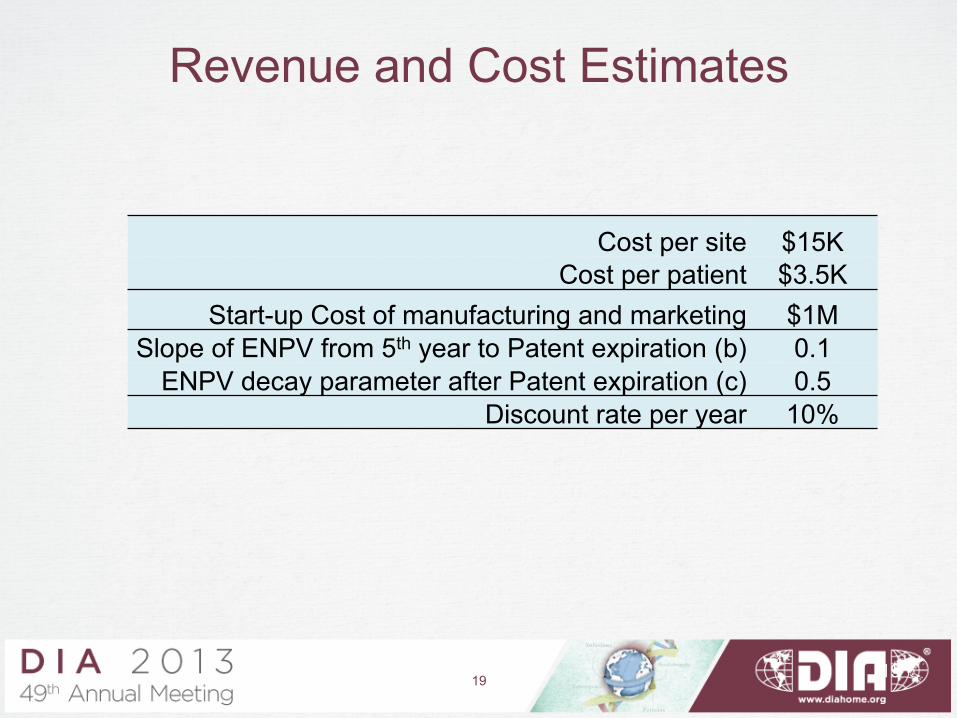
Revenue and Cost Estimates
Cost per site $15K Cost per patient $3.5K
Start-up Cost of manufacturing and marketing $1M Slope of ENPV from 5th year to Patent expiration (b) 0.1
ENPV decay parameter after Patent expiration (c) 0.5 Discount rate per year 10%
19 19
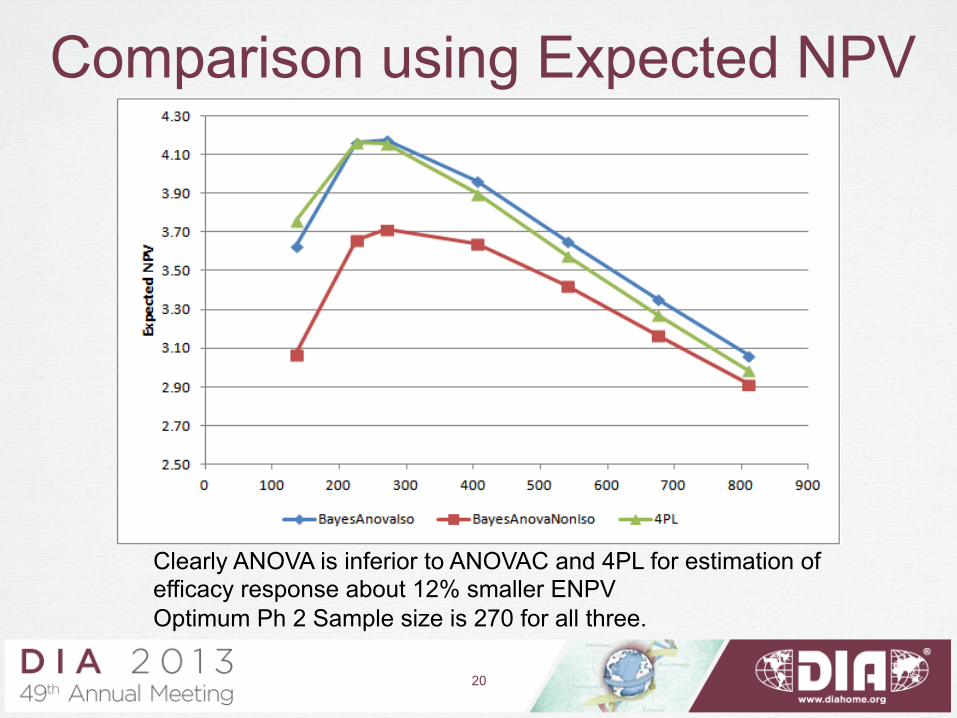
Comparison using Expected NPV
Clearly ANOVA is inferior to ANOVAC and 4PL for estimation of efficacy response about 12% smaller ENPV Optimum Ph 2 Sample size is 270 for all three.
20
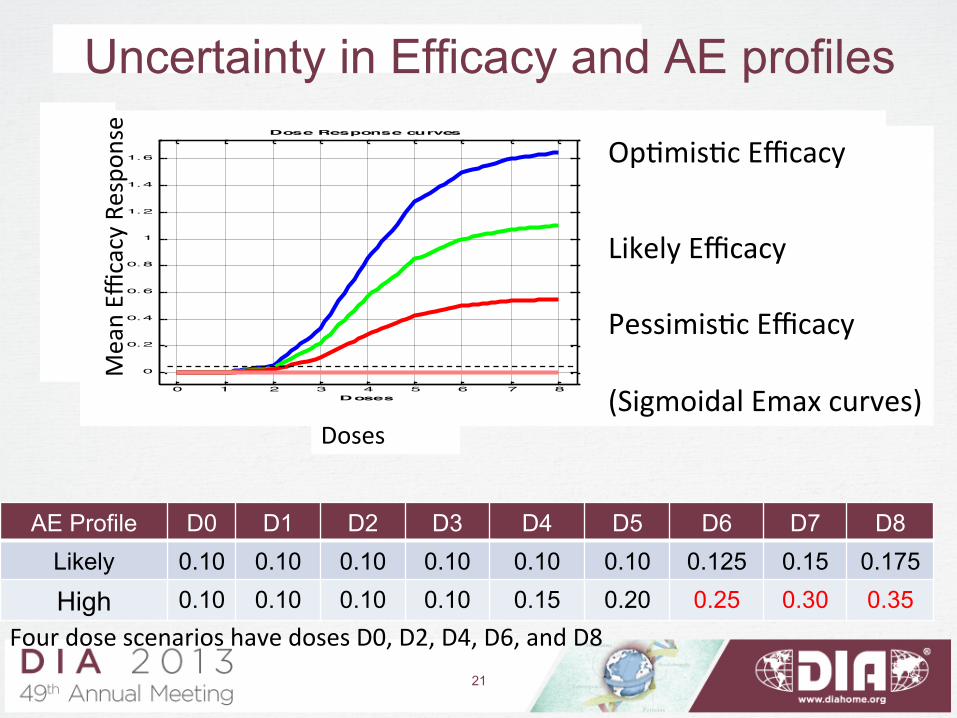
Uncertainty in Efficacy and AE profiles
AE Profile D0 D1 D2 D3 D4 D5 D6 D7 D8 Likely 0.10 0.10 0.10 0.10 0.10 0.10 0.125 0.15 0.175
High 0.10 0.10 0.10 0.10 0.15 0.20 0.25 0.30 0.35
0 1 2 3 4 5 6 7 8
0
0.2
0.4
0.6
0.8
1
1.2
1.4
1.6
Doses
Mean Re
sponse
Dose Response curves
1.5 x EfficacyEfficacyHalf Ef ficacyFlat
Doses
Mean Effi
cacy Respo
nse Op0mis0c Efficacy
Likely Efficacy Pessimis0c Efficacy (Sigmoidal Emax curves)
Four dose scenarios have doses D0, D2, D4, D6, and D8 21
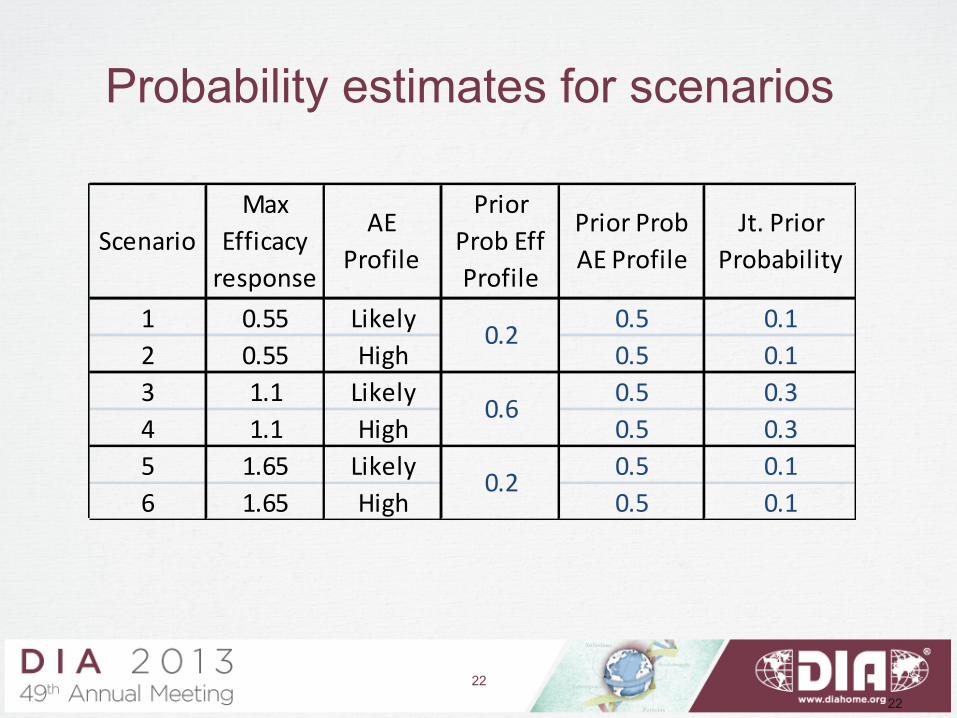
Probability estimates for scenarios
22
1 0.55 Likely 0.5 0.12 0.55 High 0.5 0.13 1.1 Likely 0.5 0.34 1.1 High 0.5 0.35 1.65 Likely 0.5 0.16 1.65 High 0.5 0.1
Prior Prob AE Profile
Jt. Prior Probability
Scenario
0.2
0.6
0.2
AE Profile
Prior Prob Eff Profile
Max Efficacy response
22
• Expected PoS across the Efficacy and AE
profiles
• Expected clinical utility of marketed dose
• Time in market from launch to patent expiry
(Dose selection method is utility maximization)
Criteria for Ph2 SS selection
23
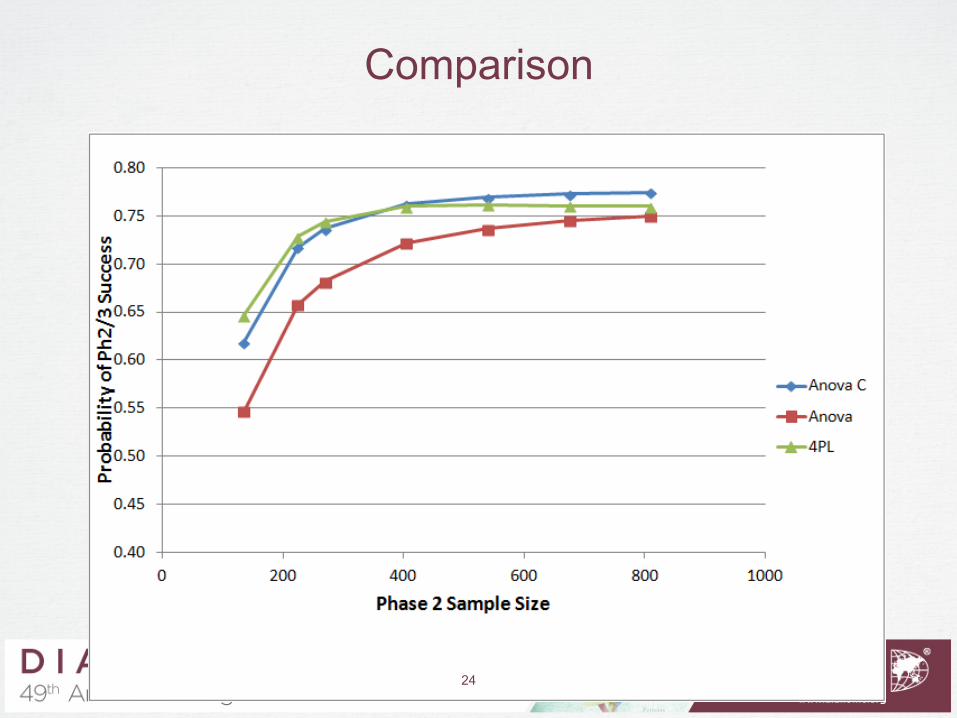
Comparison
24
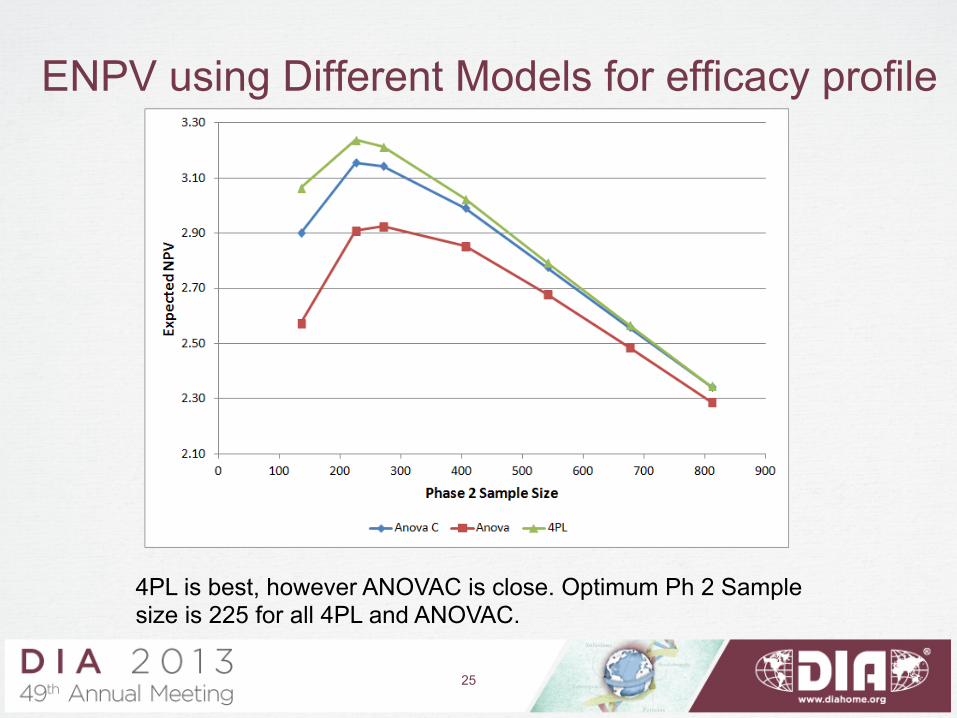
ENPV using Different Models for efficacy profile
4PL is best, however ANOVAC is close. Optimum Ph 2 Sample size is 225 for all 4PL and ANOVAC.
25
Conclusions
• We found that Program-level simulation for Ph 2 designs can substantially improve the program. Major advantages – Aligns design quantitatively to commercial
objectives like ENPV – Enables evaluation and optimization of several
important design choices: e.g. sample size, dose selection methods, number of doses, dose response model selection
26
Challenges
• The most significant challenges were: – Time needed to develop and run simulation
models – Need for cross- functional inputs (e.g. clinical
utility functions for safety-efficacy trade-offs, commercial model)
27