E VICTIMIZATION - Office of Justice Programs
81
E VICTIMIZATION IN 26 AMERICAN CITIES If you have issues viewing or accessing this file contact us at NCJRS.gov.
Transcript of E VICTIMIZATION - Office of Justice Programs

E VICTIMIZATION
IN 26 AMERICAN CITIES
If you have issues viewing or accessing this file contact us at NCJRS.gov.

National Criminal Justice Information and Statistics Service Reports
Single copies are available at no charge from Ihe National Criminal Justice Referenco Servlco, Box 6000, Rockville, Md. 20850. Multiple copies are for sale by the Superintendent of Documents, U.S. Government Prlntlnfj Ollice, Washington, D.C. 20402.
Appllcallons of the National Crime Survey Victimization !<nd Attitude Dota:
Public Opinion About Crime: The Attitudes of Victims and Nonviclims in Selected Cities. NCJ-41336
Local Victim Surveys: A Review of the Issues. NCJ-39973 Tho Police and Public Opinion: An Analysis of Victimization and
Attitude Data from 13 American Cities. NCJ-42018 An Inlroductlon to tha National Crime Survey. NCJ-43732 Compensating VIctims 01 Violent Crime:
Potential Costs and Coverage of a NatIOnal Program. NCJ-43387 Crime Against Persons In Urban, Suburban, and Rural Areas: A
Comparative Analysis of Victimization Rates. NCJ-53551 Rape Vlctimlzallon In 26 American CIties, NCJ-55878
Victimization Surveys: Criminal VictimIzation In the United Stilies (annual):
A Comparison of 1975 and 1976 Findings. NCJ-44132 A Comparison of 1974 and 1975 Findings. NCJ-3~548 A Comparison of 1973 and 1974 Findings. NCJ-34391 1975 (final report). NCJ-44593 1974. NCJ·39467 1973. NCJ-34732
Criminal Victimization Surveys In Boslon. NCJ·34818 New Orleans. NCJ-34825 Buffalo. NCJ·34820 Oakland. NCJ-34826 Cincinnati. NC,)-34819 PIttsburgh. NCJ-34827 Houston, NCJ-34821 San Diego. NCJ-34828 Miami. NCJ-34822 San Francisco. NCJ-34629 Milwaukee. NCJ-34823 Washlnglon. D.C. NCJ-34830 Minneapolis, NCJ-34824 (final report, 13 vOIS)
Criminal Victimization Surveys in 13 American Cities (summary report. 1 vol ), NCJ-18471
Public Attitudes About Crime: Boston. NCJ-46?3f, New Orleans, NCJ-46242 Bullalo. NCJ·46236 Oakland, NCJ-46243 Cincinnati. NCJ-46237 Pittsburgh, NCJ-46244 Houston. NCJ·46238 San Diego, NCJ-46245 Miami. NCJ-46239 San Francisco, NCJ-46246 Milwaukee. NCJ·46240 Washington, D.C. NCJ-4624? Minneapolis. NCJ-46241 (fmal report. 13 vols)
Criminal VIctimization Surveys in Chicago, Delroit, Los Angeles. New York. and Philadelphia: A Comparison of 1972 and 1974 Findings. NCJ-36360
Criminal Victimization Surveys in the Nation's Five Largest Cities: National Cnme Panel Surveys In Chicago. DetrOit. Los Angeles. New Vorll, and PhiladelphIa. 1972. NCJ-16909
Criminal Victimization Surveys In Eight American Cities: A Companson of 1971/72 and 1974/75 FlIldlllgs -Nallonal Cnme Surveys III Atlanta. Balhmore, Cleveland. Dallas, Denver. Newark. Portland, and SI Louts. NCJ·36361
Crimes and Victims: A Report on the D.3yton-San Jose Pilot Survey of Vtcttnlllalion. NCJ-013314
National Prisoner Statistics: Capital Punishment (annual)
1978 advance report. NCJ-1977 (Imill repurt), NCJ·496!il
Prisoners In Sla!e and Federal Institutions (annual) Dncembor 31. 1978. advance report. NCJDecember 31. 1977 (final report). NCJ-52701
Census of State Correctional FaCilities, 1974: . Advance Hoport. NCJ-25642
Survey of In males of State Correctional Facilities, 1974: Advance Report. NCJ-34267
Census of Prisoners in Siale Correctional Facilities, 1973. NCJ-34729
Census of Jails and Survey of Jail Inmates 1978: Preltmillary Repurt. NGJ-551,"'2
The Nation's Jails: A report on the census of lails from the 1972 Survey of Inmates of Local JailS, NCJ-19067 '
Survey of Inrnates 01 Local Jails 1972: Advance Ret:'ort, NCJ-13313
Uniform Parole Reports: Parole In Ihe U.,lted Slates: 11)76 and 1977, NCJ-49702
Children In Custody: juvenile Detention and Correctional FaCility Census
Advance Report. 1975 census. NCJ-43528 .Advance Report. 1974 census. NCJ-38820 Final Report, 1973 census. NCJ·44777 Final Report, 1971 census. NCJ·13403
Myths and Realilles About Crime: A Nontechnical Presentation of Selected Information from the National Prisoner Statistics Program and the National Crime Survey. NCJ-46249
Nallonal Survey 01 Court Organiziltion: 1977 Sup;Jlement to State Jud:clal Systems, NCJ·40022 1975 Supplement to State Juaicial Systems, NCJ·29433 1971 (full report). NCJ-11427
State Court Caseload Statistics: The State of the Art, NCJ-46934 Advance Annual Report. 1975. NCJ-51884 Annual Report. 1975. NCJ·51885
Trends in Expenditure and Employment Dllta for Ihe Criminal JUf)tice System, 1971-76 (annual). NCJ-45685
Expenditure and Employment Data for the Criminal Jusllce System (annual) 1977 final report. NCJ-53206
State and Local Probation and Parole Systems, NCJ-41335
State and Local Prosecution and Civil Attorney Systems, NCJ-41334
CrIminal Justice Agencies In Regions 1-10 (10 vols. by state). NCJ-17930-38.15151
Dictionary 01 Criminal Justice Data Terminology: Terms and Delillltions Proposed for Interstate and National Data CollectIOn and Exchange. NCJ-36747 .
Program Plan lor Statistics, 1977.81. NCJ-37811
Utilization of Criminal Justice Statistics Project: Sourcebook 01 Criminal Jusllce Statistics 1978 (annual). NCJ-53207 Public Opinion Regs(dlng Crime, Criminal Justice. and Related
TopICS. NCJ-17419 New Directions In Processing of Juvenile Offenders: The Denver
Model, NCJ-17420 Who Gets Detained? An Empincal Analysis of the Pre-Adjudicatory
Detenllon 01 Juveniles in Denver. NCJ-17417 Juvenile DisposItions: SOCial and Legal Factors Related to the
Processing of Denver Delinquency Cases. NCJ-17418 Ollender-Based Transaction Statistics: New Directions In Data
CollectIon and Reporting. NCJ-29645 SentenCing 01 California Felony Offenders. NCJ-29646 The Jud:cial Processing of Assault and Burglary Offenders
In Selected California Counlles. NCJ-29644 Pre-Adjudicatory Detention in Three Juvenile Courts. NCJ-34730 Delinquency Dispositions: An EmpIrical Analysis of Processing
DeCISions in Three Juvenile Courts. NCJ-34734 The Patterns and Distribution of Assault Incident Characteristics
Among SOCial Areas, NCJ-40025 Patterns of Robbery Characteristics and Their Occurrence Among
SOCial Areas. NCJ-40026 Crime-Speclllc Analysis:
The CharacteristiCS of Burglary InCidents. NCJ-42093 An Emplflcal Exammatlon of Burglary Offender Charactenstlcs
NCJ·43131 An Emplflcal Exammation of Burglary Offenders and Offense
Charactenstlcs. NCJ-42476 Sources of National Criminal Justice Statistics: An Annotated
Bibliography. NCJ-45006 Federal Criminal Sentencing: Perspectives of AnalYSIS and a DeSign
for Research. NCJ-33683 Variations In Federal Criminal Sentences:
A StalJsllcal Assessment at the National Level. NCJ-33684 Federal SentenCing Patterns: A Study of GeographIcal Vanatlons.
NCJ-33685 Predicting Sentences In Federal Courts: The FeaSibility of a NalJonal
Sentencing Policy. NCJ-33686
..

------.--------------------------------....,------~-
Rape Victimization in 26 American Cities
by M. Joan McDermott Research Assistant
CRIMINAL JUSTICE RESEARCH CENTER Albany, New York
This project was supported by Grant No. 75-SS-99-6029, awarded to the Criminal Justice Research Center, Albany, New York by the Statistics Division, National Criminal Justice Information and Statistics Service, Law Enforcement Assistance Administration, U.S. Department of JWitice, under the Omnibus Crime Control and Safe
. Streets Act of 19619, as amended; the project, is being directed for the Criminal Justice Research Center by Michael J. Hindelang and monitored for LEAA by Sue A. Lindgren. Points of view or opinions stated in this do(:ument are those of the author{s) and do not necessarily reprellent the official position or policies of the U.S. Department o\! Justice. LEAA authorizes My person to reproduce, publish, translate, or otherwise use all or any part of the copyrighted material in this publication, with thl3 exception of those items indicating that they are copyrighted by or reprinted by permission of any source other than the Criminal Justice Research Center.
Copyright 1979 by Criminal Justice Research Center
Applications of the National Crime Survey Victimization and Attitude Data
ANALYTiC REPORT SD-VAD-6
SD-VAD-6 1979,
U.S. DEPARTMENT OF JUSTICE
Law Enforcement Assistance Administration
National Criminal Justice Information and Statistics Service
For sale by the Superintendent or Documents, U.S. Government Printing Office Washington, D.C. ~0402
Stock No. 027-000-OOS00-7

U.S. DEPARTMENT OF JUSTICE l.aw Enforcement Assistance Administration
Henry S. Dogin, Administrator
!-Iomer F. Broome, Jr., Deputy Administrator for Administration
Benjamin H. Renshaw, Acting Assistant Administrator Nlational Criminal Justice Information and Statistics Service
Charles R. Kindermann, Deputy Director Statistics Division
Library of Congress Cataloging in Publication Data
McDermott. M. Joan Rape victimization in 26 American cities.
(Applications of the National crime survey victimization and attitude data; analytic report 6)
Bibliography: p. 63 SUpt. of Docs. no.: J 1.4312:SD-VAD-6 1. Rape-United States-Statistics. I. Title. II. Series.
HV6561.M26 1979 364.1'53 79-13323
IMPORTANT
We have provided an evaluation sheet at the end of this publication. II will assist us in improving future reports il you complete and return 1\ at your convenience. Ills postagepaid and needs no stamp.
For sale by the Superintendent of Documents U.S. Government Printing Office Washington. D.C. 20402
Stock No.

The APPLICATION OF VICTIMIZATiON SURVEY RESULTS Project is funded by the Statistics Division of the National Criminal Justice Information and Statistics Service of the Law Enforcement Assistance Administration. This research project has as its aim the analysis of the data generated by the 'National Crime Survey studies of criminal victimization undertaken for LEAA by the Uni~ed States Bureau of the Census. More specifically, this research project, as its title suggests, encourages the use of the National Crime Survey data to examine issues that have particular relevance for applications to the immediate needs of operational criminal justice programs.
This aim is pursued in two ways. First, the project staff has conducted a series of regional seminars on the history, nature, uses, and limitations of the National Crime Survey victimization data. These seminars, attended by criminal justice planners, crime analysts, researchers, and operating agency personl1el, have served as a useful exchange for disseminating information about the .LEAA/Census victimization surveys and for soliciting from attendees suggestions .for topics that they would like to see explored with the available victimization survey data. Second, based on these suggeE~ions and on topics generated by the project staff at the Criminal Justice Re~earch Center, the project staff has undertaken a series of analytic reports that give special attention to applications of the victimization survey results to questions of interest to operational criminal justice programs. This report is one.in the analytic series.
The National Crime Survey victimization data provide a wealth of important information about attitudes toward the police, fear of criminal victimization, characteristics of victims, the nature of victimizations, the consequences of crimes to victims, characteristics of offenders, the failure of victims to report crimes to the police, reasons given by victims for not notifying the police, and differences between those victimizations that are and those that are not reported to the police.
The National Crime Survey results make available systematic information the scope and' depth of which has not heretofore been available. These

data constitute a vast stOre of information that can be a substantial utility to the criminal justice community. Knowledge about characteristics of victimized persons, households, and commercial establishments and about when and where victimizations occur have particular relevance for public education programs, police patrol strategies, and environmental engineering. Information on the nature and extent of injury and loss in criminal victimization can provide data' necessary for determining the feasibility of, or planning for, programs for restitution and compensation to victims of crime. Information about the level of property recovery after burglaries and larcenies is useful for assessing the need for property identification programs. Knowledge about the levels of nonreporting to the police and about the kinds of victimizations that are disproportionately not reported to the police give an indication of the nature and extent of biases in police data on offenses known.
These are only a few of the areas in which results of victimization survey data have the potential for informing decision making and shaping public policy, It is the aim of this series of analytic reports to explore some of' the potential applications of the victimization survey results and to stimulate discussion about both the utility and limitations of such applications.
MICHAEL J. HINDELANG Project Director

, .
APPLICATION 0'= VICTIMIZATION SURVEY RESULTS Project Staff
Michael J. Hindelang, Project Director
James Garofalo, Project Coordinator
John J. Gibbs, Research Analyst Vern etta D. Young, Research Analyst
Daniel l. Papenfuss, Computer Programmer Teresa A. Quinn. Computer Programmer
Mark Blumberg, Research Assistant M. Joan McDermott, Research Assistant Ellen Hochstedler, Research Assistant
Kim McClure, Secretary
vi
CONTENTS
Highlights of the Findings ..... " ........ , ..... " ,. ~ .... . Introduction ......••.............•.........•.........
City D'ata ....•..•...•.........•................•..
Female Victims •.•......••...............•......•..
Limitations of Victimization Survey Data on RalJe ., ..
Rapes Committed by Strangers ...............•..•..
Analytic Format .................................. .
Victim Characteristics .•.............•................
Age ...............•.................•............
Race " ............. " ............................. .
Age and Race ..............................•......
Marital Status .........•....•........•.........•...
Major Activity .....................•........•....•.
Income ." ............. " ............. II •••••••• :! ••••
Income and Race .........•.................•......
Summary: Victim Characteristics ........•..........
xi
1
1 -it'
2
2
3 4
4
5
6
7
8
8
10
11
12
• i

-----"·-----------------------------71
Characteristics of the Victim in Relation to the Offender ... IJ • • • • • • • • • • • • • • • • • • • • • • • • • • • • • • • • • • •• 1 2
Age of Victim by Age of Offender ..•................ 12
Race of Victim by Race of Offender ......•.......... 14
Elements of Rape and Attempted Rape Victimization .•. 17
Time and Place of Occurrence ...............•...... 17
Number of Offenders and Number of Victims .....•.. '18
Weapons ....•..................................... 18
Theft and Attempted Theft ......................... 25
Consequences of Rape and Attempted Rape Victimization ..............••••.................. 29
Self-protective Measures ........................... 29
Injury.. . . .. .. .. . . .. . . . ... .. .. . ... .... . ... . .. ...•.. 36
Informing the Police ..................•............ 43
Summary and Conclusions .......................•.•. 48
Appendix A: Rape Involving Nonstrangers •..•...•..... 51
Appendix B: National Crime Survey Questionnaire ...•• 53
References... ..•• . ... .. .. .... .. . . . .......... . ....•.. 63
vii I

TABLES AND FIGURES
Table 1
Figure 1
Table 2
Figure 2
Table 3
Table 4
Figure 3
Figure 4
viii
Estimated percentages of stranger and nonstranger rape and at~ tempted rape victimization, 26 cities aggregate ..••.••........ 3
Estimated rates (per 100,000 females 12 years of age or older) of rape and attempted rape victi~ mization, by age of victim, 26 cities aggregate .......•..•..•. 5
Estimated rates (per 100,000 females 12 years of age or older) and percentages of rape and attempted rape victimization, by race of victim, 26 cities aggre~ gate ....•.................... 6
Estimated rates (per 100,000 females 12 years of age or older) of rape and attempted rape victi~ mization, by race and age of victim, 26 cities aggregate ..... 7
Estimated rates (per 100,000 females 12 years of age or older) of rape and attempted rape victi~ mization, by marital status of victim, 26 cities aggregate •.... 8
Estimated rates (per 100,000 females 12 years of age or older) of rape and attempted rape victi~ mization, by major activity of victim, 26 cities aggregate ..... 9
Estimated rates (per 100,000 females 12 years of age or older) of rape and attempted rape victi~ mization, by family income of vic~ tim, 26 cities aggregate ....... 10
Estimated rates (per 100,000 females 12 years of age or older) of rape and attempted rape victi~ mization, by race and family income of victim, 26 cities aggregate ..••.•....•.....•..• 11
Table 5
Table 6
Table 7
Table 8
Table 9
Relationship between age of victim and perceived age of lone offender in rapla and attempted rape victimization, 26 cities aggregate .••..•.••••..••••••• 13
Relationship between age of victim and perceived ages of mUltiple offenders in rape and attempted rape victimization, 26 cities aggregate ........•...•..•.... 14
Relationship between race of vic-tim and perceived race of lone offender in rape and attempted rape victimization, 26 cities aggregate .........•.......... 15
Relationship between age of vic-tim and perceived races of multiple offenders in rape and attempted rape victimization, 26 cities aggregate .•............. 16
Time of occurrence of rape and attempted rape victimization, 26 cities aggregate .•..•.......... 17
Table 10 Place of occurrence of rape and attempted rape victimization, 26 cities aggregate ..............• 19
Table 11 Perceived number of offenders and number of victims in rape and attempted rape victimization, 26 cities aggregate ............... 19
lable 12 Estimated percentages of weapon use in rape and attempted rape victimization, 26 cities aggre~ gate ....................••... 20
Table 13 Type of weapon used in rape and attempted rape victimization, 26 cities aggregate ............ 21
:1 ~- -------~-----------~-------------------------------'"

Table 14 Estimated percentages of weapon Table 22 Estimated percentages of use of use by place of occurrence in self-protective measlJres and r~pe =md attempted rape yicti-
21 type of self-protective measures
mization, 26 cities aggregate used in rape and attempted rape
Table 15 Estimated percentages of weapon victimization, 26 cities aggre-
31 use and type of weapon used in
gate ......................... rape and attempted rape victi- Table 23 Estimated percentages of use of mization, by race of victim, 26
23 self-protective measures and
cities aggregate .......•.•..... type of self-protective measures
Table H, Estimated percentages of weapon used in rape and attempted rape victimization, by race of victim,
use and type of weapon used in 26 cities aggregate ............ 32 rape and attempted rape victimi-zation, by age of victim, 26 Table 24 Estimated percentages of use of cities aggregate ..............• 23 self-protective measures in rape
Table 17 Estimated percentages of weapon and attempted rape victimization, by age of victim, 26 cities
use in rape and attempted rape aggregate .................... 34 victimization, by perceived race of lone and multiple offender(s), Table 25 Estimated percentages of use of 26 cities aggregate ............ 24 self-protective measures in rape
Table 18 Estimated percentages of weapon and attempted rape victimiza-tion, by offender's weapon use,
use by perceived age of lone and 26 cities aggregate ....••...... 34 multiple offender(s) in rape and attempted rape victimization, 26 Table 26 Estimated percentages of use of cities aggregate ............•.. 26 self-protective measures in
Figure 5 Estimated percentages of theft, rape and attempted rape victimi-zation, by number of offenders,
attempted theft, and cash only 26 cities aggregate •.......••.. 35 theft in rape and attempted rape victimization, 26 cities aggre- Table 27 Estimated percentages of injury gate ......................... 27 suffered and type of injury suf-
Table 19 Estimated percentages of theft in fered by those injured in rape and attempted rape victimization, 26
rape and attempted rape victimi- cities aggregate ... , .•........• 37
"
zation, by age of victim, 26 cities aggregate ....•.....•.... 28 Table 28 Estimated percentages of rape and
Table 20 Estimated percentages of theft in attempted rape victims who sus-tained additional physical injury,
t' rape and attempted rape victimi- 26 cities aggregate .....•.....• 38
1 zation, by race of victim, 26
Table 29 Estimated percentages of the i c~ies aggregate ......•. ~ ...••. 28 ! extent of hospital treatment re-
Table 21 Estimated percentages of theft in ceived by those victims who rape and attempted rape victimi· needelci medical attention follow-
, zation, by family income of vic- ing rape and attempted rape victi-, ! tim, 26 cities aggregate ..•.... 29 mization, 26 cities aggregate 39 I
.. 1
II It Ii ix i
I

Table 30 Estimated percentages of rape and Table 35 Estimated percentages of victims attempted rape victims who sus- informing the police and reasons tained additional physical injury, for not infOl'ming the police in by race of victim, 26 cities ag-
39 rape and attempted rape victimi-
gregate ...................... zation, 26 cities aggregate ..... 44 Table 31 Estimated percentages of rape and Table 36 Estimated percentages of inform-
attempted rape victims who sus- ing the police in rape and at-tained additional physical injury, tempted rape victimization, by by age of victim, 26 cities ag-
40 race of victim, 26 cities ag-
gregate ......... ,., .......... gregate •••••••• t ••••••• \I ••••• 45 Table 32 Estimated percentages of rape and Table 37 Estimated percentages of inform-
attempted rape victims who sus- ing the police in rape and at-tained additional physical injury, tempted rape victimization, by by use of self-protective meas-
41 <lge of victim, 26 cities ag-
ures, 26 cities aggregate ...... gregate . .. , ................... 45 Table 33 Estimated percentages of rape and Table 38 Estimated percentages of inform-
attempted rape victims who sus- ing the police in rape and at-tained additional physical injury, tempted rape victimization, by by number of offenders, 26 marital status of victim, 26 cities aggregate ............... 42 cities aggregate ..........••.... 47
Table 34 Estimated percentages of rape and Table 39 Estimated percentages of inform-attempted rape victims who sus- ing the police by rape and at-tained additional physical injury, tempted rape victims, by addi-by offender's wenpon use, 26 tiona I physical injury, 26 cities cities aggregate ...•.....••.••• 42 aggregate •••••••••••••••• <t ••• 47
. _----------------------------------- ._--j
Highlights of the Findings
Victimization survey data from 26 cities are used in this report to examine rape and attempted rape. The victimizations described are those that involved female rape and attempted rape victims who were a':tacked by offenders they did not know. In addition to examining rape victim and incident characteristics, the survey data are used to look at characteristics of the offenders as perceived tly their victims. Some highlights of this analysis include:
1. Characteristics of Victims: Rates of rape and attempted rate victimization within victim age, race, marital status, major tlctivity (for example working, keeping house, in school) and income categories are reported. ThG survey data indicate that rates of rape and attempted rape in the 26 cities were higher for young women (compared with older women), black and other racial minority women (compared with white women), and women who were never married or were divorced or separated (compared with those who were married or widowed). In addition, women whose maj or activities took the~n a way from the home and those with lower family incomes had higher rates of rape and attempted rape victimization than did women who spent most of their time at home and those with higher family incomes.
2. Characteristics of Victims in Conjunction with Characteristics of Offenders: ' The age and race characteristics of rape and attempted rape victims are looked at together with the same characteristics of their offenders. The data indicate that victims in all age categories were most often attacked by offenders perceived to be 21 or older, although when more th..an one offender was involved both the victim and the offender were younger. The survey data also show that rape and attempted rape in the 26 cities were highly intra-racial, although less intra-racial when the victim was white.
3. Some Elements of Victimization: Survey data are used to examine elements of rape and attempted rape victimizations-including time, place, number of offenders and number of victims, theft and weapon use. More rapes and attempted rapes occurred in the evening and nighttime hours than during the day, and more took' place in an open public area such as a street or a park than in any other location. Most attacks were committed by one offender and the vast majority involved one victim. Theft was an element in only a small minority of the victimizations. Although weapons were used in less than half of the victimizations, weapon use appeared to be effective as a means of intimidation-that is, proportionately more attacks were completed when the offender was armed. Knives were the most common weapons used in rape and attempted rape.
4. Some Consequences of Victimization: Lastly, this report looks at some cOJ;lsequences of rape and attempted rape attacks, such as the use of self-protective measures, injury, and reporting the offense to the police. Most victims in the 26 cities surveyed did something to protect themselves. The survey data show that when a woman did something to defend herself, she increased the chances that the rape attack would not be completed; however, she also increased the likelihood that she would receive additional (non-rape) injuries. Most often th6 injuries resulting from rape and attempted rape victimization were either injuries that were directly associated with the physical act of rape itself, or minor additional injuries such as bruises, cuts, and scratches. The data also indicate that only slightly over half of the women who reported rape and attempted rape victimization to survey interviewers said that the incident had been reported to the police. Victims who failed to report most often said either that they considered the incident to be a private or personal matter or that they thought nothing could be done, that there was a lack of proof.
xi

----------------------------
Rape Victimization in 26 American Cities
Introduction A COMBINATION of factors, ranging from an upward trend in urban violence to the growth of the women's movement to the current concern with the treatment of victims of crime, has brought increased attention to the crime of forcible rape. 1 The Federal Bureau of Investigation's Uniform Crime Reports (UCR) for 1975 indicates that forcible rape makes up . only I percent of the total crime index and 5 percent of the violent crime i.ldex. However, the seriousness of rape is determined not by its volume but by its nature. Throughout history rape has been viewed as one ofthe most vile and atrocious crimes.
The study of forcible rape has traditionally focused on the offender and on the crime itself, not on the victim. Much of what is known about rape is the result of research using either data on crimes reported to the police or data gathered from interviewing convicted rape offenders. Together, these studies have reported patterns in rape that include factors such as temporal and spatial patterns, offender characteristics and motives, modus operandi, and to a limited extent, characteristics of victims and victim-offender relationships.
In addition to failing to focus on the victim, attempts to describe and explain rape that are based entirely on police file data or data gathered from samples of convicted rapists have other shortcomings. The major problem with using police data on rape is that the offense is notoriously underreported, although the degree of underreporting has been a matter of dispute. Researchers using police files have
lForcible rape is generally defined as the carnal knowledge of a woman by a man, forcibly and against her will. Carnal knowledge here means sexual intercourse. It is not necessary that the penetration of the vagina be complete and sexual emission need not occur,
estimated that the rape cases reported to the police represent anywhere from 5 to 50 percent of the actual number of rapes committed in a given year (Amir, 1971:27). Another problem with using data drawn from police files is the major differences that exist among police departments in the classification and recording of rape incidents. (Chappell, 1975)
Studies using data gathered from samples of convicted rape offenders are also often limited. Generalization from these studies is hampered by small unrepresentative samples. Only a fraction of rapes reported to the police result in arrest. Of those arrested and charged, an even smaller propottion are ultimately convicted and incarcerated for this offense. For example, a recent study in Seattle indicated that of the 315 rapes reported to the police in 1974, only 6 cases resulted in a conviction for rape or attempted rape (Chappell and James, 1976:2).
'In this report, victimization survey data will be used to examine rape and attempted rape. Because the victimization survey data are not subject to the shortcomings mentioned above, they can fill in gaps left by traditional data sources. For example, a good deal of information on victim and incident cbatacteristics can be obtained because of the types of questions asked. The survey data can also provide an indication both of the extent of and the reasons for victims not reporting rape to the police. Finally, consistency in classification and recording is possible because the data are collected by a single agency using standard definitions, collection techniques, and data classifications.
City Data
. !h~ rape data in th~ report ar~ the result of 26 city vlCtimlzatIOn surveys 'i.0nducted m 1974 and 1975 by the Bureau of the Census for the Law Enforcement

Assistance Administration (LEAA).2 Interviews were conducted with representative samples of roughly 10,000 households (22,000 individuals) in each of the 26 cities.
Estimated rates of rape based on city surveys do not reflect ,the rape rate nationally. The rape rates in this report (based on representative city samples) cannot be used to estimate the extent of rape across the nation; however, they can be used to describe rape in urban areas where it is a more serious crime problem. The F.B.I.'s Uniform Crime Reports for 1975 mdicated that urban areas have much higher rates of rape. According to the UCR, in 1975 the rape rate in urban areas was 61 victims per 100,000 females. Cities outside metropolitan areas experienced a rate of26 per 100,000 females; rural areas, a rate of 23 per 100,000 females (Kelley, 1976:22).
Female Victims
The victimization surveys obtained information from both men and women on victimizations that were classified as rape and attempted rape. Victimizations were classified as rape or attempted rape on the basis of information that was obtained by survey questions on threats, attacks, and injury.3 However, the smail number of cases in which the victim was a male severely limits what can be said about these incidents. In addition, the crime of rape is generally, both legally and socially, considered a crime against women. For these reasons, this report will deal only with the victimization data in which the rape victims were women.
Limitations of Victimization Survey Data on Rape
Victimization survey data on rape have limitations. First, there is a general problem, faced in all
2The cities are: Atlanta. Baltimore. Boston. Buffalo. Chicago. Cincinnati. Cleveland. Dallas. Denver. Detroit. Houston. Los Angeles. Miami. Milwaukee. Minneapolis. New Orleans. Newark. New York. Oakland. Philadelphia. Pittsburgh. Portland. San Diego. San Francisco. St. Louis. and Washington. See An Introduction to the National Crime Survey. Analytic Report SD-VAD-4. Garofalo. James and Hindelang. Michael J. Law Enforcement Assistance Administration. National Criminal Justice Information and Statistics Service. Washington. D.C.: Government Printing Office. 1978.
3Victims who were threatened. attacked. or injured were asked about the nature of the threat. attack. or injury. A victimiZation was cl(lssified as a rape if rape was the method of attack or the type of injury. A victimization was classified as an attempted rape if there was verbal threat of rape. or if attempted rape was the method of attack. or jf there were attempted rape injuries.
2
victimization survey interviews, of victims being unable or unwilling to report the incident to the survey interviewer. In addition, there are special problems involved when a rape victim is interviewed.
The general problem of victims not reporting incidents to survey interviewers occurs for several reasons. The victim may have simply forgotten the incident or may for some reason be unwilling to report it to the interviewer. For example, rape victims who know their attackers may be less willing to report the offense than those who are raped by strangers. Victims of known and unknown assailants may be unwilling to report the attack to the interviewer because of embarrassment or because it is difficult and unpleasant for them to discuss it.
There are special problems when a raIl'~ victim is interviewed. The major difficulties with the survey interview procedure designed to elicit rape victimizations result from both the content of the survey questions and from the manner in which the interview is conducted. First, survey interviewers do not ask victims directly if they have been raped. Rather, respondents are asked if they have been assaulted. If they respond affirmatively, there is further inquiry into the nature of the assault to determine if it can be classified as a rape. Because the assault question is asked first, the survey instrument may fail to detect rape victimizations or may misclassify them as assaults. The second problem is that the interview may be conducted in the presence ·of other household members. In these situations, the victim may be reluctant to report to the interviewer certain types of attacks, such as those not known to other household members or those committed by family members.
These problems were examined by the San Jose Methods Test of Known Crime Victims, a feasibility study conducted by the Bureau of the Census for LEAA (LEAA, 1972). The reverse record check design tested whether the survey instruments could successfully elicit mention of certain victimizations from victims known to the police. The San Jose study indicated that of those rape victims known to the police and for whom it was possible to obtain an interview, two-thirds reported the incident to survey interviewers. The study also suggested that the extent of not reporting was influenced by whether or not the attacker was known to the victim. Eighty-four percent of the rape attacks by strangers were reported to interviewers, compared with only 54 percent of the rape attacks by known assailants.
The report of the San Jose study also noted that 5 (out of 30) of the known rape victims mentioned the incident in the interview but reported to interviewers the kind of details that caused the event to be classified

as an assault in the survey. On the basis of information given by the victims, there was no way of determining if these cases were misc1assified as r"pes by the police or as assaults by the survey.
The results of the San Jose study have several implications for the analysis in this report. FirDt, the survey data in this report provide information on all rape and attempted rape victims who reported the incident to the interviewer, both thost who reported it to the police and those who failed to do so. However, the survey data do not contain information on two groups of victims: those who reported the incident to the police but not to the interviewers and those who did not report it to either the police or the interviewers. The San Jose study provided an indication of the proportion of victims who report the incident to the police but fail to report to survey interviewers. However, neither the survey data nor the reverse record check method can be used to estimate what proportion of victims do not report the incident to the police or to the interviewers.
A second caution of the San Jose study is that the surveys may have detected some rape victimizations but picked up details which caused them to be misc1assified as assaults. If some of the rapes in the 26 cities were classified as assaults .. this would also imply that the data in this report underestimate the extent of rape.
Finally, because of the low rate of reporting by rape victims of known assailants, caution should be exercised in interpreting the victimization survey data on rapes committed by attackers known to the victim. The body of this report will deal only with those rape attacks that involved unknown assailants; however,
Appendix A presents some data on rape by nonstrangers.
Rapes Committed by Strangers
The relationship between the rape victim and offender can ynry from a close personal relationship to one in whiCfithe assailant is unknown to the victim. Survey interviewers asked rape victims if the attacker was someone known or if he was a stra.nger. (See Appendix B, source codes 140 and 147. The source codes are the circled numbers to the left of the questions.) The data obtained in response to this question are given in Table 1. In the analysis used in this table, the offender was classified as a "stranger" if the victim reported that he was a stranger or was known by sight only, or if the victim didn't know whether or not she knew him. The offender was classified as a "nonstranger" in cases in which he was a casual acquaintance or well known to the victim. The latter includes cases in which he was a relative.
The data show an estimated 39,310 rape and attempted rape victimizations occurred in the 26 cities. More than four out of five (82 percent) were committed by strangers. However, this probably does not reflect the actual proportion of rapes involving strangers. The results of the San Jose reverse record check showed that only 54 percent of rapes committed by nonstrat1gers were reported to survey interviewers by known victims, compared with 84 percent of the rapes committed by strangers. This difference in reporting suggests that the rape data from the 26 cities surveyed may be biased by undercounting the nonstranger rapes to a greater extent than the stranger-
TABLE 1 Estimated percentages of stranger and nonstranger rape and attempted rape victimization, 26 cities aggregatea
Victim-offender relationship
Stranger
Nonstranger
Estimated number of victimizations
gExciudes victimization of males. Row percentage.
cColumn percentage.
Rape
32%b 80%c
37% 20%
33% (12,970)
Type of victimization
Attempted Estimated number rape of victimizations
68% (32,180) 83% 82%
63% (7,130) 17% 18%
67% 100% (26,340) (39,310)
3

r-------------------------------------------------------·--------------~----------------------
to-stranger rapes. Applying weighting factors derived from the San Jose results may give a more accurate estimate of the proportions of stranger and nonstranger rape. When the weighting factors are applied to the data in Table 1, it can be estimated that 74 percent of the total rapes and attempted rapes in the 26 cities surveyed were committed by strangers and 26 percent by offenders known to the victims.
Because of the probable undercounting of nonstranger rapes in the victimization surveys from which the data in this report are derived, only strangerto-stranger ra pes, that is, those victimizations in which the attacker was not known to the victim, will be considered in the body of this report. Appendix A will briefly highlight some of the findings in the nonstranger rape data.
Analytic Format
The victimization survey data will be used to examine rape victim, offender, and incident characteristics. First, rates of rape and attempted rape victimization within age, race, marital status, major activity and income categories will be reported. Then age and race characteristics of the victim will be looked at in conjunction with the same characteristics of their offenders. Next, elements of rape victimizationsincluding time, place, number of offenders and number of victims, theft and weapon use-will be reported. Lastly, this report will look at some consequences of rape attacks, such as the use of selfprotective measures, injury, and reporting the offense to the police.
Victim Characteristics This section of the report will examine age, race,
marital status, major activity, and income characteristics of victims of rape and attempted rape. Victim characteristics will be described in terms of rates of rape and attempted rape per 100,000 females 12 years of age or older. Because the rates are computed by dividing the number of rape and attempted rape victimizations by the estimated number of women 12 years of age or older in the 26 cities, they can be used as one estimate of the risk of being the victim of a rape attack.4 For example, the rate data will suggest
4The rates of rape and attempted rape victimization are arrived at by dividing the number of rape and attempted rape victimizations by the estimated number of women 12 years of age or older in the 26 cities. Because the numerator used is victimizations rather than victims. these rates probably overestimate the risk of being the victim of a rape attack. This overestimation will occur because some victims may have reported more than one rape victimization.
4
answers to questions such as whether the risk of rape is higher for younger or for older women, for single or married women, or for white women or women of minority races.
In addition, rates of rape and attempted rape for victims in different categories of these demographic or characteristic variables will be examined using an index that compares rates of rape with rates of attempted rape. This will give an indication of the relative risk of being the victim of a more serious, completed rape attack. The index is obtained by dividing the rate of rape by the rate of attempted rape.s
The resulting ratio can be considered a completion ratio because it compares the risk of being the victim of a complf1ted rape attack (a rape) with the risk of being the victim of a rape attack which is not completed (an attempted rape). For example, for any given category of victims when the completion ratio is .50 the risk of being a victim of an attempted rape, regardless of the total risk in that category. When the completion ratio is 1.00, the risk of being a victim of ra pe is equal to the risk of being a victim of attempted rape. When the completion ratio is 2.00, the risk of being a victim of rape is twice the risk of being a victim of attempted rape. More simply, the higher the ratio is, the greater is the relative risk of being the victim of a completed ra pe attack. The completion ratio will be useful in comparing the victimization experience of victims in different categories of variables such as age and race. For example, if the risk of being the victim of a rape attack is much higher for younger women compared with older women, it will be useful to know if younger women also have a relatively greater risk of being victims of completed rape attacks, or if older women, who have a much lower overall risk, have a relatively greater risk of being victims of completed rape attacks.
In this section of the report and in the sections that follow, the analysis will be restricted at times by the small number of victimizations in given categories. For example, comparatively few rape and attempted rape victimizations were reported to survey interviewers by elderly women. Estimates based on about 50 or fewer sample cases may be statistically unreliable. In the tables that follow, where the base upon which rates or percentages are calculated contains about 50 or fewer sample cases, this problem will be indicated by a footnote.
5Later in this report this index will be obtained by dividing the proportion of rapes by the proportion of attempted rapes. rather than by dividing the rate of rape by the rate of attempted rape. Although the ratio will be calculated using proportions rather than rates. the interpretation of the ratio is similar.

Age
Generally, young women experience the greatest risk of being victims of rape attacks. Research studies that have used police data report that most rape victims are in their late teens or early twenties (Amir, 1971; MacDonald, 1971). The victimization survey data also indicate that the age groups that experienced the highest risk of rape attacks were those including victims ranging from 16 to 19 and from 20 to 24 years old. The risk of rape and attempted rape victimization then decreased dramatically as the women got older.
The rates of rape and attempted rape victimization for victims of different ages are illustrated in Figure 1. The rate of rape was highest among women between 16 and 19 years old (243 per 100,000); it declined only slightly for women between 20 and 24 years old (224 per 100,000). The rate of rape then showed substantial decreases as women got older, although it was slightly higher for women 65 or older than for women 50 to 64 years old. The rate of attempted rape was higher than the rate of rape for women in every age group except the oldest (65 and over). In attempted rape victimizations, the data show a similar pattern in the
FIGURE 1 Estimated rates (per 100,000 females 12 years of age or older) of rape and attempted rape victimization, by age of victim, 26 cities aggregatea
Rate: 500~-------------------------------------------------------------~
488
428
400
Rape II D Attempted rape
300
200
100
Age: 12~15 16~19 20~24 25-34 35-49 50-64 Population basec; 1,039,522 1,059,850 1,490,446 2,202,277 2,419,101 2,510,611
~Excludes rape and atternpted rape victimization by nonstrangers and victimization of males. Estimate, based on about 50 or fewer sample cases, may be statistically unreliable.
CEstimated number of females in the population in given age categories,
65-99 1,936,380
5

TABLE 2 Estimated rates (per 100,000 females 12 years of age or older) and percentages of rape and attempted rape victimization, by race of victim, 26 cities aggregatea
R eo'): of victim
Type of victimization White Blaf;k/other Total
Rape 30%b 35% 32% 67c 115 82
Attempted rape 70% 65% 68% 154 213 173
Estimated number of victimizations (19,353) (12,827) (32,180)
Population based 8,755,860 3,992,316 12,658,176
aExcludes rape and attempted rape victimization by nonstrangers and victimizcr!ion of males. bColumn percent. ..' , CEstimated rate per 100,000 females 12 years of age or, old~r In given race C;:'Itegories. dEstimated number of females 12 years of age or older In given race categones.
rates as the victim gets older. As Figure 1 illustrates, the rate of attemr,~;~d rape was highest among women between the ages of 20 and 24 (488 per 100,000).
The rate data indicate that the risk of rape and attempted rape attacks is highest for young women and that as women get older their chances of being attacked decline substantially. When these rate data for rape and attempted rape are converted into completion ratios some interesting results emerge. Although the rates of rape and aitempted rape were quite low for elderly women (65 or over), the completion ratio is highest for this group (1.07). Compared with women in all other age groups, elderly women experienced the greatest relative risk of being victims of rape attacks that were completed. The data also show that the category of women between the ages of 25 and 34 experienced much lower rates of rape and attempted rape than women from 16 to 19 and from 20 to 24 years old; however, their completion ratio (.58) is about the same as that of 16 to 19 year old women(.57) and slightly higher than that of 20 to 24 year old women (.46).
These results suggest that for elderly women and for women between the ages of 25 and 34 the victimization experience in sexual assault is not adequately described by rates of rape and attempted rape alone. The completion ratios show that although these women experienced lower rates of rape and attempted rape than young Women, their relative risk of being victims of rape attacks that were completed was equal to or greater than the risk experienced by young women. Because rape is a more serious assault than attempted rape, these results suggest that While
6
,------------------------~
the rate' of victimization for elderly women and women between the ages of 25 and 34 may be lower than that for young women, the victimizations suffered may be more serious.
Race.
Researchers using police data have reported that black and other minority women have a much greater risk of being raped than do white women (Amir, 1971; MacDonald, 1971). The victimization data also indicate that the rates of rape and attempted rape in the 26 cities were substantially higher for black and other minority women than for white women.6
Table 2 indicates the rate of rape for black and other minority women was 1.7 times the rate for white women (115 compared with 67 per 100,000). In attempted rape victimization, the rate for minority women was 1.4 times the ratefor whites (213 compared with 154 per 100,000).
The survey data also show that rape attacks maybe more serious, in terms of a greater likelihood of their being completed, when victims are black or other minority race members. Completion ratios calculated
6Because races other than black and white constitute too small a proportion of the population in the 26 cities to permit separate analysis. in this report "other" race victims are grouped with black victims and are referred to as "black and other minority victims" or at times "minority victims." It is important to note that the term "minority" as used here relates to minori'ty races and not minority groups. For example, although oriental victims are included in the "black and other minority" race category. white Spanish-speaking people are included in the white race category.
'"

from the rate data in Table 2 indicate that the relative risk of being the victim of a completed rape attack was slightly higher for minority women than for white women (.54 compared with .44). The relatively higher risk of rape attacks being 'completed for minority women could suggest that their sexual assaults are more serious; however, it should be noted that this finding could be a result of reporting differences. Because of cultural differen.ces, black and other minority women may tend to report only the more serious rape victimizations; that is, they may simply not report attempted rape attacks to survey interviewers as often as white women do.
Age and Race
When the data for rape and attempted rape are examined while jointly controlling the victim's race and age, it is seen that the rates of victimization wer~j
, not always higher for minority women than th~y were for white women. Figure 2 indicates that the rate of rape was higher for black and other minority women than it was for white women in every age category. However, the rate of attempted rape victimization was not consistently higher for black and other minority women across age categories. Young white women (12 to 19 year oIds) experienced a much greater risk of being victims of attempted rape than did young minority women (356 compared with 270 per 100,000). However, in the victim age categories 20 to 34 and 35 and older black and other minority women had higher rates of attempted rape than did white women.
Thus, the rate data for rape and attempted rape victimizations in the 26 cities indicate that although the risk of being a vii!tim of attempted rape was generally higher for minority women than for white women, it was not higher for those women under the age of 20.
FIGURE 2 Estimated rates (per 100,000 females 12 years of age or older) of rape and attempted rape victimization, by race and age of victim, 26 cities aggregatea
Rate:~ __________________________________________________________ ~ __ ~
400
300
200
100
01...-------Age:
White population base:c
Black/other population base: c
12 to 19 1,264,505
834,867
20 to 34 2,444,078
1,248,645
aExcludes rape and attempted rape victimization b)' nonstrangers.ar)d vlctimiz~tion of males. bEstimate based on about 50 or fewer sample cases, may be statistically unreliable. cEstimated number of females in the population in given race and age categories.
II White rape
~ White ~ attempted rape
D Black/other rape
~ Black/other t:::2;I attempted rape
35 and older 5,047,277
1,818,804
7
Marital Status
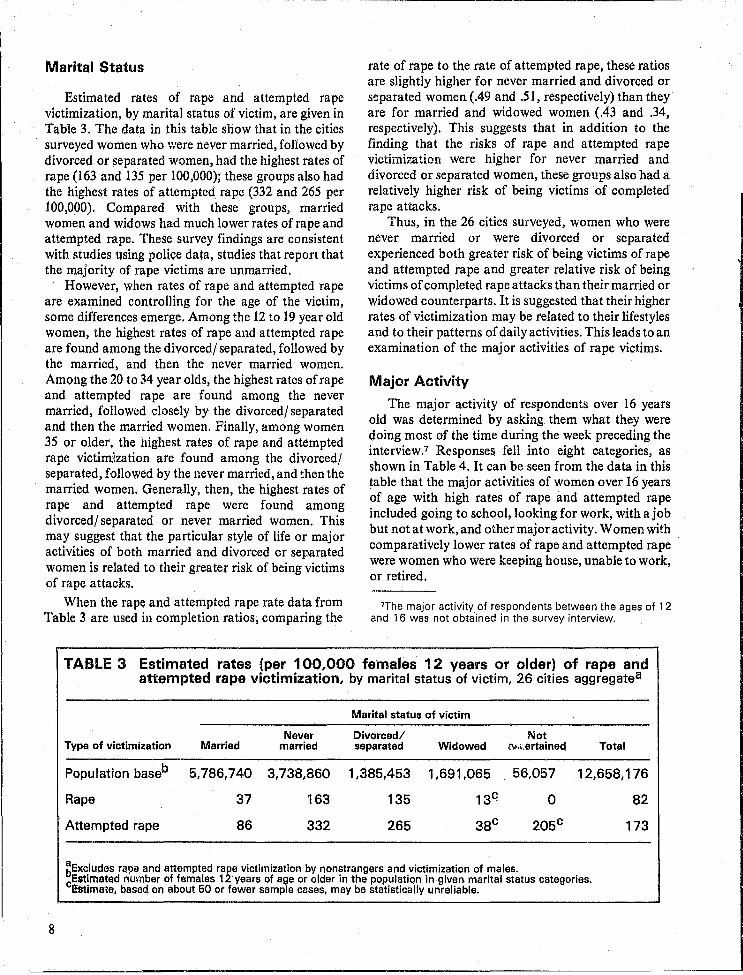
Estimated rates of raptl and attempted rape victimization, by marital status of victim, are given in Table 3. The data in this table show that in the cities surveyed women who were never married, fonowed by divorced or separated women, had the highest rates of rape (163 and 135 per 100,000); these groups also had the highest rates of attempted rape (332 and 265 per 100,000). Compared with these groups, married women and widows had much lower rates of rape and attempted rape. These survey findings are consistent with studies using police data, studies that report that the majority of rape victims are unmarried.
However, when rates of rape and attempted rape are examined controlling for the age of the victim, some differences emerge. Among the 12 to 19 year old women, the highest rates of rape and attempted rape are found among the divorced/ separated, followed by the married, and then the never married women. Among the 20 to 34 year olds, the highest rates of rape and attempted rape are found among the never married, followed closely by the divorced/ separated and then the married women. Finally, among women 35 or older, the highest rates of rape and attempted rape victim)\zation are found among the divorced/ separated, followed by the never married, and then the married women. Generally, then, the highest rates of rape and attempted rape were found among divorced/ separated or never married women. This may suggest that the particular style of life or major activities of both married and divorced or separated women is related to their greater risk of being victims of rape attacks.
When the rape and attempted rape rate data from Table 3 are used in completion ratios, comparing the
rate of rape to the rate of attempted rape, these ratios are slightly higher for never married and divorced or separated women (.49 and .51, respectively) than they are for married and widowed women (.43 and .34, respectively). This suggests that in addition to the finding that the risks of rape and attempted rape victimization were higher for never married and divorced or separated women, these groups also had a relatively higher risk of being victims of completed rape attacks.
Thus, in the 26 cities surveyed, women who were never married or were divorced or separated experienced both greater risk of being victims of rape and attempted rape and greater relative risk of being victims of completed rape attacks than their married or widowed counterparts. It is suggested that their higher rates of victimization may be related to their lifestyles and to their patterns of daily activities. This leads to an examination of the major activities of rape victims.
Major Activity
The major activity of respondents over 16 years old was determined by asking them what they were doing most of the time during the week preceding the interview.7 Responses fell into eight categories, as shown in Table 4. It can be seen from the data in this table that the major activities of women over 16 years of age with high rates of rape and attempted rape included going to school, looking for work, with a job but not at work, and other major activity. Women with comparatively lower rates of rape and attempted rape were women who were keeping house, unable to work, or retired.
7The major activity of respondents between the ages of 12 and 16 was not obtained in the survey interview.
TABLE 3 Estimated rates {per 100,000 females 12 years or older) of rape and attempted rape victimization, by marital status of victim, 26 cities aggregatea
Marital status of victim
Never Divorced/ Not Type of victimization Married mafried separated Widowed "'.;.~'lIrtained Total
Population baseb 5,786,740 3,738,860 1,385,453 1,691,065 56,057 12,658,176
Rape 37 163 135 13G. 0 82
Attempted rape 86 332 265 38c 205c 173
~Excludes rilpe and attempted rape victimization by nonstrangers and victimization of males. cEstimated number of females 12 years of age or older in the population in given marital status categories. I!iItima1e, based on about 50 or fewer sample cases, may be statistically unreliable.
8

l
...
TABLE 4 Estimated rates (per 100,000 females 12 years of age or older) of rape and attempted rape victimization, by major activity of victim, 26 cities aggregatea
Major activity of victim
TYPlJ of Under16 With job/ Looking Keeping In victimization years oldb Working not at work for work house School
Population basec 1,039,522 4,254,444 132,868 177,014 4,759,872 903,696
Rape 60d 86 150d 106d 71 148d
Attempted rape 214 203 303d 327d 123 319
aExcludes rape and attempted rape victimization by nonstrangers and victimization of males. b.fhe major activity of respondents under 16 years of age was not obtained in the survey interview. dEstimated number of females 12 years of age or older in the population, in given major activity categories.
Estimate, based on about 50 or fewer caS6S, may be statistically unreliable.
Unable to work Retired Other Total
366,184 690,392 243,640 11,528,110
109d Od 214d 82
103d Od 326d 173

The survey results of the major activity of rape victims are congruent with what the age and marital status rate data suggested. In addition to the findings that women who have a high risk of being victims of rape and attempted rape were young women and women who were single or divorced or separated, the survey results suggest that women with high rates of rape and attempted rape victimization were women whose major activities took them out of the home more often.
Income
Police departments gt.::nerally do not record the income or occupation of victims of crime. For this reason, research using police files has relied on
indicators such as race or neighborhood of re~idence to make inferences about the income or sociai class of rape victims (Amir, 1971).
Victimization survey interviewers record the total family income for each household interviewed, and thus permit an analysis of the income of rape victims. Because the income data obtained in the survey interview are total family income rather than income of individual household members, the income tables ill this report mayor may not reflect the personal income of the rape victim. However, in light of the number of victims who reported being unemployed, keeping house, or going to school, family income is probably a better indicator of the income of rape victims than would be their personal incomes.
The survey findings in Figure 3 indicate an inverse relationship between family income and rates of rape
FIGURE 3 Estimated rates (per 100,000 females 12 years of age or older) of rape and attempted rape victimization, by family income of victim, 26 cities aggregate8
Rate:
400
300
200
100
0'---------' Income; Less than
$3,000
Population base:c 1,392,599
$3,000" 7,499
3,202,000
$7,500-9,999
1,294,688
146
$10,000. 14,999
2.591,053
$15,000· 24,999
1,993,089
~Excludes rape and attempted rape victimization by nonstrangers and victimization of males.
II Rape
D Attempted rape
130b
$25,000 Income not or more ascertained
752,452 1,432,180
Estimate, based on about 50 or fewer sample cases, may be statistically unroliable. CEstimated number of females 12 years of age or older in the population in given income categories.
10
'~'------------------------------------------~--~-~----------- - --~--

and attempted rape. Women with the highest risk of being victims of rape (rate of 172 per 100,000) have incomes of less than $3,000. The rate of rape for these women is 15.6 times the rate of women in the highest income category, $25,000 and over (11 per 100,000). The pattern of decreasing risk 'Nith increasing family income is similar in attempted rape. Again, women with incomes less than $3,000 have the highest rate of attempted rape (331 per 100,000). This rate is2.5 times the ra'~e of women with incomes $25,000 and over (130 per 100.000).
Thus, in the 26 cities surveyed, the women with the greatest chance of being victims of rape and attempted rape were women on the lower end of the socioeconomic scale, as measured by family income. In addition, the higher on the income scale a woman was, the lower her risk of being attacked. Because race is a correlate of income, the question of whether this inverse relationship remains when controlling for race is raised.
. Income and Race
When the rates of rape and attempted rape are considered separately for white women and for black and other minority women, the general pattern of decreasing risk of rape with increasing family income is altered. (See Figure 4.) The relationship between income and rates of rape and attempted rape for white women reflects the aggregate pattern noted above. The higher the woman's income, the lower her chances of being the victim of a rape or attempted rape attack. However, for black and other minority women, the relationship between income and rates of rape and attempted rape is not consistent with the general pattern.
As Figure 4 illustrates, the rate of rape for black and other minority women was about the same for those with incomes less than $7,500 and those with incomes between $7,500 and $14,999 (127 and 129 per 100,000 respectively); it then decreased to 22 ner
FIGURE 4
Rate:
Estimated rates (per 100,000 females 12 years of age or older) of rape and attempted rape victimization, by race and family income ·of victim, 26 cities aggregatea
400~-------------------------------------------
300·-----~·---
242
200~--------------~~
100 1------------
Income: White population base:c
Black/other population base: c
Less than $1,500 2,745,721
1,848,879
$7,500 to $14,999 2,782,300
1,103,440
White rape
~White ~ attempted rape
O Black/other rape
~ Black/other ~ attempted rape
$15,000 and over 2,225,307
520,324
~Excludes rape and attempted rape Victimization by nonstrangers and victimization of males. c Estimate, based on about 50 or fewer sample cases. may.be statistically unreliablp.. '
Estimated number of females 12 years of age or older in the population in aiven income and race cateaories.
It

100,000 for those with incomes of $15,000 and over. Among black and other minority women the rate of attempted rape decreased from 237 to 185 per 100,000 from the lowest to the highest income category. It 6hould be noted that the surprisingly high rate of attempted rape (185 per 100,000) found among minority women in the highest income category may be statistically unreliable beca use of the small number of sample cases and the small number of black and other minority women in the 26 cities with family incomes of $15,000 and over.
Summary: Victim Characteristics
The survey results from the 26 cities indicate that rates of rape and attempted rape victimization varied across categories of age, race, marital sta.tus, major activity, and incon'le. Rates of rape and attempted rape were higher for young women (compared with older women), black and other minority women (compared with white women), and women who were never married, divorced or separated (compared with those who were married or widowed). In addition, women whose major activities took them away from the bme tended to have higher rates of rape and attempted rape. Finally, the lower the family income of the woman, the greater her chances were of being the victim of a rape or attempted rape attack. In order to explore more fully the characteristics of victims of rape and attempted rape, the following section will look at age and race charcteristics of victims in conjunction with the same characteristics of their attackers.
Characteristics of the Victim in Relation to the Offender
In addition to the findings that women with certain characteristics (for example, those who are young or black) have higher risks of being victims of rape, the literature on rape suggests patterns in the relationship between these victim characteristics and characteristics of their offenders. Studies of rape that have used police data (see, for example, Amir, 1971) have brought attention to some relationships that can be examined wi th victimization survey data. F orinstance, if the vast majority of rape victims in the 26 cities were between the ages of 16 and 24, how old were their attackers? Are older and younger offenders equally likely to choose young victims? Are rape and attempted rape victims more likely to be attacked by an offender of their own race? These questions will be dealt with by considering
12
first, the relationship between the age ofthe victim and the perceived age of the offender, and second, the relationship between the race of the victim and the perceived race of the offender.
Age (if Victim by -Age of Offender
The literature on rape reveals that generally the crime is committed against young women by young men. A study of 646 victims and 1,292 offenders dra wn from police files in Philadelphia found that the majority of both victims and offenders came from the same age groups (ages 15 to 24), although the victims tended to be somewhat younger than their assailants (Amir, 1971:54).
Victimization survey inteviewers asked victims how old they thought the attacker was. Basing age divisions on those used in the survey instrument, the analysis here will consider two age groups of offenders: the younger offenders (those perceived to be under 21), and the older offenders (those perceived to be 21 or 0Ider).8
Lone Offenders
The data in Table 5 indicate that victims in all age categories who were attacked by lone offenders were most often attacked by offenders they perceived to be 21 or older: '86 percent of the rapes and 74 percent of the attempted rapes by lone offenders were committed by offenders in this older age category. These data suggest that the age of the lone offend~r may be related to whether or not the attack is a rape or an attempted rape. In attempted rape there were twice as many lone offenders under 21 as there were in completed rape (23 percent compared with 11 percent).
If attacks by lone offenders most often were committed by offenders perceived to be 21 or older, how old were the victims of lone offenders? More than half of the victims of lone offenders were between the ages of 20 and 34 (63 percent of rape and 53 percent of attempted rape victims). Approximately one-quarter were between 12 and 19 years old (26 percent of rape and 29 percent of attempted rape victims). Less than one-fifth of the victims of lone offenders were 35 or older (11 percent of rape and 18 percent of attempted rape victims).
BThe survey instrument uses the following categories forthe perceived age of offenders: under 1 2. 1 2 to 1 4, 1 5 to 1 7. 1 8 to 20. 21 or over. Because the number of offenders in the age categories under 21 are too small to permit separate analysis. these categories have been grouped together,

TABLE 5 Relationship between age of victim and perceived age of lone offender in rape and attempted rape victimization, 213 cities aggregatea
Ago of lone offender
Less than 21 years old Don"t Estimated number Age of victim 21 years old or older know of victimizatiorjs
Rape:
12-19 10%b 88% 2% (2,003) 23%c 27% 19% 26%
20-34 11% 86% 4% (4,749) 60% 62% 81% 63%
35 or older 17% 83% 0% (834)d 16% 11% 0% 11%
Estimated number 11% 86% 3% 100% of victimizations (857)d (6,519) (210)d (7,585)
Attempted rape:
12-19 27%b 71% 2% (4,949) 34%c 28% 20% 29%
20-34 17% 79% 3% (8,846) 39% 56% 56% 53%
35 or older 34% 62% 4% (3,041 ) 27% 15% 24% 18%
Estimated number 23% 74% 3% 100% of victimiZations (3,917) (12,410) (510)d (16,836)
~Excludes rape and attempted rape victimization by nonstran!1,<ars and victimization of males. Row percentage.
dColumn percentage. Estimate, based on about 50 or fewer sample cases, may be statistically unreliable.
Multiple Offenders
In Amir's (1971:202) Philadelphia study of rape using police files, it was found that in significant proportions the older the offender, the less likely he! was to participate in group rape. Victimization survey results are in agreement with what was found with the police data. In those rapes committed by more than one offender, both the victims and the offenders W(:re I
younger than they were in rapes committed by lone offenders, as shown by comparing the data in Table 5 with the data in Table 6.
Roughly ollle-quarter of the victims of lone offenders were between 12 and 19 years old, however, almost one-half (47 percent) ofthe victims of multiple offenders were in this age range. Similarly, in rapes and attempted rapes committed by more than one offender, the attackers were also younger. Forty-three percent of the to~al rape and attempted rape victimizations corrunitt1!d by mUltiple offenders involved offenders perceived to be under 21 years old. As noted
above, when lone offenders were involved, only 11 percent of the rapes and 23 percent of the attempted rapes were committed by offenders perceived by their victims to be under 21 years old.
Age of Victim
The relationship between the victim's age and the offender's age can be analyzed from the perspective of the offender's choice of victim. Previous analysis of victimizatkm survey data for total personal victimization showed that data for both lone and multiple offenders were consistent in suggesting that there is a tendency for offenders to have assaultive violence encounters (not involving theft) disproportionately with persons from their own age group; in victimizations involving theft, younger offenders are slightly more likely to victimize older persons; whereas older offenders only rarely victimize younger persons (Hindelang, 1976:174). On the basis of these previous
13

--------------------------------------------------------------~-------
TABLE 6 Relationship between age of victim and perceived ages of multiple offenders in rape and attempted rape victimization, 26 cities aggregate8
Ages of multiple offenders
Age of rape or Less than 21 years Don't Estimated number attempted rape victim 21 year.,> old or older know of victimizations
12-19 45%b 42% 12% (2,163) 49%c 49% 37% 47%
20-34 39% 41% 20% (2,120) 42% 47% 58% ' 46%
35 or older 60% 26% 14% (294)d 9% 4% 5% 6%
Estimated number 43% 41% 16% 100% of victimizations (1,985) (1,867) (725)d (4,577)
gExcludes rape and attempted rape victimization by non;;trangers and victimization of males. Row percentage.
dColumn percentage. Estimate, based on about 50 or fewer sample cases, may be statistically unreliable.
findings, it could be hypothesized that in rape and attempted rape victimization oldl!r offenders would be less likely than younger offenders to choose young victims.
Referring again to Table 5, the data indicate that in rape victimization lone offenders under 21 were slightly less likely to have raped a woman under 20 than were older offenders. Twenty-three percent of
\ the victims of young offenders were young, compared with 27 percent of the victims of older offenders. In attempted rape, younger lone offenders were slightly more likely to choose young victims. Thirty-four percent of the victims of younger lone offenders, compared with 28 percent of the victims of older lone offenders, were young.
The data in Table 6 indi.cate similar patterns when more than one offender is involved; although in rape and attempted rape attacks by more than one offender both the victims and the assailants were younger. Younger multiple offenders were as likely to choose young victims as older mUltiple offenders. For both the younger and the older multiple offenders, about onehalf of the victims were between the ages of 12 and 19 years old. Thus, the victimization survey results do not lend support to the hypothesis that in rape and attempted rape older offenders would be less likely than younger offenders to choose young victims. Older offenders were about as likely as younger offenders to choose young victims. This may be due to the difference between rape victimization and other assaultive violence. That is, because the violent crime
14
of rape has :t Bexual element, unlike other crimes of assaultive violence, it might be expected that young
I women would be the primary targets of rapists, regardless of the age of the attacker.
Race of Victim by Race of Offender
The literature on rape shows that, like violent crime in general, rape is a highly intra-racial event; that is, the victim and the attacker are generally of the same race. The studies that have used incidents drawn from police files generally agree with this, but disagree on the extent to which rape is intra-racial. For example, Amir (1971:44) reported that 93 percent of the rapes in Philadelphia were intra-racial, 3 percent involved a black offender and white victim, 4 percent involved a white offender and a black victim. On the other hand, MacDonald's (1971:51) study of 200 rapes in Denver suggested that rape was far less intra-racial, atleast for white victims. He reported that black offenders in Denver were more likely to attack white women than black women.
One possible explanation for this difference is that the task of estimating the extent of intra-racial rape from police data is confounded by police recording bias in these data. It has been suggested that blacks and other minority women encounter difficulties in reporting rape to the police because police do not accord them the same legal rights as the rest of society (MacKellar, 1975). It has also bt~en suggested
~

TABLE 7 Relationship between race of victim andpercaived raCe of lone offender in rape and attempted rape victimization, 26 cities aggregatea
Race of lone offender
Bleck/ Don't Estimated number R~ce of victim White other know of victimizations
Rape:
White 42%b 57% 1% (4,871 ) 90%c 52% 37% 63%
Black/other 8% 91% 2% (2,844) 10% 48% 63% 37%
Estimated number 29% 70% 1% 100% of victimizations (2,244) (5,331 ) (87)d (7,662)
Attempted rape:
White 54%b 41% 5% (10,229) 94%c 39% 95% 60%
Black/other 5% 95% 0% (6,714) 6% 61% 5% 40%
Estimated number 34% 63% 3% 100% of victimizations (5,721) (10,503) (519)d (16,744)
gExcludes rape and attempted rape victimization by nonstrllngers and victimization of males. Row percentage.
dColumn percentage. Estimate, based on about 50 or fewer sample cases, may be statistically unreliable.
that because of fear of disbelief black women hesitate to report to the police rape attacks by white men (Curtis, 1976).
Victimization survey data can be used to address the question of the extent to which rape is intra-racial. Rape victims were asked about the race of their attackers. Victimization surveys are not hindered by police recording bias; however, the extent to which black and other minority women are more reluctant in survey interviews to report inter-racial rapes than they are to report intra-racial rapes remains an open question.
The survey data indicate that although rape was more often an intra-racial incident, there were important exceptions to this pattern. Generally, rape and attempted rape attacks committed by lone offenders were more often intra-racial than those attacks committed by more than one offender. Rape and attempted rape victimizations were also more frequently intra-racial for black and other minority victims than for white victims.
Rape and attempted rape victimizations by lone ,and mUltiple offenders were overwhelmingly intra-
racial for blacks and other minority victims. The data in Table 7 show the relationship between the race of lone offenders and the race of victims. As shown by the data in this table, when a lone offender was involved, 91 percent of the rapes and 95 percent of the attempted rapes against minority race women were committed by minority offenders.
The comparable figures for rapes and attempted rapes committed by mow than one offender (given in Table 8) are 90 percent and 71 percent. Thus, the survey data indicate that very low proportions of minority women were victims of white attackers. t<'or white victims, rape and attempted rape were considerably less intra-racial. As the data in Table 7 indicate, when a lone offender was involved, only 42 percent of rapes and 54 percent of attempted rapes against white victims were committed by white offenders. When more than one offender was involved (see Table 8), only 30 percent of the rapes and 48 percent of the attempted rapes involving whit~ victims were intra-racial. The survey, data show that although the vast majority of black artd other minority women were attacked by members of their own race, white
15

TABLE 8 Relationship between age of victim and perceived races of multiple of-fenders in rape and attempted rape victimization, 26 cities aggregatea ,
Races of mUltiple offenders
Mixed Estimated number Race of victim White Black/other racial groups Don't know of victimizations
Rape:
White 30%b 48% 22% 0% (950)d 100%c 25% . 87% 0% 38%
Black/other 0% 90% 2% 8% (1,528)d 0% 75% 13% 100% 62%
Estimated number 12% 74% 10% 5% 100% of victimizations (290)d (1,823) (238)d (127)d (12,478)
Attempted rape:
White 48%b 40% 13% 0% (3,260) 94%c 60% 74% 0% 72%
Black/other 9% 71% 12% 8% (1,240)d 6% 40% 26% 100% 28%
Estimated number 37% 48% 12% 2% 100% of victimizations (1,658) (2,179) (560)d (140)d (4,501 )
~Excludes rape and attempted rape victimization by nonstrangers and victimization of males. Row percentage.
dColumn percentage. Estimate, based on about 50 or fewer sample cases, may be statistically unreliable.
women were attacked by black and other minority offenders about as often as they were by white offenders.
It should be noted (from Table 8) that 10 percent of the rape and 12 percent of the attempted rape victimizations were committed by mixed racial groups. ,White women were victims of mixed racial groups more often than were black and other minority women.
Race of Victim
The relationship between the victim's race and the offender's race can also be analyzed from the perspective of the offender and his choice of victim. Generally, both white and minority offenders were more likely to choose as victims women of their own race. White offenders chose white victims the vast majority of the time; however, minority offenders were somewhat less intra-racial in their choice of victims.
The data in Table 7 indicate that when white lone 'offenders were involved in rape or attempted rape, 9
16
out of 10 victims were also white. The women chosen by black and other minority offenders were not as lihly to be of the same race as their attacker. Of the minority lone offenders, those who committed attempted rape attacks chose minority victims roughly three out of five times. However, in the completed rape attacks by minority lone offenders, the victim was about as likely to be a white woman as she was to bea minority woman.
As shown by the data in Table 8, in rapes committed by more than one offender, the pattern of victim choice was more complex. Again, groups containing only white offenders overwhelmingly chose white women as victims; all of the rapes involved white women', as did 9 out of 10 ofthe attempted rapes. For black and other minority offenders who committed rape in groups, three out of four victims of rape were minority women. However, in attempted rapes by minority multiple offenders, the victim was ofthe same race in only two out of five victimizations. The vi(,tim was white in 87 percent of the rape and 74 percent of the attempted rape victimizations by mixed racial groups.
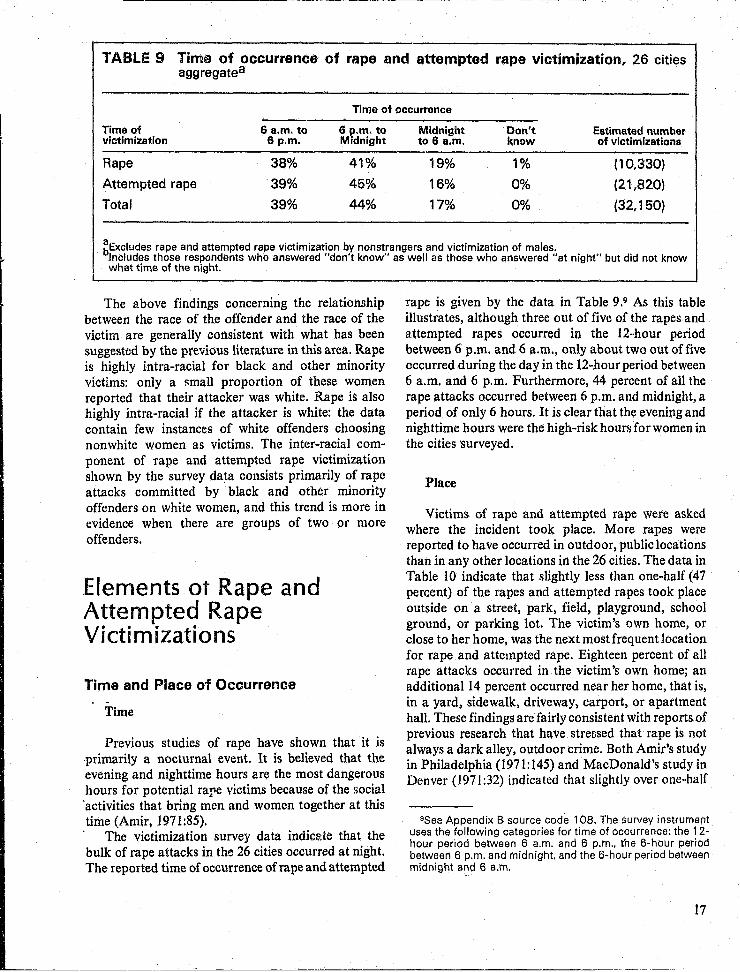
TABLE 9 Tima of occurrence of rape and attempted rape victimization. 26 cities aggregatea
Time of occurronce
Time of 6 a.m. to 6 p.m. to Midnight Don't Estimated number victimization Sp.m. Midnight to 6 a.m. know of victimizations
Rape 38% 41% 19% 1% (10,330)
Attempted rape 39% 45% 16% 0% (2',820)
Total 39% 44% 17% 0% (32,150)
~Excludes rape and attempted rape victimization by nonstrangers and victimization of males. Includes those respondents who answered "don't know" as well as those who answered "at night" but did not know what time of the night.
The above findings concerning the relationship between the race of the offender and the race of the victim are generally consistent with what has been suggested by the previous literature in this area. Rape is highly intra-racial for black and other minority victims: only a llmall proportion of these women reported that their attacker was white. Rape is also highly intra-racial if the attacker is white: the data contain few instances of white offenders choosing nonwhite women as victims. The inter-racial component of rape and attempted rape victimization shown by the survey data consists primarily of rape attacks committed by black and other minority offenders on white women, and this trend is more in evidence when there are groups of two or more offenders.
Elements ot Rape and Attempted Rape Victi ITt izations
Time and Place of Occurrence -Time
Previous studies of rape have shown that it is 'primarily a nocturnal event. It is believed that the evening and nighttime hours are the most dangerous hours for potential rape victims because of the social 'activities that bring men and women together at this time (Amir, 1971:85).
The victimization survey data indicate that the bulk of rape attacks in the 26 cities occurred at night. The reported time of occurrence of rape and attempted
rape is given by the data in Table 9.9 As this table illustrates, although three out of five of the rapes and attempted rapes occurred in the 12-hour period between 6 p.m. and 6 a.m., only about two out offive occurred during the day in the 12-hourperiod between 6 a.m. and 6 p.m. Furthermore, 44 percent of all the rape attacks occurred between 6 p.m. and midnight, a period of only 6 hours. It is clear that the evening and nighttime hours were the high-risk hours for women in the cities 'surveyed.
Place
Victims of rape and attempted rape were asked where the incident took place. More rapes were reported to have occurred in outdoor, public locations than in any other locations in the 26 cities. The data in Table 10 indicate that slightly less than one-half (47 . percent) of the rapes and attempted rapes took place outside on a street, park, field, playground, school ground, or parking lot. The victim's own home, or close to her home, was the next most frequent location for rape and attempted rape. Eighteen percent of all rape attacks occurred in the victim's own home; an additional 14 percent occurred near her home, that is, in a yard, sidewalk, driveway, carport, or apartment hall. These findings are fairly consistent with reports. of previous research that have streosed that rape is not always a dark alley, outdoor crime. Both Amir's study in Philadelphia (1971:145) and MacDonald's study in Denver (1971:32) indicated that slightly over onewhalf
9Sea Appendix B source code 108. The survey instrument uses the following categories for time of occurrenoe: the 12-hour period between 6 a.m. and 6 p.m .• the 6-hour period between 6 p.m. and midnight. and the 6-hour period between midnight and 6 a.m.
17

r-----------------'------------------------------------------------------------------~-----------I
of the rapes took place in either the victim's residence or the offender's residence.
Although the victimization survey results on rape and attempted rape show that these attacks occurred more often in outdoor locations than in the victim's home, there is an indication that the attacks that occurred in the victim's home were more serious, that is, more of them were completed. When the completion ratio is used to compare the proportion of rapes with the proportion of attempted rapes in the two locations (victim's home versus outdoor location), the data indicate that the completion ratio is 1.53 when, the victimization occurs in the victim's own home, compared with .80 when it occurs outdoors in a public location. Thus, although proportionately fewer rape and attempted rape victimizations occurred in the woman's home, the relative proportion of completed rape attacks in this location is substantially greater. The high completion ratio for rape attacks that occur inside the victim's home may be due to less chance for observation or interruption, or less chance for someone to hear screams. It may also be due in part to the high percentage of weapon use in these victimizations. This will be discussed later in this report (see page 20).
Number of Offenders and i\iumber of Victims
Official police statistics, such as those published by the FBI, do not classify separately rapes that involve more than one offender. Amir's (1971:200) study in Philadelphia using police case files of victim's complaints indicated almost one-half of the cases involved more than one offender. Of 646 victims of forcible rape, 57 percent were victims of single offenders, 16 percent were victims of pairs of offenders, and 27 percent were victims of three or more offenders.
The perceived number of offenders in r,,\pe and attempted rape victimization is given by the data in Table 11. Compared with Amir's study in Philadelphia, the victimization survey results in this table show a higher proportion of rape and attempted rape attacks that involved single offenders. Approximately thre(~-fourths of the attacks (74 percent of rapes and 77 perc\~nt of attempted rapes) involved one offender.
Much of the literature on rape describes rape committed by more than one offender as a more frightening, traumatic experience for women than rape committed by single offenders. This, together with the suggestion that the woman experiences greater powerlessness when more than one offender is
18
involved, leads to the hypothesis that in attacks by groups of two or more offenders there would be a relatively higher proportion of completed rapes than in attacks by single offenders. The data lend some support to this hypothesis. Compietion ratios calculated from the column proportions in Table 11 (see footnote 5) reveal that the relative proportion of completed rape attacks committed by multiple offenders was slightly greater than the relative proportion of completed rape attacks by lone offenders (.52 compared with .45).
The survey data in Table II also show that the vast majority of rape attacks involved one victim. In 9 out of 10 of the rapes and attempted rapes, only one victim was attacked. Seven percent of the total rape attacks involved two victims, and 2 percent involved more than two victims.
Thus, the victimization survey data show that most rape and attempted rapes involve only two participants: the victim and the offender. Incidents that involved more than two participants more often involved multiple offenders than mUltiple victims. This is not surprising. Although previous studies of rape have suggested that rape committed by more than one offender is relatively common within certain cultural and age groups, the evidence indicates that rape attacks involving more than one victim are rare.
Weapons
The means used by the rapist to accomplish his end may vary from nonphysical force in the form of threats to intimidation with a weapon to brutal beatings. Police files that contain the victim's account of the incident can include detailed information on the use of physical or nonphysical force in rapes (Amir, 1971).
It is not feasible in the victimization survey to collect certain information about rape and attempted rape victimizations. For example, it is unlikely that a victim survey could obtain details on the violent encounter of the victim and her attacker or on the modus operandi of the offender. They do, however, collect information on weapon use by the rapist. In the 26 cities, survey interviewers asked victims whether or not the offender had a weapon (either a gun or a knife) or something he was using as a weapon (for example, a bottle or wrench).
The data suggest three general characteristics of weapon use in rape and attempted rape victimization. First, the likelihood of completing the rape attack was greater if the attacker was armed. Second, in terms of both the proportion of victimizations in which

TABLE 10 Place of occurrence of rape and attempted rape victimization, 26 cities aggregatea
Place of occurrence
Type of On street, in park, At or in Near Inside Inside victimization playground, etc. b own home home commercial buildingC office, factory
Rape 40% 23% 15% 3%
Attempted rape 50% 15% 14% 12%
Total 47% '18% 14% 9%
gExcludes rape and attempted rape victimization by nonstrangers and victimization of males. clncludes on the street, in a park, field, playground, school grounds or parking lot. Includes inside commercial building such as a store, restaurant, bank, gas station.
0%
1%
1%
Vacation home, hotel or motel School
2% 1%
0% 2%
1% 1%
Other Estimated number place of victimizations
16% (10,299)
6% (21,835)
9% (32,145)
TABLE 11 Perceived number of offenders and number of victims in rape and attempted rape victimization, 26 cities aggregatea
Perceived number of offenders
Type of More Don't Estimated number victimization One than one know of victimizations '
Rape 74%b 24% 2% (10,330) 31%c 34% 48% 32%
Attempted rape 77% 22% 1% (21,850) 69% 66% 52% 68%
Estimated number 76% 23% 1% 100% of victimizations (24,560) (7,287) (223)d (32,180)
gExcludes rape and attempted rape victimization by nonstrangers and victimization of males. Row percentage. ~Column percentage.
Estimate, b/,sed on about 50 or fewer sample cases, may be statistically unreliable.
i
Number of victims
Three Estimated number One Two or more of victimizations
90%b 7% 3% (10,330) 32%c 31% 37% 32%
91% 7% 2% (21,850) 68% 69% 63% 68%
91% 7% 2% 100% (29,146) (2,292) (742)d (32,180)
, '
'-. .~
. ________________ ~JL1 ________________________________________________________________________________________________________ ~

TABLE 12 Estimated percentages of weapon use in rape and attempted rape victimization, 26 cities aggregatea
Weapon use
Don't Estimated number Type of victimization Yes No know of victimizations
Rape 67%b 22% 11% (10,330) 53% 15% 27% 32%
Attempted rape 28% 58% 15% (21,850) 47% 85% 73% 68%
Estimated number 40% 46% 14% 100% of victimizations (12,967) (14,851) (4,362) (32,180)
gExcludes rape and attempted rape victimization by nonstrangers and victimization of males. Row percentage.
cColumn percentage.
weapons were used and the type of weapon used (gun, knife, or other), rape was more serious than attempted rape. Third, rapists used knives more often than any other weapon.
Weapon use in rape and attempted rape victimization is given by the data in Table 12. These data show that the offender used a weapon in approximately two out of five of the total rape and attempted rape victimizations. When the column proportions in Table 12 are used to obtain completion ratios, the data illustrate the first general characteristic of weapon use noted above. If the attacker had a weapon, the rape attack was more likely to be completed than attempted (ratio of 1.17). When there was no weapon invalved, the rape attack was much less likely to be completed (ratio of .18). Thus, the data suggest that in terms of the relative proportion of rape attacks that are completed, victimizations are more s~rious when the rapist is armed.
Victims of rape were confronted by armed attackers much more often than were victims of attempted rape. Two-thirds of the rape victims reported that the offender had a weapon. The proportionate amount of weapon use in attempted rape was considerably less: only about one-quarter of the attempted rapes involved weapons.
The third general characteristic of weapon use in rape and attempted rape victimization is that when the rapist was armed, the weapon most often used in both rape and attempted rape was a knife. The data in Table' 13 indicate that knives were used in rape and attempted rape twice as often as guns (60 percent compared with 30 percent). Weapons other than guns or knives were used in only 13 percent of all the instances that involved weapons.
20
If the probability of the rape attack being completed is related to whether or not the offender is armed, it might also be related to the type of weapon used. The types of weapons used (gun, knife, and other) can be compared on the basis of the relative proportions of rape and attempted rape when they were used. Completion ratios calculated from the data in Table 13 indicate that rape attacks have the greatest relative probability of being completed when the weapon is a gun (ratio of 2.00). By contrast, when the offender used a knife or other weapon, the completion ratios dropped to 1.06 and .92, respectively. Thus, the relative proportion of completed rape attacks is much greater when the offender used a gun than when he used a knife or other weapon.
Weapon Use by Place of Occurrence
Previous research has shown that the means used by the rapist may be related to where the incident takes place. The results of Amir's (1971:48) Philadelphia study indicate a significant association between the place of the rape and the use of force: physical force was used much more often in rapes that occurred indoors, inside the participant's residence, compared with those that occurred in outdoor, public locations.
Earlier in this report it was noted that there was a higher completion ratio for rapes that occurred in the home. The data from the 26 cities indicate that rape victims were more likely to face an armed attacker if the incident o~curred in or near their own home than if it occurred in an open, public location. It can be seen in Table 14 that 87 percent ofthe rapes that occurred near the victim's home and 80 p.ercent of those that occurred

TABLE 13 Type of weapon used in rape and attempted rape victimization, 26 cities aggregatea
Type of weapon usedb
Type of Estimated number victimization Gun Knife Other of victimizations
Rape 37%~ 57% 12% (6,936) 67% 52% 48% 53%
Attempted rape 21% 62% 15% (6,031) 33% 48% 52% 47%
Estimated number 30% 60% 13% 100% of victimizations (3,864) (1,735) (1,722) (12,967)
aExcludes rape and attempted rape victimization by nonstrangers and victimization of males. Excludes non-weapon victimizations and those in which the victim didn't know if the offender had a weapon.
bSUbcategories may total over 100 percent because the offender may have used more than one type of weapon. ~Row percentage.
Column percentage.
TABLE 14 Estimated percentages of weapon use by place 01 occurrence in rape and attempted rape victimization, 26 cities aggregatea
Placo of occurrence
On street. in park. At or in Near Weapon usage playground. etc.b own home hOJllB Otherc
Weapons in rape:
Yes 64% 80% 87% 47%
No 22% 11% 9% 40%
Don't know 14% 9% 4% 13%
Estimated number (1,538)d of victimizations (4,170) (2,373) (2,217)
Weapons in attempted rape:
Yes 26% 33% 43% 18%
No 57% 56% 52% 64%
Don't know 17% 11% 5% 18%
Estimated number of victimizations (11.028) (3,348) (2,938) (4,522)
gExcludes rape .afld attempted rape victimization by nonstrangers and victimization of males. Includas en the street, in a park, field, playground. school grounds or parking lot,
clncludes inside commercial building. inside office or factory, vacation home or hotel/motel. school and "other" dPlaces. .
Estimate, based on about 50 or fewer sample cases, may be statistically unreliable.
21

in the victim's home, involved weapon use. By contrast, 64 percent of the rapes that occurred in an open area outdoors, an area such as a street or park, involved weapon use. The same pattern holds in attempted rape victimizations, although the proportion of incidents involving weapons is substantially smaller. In 43 percent of the attempted rapes that occurred near the victim's home and in 33 percent of those that occurred in the victim's home, the offender used a weapon; whereas in attempted rape in an outdoor location, weapons were used in only 26 percent of the victimizations.
The survey data show that weapon use in rape and attempted rape victimization is related to where the incident took place. Both rape and attempted rape victims were more likely to confront an armed assailant if the attack took place in or neal' their homes than if it occurred in an outdoor location.
Weapon Use by Race of Victim
When weapon use in rape and attempted rape victimization is examined in light of the race of the victim, some interesting patterns emerge. There were differences between white and minority victims in the frequency of weapon use in attempted rape but not in rape. There were also differences in the type of weapon used against white victims and minority victims.
Table 15 shows the frequency of weapon use and the type of w~apon used in attempted rape and rape involving white and minority victims. These data show th~t the offender used a weapon in approximately two-thirds of the rape attacks that were completed, and there was only a small difference between white and black and other minority victims in the proportion of the rapes in which the attacker was armed. However, the pattern of weapon use in attempted rape was not similar to the pattern of weapon use in rape. A greater proportion of minority victims were involved in attempted! rapes il: which the attacker was armed. Forty pen;ent of the black and other minority victims of attempted rape, compared with 10 percent of the white victims, were involved in incidents in which the attacker was armed. This is consisl;ent with the finding of Amir (1971:154) in Philadelphia that intimidation with a weapon was found more often when the offender and victim were black than when they were white.
Because the data indicate a higher proportion of weapon use in attempted rape for minority victims, it would 8ppear that in terms of weapon USe, attempted
rape victimizations were more serious for black and other minority victims than they were for white victims. However, when completion ratios are calculated from the proportions of rape and attempted rape victimizations when the offender is armed, the data can be given a different interpretation. When the offender is armed, the completion ratio is 1.50 for white victims, compared with .86 for black and other minority victims. Thus, because black and other minority victims were involved in a higher proportion of attempted rape attacks by an armed assailant, the completion ratio for minority victims is not as high as it is for white victims.
As shown by the data in Table IS, when the rapist did have a weapon, there were differences in the type of weapon used against white and against black and other minority victims. For white victims, the weapon most frequently encountered was a knife, which the offender used in 7 out of 10 of the rapes and in half of the attempted rapes. For minority viCtims, if the offender had a weapon, it was a knife in three out of four attempted rapes; however, it was a gun in three out of five completed rapes.
Weapon Use by Age of Victim
The survey data in Table 16 point to a direct relationship between the age of the victim and the frequency of weapon use in rape and attempted rape victimizations. As the age category of the victim increases, the relative proportion of cases in which the offender uses a weapon increases. This pattern is more dramatic in rape than in attempted rape victimization. In rape, the percent of victimizations in which the attacker was armed increases from 57 percent for victims 12 to 19 years old to 69 percent for victims 20 to 34 years old to 82 percent for victims 35 and older. In attempted rape the comparable figures are 24 percent, 27 percent, and 35 percent.
One possible explanation for the direct relationship between the offender's weapon use and the age of the victim is that (with the exception of elderly women) as women get older they may more actively resist the attacker; they may be more willing and more able to fight back, or cry for help, or try to argue with him. This would mean that a rape attack on an older woman requires more force or intimidation by an offender than an attack on a younger woman. The question of whether the amount of resistance by the victim is related to her age will be addressed in a subsequent section of this report (see page 33).

TABLE 15 Estimated percentages of weapon use and type of weapon used in rape and attempted rape victimization. by race of victim, 26 cities aggregatea
Weapon usage Type of weaponb
Don't Estimated number Estimated number Race of victim Yes No know of victimizations Gun Knife Other of victimizations
Rape:
White 69% 23% 7% (5,831 ) 22% 71% 11% (4,041 )
Black/other 64% 19% 16% (4,499) 58% 39% 14% (2,895)
Attempted rape:
White 20% 67% 13% (13,522) 27% 48% 20% (2,688)
Black/other 40% 43% 17% (8,328) 17% 74% 10% (3,344)
gExcludes rape and attempted rape victimization by nonstrangers and victimization of males. . Subcategories may total over 100 percent because the offender may have used more than one type of weapon.
TABLE 16 Estimated percentages of weapon use and type of weapon used in rape and attempted rape victimization. by age of victim, 26 cities aggregatea
Weapon usage Type of weaponb
Estimated number Don't Estimated number Age of victim Yes No know of victimizaticms Gun Knife Other of victimizations
Rape:
12-19 57% 36% 7% (3,198) 37% 54% 12% (1,836)
20-34 69% 18% 13% (5,846) 40% 57% 8% (4,041 ) 35 or older 82% 4% 14% (1,286)c 24% 65% 26% (1,059)c
Attempted rape:
12-19 24% 64% 12% (6,757) 12% 65% 22% (1,641 )
20-34 27% 57% 15% (11,560) 26% 64% 10% (3,167)
35 or older 35% 48% 17% (3,532) 21% 59% 18% (1,224)c
aExcludes rape and attempted rape victimization by nonstrangers and victimization of males. ~Subcategories may total over 100 percent because the offender may have used more than one type of weapon.
Estimate, based on about 50 or fewer sample cases, may be statistically unreliable.
Weapon Use by Race of Offlll1der There were also differences, by age of victim, in the type of weapon that was used in rape and attempted rape. As can be seen from the data in Table 16, knives were used in 54 pel'cent of the rapes against 12 to 19 year old victims, but in 65 percent Qf those against victims 35 years old or older. Other weapons were used against rape victims 35 years old or older more often than they were used against victims in the two younger age categories.
Because black and other minority victims were more often victims of armed attackers than were white victims and because rape and attempted rape are generally intra-racial, it would be expected that black and other minority offenders would be more likely to use weapons than would be white offenders. This expectation is confirmed by the data in Table 17
23

TABLE 17 Estimated percentages of weapon use in rape and attempted rape victimization, by perceived race of lone and mUltiple offender(s), 26 cities aggregatea
Weapon usage
Don't Estimated number Race of offender(s) Yes No know of victimizations
Lone offender:
Rape:
White 61% 32% 7% (2,244)
Black/other 73% 16% 10% (5,331 )
Don't know 17% 18% 64% (87)b
Attempted rape:
White 10% 78% 11% (5,721 )
Black/other 38% 49% 14% (10,503)
Don't know 20% 66% 14% (519)b
Multiple offenders:
Rape:
White 45% 55% 0% (290)b
Black/other 68% 20% 13% (1,823)
Mixed racial groups 77% 10% 13% (238)b
Don't know 83% 17% 0% (127)b
Attempted rape:
White 21% 41% 27% (1,658)
Black/other 36% 48% 16% (2,179)
Mixed racial groups 8% '79% 12% (560)b
Don't know 0% 0% 100% (104)b
bExcludes rape and attempted rape victimization by nonstrangers and victimization of males. E;stimate, based on about 50 or fewer sample cases, may be statistically unreliable.
showing the relationship between weapon use and the race of the offender.
In rape by lone offenders, 73 percent of the victimizations by black and other minority offenders compared with 61 percent of those by white offenders involved weapon use. In attempted rape by lone offenders, 38 percent of the victimizations by minority offenders compared with 10 percent of those by white offenders involved weapons.
Similal'1y, in the attacks by more than one offender minority groups were more likely to use weapons than were white groups. However, the difference is only substantial in rape; 68 percent of the rapes by black and other' minority offenders, compared with 45
24
percent of the rapes by white offenders, involved weapons.
Thus, black and other minority offenders, both those who acted alone and those who acted in groups, were more likely to use weapons in rape and attempted rape victimizations than were white offenders.
WeapOh Use by Age of Offender
The use of weapons in rape attacks can be examined in light of the age of the offender in order to see if there are any differences between the frequency of weapon use by younger and by older offenders. The

data in Table 18 show the relationship between weapon use and the age oflone and multiple offenders. The data indicate that there were differences, in the frequency of weapon use, by age of offendet'; howe-ver, this is the case only when mUltiple offenders were involved. When multiple offenders were involved in rape and attempted rape victimization, the older offenders used weapons roughly twice as often as the younger ones (55 percent compared with 28 percent). However, in the rape and attempted rape victimizations committed by lone offenders, weapons were used by the younger of.fenders about as often as they were by the older offenders (in two out offive victimizations).
Thus, the extent to which weapons were involved in rape and attempted rape victimizations did not vary consistently with the age of the offender. When lone offenders were involved, yocnger offenders used weapons as often as older offenders. However, when more than one offender was involved, the older offenders were more likely to use weapons than were the younger offenders.
Weapons: Summary
Some general summary statements can be made about weapon use in rape and attempted rape victimization in the 26 cities. First, weapon use appeared to be an effective means of subduing victims: the likelihood of completing the attack was greater if the rapist was armed. Second, in terms of both the extent of weapon use and the type of weapon used, rape attacks that were completed were more serious than attempted rapes. Third, knives were the most common weapons used in these victimizations.
In addition, the extent of weapon use in rape and attempted rape was found to be related to where the incident took place and to victim and offender characteristics. Victims of rape and attempted rape were more likely to be attacked by an armed assailant if the incident occurred in or near their own homes than if it occurred in a location such as a street or park. Black and other minority victims of attempted rape were more likely to face armed attackers than were
, white victims; because of this pattern, armed attacks had a higher completion ratio when they involved white victims. Weapon use in rape and attempted rape had a direct relationship with the victim's age: as the age category of the victims increased the relative proportion of victimizations that involved weapons increased,. Finally, although weapon use was found to be related to the race of the offender (black and other minority offenders were more likely to use weapons than were white), weapon use was related to the age
,of the offender only when two or more offenders were involved (older groups of offenders used weapons, twice as often as younger groups).
Theft and Attempted Theft
The information obtained in the victimization survey interview made it possible to determine whether theft or attempted theft was an element in the rape incident. However, it is not possible with the survey data to conclude whether theft or rape was the primary aim of the offender.
A very small proportion of the reported rape and attempted rape victimization involved theft or attempted theft. Only 16 percent of the total rape and attempted rape victims reported that the attacker stole something; an additional 4 percent reported that he tried to steal something. The amount of theft and attempted theft varied with whether or not the offense was a rape or an attempted rape, and also with the age and race characteristics of the victim.
Although only 16 percent of the total rapes and atteiJluted rapes involved theft, there was a substal'ltial differ~nce between the proportion of rapes involving theft and att/empted rapes involving theft. Figure 5 shows the proportions of theft, attempted theft, and theft of cash only in rape and attempted rape victimization. It can be seen that theft was an element in 32 percent of the rapes, compared with 9 percent of the attempted rapes. This suggests that perhaps it is easier for the offender to steal something when the rape is completed and the victim is less capable of offering resistance. The reasons rape attacks are not completed-reasons such as effective resistance, fighting or flight-may also be the reasons for the smaller proportion of thefts in attempted rape.
Figure 5 also shows that when something was stolen from the victim of a rape or an attempted rape, it was most often cash only. Almost 6 out of 10 victims of rape Rnd 7 out of 10 victims of attempted rape who reported theft reported that cash only was stolen.
Theft and Victim Characteristics
Theft in rape and attempted rape victimizations in the 26 cities varied to some extent with age, race, and income characteristics of the victims. The data in Table 19 show the relationship between theft and the age of rape and attempted rape victims. As t~e data in this table indicate, in !>uccessivel.y older victim age categories the proportion of rapes involving theft grows. Theft was an element of rape for 17 percent of the victims between the ages of 12 and 19, for 32 percent of the victims between the e,ges of 20 and 34,
25
~--~ ~-~-~--~-~---~-~-

TABLE 1 a Estimated percentages of weapon use by perceived age of lone and multiple offender(s) in rape and attempted rape victimization, 26 cities aggregcifea
Age of lone offender Ages at multiple offenders
Weapon use in rape Less than 21 years old Don't Less than 21 years old Don't and attempted rape 21 years old or older know Total 21 years old or older know Total
Yes 42% 40% 32% 40% 28% 55% 61% 44%
No 50% 48% 34% 48% 57% 34% 22% 42%
Don't know 8% 12% 33% 12% 15% 11% 17% 14%
Estimated number (720)b (725)b of victimizations (4,774) (18,929) (24,421 ) (1,985) (1,866) (4,577)
gExcludes rape and attempted rape victimization by nonstrangers and victimizations of males. Estimate, based on about 50 or fewer sample cases, may be statistically unreliable.

FIGURE 5 Estimated percentages of theft, attempted theft, and cash only theft in rape and attempted rape victimization, 26 cities aggregatea
~ No theft ~ No attempted
theft 68% ~ 95%
Rape (7,036) (6,661 ) (10,330)b I--
Attempted theft I I
5,% (376)
Theft ~rl Cash only theft I ~ 32% 58% (1,899)
(3,294)
4-j Other theft 42% (1,395)
r-I""
r-+ I--"
Attempted No theft No attempted rape 91% theft
(21,850) (19,920) 96%
I--(19,089)
Attempted theft
L-- 4% (831 )
Theft r-.-[ Cash only theft I 9% (1,930) 68% (1,314)
Other theft ~ I
32% (616)
bExcludes rape and attempted rape victimization by nonstrangers and victimization of males. Estimated number of victimizations.
27
I

\\
TABLE 19 Estimated percentages of theft in rape and attempted rape victimization, by age of victim, 26 cities aggregatea
Theft
Estimated number Age of victim Something stolen Nothing stolen of victimizations
Rape:
12-19 17% 83% (3,198)
20-34 32% 68% (5,846)
35 or older 66% 34% (1,286)b
Attempted rape;
12-19 6% 94% (6,757)
20-34 8% 92% (11,560)
35 or older 18% 82% (3,532)
~Excludes rape and attempted rape victimization by nonstrangers and victimization of males. Estimate, based on about 50 or fevyer sample cases, may he statistically unreliable.
TABLE 20 Estimated percentages of theft in rape and attempted rape victimization, by race of victim, 26 cities aggregatea
Theft
Estimll!ted number Race of victim Something stolen Nothing stolen of victimizations
Rape:
White 30% 70% (5,831)
Black/other 35% 65% (4,499)
Attempted rape;
White 6% 94% (13,522)
Black/other 13% 87% (8,328)
aExciudes rape and attempted rape victimization by nonstrangers and victimization of males.
and for 66 percent of the victims 35 or older. Similarly, although the frequency of theft in attempted rape was considerably lower than it was in completed rape, the theft occurred primarily in attempts on older victims, that is, victims 35 or older.
The amount of theft in rape and attempted rape victimizations varied to some extent with the race of the victim. As the datil! :in Table 20 show, theft was an element in rape and attempted rape slightly more often if the victim was a black or other minority member than if she was a white woman. In completed rape 35 percent of the minority victims compared with 30 percent of the white victims, reported that something
28
was stolen. The difference is slightly greater in attempted rape: 13 percent of the black and other minority victims, compared with 6 percent of the white victims, reported theft.
If theft in rape victimizations is at alll'elated either to the actual amount of money the victim has with her at the time of the incident or to the offender's perception of her wealth, it could be hypothesized that theft in rape would increase as the victim"s income increased. The data give partial support to this hypothesis. The data in Table 21' indicate that the proportion of rapes in which something was stolen increases from roughly 2 out of 10 victims with an

~
TABLE 21 Estimated percentages of theft in rape and attempted rape victimization, by family income of victim, 26 cities aggregatea
Theft
Estimated number Family incomo of victim Something stolen Nothing stolon of victimizations
Rape:
Less than $3,000 21% 79% (2,391 )
$3,000-$7,499 29% 71% (3,252)
$7,500-$9,999 32% 68% (1,426)b
$10,000 and over 43% 57% (1,899)
Not ascertained 41% 59% (1,362)b
Attempted rape:
Less than $3,000 13% 87% (4,611 )
$3,000-$7,499 11% 89% (6,439)
$7,499-$9,999 12% 88% (1,930)
$10,000 and over 4% 96% (7,337)
Not ascertained 10% 90% (1,533)b
gExcludes rape and attempted rape victimization by nonstran"ers and victimization of males. Estimate, based on about 50 or fewer sample cases, may be statistically unreliable.
income of less than $3,000 to a little over 4 out of 10 of the victims with incomes of$1O,OOO and more. There is little variation in the amount of theft in attempted. rape; however, the data show it is slightly higher for victims with incomes less thim $10,000 than for victims with incomes greater than $10,000.
Theft: Summall'Y
Only a small proportion of mpe and attempted rape victimi7ations in the 26 cities involved theft. This· suggests that the majority of these attacks were essentially violent sexual assaults. The survey data indicate some general characteristics of those attacks that did involve an element of theft. First, theft is much more likely to occur when the rape attack is completed than when it is attempted. This may be because the relatively greater incapacitation of victims of completed rape attacks makes them easier targets for theft. By somehow thwarting or escaping the rape, the victim may be also preventing theft.
Second, although whether or not something is stolen in the course of the incident appears to be related only slightly to race and moderately to income characteristics of victims, it is highly related to their
age. As rape victims get older, the proportion of rapes involving theft increases dramatically. One possible explanation for the strong relationship between theft and the age of the rape victim is that theft may be an important motivational factor in rape attacks against older victims, whereas the act of rape itself may be more central when the victim is young. In addition, older victims may be perceived to be more likely to have something of value to steal.
Consequences of Rape and Attempted Rape Victimizations
$elf-protective measures
Previous studies of rape suggest that the behavior of the victim during a rape attack may influence the outcome of the attack. The actions she takes influence decisions the rapist must make, decisions such as whether or not he should try to complete the act and if SQ, what amount of force is necessary to subdue her.
29

Whether the woman submits to the rapist, or resists or , fights him, can be a crucial factor both in whether or not the rape is completed and in the amount ofinjury the victim suffers.
The behavior of the victim is also of legal significance. N onconsent is an essential element in the crime of forcible rape. Statutes usually define forcible rape with phrases such as "against her will" or "by force." Because of statutory definitions, courts have tended to define as rape only incidents of sexual intercourse in which the victim's behavior clearly manifested that the act was against her will (Amir, 1971). Thus, the victim's behavior has been considered crucial in establishing her case.
The data collected in the victimizations surveys contain information on the victim's behavior during the incident. The survey interviewer asked the victim if she did anything to protect herself during the incident. 10 The survey results in Table 22 show that the vast majority (72 percent) of the victims did something to protect themselves from their attackers.
One of the first issues raised by the victim's behavior is whether her actions can prevent the completion of the rape. It could be hypothesized that among those victims who managed to do something to defend themselves, compared with those who did not, there would be a higher proportion of unsuccessful attacks (attempted rapes). The data in Table 22 support this hypothesis.
-Of those victimizations in which the woman tried
to protect herself, more than four out of five rape attacks were not completed. By contrast, of those victimizations in which the woman did not use self~protective measures, two-thirds were completed. Completion ratios, comparing the proportion of rapes to the proportion of attempted rapes, illustrate these findings more clearly. Victims who took some action to protect themselves had a completion ratio of only 23, compared with a ratio of2.03 for victims who did not try to defend themselves. This suggests that in a rape attack, the victim who manages to do something to protect herself has a much better chance of preventing the completion of the attack than the woman who does nothing. However, it is important to note that this finding alone is not sufficient basis for advising potential rape victims to use various methods of self-protection. As yet, the question of how best to prevent a rape has no clearcut answer.
10lt should be noted that the victim's use of self-protective measures in the rape. and attempted rape victimizations reported to survey interviewers should not be confused with the legal element of non consent.
30
w_
-Type of Self-protective Measures
Rape victims who reported trying to defend themselves during the attack were asked what action they took. Their responses were categorized by survey interviewers into one or more of the six types of self-protective measures given in Table 22.
The victims who reported using self-protective measures most often reported one or both oftwo types of action: almost half (48 percent) of the women reported trying to get help, attract attention, or scare the offender away by screaming or calling for help; ,"Oughly the same proportion (45 percent) of the women reported using or trying to use some type of physical force, such as hitting the offender or throwing an object at him. Roughly 3 out.of 10 (29 percent) of the victims who tried to protect themselves reported that they resisted without force, or used evasive action such as running away. Approximately 2 out of 10 (22 percent) reported that they threatened, argued, or tried to reason with their attacker.
Thus, the rape and attempted rape victims in the 26 cities tried a number of different measures to defend themselves. Unfortunately, because of the multiple-response nature of the interview question, it is difficult to disentangle from the survey data which types of self-protective measures were more effective in preventing the completion of the attack. Studies that have addressed the question of the relative effectiveness of different techniques of self-defense have produced mixed results.
In a recent study using interviews with 50 rapists committed to a California mental hospital, Chappell and James (1976) asked each rapist what a woman could do to make him stop, and how she could effectively resist him. Chappell and James noted that a significant proportion (58 percent) of rapists admitted not always following through with the attack for a variety of reasons, including crying by the victim, evidence of the victim's altered state of health (pregnancy or sickness), and physical resistance (particularly in the form of attacks directed at the offenders' groins). However, Chappel and James concluded that it is not known how far these findings apply to the rapist population at large and suggest that only further research drawing upon a much larger sample of offenders can answer this question.
Amir's (1971:166) research using police records in Philadelphia also looked at the victim's behavior in the rape incident. However, Amir categorized victim behavior according to a scheme different from the one used by victimization survey interviewers. He divided victim behavior into three types: submission (including

==
TABLE 22 Estimated percentages of use of self-protective measures and typ.e of self-protective measures used in rape and attempted rape victimization •. 26 cities aggregatea
Use of self-protective measures Type of self-protective measure usedb
Estimated Used or Used or Triad to get Threatened, Resisted Other self-Type of number of brandished tried to use help or attract argued, or without protective victhnization victimizations No Yes gun or knife physical force attention reasoned force measure
Rape (10,330) 58%d 42% 0% 63% 56% 27% 8% 3% 32% 67% 19% 3% 26% 22% 24% 5% 10%
Attempted rape (21,850) 14% 86% 3% 40% 46% 21% 34% 6% 68% 33% 81% 97% 74% 78% 76% 95% 90%
Estimated number 100% 28% 72% 2% 45% 48% 22% 29% 5% of victimizations (32,180) (8,927) (23,254) (598f (10,390) (11,242) (5,116) {6,730) {1,278)e
8Excludes rape and attempted rape victimization by nonstrangers and victimizations of males. ~SubcategorieS may total to over 100 percent because victims may report using more than one type of self-protective measure. Row percentage.
dColumn percentage. eEstimate, based on about 50 or fewer sample cases, may be statistically unreliable.
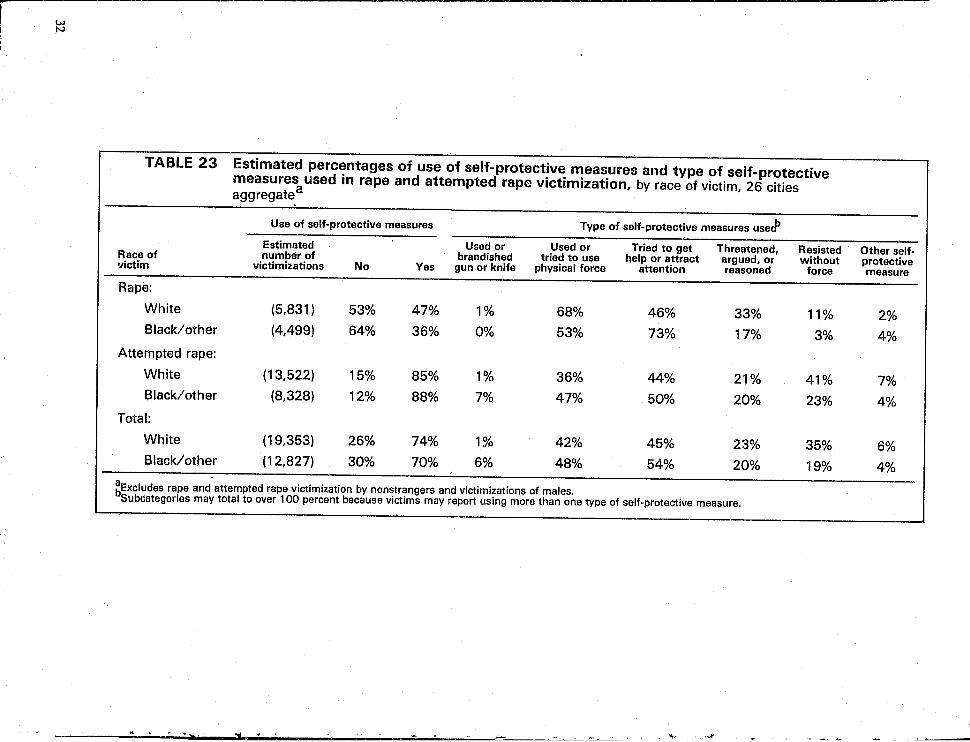
r ~ I
TABLE 23 Estimated percentages of use of self-protective measures and type of self-protective measures used in rape and attempted rape victimization, by race of victim, 26 cities aggregatea
Use of self-protective measures Type of self-protective measures used>
Estimated Used or Used or Tried to get Threatened, Resisted Other self-Race of number of brandished tried to use help or attract argued. or without protective victim victimizatiDns No Yes gun or knife physical force attention reasoned force measure
Rape:
White (5,831 ) 53% 47% 1% 68% 46% 33% 11% 2% Black/other (4,499) 64% 36% 0% 53% 73% 17% 3% 4%
Attempted rape:
White (13,522) 15% 85% 1% 36% 44% 21% 41% 7% Black/other (8,328) 12% 88% 7% 47% 50% 20% 23% 4%
Total:
White (19,353) 26% 74% 1% 42% 45% 23% 35% 6% Black/other (12,827) 30% 70% 6% 48% 54% 20% 19% 4%
aExcludes rape and attempted rape victimization by nonstrangers and victimizations of males. bSubcategories may total to over 100 percent because victims may report using more than one type of self-protective measure.

verbal protest, expression of reluctance only, "young" victim and "intoxicated" victim), resistance (including victim screaming andlor attempting to escape), and fighting (victim putting up a strong fight, throwing things, kicking, and so on). Because of this classification of victim behavior, the victimization survey results are not strictly comparable with Amir's findings. The Philadelphia data show that 55 percent of the victims displayed submissive behavior, 27 percent resisted the offender, and 18 percent put up a strong fight.
Self-protective Measures by Race of Victim
Amir (1971:167) reported that in the Philadelphia' study there was no statistically significant association between the behavior of the victim in the rape situation and her race. The distribution of the various types of behavior (submission, resistance, and fighting) was almost equal for white and black victims.
The victimizatiqn survey results indicate, however, that in rape, but not in attempted rape, there was a difference between white and minority victims in their use of self-protective measures. The data in Table 23 show the relationship between the race of the victim and her use of self-protective measures. White victims of rape were more likely to report having taken self-protective measures than were black and other minority victims (47 percent compared with 36 percent).
There were some minor differences in the type of protective action taken by white victims and by minority victims. Victims in both racial categories who tried to defend themselves reported two techniques most often: trying to get help and attract attention, andl or using or trying to use physical force. Black and other minority victims reported using these measures slightly more often than did white victims. White victims were much more likely to report resisting without force (using evasive action) than were minority victims.
Self-protective Measures by Age of Victim
Earlier in this report it was noted that as the age of the rape victim increases, the likelihood of facing an armed attacker increases. It was suggested that one possible explanation for this is that rapists may perceive attacks on older women as requiring a greater show of force than attacks on younger women. This raises the question of whether there is any variation in the use of self-protective measures for victims of different ages.
The survey data suggest that the self-defensive behavior of the rape victim was influenced to some degree by her age. The data in Table 24 show that the proportion of victims who reported doing something to protect themselves decreased as the age category of the victim increased. The percent of rape victims who reported doing something to defend themselves decreased from 55 percent for victims 12 to 19 years old to 40 percent for victims 20 to 34 years old to 23 percent for victims 35 or older. Thus, the data indicate that as women get older their use of self-protective measures in rape declines. In attempted rape there was no substantial variation in the use of self-protective measures for victims of different ages, with a higher proportion (86 percent) of victims of all age groups doing something to prevent the rape.
There was little variation by age of victim in the type of self-protective measure employed. (Data not shown in tabular form:) Approximately half of the rape and attempted rape victims in all age categories reported trying to get help and attract attention and I or trying to use physical force. Thus, the survey findings indicate that although there is a strong inverse relationship between the age of the victim and her use of self-defensive measures, there is no real relationship between her age and the type of measure she takes.
Self-protective Measures by Weapons
The above sections suggested that the older the rape victim, the more likely she was to encounter an armed rapist and the less likely she was to try to protect herself. These survey results suggest that in rape victimization there may be a relationship between whether or not the offender used a weapon and whether or not the victim tried to defend herself. In addition, it is a reasonable expectation that women facing armed attackers would be less resistant than would be those facing unarmed attackers. The survey results indicate that the proportion of rape victims who did something to protect themselves was influenced by whether or not the assailant was armed.
As the data in Table 25 indicate, in rape victimizations the proportion of victims who did something to protect themselves was more than two times greater in unarmed than in armed rape attacks (68 percent cOlmpared with 31 percent). In attempted rape, the proportion of victims who tried to defend themselves was also higher in those attacks in which the offender was unarmed, although the difference is not substantial (88 percent compared with 82 percent).
33

TABLE 24 Estimated percentages of use of self-protective measures in rape and attempted rape victimization, by age of victim, 26 cities aggregatea
Use of self-protective measures Estimated number
Age of victim No Yes of victimizations
Rape:
12-19 45% 55% (3,198)
20-34 60% 40% (5,846)
35 or older 77% 23% (1,286)b
Attempted rape:
12-19 15% 85% (6,757)
20-34 13% 87% (11,560)
35 or older 12% 88% (3,532)
Total:
12-19 25% 75% (9,950)
20-34 29% 71% (17,406)
35 or older 29% 71% (4,818)
~Excludes rape and attempted rape victimization by nonstrangers and victimization of males. Estimate, based on about 50 or fewer sample cases, may be statistically unreliable.
TABLE 25 Estimated percentages of use of self-protective measures in rape and attempted rape victimization, by offender's weapon use, 26 cities aggregatea
Use of self-protective measures Estimated number
Offender's weapon use No Yes of victimizations
Rape:
Weapon used 69% 31% (6,938)
No weapon 32% 68% (2,227)
Don't know 38% 62% (1,168)b
Attempted rape:
Weapon used 18% 82% (6,031 )
No weapon 12% 88% (3,195)
Don't know 14% 86% (3,195)
gExcludes rape and attempted rape victimization by nonstrangers and victimization of males. Estimate, based on about 50 or fewer sample cases, may be statistically unreliable.
34

TABLE 26 Estimated percentages of,use of self-protective measures in rape and attempted rape victimization. by number of offenders, 26 cities aggregatea
Use of self-protective measures Estimated number
Number of offenders No Yes of victimizations
Rape:
Lone offender 59% 41% (7,691 )
Multiple offenders 51% 49% (2,478)
Don't know 100% 0% (161 )b
Attempted rape:
Lone offender 11% 89% (16,868)
Multiple offenders 22% 78% " (4,809)
Don't know 62% 38% (173)b
aExcludes rape and attempted rape victimizatiol) by nonstrangers ~n~ "lictimizat.!on of males. bEstimate, based on about 50 or fewer sample cases, may be statistically unreliable.
Self-protective Measures by Number ofOffel1ders
Given the nature and seriousness of rape, it could be hypothesized that there would be no difference between victims of lone offenders and victims of mUltiple offenders in the use of self-protective measures. Alternatively, it could be hypothesized that victims facing more than one attacker would be more frightened and consequently less resistant than victims facing single attackers. The survey data do not clearly support either hypothesis.
The data in Table 26 show that in rape there was a slight difference between the use of self-protective measures by victims facing lone offenders and by victims facing more than one offender (41 percent compared with 49 percent). Rape victims of multiple offenders were slightly more likely to use selfprotective measures than were rape victims of lone offenders. However, in attempted rape, victims oflone offenders used self-protective measures more often than did victims of more than one offender (89 percent compared with 78 percent).
Self-protective Measures: Summary
The victimization survey results jndicate some general characteristics of the use of self-protective measures by rape and attempted rape victims. A large majority (more than 7 out of 10) of the total rap~ and attempted rape victims in the 26 cities did somethmg to
protect themselves. Most of these victims reported screaming or crying for help and/ or using or trying to use physical force. Those victims who tried to defend themselves had a much better chance of thwarting the offender than women who did nothing.
The use of self-protective measures in rape and attempted rape was related to both victim and incident characteristics. White victims of rape reported using self-protective measures proportionately more often than did black and other minority victims. Rape victims who were older and those who faced, armed attackers were less resistant. Lastly, there was no clear re1ationship between the number of offenders and the use of self-protective measures.
The finding that women who do something to protect themselves have a much, better chance of preventing the completion of the attack might suggest that physical injury to victims may be less when they try to defend themselves. However, previous research indicates that this may not be the case. For example, Chappell and James (1976), in their interviews with 50 rapists committed to a mental institution, asked the question, "What would push you to injure a victim?" Forty-six percent answered that struggling by the victim would lead to injury and 44 percent said that screaming would lead to injury. These are precisely the techniques of self-protection most often reported by victims in the 26 cities. Does the victim of rape or attempted rape increase her chances of being injured when she uses self-protective measures? The following section will dl!al with this and other questions relating to injury in rape and attempted rape victimization.
35

Injury
There are two major components of the injury suffered by rape victims: one is psychological and the other physic<!.1. The literature on rape suggests that the psychological or emotional damage experienced by the rape victim may be great; however, the victimization Sl.Il;'Vey does not attempt to obtain this information.
The information obtained in the survey does provide a number of approaches for examining the physical component of injury in rape and attempted rape victimizations. Rape and attempted rape victims were asked if they weN injured, what injuries they received, if they were injured to the extent that they neederlmedical attention after the attack, and if they received any treatment at the hospital.
It should be noted that the survey findings on hospital treatment of rape victims may be confounded by the fact that victims of rape attacks, particularly completed rape attacks, may receive one or both of two types of medical attention at the hospital. First, rape victims usually require examination and may require treatment of physical injuries suffered during the assault, and thi!! type of hospital treatment may be reported to the survey interviewer. Second, the police usually require a medical examination in a hospital to establish that a rape did occur. The emergency room treatment picked up by the survey interview could consist of this medical/legal examination that is part of standard hospital/ police procedure for victims of ra pc. The survey instrument does not distinguish these two types of medical attention. If a portion of the hospita! treatment reported in the survey is treatment in the fOim af an examination for the purpose of establishing evidence of the rape, this would inflate the survey findings on the extent of physical injury in rape.
All rape and attempted rape victims who we!'/: attacked were asked in the survey if they received any injuries. Table 27 shows estimated percentages of rape and attempted rape victims who were injured. Note that the victimizations in which the victim was not attacked (those attempted rapes that were verbal threats of rape) are excluded from this table. These data show that although injury was st;bstantially higher in rape than in attempted rape, the majority of rape and attacked attempted rape victims sustained physical injury. Ninety-one percent of the rape victims and 63 percent of the attacked attempted rape victims were injured.
Although the sexual act itself may be incidental in the offender's motivation, rape is a violent sexual assault. The varieties of injury suffered by rape and attempted rape victims can be grouped into two major categories: those directly associated with the act or
36
attempt of rape, and any additional injuries the victim receives. Additional injuries may be in the form of less serious injuries such as bruises, black eyes, cuts, and so forth, or they may be more serious injuries such as knife or gunshot wounds or broken bones. Amir (1971) and MacDonald (J 971) reported that the physical harm suffered by most victims was primarily injury associated with the act of rape itself. Although many victims received additional injuries, a minority suffered severe additional injuries-injuries such as knife wounds or broken bones-that would suggest extremes of brutal and capricious violence, violence beyond what was necessary to contain the victim. It is important, then, to examine the types of injury suffered by rape and attempted rape victims in the 26 cities.
Table 27 shows the types of injury reported by victims who were injured. The types of injury percentages total to over 100 percent because some of the injured victims reported more than one type of injury. A large part of the injuries suffered were directly associated with the act or attempt of rape; 92 percent of the injured rape victims reported rape injuries and 55 percent of the injured attempted rape victims reported attempted rape injuries. The additional injuries reported were for the most part less serious injuries; injuries such as bruises, black eyes, cuts, and scratches were reported by 43 percent of the injured rape victims and 63 percent of the injured attempted rape victims. Few victims (less than 10 percent) reported physical injury in the form of knife or gunshot wounds, broken bones, and internal injuries.
Estimated percentages of rape and attempted rape victims who sustained any additional physical injury are given in Table 28. In this context, additional injury is defined as one or more than one type of injury other than rape or attempted rape injury. This includes: knife or gunshot wounds, broken bones or teeth knocked out, internal injuries or knocked unconscious, bruises, black eyes, cuts, scratches, and other injuries. Table 28 shows that about half of the victims-48 percent of the rap~ victims and 46 percent of the attacked attempted rape victims- sustained some physical injury that was not classified as rape or attempted rape injury.
Briefly, most rape and m9st attempted rape victims who were attacked were injured. Injuries included rape and attempted rape injuries, as well as additional injuries. Although a substantial proportion (about half) of the attacked victims reported some physical injury other than rape or attempted rape injury, most often the additional injury was in the form of bruises, cuts, scratches, and black eyes. These survey data on
____ • ___ ~ _____ c __ ~ ________________________________ _

i
i
L
.... ~
TABLE 27 Estimated percentages of injury suffered and type of injury suffered by those injured in rape and attempted rape victimization, 26 cities aggregate a
Injury Type of injury sufferedc
Estimated Attempted Knife or Broken bones Internal injuries Bruilles, Type of number of Not Total Rape rape gunshot or toeth or knocked black eyes, victimization victimizations injured injured injury injury wound knocked out unconscious cuts, scratches
Rape (10,330) 9% 91% 92% 1% 3% 2% 6% 43%
Attempted rape (12,491 )b 37% 63% 0% 55% 2% 4% 7% 63%
gExcludes rape and attempted rape victimization by nonstrangers and victimization of males. Excludes those attempted rape victimizations that were, verbal threats of rape.
CSubcategol'ies may total to over 100 percent because injured victims may report more than one type of injury.
Other injury
13%
14%

TABLE 28 Estimated percentages of rape and attempted rape vict~ms who sustained additional physical injury, 26 cities aggregatea
Additional injuryb Estimated number
Type of victimization Ves No of victimizatione
Rape 48% 52% (10,330)
Attempted rape 46% 54% (12,491 )c
Total 47% 53% (22,821 )c
aExclUdes rape and attempted rape victimization by nonstrangers and victimization of males. bAdditional injury here means any injury other than rape or attempted rape injury. This includes: knife or gunshot wounds, broken bones or teeth knocked out. internal injuries or kl"1Ocked unconscious, bruises, black eyes. cuts, $cratr.has and other injuries.
cExcludes those attempted rape victimizations that Were verbal threats of rape.
injury suggest that the element of violence in rape is the physical force used to attempt and/ or achieve sexual intercourse with a woman against her will. Generally, it does not appear to be violence in the form of additional, capricious beatings, stabbings, and so forth.
Medical Attention and Hospital Treatment
Another approach to examining physical injury in rape and attempted rape is to look at the proportion of injured victims who reported that they needed medical attention after the attack. In this connection medical attention was defined as care given by a trained medical person (such as a doctor, nurse, or medic) either at the scene, at an office, or at a hospital.
Because by definition rape is a more serious sexual assault than attempted rape, it can be expected that the proportion of victims who reported needing medical attention would be higher in rape than in attempted rape victimization. This was indeed the case. The survey data (not shown in tabular form) show that 54 percent of the injured rape victims and 28 percent of the injured attempted rape victims reported that they were in need of medical attention after the attack. Overall, 42 percent of the injured victims reported needing medical attention.
The rape and attempted rape victims who said they needed medical attention after the attack were asked if they received any treatment at a hospital. The data in Table 29 show the extent of hospital treatment received by rape and attempted rape victims Who needed med.ical attention after the incident. These data show that most of the injured victims who needed medical attention received sOime amount of treatment
38
at the hospitalj 59 percent received emergency room treatment and 10 percent stayed overnight orlongerat the hospital. Thus, most of the rape and attempted rape victims who needed medical attention were taken care of in the emergency room. As might be expected, Ihore attempted rape than rape victims who needed medical attention received some medical attention but no hospital treatment. Table 29 shows that 40 percent of the attempted rape victims, but only 26 percent of the rape victims, who needed medical attention said they received no hospital treatment.
Thus, the data indicated that both in terms of the proportion of victims reporting that they needed medical attention following the attack and in terms of the amount of hospital treatment they received victims of rape were more seriously injured than victims of attempted rape. The remainder of this section of the report will look at how injury in ra pe and attempted rape victimization varied with characteris· tics of both the victim and the incident.
Additional !njur.l' by Race and Age of Victim
Above it was reported that about half of the rape and attempted rape victims who were attacked received some additional physical injury; that is some injury other. than rape or attempted rape injury. Most often the additional injuries were less serious injuries such as bruises and cuts, although the more severe but less common injuries such as knife wounds and broken bones are included in this category. The proportion of victims reporting some (one or more than one type of) additional injury varied with both the race and the age of victims.

•
TABLE 29 Estimated percentages of the extent of hospital treatment received by those victims who needed medical attention following rape and attempted rape victimization, 26 cities aggregatea
Hospital t~eatment
Type of victimization Em.ergency Overnight Estimated number
of victimizations None room only or longer
Rape 26% 64% 10%
Attempted rape 40% 49% 12%
Total 30% 59% 10%
TABLE 30 Estimated percentages of rape and attempted rape victims who sustained additional physical injury, by race of victim, 26 cities aggregatea
Additional injuryb Estimated number
Race of victim Yes No of victimizations
Rape:
White 54% 46% (5,831)
Black/other 41% 59% (4,499)
Attempted rape:
White 49% 51% (7,217)c
Black/other 43% 57% (5,274)c
bExcludes rape and attempted rape victimization by nonstrangers and victimization of males. Additional injury here means any injury other than rape or attempted rape injury. This h~cludes: knife or gunshot wounds, broken bones or teeth knocked out, internal injuries or knocked unconscious, bruises, black ayes, cuts, scratches and other injuries.
cEx'cludes those attempted rape victimizations that were verbal threats of rape.
Table 30 shows estimated percentages of rape and attempted rape victims (excluding those not attacked) who sustained some additional injury, by race of victim. Additional injury was reported more often by white rape victims than by minority rape victims (54 percent compared with 41 percent). Although the difference is not substantial, the same pattern is found in attempted rape victimization. White victims suffered injuries not directly associated with the act of rape or attempted rape more often than black and other minority rape victims.
Estimated percentages of rape and attempted rape victims who sustained additional injury are shown in Table 31 by age of victim. The data indicate that non-
rape injury was greater for older victims than it was for younger ones. The percent of rape victims who reported one or more than one type of additional injury was much higher for victims 35 or older (66 percent) than it was for victims between 12 and 19 years old (44 percent) or those between 20 and 34 years old (46 percent). However, in this table the estimate for victims 35 or older is based on fewer than 50 sample cases and may be K1atistically unreliable. In attempted rape victlimization (excluding those not attacked) additional injury increases only slightly with increases in the age of the victim from 43 percent for the 12 to 19 yea,i olds to 48 percent for the 20 to 34 year oIds to 51 percent for victims 35 or older.
39

------------------------------------------.------
TABLE 31 Estimated percentages of rape and attempted rape victims who sustained addational physical injury, by age of victim, 26 cities aggregatea
Additional injuryb Estimated number
Age of victim Yes No of victimizations
Rape:
12-19 44% 56% (3,198)
20-34 46% 54% (5,846)
35 or older 66% 34% (l,286)c
Attempted rape:
12-19 43% 57% (4,282)d
20-34 48% 53% (6,157)d
35 or older 51% 49% (2,052)d
aExcludes rape and attempted rape victimization by nonstrangers and victimization of males. bAdditional injury here means any injury other than rape or attempted rape injury. This includes: knife or gunshot wounds, broken bones orteeth knocked out, internal injuries or knocked unconscious, bruises, black eyes, cuts, scratches and other injuries.
dEstimate. based on about 50 or fewer sample cases, may be statistically unreliable. Excludes those attempted rape victimizations that were verbal threats of rape.
lnjury and Self-protection
As seen above; when victims in the 26 cities did something to try t(1 ward off their attackers; it appears that they increased the probability that the rape would not be completed. Among those victims who used self-protective measures, more than four out of five rapes were not completed, compared with two out of five among victims who did not use self-protective measures. Because victims of completed rape reported injury and the need for medical attention more often than victims of attempted rape, this difference in completion between victims who used and did not use self-protective measures suggests that injury is less in victimizations in which the victim tries somehow to protect herself.
However, when injury is judged in terms of the proportion of victims receiving additional injury, a different picture emerges. The survey data suggest that physical injury may not be less when the victim does something to try to protect herself.
Table 32 shows the relationship between the use of self-protective measures and additional injury in rape and attempted rape victimization. The proportion of victims reporting one or more than one type of additional injury was much greater among victims who tried somehow to protect themselves. Among the
40
victims of rape, additional injury was reported by 34 percent of the victims who didn't use self-protective measures, but 66 percent of the victims who did use self-protective measures. The comparable figures in attempted rape victimization are 29 percent and 49 percent. Thus, victims who did something to try to protect themselves were much more likely to report types of injury not directly related to the act of rape.
These survey findings indicate that whether there is more or less physical injury resulting from rape attacks in which the victim tries to protect herself depends on how injury is measured. By trying to protect herselfthe victim increases the likelihood that the rape will not be completed; however, the likelihood that the attacked victim will receive some physical injury not classified as rape or attempted rape injury is also increased.
Injury and Number of Offenders
The results of Amir's (1971 :218) Philadelphia study indicated that violence, especially in its extreme forms, was significantly associated with group rape. It would seem. reasonable, then, to expect that additional injuries (injuries such as bruises, cuts, broken bones, knife wounds, and other non-rape injuries) would be reported more often by victims of pairs or groups of

Additional injuryb Use of self-protective measures
Rape:
Did not use self-protective measures
Did use self-protective measures
Attempted rape:
Did not use self-protective measures
Did use self-protective measures
Yes
34%
66%
29%
49%
No
66%
34%
71%
51%
Estimated number of victimizations
(5,946)
(4,385)
(1,454)c,d
(11,037)d
aExcludes rape and attempted rape victimization by nonstrangers and victimization of males. bAdditional injury here means any injury other than rape or attempted rape injury. This includes: knife or gunshot wounds,
broken bones or teeth knocked out, internal injUries or knocked unconscious, bruises, black eyes, cuts, scratches and other injUries.
~Estimate, based on about 50 or fewer sample cases, may be stati;;tically unreliable. Excludes those attempted rape victimizations that were verbal threats of rape.
offenders than by victims of lone offenders. The victimization survey data do not support this expectation.
Table 33 shows the relationship between the number of offenders and the proportion of rape and attempted rape victims who sustained additional physical injury. There was no difference between the percent of additional injury reported by rape victims of lone offenders and that reported by rape victims of multiple offenders. In attempted rape victimization, 48 percent of the victims sustained additional injury when lone offenders were involved and 40 percent sustained additional injury when mUltiple offenders were involved. Overall, additional physical injury was not substantially related to the number of offenders involved in the rape or attempted rape.
Injury and Weapon Use
Two competing hypotheses suggest relationships between the rapist's use of weapons and the physical injury suffered by the victim of a rape or attempted rape. On the one hand, it could be hypothesized that injury to the victim would be less if the offender had a weapon. This would be true if the attacker relied on the mere presence of a weapon, rather than on a show of physical force such as a beating, to frighten and subdue
his victim. For example, research indicates that injury to the victim is less in armed than in unarmed robbery be~ause the robber uses his weapon to intimidate his victims, not to harm them (Conklin, 1972). If the same pattern exists in rape, it would be expected that additional injury to victims would be less in rapes and attempted rapes in which a weapon was present.
The competing hypothesis is that when the offender is armed, there is greater potential for injury to the victim, and this potential is realized often enough for proportionately greater injury to occur. For example, the presence of a weapon may make the crucial difference in turning an assault into a homicide.
The victimization survey data in Table 34 indicate that the relationship between additional injury and weapon use depends to some extent on whether the rape was completed or attempted. Among the victims of completed rape attacks, additional injury to the victim was more likely when the rapist did not have a weapon than when he did (58 percent compared with 44 percent). However, if the rape attack was not completed, additional injury was more likely if the rapist was armed. Seventy percent of the attempted rape victims suffered additional injury in armed attacks.
One explanation for these apparently contradictory findings is that the above hypotheses should be considered together in an explanation of the
41

42
TABLE 33 Estimated percentages of rape and attempted rape victims who sustained additional physical injury, by number of offenders, 26 cities aggregatea
Additional injuryb Estimated number
Number of offenders Yes No of victimizations
Rape:
Lone offender 49% 5'1% (7,691 )
Multiple offenders 48% 52% (2,478)
Don't know 0% 100% (161 )c
Attempted rape:
Lone offender 48% 52% (9,985)d
Multiple offenders 40% 60% (2,441 )d
Don't know 28% 72% (65)c,d
aExcludes rape and attempted rape victimization by nonstrangers and victimization of males. b Additional injury here means any in/Ury other than rape or attempted rate injury. This includes: knife or gunshot wounds,
broken bones or teeth knocked out, nternal injuries or knocked unconscious, bruises, black eyes, cuts, scratches and other injuries. .
~Estimate, based on about 50 or fewer sample cases. may be statistically unreliable. Excludes those attempted rape victimizations that were verbal threats of rape.
TABLE 34 Estimated percentages of rape and attempted rape victims who sustained additional physical injury, by offender'S weapon use, 26 cities aggregate
Additional injuryb Estimated number
Use of weapons Yes No of victimizations
Rape:
Weapon used 44% 56% (6,936)
No weapon 58% 42% (2,227)
Don't know 56% 44% (1,168)c
Attempted rape:
Weapon used 70% 30% (2,894)d
No weapon 41% 59% (7,777)d
Don't know 33% 67% (1,821)d
gExcludes rape and attempted rape victimization by nonstrangers and victimization of males. Additional injury here means any injury other than rap3 or attempted rape injury. This includes: knife or gunshot wounds, broken bones or teeth knocked out, internal injuries or knocked unconscious, bruises, black eyes, cuts, scratches and other Injuries.
~Estimate, based on about 50 or fewer sample cases, may be statistically unreliable. Excludes those attempted rape victimizations that were verbal threats of rape.

-
relationship between weapon use and additional injury in rape and attempted rape-. Following the first hypothesis, it is possible that the rapist who is armed does not intend to use the weapon to injure his victim. He has the weapon because its very presence and his threat of using it is a way of forcing his victim into submission. As seen in a previous section, when the offender is armed proportionately more rape attacks are completed than when he is unarmed. However, it could be that if for some reason the rapist does not succeed in completing the rape, he uses the weapon to beat, stab, or otherwise inflict additional injury on the victim. Following the second hypothesis above, if a weapon is present the potential for additional injury is greater. Thus, there is greater additional injury to attempted rape victims in armed, as opposed to unarmed attacks.
Injury: Summary
The information collected in the victimization survey interview provides a number of ways oflooking at the physical injury suffered by victims of rape and attempted rape. These indicators suggest some general patterns in the nature and extent of physical harm experienced by victims in the 26 cities surveyed. Although injury was reported more often by ra pe than by attempted rape victims, the majority of all victims who were attacked were injured. Of the injured victims, rape victims were injured to the extent that medical attention was necessary more often than were attempted rape victims.
The types of injury reported by rape and attempted rape victims were analyzed as falling into two major categories, rape or attempted rape injuries and additional injuries. Ninety-two percent of the injured rape victims reported rape injuries and 55 percent of the injured attempted rape victims reported attempted rape injuries.
About half of all attacked victims said they received additional injuries, injuries such as bruises, cuts, scratches, internal injuries, broken bones, knife or gunshot wounds, and other non-rape injuries. Additional injuries were reported more often by white than by black and other minority race women, and more often by older women than by younger women. The survey data on the use of self-protective measures and injury present a dilemma for those who would advise women on rape prevention: although the use of self-protective measures increased the likelihood that the rape attack would not be completed, additional injury was reported much more often by both rape and attempted rape victims who tried somehow to protect themselves.
H
Although the additional injury sustained by victims who were attacked was not related to the number of offenders involved in the attack, it was related to whether or not the offender was armed. Among the victims of completed rape attacks, additional injury was sustained more often in unarmed attacks. However, among the victims of attempted rape, additional injury was sustained more often when the offender was armed.
Informing th~ Police
Researchers who have used police files have noted that for a variety of reasons, many victims delay reporting rapes to the police. Amir(1971:290) reported that reasons for failure in promptly reporting the
.incident to the police varied from fear of the offender or of parental reaction to the victim's initial inability to report because of drunkenness or shock. MacDonald (1971 :93) adds that many victims delay reporting until they have spoken to their husbands, boyfriends or physicians. Some rape victims fear newspaper publicity or courtroom appearances.
Because these research studies are based on rapes reported to the police, they can suggest reasons for delay in reporting to the police, but they cannot address the question of why many victims do not inform the police at all. Estimates of the percent of rapes actually reported to the police vary from 5 to 50 percent of the actual rapes committed (Amir, 1971 :2'7). Victimization survey data provide one measure of victims' failure to report to the police: the data can indicate the extent to which victims who report rape attacks to survey interviewers have reported the incident to the police. Survey interviewers asked victims if the police were informed of the incident in any way, either by the victim or by someone else. The victims who did not report the incident to the police were asked why it was not reported. Hence, in addition to providing a measure of the proportion of rape attacks that go unreported, the survey data lends insight to the reasons why victims do not report rapes and attempted rapes to the police.
Generally, among those rape and attempted rape victims who reported an attack to survey interviewers, the proportion who had also reported it to the police was not high. As the data in Table 35 show, in only 56 percent of the total rape and attempted rape attacks that were reported in the survey were the police informed. As would be expected, informing the police was greater in rape than in attempted rape. Roughly two-thirds (68 percent) of the rapes were reported to the police compared with one-half (51 percent) ofthe attempter,irapes.
,.'
43

TABLE 35 Estimated percentages of victims informing the police and reasons for not informing the police in rape and attempted rape victimization, 26 cities aggregatea
Reasons for not informing the police b IQforming the police
Police Didn't want Private Didn't Reported Type of Estimated Police Nothing Not would not to take or want Afraid it to victimize- number of Police Don't not could important want to be time; too personal to get of re- someone Other tion victimizations informed know informed be done enough bothered inconvenient matter involved sponso else reason
Rape (10,330) 68% 1% 31% 23% 4% 14% 1% 53% 14% 19% 7% 11%
Attempted rape . (21,850) 51% 0% 49% 49% 15% 7% 4% 19% 6% 10% 12% 14%
Total (32,180) 56% 0% 43% 43% 12% 9% 4% 27% 8% 12% 11% 13%
bExcludes rape and attempted rape victimization by nonstrangers. and yi?timization of males. Subcategones may total to over 100 percent because non report 109 victims may report more than one reason for not informing the police.

TABLE 36 Estimated percentages of informing the police in rape and attempted rape victimization, by race of victim, 26 cities aggregatea
Informing the police
f Police Don't Police not Estimated number Race of victim informed know informed of victimizations
Rape:
White 62% 0% 37% (5,831 )
Black/other 76% 1% 24% (4,499)
Attempted rape:
White 47% 0% 53% (13,522)
Black/other 58% 1% 42% (8,328)
Total:
White 52% 0% 48% (19,354)
Black/other 64% 1% 35% (12,829)
aExcludes rape and attempted rape victimization by nonstrangers and victimization of males.
TABLE 37 Estimated percentages of informing the police in rape and attempted rape victimization, by age of victim, 26 cities aggregatea
Informing the police
Police Don't Police n01 Estimated number Age of victim informed know informed of victimizations
Rape:
12-19 59% 1% 40% (3,199)
20-34 70% 0% 30% (5,847)
35 or older 84% 0% 16% (1,286)b
Attempted rape:
12-19 49% 0% 51% (6,758)
20-34 50% 1% 49% (11,560)
35 or older 58% 0% 42% (3,532)
Total:
12-19 52% 0% 48% (9,957)
20-34 57% 1% 43% (17,397)
35 or older 65% 0% 35% (4,818)
gExciudes rape and attempted rape victimization tlY n"nstrangers and victimization of males. Estimate, based on about 50 or fewer sample cases, may be statistically unreliable.
45

Rape victims who did not report the incident to the police were asked why they failed to do so. The response given by the victim was recorded by the survey interviewer as one or more of nine different reasons for not informing the police. The reasons given by rape and attempted rape victims for failure to report to the police are shown in Table 35. The reasons given by victims did not vary substantially for victims of different races or ages. (Data not pr~sented in tabular form.) However, as might be anticipated, there was a considerable difference between victims of completed rape and victims of attempted rape in the reasons for not informing the police.
The reason cited by more than half (53 percent) of the rape victims for not informing the police was that they considered the incident to be a private or personal matter. The second most frequently given reason for not reporting completed rape was that the victim felt nothing could be done, there was a lack of proof. Almost one-quarter (23 percent) of the rape victims gave this as the reason for not reporting.
Considering the nature of attempted rape, it is not surprising that the major reason given for not reporting the attack to the police was that the victim felt nothing could be done, there was a lack of proof. Almost half (49 percent) of the nonreporting victims of attempted rape felt that nothing could be done. In attempted rape, the second most common reason for not reporting was that the victim considered the incident a private Of. personal matter. Almost one-fifth (19 percent) of the nonreporting victims of attempted rape gave this response.
Thus, both the proportion of victims who failed to report the incident to the police and the reasons for failure to report are different for rape victims and attempted rape victims. Reporting to the police also varied to some extent with victim and incident characteristics.
Informing the Police by Victim Characteristics
It could be hypothesized that for various reasons victims of different races, ages, and marital statuses would be more or less likely to report rape and attempted rape attacks to the police. Thus, it is worthwhile to examine the survey findings on the relationships between informing the police and race, age, and marital status characteristics of victims.
The survey data suggest that black and other minority victims of rape and attempted rape report to the police more often than white victims. As the data in Table 36 show, in rape victimizations slightly more than three-fourths (76 percent) of the black and other
46
minority victims, compared with less than two-thirds (62 percent) of the white victims, reported the incident to the police. Similarly, in attempted rape, 58 percent of the minority victims,compared with 47 percent of the white victims informed the police.
In both rape and attempted rape, informing the police increased as the age of the victim increased. The data in Table 37 ~how that in rape victimizations 6 out of 10 victims in the 12 to 19 year old category informed the police, compared with 7 out of 10 victims in the 20 to 34 year old category and more than 8 out of 10 victims in the 35 year old or older category. The data for attempted rape indicate a similar but less dramatic increase in reporting to the police as the victim's age increas~s. The 12 to 19 year old victims and the 20 to 34 year old victims have almost the same proportions reporting to the police (49 percent and 50 percent, respectively), compared with a slightly higher proportion (58 percent) of victims 35 years old or older who reported atte.;mpted rape !!ttacks to the police.
Reporting of the rape or attempted rape incidents to the police also varied to some extent with the marital status of the victim. The survey findings show that victims who were never married reported rape and attempted rape to the police less often than did victims who were married, divorced/ separated, or widowed. As the data in Table 38 indicate, among the victims who were never married, 59 percent of the rapes and 45 percent of the attempted rapes were reported to the police. Comparable figures were 81 percent and 63 percent for divorced/ separated women and 82 percent and 58 percent for married women.
Thus, the survey data indicate that informing the police of rape and attempted rape attacks was somewhat related to victim characteristics. Black and other minority women, older women, and women who were married (or had been previously married) were more likely to inform the police than were white, younger, and never married women.
Informing the Police and Injury
It could be hypothesized that the more severely the victim is injured, the more likely she is to report the rape to the police. Above it was noted that victims of rape were more likely to inform the police than wel'e victims of attempted rape. However, there is no real relationship between additional physical injury and reporting to the police.
As the data in Table 39 indicate, victims who sustained additional injury in rape attacks were about as likely to inform the police as victims who did not sustain additional injury. In attempted rape, victims

TABLE 38 Estimated percentages of informing the police in rape and attempted rape victimization, by marital status of victim, 26 cities aggregatea
Informing the police
Police Don't Police not Estimated number Marital status of victim informed know informed of victimizations
Rape:
Never married 59% 1% 40% (6,112)
Married 82% 0% 18% (2,133)
Divorced/ separated 81% 0% 19% (1,869)
Widowed 76% 0% 24% (217)b
Attempted rape:
Never married 45% 0% 55% (12.414)
Married 58% 0% 42% (4,997)
Divorced/ separated 63% 1% 35% (3,674)
Widowed 46% 0% 54% (651 )b
Not ascertained 55% 0% 45% (115)b
gExcludes rape and attempted rape victimization by nonstrangers and victimization of males. Estimate, based on about 50 or fewer sample cases, may be statistically unreliable.
TABLE 39 Estimated percentages of informing the police by rape and attempted rape victims, by additional physical injury, 26 cities aggregatea
Informing the police
Additional injuryb Polica Don't Police not Estimated number
informed know informed of victimizations
Rape:
Additional injury 70% 1% 29% (4,972)
No additional injury 67% 0% 33% (5,359)
Attempted rape:
Additional injury 56% 0% 44% (5,799)c
No additional injury 63% 0% 37% (6,692)c
gExcludes rape and attempted rape victimization by nonstiangers and victimization of males. Additional injury here means any injury other than rape or attempted rape injury. This includes: knife or gunshot wounds, broken bones or teeth knocked out, internal injuries or knocked unconscious, bruises, black eyes, cuts, scratches and other injuries.
cExcludes those attempted rape victimizations that were verbal threats of rape.
47

who sustained additional physical injury were slightly less likely to inform the police than those who didn't (56 percent compared with 63 percent). Thus, it appears that additional (non-rape) injury was not related to the likelihood that the police would be informed.
Informing the Police: Summary
The victimization survey data indicate that slightly over half of the women who reported rape and attempted rape victimizations to survey interviewers said that the incident had been reported to the police. Victims of rape who failed to inform the police most often said they considered the incident to be a private or personal matter. The feeling that nothing could be done or that there was a lack of proof was the reason for not informing the police most often given by victims of attempted rape.
The survey data also indicate that whether or not the police were informed was related to characteristics of the victim. Black and other minority victims reported more often than did white victims. Informing the police increased with the age of the victim. Women who were never married had lower rates of reporting than did any other marital status group.
Informing the police was not related to whether or not the victim sustained additional physical injury.
Summary and Conclusions
In this report, victimization survey data from 26 cities were used to examine the nature of rape and attempted rape victimizations by strangers. The survey results suggest a few genera,l conclusions about characteristics of rape and attempted rape victims and their attackers, and about some elements and consequences of rape attacks.
Generally, women who had a high risk of being attacked were young women, women between the ages of 16 and 24. They were most often not married (never married, divorced, or separated), and their major· activities, like working or going to school, probably took them away from home a good deal of the time. Finally, women with high risks of being rape or attempted rape victims were more often from the lower income levels. It appears that these women were in high risk situations more often than higher income, older, married or widowed women, or those who were keeping house or retired.
The most dangerous hours for potential rape and attempted rape victims were between 6:00 p.m. and midnight. The dangerous locations were open public areas, such as streets or parks.
48
L
Rape and attempted rape VIctims were usuaIly victims of men of their own race, and men perceived to be 21 years old or older. The majority of the offenders were alone and chose lone victims. More often than not, the rapist was unarmed. However, when he did use a weapon it was an effective means of intimidation: the rape was generally completed if the offender was armed.
Although the survey data cannot be used to address the question of whether the rape is primarily violence or sex in the minds of the offenders, some insight into the nature of rape attacks is given by the survey results on injury and theft in rape and attempted rape victimizations. More rape than attempted rape victims reported injury, and of the injured victims, rape victims needed medical attention more often than did attempted rape victims. Additional injury, injury not classified as rape or attempted rape injury, was mostly in the form of less severe injuries such as bruises, cuts, and scratches. Few injured victims reported broken bones, knife wounds, or othel' injuries that would have suggested more brutal physical assaults. In addition, theft was an element in only a small minority of rape and attempted rape victimizations. When something was stolen, it was most often cash and most often stolen from victims of completed rape attacks. This suggests that theft may be secondary in most rape attacks.
Most victims were not submissive. The vast majority of the victims did something to protect themselves: usually they fought back or cried for help. The victim's use of self-protective measures appeared to be effective in preventing the completion of the attack. However, victims who used self-protective measures received additional injuries more often than did those who didn't use self-protective measures.
The survey findings also suggest that a low proportion of rape and attempted rape victims report the incident to the police. Although rape attacks that were completed were reported to the police much more often than attempted rapes, overall, only about one-half of the total rape and attempted rape victimizations were reported. Most often rape victims who failed to inform the police said they felt that nothing could be done or that the incident was a private or personal matter.
Some of the major elements in rape victimization were related to the victim's age and race. Most victims were young, and as the woman's age increased, her risk of being raped declined markedly. However, although women 35 years old or older experienced a lower risk of being victims of rape attacks, if attacked, they were more often victims of armed offenders and appeared to be more seriously injured. Victims 35 or older less

often used self-protective measures and more often informed the police. They also experienced theft in rape victimizations more often than did younger victims; this suggests that the rape may be secondary to the theft when older women are attacked.
Black and other minority women generally experienced a higher risk of being raped. However, white women between the ages of 12 and 19 had a higher rate of attempted rape than did black and other minority race women in the same age group. Black and other minority women were more often involved in attacks in which the offender used a weapon and also experienced theft slightly more often than did white victims. White victims reported the incident to the police less often.
Most victims who did not report the attack to the police said either that they felt it was a personal matter or that they felt nothing could be done. Perhaps those rape prevention programs that encourage greater and more prompt reporting by victims should deal with these issues. In addition, the indication that many non-reporting victims felt that nothing could be done, that there was a lack of proof, may also say something about the rape victim's perception of the police and their treatment of rape cases.
The survey findings have implications for rape prevention. Some are more obvious than others. A youl)g woman, alone in an open public area at night, is in a potentially dangerous situation. Because few rape victimizations involve more than one victim, one suggestion (perhaps unrealistic in many circumstances) is that young women should avoid being out at night alone.
Other findings are less obvious. The survey data indicated a relationship between the victim's use of self-protective measures and the amount of injury she sustained. This relationship has implications for those who would advise potential rape victims on techniques of self-defense. When a woman did something to protect herself (including things like screaming, running away, fighting back), although she apparently increased the probability that the rape would not be completed, she also apparently increased her chances of receiving additional (non-rape) injuries, injuries such as bruises, cuts, broken bones, and so forth. These survey findings might be interpreted by some to suggest that in order to lessen the physical injury in rape attacks, women need training in better, more effective means of self-defense. However, it should be stressed that the issue is not that clear-cut.
There are constraints on the amount and nature of information that it is feasible to collect in large-scale surveys such as the victimization surveys conducted in the 26 cities. As a result, there are many questions about rape that it was not possible to address with victimization survey data. For example, the profile of rape offenders given by the s'orvey data is limited to characteristics that can be perceived by victims, characteristics such as age, race and number of offenders. Similarly, in this report the analysis of the means used by offenders was restricted to an examination of the extent of weapon use and type of weapon use. Only further study can answer the many rmaining questions about the crime of rape, rape offenders, and their victims. There is a special need for a much closer examination of the relationship between the victim's use of self-protective measures and the injury she suffers.
49
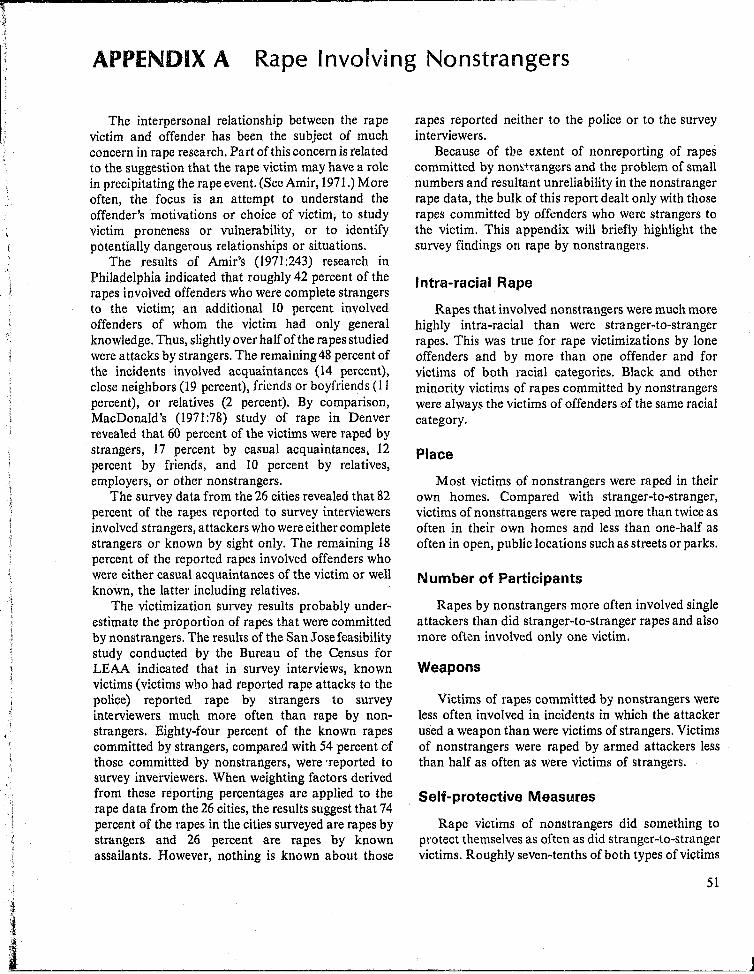
I ~ i;
\
APPENDIX A Rape Involving Nonstrangers
The interpersonal relationship between the rape victim and offender has been the subject of much concern in rape research. Part of this concern is related to the suggestion that the rape victim may have a role in precipitating the rape event. (See Amir, 1971.) More often, the focus is an attempt to understand the offender's motivations or choice of victim, to study victim proneness or vulnerability, or to identify potentially dangerous relationships or situations.
The results of Amir's (1971:243) research in Philadelphia indicated that roughly 42 percent of the rapes involved offenders who were complete strangers to the victim; an additional 10 percent involved offenders of whom the victim had only general knowledge. Thus, slightly over half of the rapes studied were attacks by strangers. The remaining 48 percent of the incidents involved acquaintances (14 percent), close neighbors (19 percent), friends or boyfriends (II percent), or relatives (2 percent). By comparison, MacDonald's (1971:78) study of rape in Denver revealed that 60 percent of the victims were raped by strangers, 17 percent by casual acquaintances, 12 percent by friends, and 10 percent by relatives, employers, or other nonstrangers.
The survey data from the 26 cities revealed that 82 percent of the rapes reported to survey interviewers involved strangers, attackers who were either complete strangers or known by sight only. The remaining 18 percent of the reported rapes involved offenders who were either casual acquaintances of the victim or well known, the latter including relatives.
The victimization survey results probably underestimate the proportion of rapes that were committed by nonstrangers. The results of the San Jose feasibility study conducted by the Bureau of the Census for LEAA indicated that in survey interviews, known victims (victims who had reported rape attacks to the police) reported rape by strangers to survey interviewers much more often than rape by nonstrangers. Eighty-four percent of the known rapes committed by strangers, compared with 54 percent of those committed by nonstrangers, were 'reported to survey inverviewers. When weighting factors derived from these reporting percentages are applied to the rape data from the 26 cities, the results suggest that 74 percent of the rapes in the cities surveyed are rapes by strangers and 26 percent are rapes by known assailants. However, nothing is known about those
rapes reported neither to the police or to the survey interviewers.
Because of tbe extent of nonreporting of rapes committed by nom:ttangers and the problem of small numbers and resultant unreliability in the nonstranger rape data, the bulk of this report dealt only with those rapes committed by offenders who were strangers to the victim. This appendix will briefly highlight the survey findings on rape by nonstrangers.
Intra-racial Rape
Rapes that involved nonstrangers were much more highly intra-racial than were stranger-to-stranger rapes. This was true for rape victimizations by lone offenders and by more than one offender and for victims of both racial categories. Black and other minority victims of rapes committed by nonstrangers were always the victims of offenders of the same racial category.
Place
Most victims of nonstrangers were raped in their own homes. Compared with stranger-to-stranger, victims of nonstrangers were raped more than twice as often in their own homes and less than one-half as often in open, public locations such as streets or parks.
Number of Participants
Rapes by nonstrangers more often involved single attackers than did stranger-to-stranger rapes and also more oft-cn involved only one victim.
Weapons
Victims of rapes committed by nonstrangers were less often involved in incidents in which the attacker used a weapon than were victims of strangers. Victims of nonstrangers were raped by armed attackers less than half as often as were victims of strangers.
Self-protective Measures
Rape victims of nonstrangers did something to protect themselves as often as did stranger-to-stranger victims. Roughly seven-tenths of both types of victims
51
_~J

reported using some tyP(~ of self-protective measure. Victims of rapes committed by nonstrangers also took the same actions to prevent the completion of the attack. Most victims either screamed or called for help, or tried to use physical force of some kind.
Injury
When physital injury is measured in terms of the proportion of completed rapes compared with the proportion of attempted rapes, there is no difference between injury suffered by victims of strangers and injury suffered by victims of nonstrangers. Roughly one-third of the attacks were rapes and two-thirds were attempted rapes for both victims of strangers and of nonstrangers.
However, when physical injury is measured in terms of the proportion of victims who reported needing medical attention following the attack, there was less injury in rape attacks by nonstrangers. It should be noted that the smaller proportion of victims of nonstrangers receiving medical attention following the attack possibly has nothing to do with actual physical injury. Because they may be more reluctant to inform the police, rape victims of nonstrangers may less often undergo medical examinations for legal reasons. This would result in nonstranger victims having a smaller proportion reporting that they needed medical attention following the attack.
Informing the Police
Victims raped by nonstrangers informed the police of the attack less often than did victims of strangers. The proportion of victims of nonstrangers who reported the rape attack to the police was about one-fifth less than the proportion of victims of ,strangers who reported.
The indication that victims of nonstrangers report ra pes to the police less often than victims of strang~rs is congruent with their lower rate of reporting to survey interviewers. This finding also lends some support to the above suggestion that victims of nonstrangers may less often receive medical/legal examinations following the rape attack.
52
Rape victims of nonstrangers, compared with victims of strangers, more often gave as the :reason for not reporting the incident to the police that it was a private or personal matter.
Theft
Theft was not often an element in the rape victimizations by strangers; it was even less often a part of those by nonstrangers. Something was stolen from the victim in roughly one-twelfth of the rapes by nonstrangers, compare~ with one-sixth of the rapes by strangers.
The survey findings on the differences between stranger and nonstranger rape support the view that the relationship between the victim and the offender is a critical element in rape victimizations. Victims who are raped by men they know are more often raped by lone offenders and members of their own race; they are more often attacked in their own homes; and they are less likely to be threatened by weapons or to have something stolen from them.
Although it might be suggested that victims of nonstrangers would be less resistant than victims of strangers, the survey results do not support this hypothesis. Victims of nonstrangers were about as likely to use self-protective measures as victims of strangers. Amir's (1971:246) study of rape, using incidents from police files in Philadelphia, also suggested that the behavior of the victim is similar in stranger and nonstranger rape. The victimization survey results are in agreement with other findings from Amir's (1971:243, 248) research, for example, that single attackers are more common in nonstranger rape and that intimidation with a weapon was less likely when the offender was known to the victim.
As would be anticipated, victims who were raped by nonstrangers informed the police less frequently and more often considered the incident a private or . personal matter.
Together, these findings suggest that rape attacks involving participants known to each other may be very different from those involving strangers. Thus, the study of the victim-offender relationship is crucial in understanding rape.

APPENDIX B National Crime Survey
Questionnaire
53

-or
Form Approv.d' 0 M B No ~1·R1661 , , ,
'Q"" HCN and HCS..J NOTiCE .... Your report to thea 'Census 8tJreau IS confidential by law (Public te.:h'74' Law 93-83). All Idendllable In'ormatlon will be useel only by persons on~.I.d In
and for· the purposes or the surv"y, al'ld m~y not be dl~ '~Iosed or released t others
u.s! bEPA~TMEHT OF COMMERCE for any purpose. -SOCIAL AHD EconOMIC STATISTICS ADMINISTRATION Control number
'BUREAU of THE C::ENtUs ACTING AS C.Ot..t.ECTIHG AotNT FDA 'rHE
LAW ENFORCEMENT ,l.SSISTANC:E ,4,DI"UNI,rRATIQN U.S~ DEPARTMENT OJ(" JUSTiCE
NATIONAL CRIME SURVEY PSU : Serial : Panel : HH : Segment CENTRAL CITIES SAMPLE i I I I
I I I I I I I I I I I I
FORM NCS·3 - BASIC SCREEN QUESTIONNAIRE I I I , fORM NCS·4 - CRIME INCIDENT REPORT
,,-I. Interviewer Identilicotion 6. Tenure (cc 7)
Code i Name @) I ClOwned 01 being bought I 2 [J Rented for cash I
@) I 3 C] No c~sh rerl( I 2. Reco.d of Inler.lew
1 ciate completed 7. Type of IIvin9 qua,tors '(cc II)
Line number of household Hoosing Unit responden~ (cc,9) I @ I 0 House. apartment, flat I
I 20 HU In n9ntransient hotel. motel. etc. @ I
I 3 C) HU - Permanent in transient hotel. motel. etc.
3. R.ason for nonlnlervlew (cc 26d) 4 [.1 HU in rooming house sO MobJle h~me or trailer
T Y PEA (Entof IO,JSon and (dee} 6 [J HU no~-sp~j{led ~bove - Describe l "R.oson
@) I L.' No one home \" \, ~;
2 [; Temporarily absent - Return dote '~ , .
3 L' Refu$ed QTHER Unit ",,'. ,) .
4 [J Other Occ. - S~ecify 7 [}p~s not HUin roo •• llng or boarding house
II- Ra •• of head ~ C, "',.""",",".,, .... " ...... " "'''', "" @ I C;White <\) [' Vac~;'.lI(nt Site or trailer site
2 C: Negro
A ' c: Not specified above - Oescribe .,
3 [J Other ." , TYPE B I~\ ~; 8. Nlfmber of housing units In structure (cc 23) (§ I CJ Vacant - Regular '\ 2 [} Vacant - Storage of HH furnltu.e 'i:, 4' 10 1 505-9
'L1 T_'M", ." ..... '''."~'. "RE \'<: ,) ,,/ 2 0 2 6 0 10 or more 4 Cl Unfit or to be demolished ~. '''~ 3 [1 3 7 Q MobIle home or trailer 50 Under construction. not ready '.', 404 a 0 Only OTHER unitS 6 [~ Converted to temp'@JSlness r '$tQ<ag~
~ ASK IN EACH HOUSEHOLD: 7 [1 UnoccupIed tent 51 railer site \... .. e [; Permit granted. co s =:n-\t start<!d 9. (Other than the, •• business) does anyono in this hdusehold
operate" bus/ne •• (,om this oddres.? 9 C': Other - SpeCIfy 7 ---'j' @) IONo
"". I ~/ 2 [:1 Yes - What kind of business I. that? /1
TYPE C
<ill) I Cl Unused line of Itstlng sheet 2 C] Demolished 10. Family Income (cc 24) 3 [J House or trailer moved @ I C1 Under S 1.000 e c: 57.S00 to 9,999 4 [] Outside segment 20 SI ,000 to 1.999 9 C 10,000 to 11.999 5 C1 Converted to permanent business or storage 30 2.000 to 2,999 laC] 12.000 to 14.999 6 C1Merged 40 3.000 to 3.999 1'015,000 to 19.999 7 C: Condemned 50 4,000 to 4.999 12020.000 to 24.999 B 0 Built after April I. 1970 G 0 5,000 to 5.999 13 Q 25.000 and OVer 9 [J Other - Specify 7 7 0 6.000 to 7.499
11. Household membe .. 12 yeo ••
TYPE Z of age ond OV ER 7
interview not obtained for '1 @ Total number Une number 12. Household membe .. UNDER
@ 12 yoars of age 7
@) <ill> Total number NOTE: CampI ere
@) 14-21 for each line 00 None number listed 13. Crime 'ncident Reporls 1If1.d 7
@ 4. Household stalus @ Total number
@) t 0 Same household os last enumeration 00 None 20 Replacement household since last enumeration .. -3D Previous nonlnterview or not in sample before CENSUS USE ONLY
s. Specloj' place type code (Cf! 6c) @) @) @) @
@)
55
N C S
3
a n d
4

I PERSONAL CHARACTERiStiCS r·.·· ~- ... ,.".,,~--., . .....
22. 23. What Is Ihe hlghesl [2-4. 14.. NAME 15. 16. 17 •.
RELATIONSHIP TO IIGUSEIIOLO HEAD
IS. 19,. 200. 120b. 21. ARMED ,rad. (or yea,) 0' ralula, Old you (ol household npEO~ LINE AGE MARITAL RO\CE IORIGIN SEX
I.AST STATUS : FORCES school you hava aver camp let. tGspondent) INTERVIEW HI',
KEVER - BEGIN NEW RECORD IcC (cc 9b)
Last @> @ 1 I J Per. - Self·,esp. 1 0 Head
I:F.:""-S,...I-----l2 [:J Tel.-Self·resp. _- 2[ IWlf. of head 'I Pe,. - Proxy ,[ I Own Chrld 4(_ ) Tel. - Pt01.Y 1\ [ 1 Other ;"e(ative 5 L:J NI-Pfll 16-21 sl: ~ Non·relative
~~~TH' : (CC 13) (ce 14) (ce 15) I(ee 16)
@) @) @ : I[JM. lOW.:
__ '[]Wd. zONeg.:--
'[::10. '[::1 01.: -oSep. : s[lNM I
MEMBER alltndad! thaly"'!
(ceI7) (ee 18) (ce 19)
10M 1 ['! Ves 00 CJ Never allended • 0 F 2 [-I No 0' ~I""e,gart.n
- __ Elemenlary (01-08)
__ H.S. (09-12)
__ College (2l-26t)
(ee 20)
1 l:jyes 2 t:l No
CHECK ITEM A
look ar item 4 on cover page. Is this the same household as last enumeration? (Box ( marked)
26d. Hoye you been looking lor work during the post 4 week.? @ 1 0 Yes No - When did you last work?
;=: Yes - SKIP to Check /tem BONo 25a. Did yau liye in this hou.e on April I, 1970?
S I ·:Yes~SKIPtDClieckltemB 20ND
b. Where did you liye on April I, 1970? (Sla!e, loroign counlry, U.S. possession, etc.)
_S_ta_t_e._e~tc:.:=============~C~o~u~n~ty~====~========~ c, Did you live inside the limits of a city, town, village, etc.?
I :::~ No 2 =:: Yos - Nome of City, town. village, etc'j!
NoteS
27.
@)
Page 2
56
20 Less than 5 years ago-SKlPto 280 305 or more years ago} SKIP to 29 4 0 Never worked
I. there any reason why you could notlok. a job LAST WEEK?
1 [J No Yes - 2 [J Already has a job 30 Tempora,y illness • 0 Going tll school 50 Other - SpecifY7

-
-. 1 HOUSEHOLD SCREEN QUESTIONS r
2'1. How I'd like to ask some questions about 'Cl Yes - HoW nlany 32. Did anyone take somethlnr belonging I Ll Yes ~ How mlny crime. fhey refer only to tho last 12 month. _ : tllM&' to you or to any member 0: this household~ : tlmn?
I from a place where you or they were t r~, No between ___ I, 197~.nd ___ , 197_.:[JNO temporarily staying, $ueh as a friend! 5 or I l.
I
During the last 12 months, did anyone break : relativels home, a hotel or motel, or , a vocation 'home? . ,
into Ot somehow illegally get Intp your . ; I
(apartment 'home), garage, or onc:lher building , 33. What was the total number 01 motor :® on your property? , vehicles (c:ors, trucks, etc.) awned by -,
you or any other member 01 thh household :oi'j None-30. (Oth.r than lhe incident(s) just mentioned) '[J Ves - How ... ny during the lost 12 montt .. ? I SKIP to 36
Did you find a door jimmied, a lock forced, : - th"ea? :,[] I or any other signs of on ATTEMPTED :[JNO : 2 [J 2 break in? I
: 3 r: J3 , , --- : 4l~1 4 or more , , 34. Did anyone steal, TRY to s'eal, or use I ,r:1Yes--How m'ny
31. Was anything at all stolen that IS kept n Yes - How ... ny (ltlany of them) without permission? ' IImes1
outsi~. your hom~, or happened to be lelt . tim .. ' : ['!No
out, such as Q bicycle, a garc:fen hose, or ljllO ,-'
lawn furniture? (other tlH1n ony incidents 35. Did anyone steal or TRY to steal part lC1Yes-How many already mentioned) --- of (it/any of them), such 0$ a battery, I tlmu?
hubcaps, tap •• deck, etc.? :C1No I
I INDIVIDUAL SCREEN QUESTIONS I -_. 36. Th. follawing questions reler only to things : nYe. - He ... many 46. Did you lind any ."idence that somoone : [1 Yes- HoW mlny
thaI happened to you during the last 12 months _. II ... O! ~"TEMPTED 10 steal something Ihat I tlmts?
between ___ l, 197_ond ___ ,197 _. :r-:JNO belonled to you? (other than any inci~ents iUNO alroa y ~~iOned) I
Did you have your (pock'i picked/pur .. (A . ,
snolched)? , I , --- , ---
37. Old anyone take somethl.g (~\s.) direclly . n Yes - Hew m.ny 47. Did you ~. durin~ the lost 12 . f,om you by using force, such as by a u .... r months to re r .om Ihing Ihat happenad I
I stickup, mugging or Ihreal?
f"]No yO!} which y u 1 ught was a crime? ,
o nol co.nt an calls mode to the I
p Ie co corning the Ineldanls you : i --r=-~.'. ,. , ,., ,., ... ) I
I
38. Did anyone TRY to rob you by using force U No - SKIP to 48 I
:r-1YeS-H~ I
or threatoning to harm you? (other than
~ I
[1 Yes - What happ ened? ,
any incidonts already mention.d) I I I , ,
39. Did anyone beol you up, attack you or hit .r~~ i(§)IT] you with something, such as a rock or b e? 1 • 1
I I IT] (other than any ineldento ol.eady menf ne : [1 No I r
~JS'-- I
CIJ I I
". w,,' ,. ••• ".,. ,h .. ". ':~ \),1"1 '" - .~~. Look at 47. Was HH member :0 Yes- Hew ... ny some other weapon by on)'o ' other I tim,.? 12 t attacked ~r threatened, or I tim .. ' than any incidonts already m . : _]
t was something stolen or .pt., I
I r No CHECK :C1No ,
ITEM C attempt made to steal something , , , --- that belonged to him? I , I
41. Did anyone THREATEN to boat you up 0' I, -1 Yes - How many , I
THREATEN you with a knife, gun, or some : tlmlll I ---other woo pan, NOT including lelephone
W1No 48. Old anylhlng happen to you during tlte last I threats? (olher than any incident_ already 12 menlh. which you thought Was a crime, I
mentioned) I I I but did NOT reporl to the police? (olher I , --- than any Incidents already mentioned)
, I
42. Did anyone TRY to attack you in some : i -lVes ... How many I
[J No - SKIP to Check Item E I other way? (othor than any incidenls already I UmoS! I
mentioned) I CJ yes - What happened?
I
:111'10 I I , I
I I , I --- i(§)ITJ
43. During the lasl 12 months, did anyone .Ieal : [J Yes - How mlnY I
CD things that b~long.d tQ you from inside any cor, .- tim .. ! I
or Iruck, such as packages or clothing? : ['1 No I I
I I CD I I I --- ,
/
(4. Was anything stolen from you while you : n Yes - How ... ny Look at 48. Was HH member :[1 Yes -How mony were away from home, for instance at wor~, in I - Urn .. ! , 12 t attacked or threatened, or I tim .. ? a theater or restaurant, or while troveling?
, CHECK was something stolen or an I
;[lNO ITEM 0 attempt made to steal something :[jNo , that belonged to him? , , I
: --- I I
45. (Other Ihan any Ineldents you've already : n Yes - How many Do any of the screen questions contain any entries mentioned) was anything (el.e) ,t all I - tim .. !
t for "How many times?"
stolen from you during the last 12 manths? . CHECK [1 No - InterView next HH member. :[JNo ITEM E End interview if last respondent, I ar.d (ill item 13 on cover. , , --- [I Yes - Fill Crime Incident Reports. I
.pae,e 3
57
WE _;
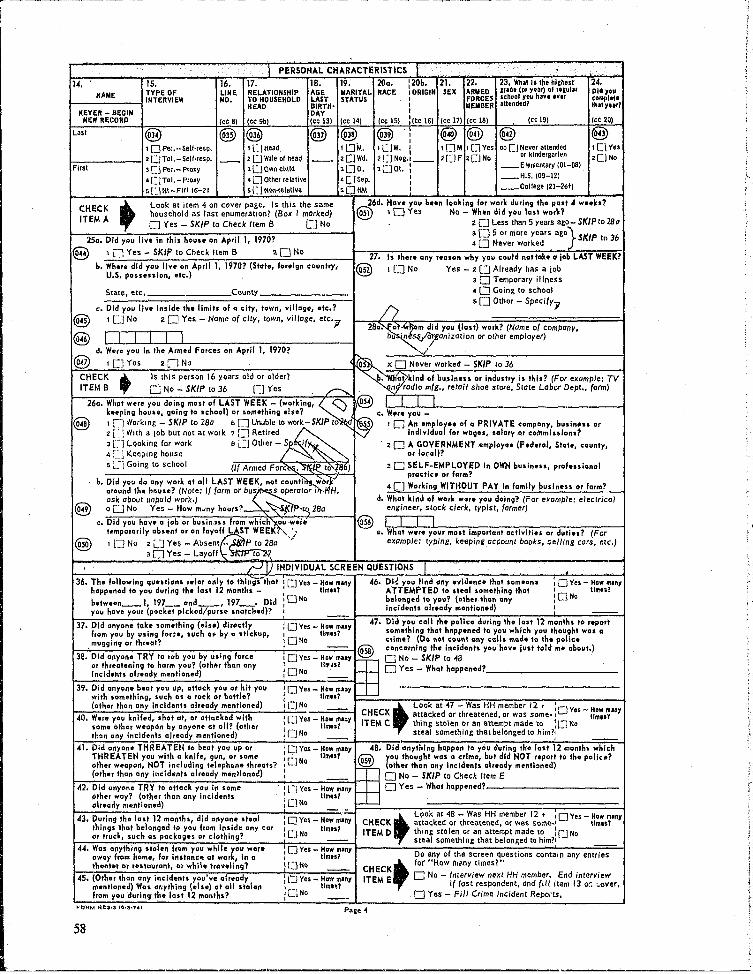
14. 15. 16. HAilE TYPE OF l-IHE
INTERVIEW NO.
1 PERSONAL CHARACTERISTICS I 17. 18. RELATIONSHIP AGE TO HOUSEHOLD LAST IIfAD BIRTH'
19. 200. IIMITAl- RACE STATUS
:20b. I ORIGIN I I
21. 22. 23. What I, the hlchost 24. SEX ARMED lrode (D. y ... ) Dt .o,ul .. Old you
FORCES school you han tv., cDIllf!I". IIEIIBER .ttendedl thlty ... 1
I
i(te 16) KEYER - BEGIN DAY
HEW RECORD (cc 8) (cc 9b) (ce 13) (ec 14) (ce 15) (ee 17) (ce 18) (cc 19) (ce 20)
La.1 @) @ lOPe<. - Self.tesp. 20Tal.-Sell·rnsp. --Ftrsl 3 Cl per.- proxy • CJ Tel. - Proxy s['1N1-FHlI6-21
@ I []Head 2 0 WHe of head )CJcwnehiid • 0 Olhe. relative S [J 1100«1.11'0
@)
--@) 10M. 'OWd. '00. • C]sep . sONM
@ 'Ow. I 2[]Neg.I __
l[Jot. : , I 1
(§ @) I[)M I (] Ves
'[]F 'DNo
@) @ 00 0 Never attended I ClVe.
or kindergarten ·CIN<>
__ Elementary (01-08) __ H.S. (09-12)
__ College (21-2ij+)
CHECK ITEM A
Look at item 4 on cover page. /s this the same household as last enumeration? (Box' marked) DYes - SKIP to Check Hem B tJ No
26d. Have you b,en looking for work during Ihe pall 4 wIlks? ® 10 Yes No - Wh.n did you la.1 work? , 20 Less than 5 years .go- SKIPto 280
250. Did you live in Ihi. hou.e on April I, 1970?
~ 1 0 Yes - SKIP to Check Item B 20 No 27.
305 Dr more years ago} SKIP to 36 • 0 Never worked
I. Iher. any r.ale>n why you could nollckl • job LAST WEEK? b. Wh.re did you live on April I, 1970? (Stal_, foreign counlry,
U.S. poss.ssion, etc.) ,
State, etc. County
c. Did you liv. In.id. Ihe limit. of a city, lawn, vill.g., etc.? 1 0 No 20 Yes - Name of city. town, vil/oge. etc'J!
b. Did you do any work 01 all LAST WEEK, not counl~~o.rr. around the hGu •• ? (Note: ,f farm or b~S' s opera~tor in-J4H. ask about unpaid work.) ~ 00 No res - How m"ny hours'_ "",""-"~28a
c. Did yoU have a job or busirtluS from which~o-u ·wei., lemporarily .b ..•• nl or on laYO;~i L ST WEEK1",j 1 [J No 2 C] Yes - Absent -,$$ P to 2Bo
3 0 Yes - Layoff '$t,"Tf1Tc>'2:l
@) 10 No Yes - 2 0 Already has a job
/)
3D Temporary illness 4 0 Going to school 50 Other - Specifyy
~ U INDIVIDUAL SCREEN QUESTIONS I 36. The following qu .. tion. "I.r only 10 Ihings-Ihol I 0 Yes _ How many 46. DI~ you lind .ny evidence Ihol .omoon. lOY.' - How .... y
happened to you during tho lasl 12 Monlhs -: IImn7 ATTEMPTED to Ileal .omelhlng Ihal I th ... 7 bolween __ I, 197_ ond __ , 197 __ • Did : 0 No belonged to you? {other Ihan any : 0 No you have your (pocket picked/purse snatched)? I incidents already mentioned) I __ _
31. Did anyone take .om.lhing (.1 •• ) directly '0 Yes How ma y 47. Old you call Ihl police du.ing Ihe lasl 12 months Ie> reporl Irom you by using for;e, .uch o. by a .tlckup,' - IIm .. 7 n som.lhlng Ihal hopPlned 10 you which you Ihoughl was a mugging or Ihreal? : [J No c.ime? (Do nol count any call. mad. 10 the potic.
r.,:-'-::7';;.::..~--==,---;----;---:--:-----+' __ ---===='-itOsiP concerning Ihe incidents you have iuslle>ld m. aboul.) Je. Old anyone TRY 10 rob you by using force 10 Yes - HoY' many ffillt5 0 No - SKIP to 48
.r threalening 10 harm you? (olh~r Ihon any :1 ONo tI~_"'_l_ 0 Yes _ Whal happ.ned? __ -'-__________ _ Ineld.nls already menlionedl
~~~--~~----~----~--~----~.~~~~ 39. Old anyone beal you vp, allaok you or hil you '0 Yes _ How mlny III ----------------------
wilh lomethlng, such as a rock or bOllle? : tlm .. 7 f--'--l
1-7:,...,;,.:.;~..;.:;."'/.C-:;,.f!.7-'-;-h-....,.--.,...:~k,.....d:--=h...:.--.... , =- CHECK attacked or threatened. or was some- I IIm .. 1 y (othar than any ineldants al.aady menlloned) 10 No __ t Look at 47 - Was HH member 12, :0 Yes _ How man
40. Were you .ni ad, s 01 ut, or allae a wll ,0 Yes - tH,OmW •• mt"ny ITEM C thing stolen or an attempt made to ',I"" No .ome olh.r weapon by anyone 01 oil? (olher /-' toan any incidents already menlloned) : 0 No steal something that belonged to him?1 -- , '
41. Old onyon. THREATEN 10 beat you up or I CI Yes _ How many 48. Old anyl.lng happ.n 10 you during Ihe lasl12 monlh, which THREATEN you with a knife, gun, or sam. : ON tlm.,t IQ59I you Ihought was a crime, bUI did NOT reporl to Ihe police? alher weapon, NOT including t.lephone Ihreats?: 0 ~ (other Ihan any Ineidonls already menlioned) (olher Ihan any incid6nh a' ready m.nllone~) I U-.-J 0 No - SKIP to Check {tem E
1-"::2::-.~P;:;-id;-a-n-y-o-n-e-:T;:-R=Y-:I-:o-a-:I-:-la-c-;k-y-o-U-:'irt-.-om-.----"'I -:l::-J-Y-.'-_-:H":a=w=nI=a=ny-t~-t---l 0 Yes - Whol happ.ned? o.her way? (olh.r Ihon Dny Incidents : tlm .. l already nl.Mionad) 10 No F==---....,.;--:-;:=-::;:=:;;;:::::;:;;:,:==.=~=::;:======~ r.::-:P=--:--'-:h:-7'I·--:l:':2:--7h--:d7'ld-:-----7',---!-i---.-:=..,,:::... t Look at 48 - Was HH member 12 + 'DYe. - How many
43. ..ing I a 0.1 monl 5, anyone .Iea ,0 Yes - How many CHECK attacked or threatened. or was some.' tlmul thing. Ihal belonge& 10 you from insld. any car : 0 No tlm .. 7 ITEM D thing stolen or an attempt made to : 0 No or Iruck, such a. package. or clolhing? steal something that belonged to him?'
44. Was anylhing slolon from you while you were : 0 Yes - How mlny Dway from hornet for instgnC:1! at work, in a I tlmatl? theale. 01 ,,,'auranl, or whil. traveling? 'ONo
45. (Olher than ony incidents you'ye already : 0 Yes - H." many monlioned) Was aNything (olse) 01 all .'olen I IIm .. l from you during tho lasl 12 monlh.? : 0 No _
SR
Do any of the screen questions contain any entries
t fo( "How IM-ny times?"
~HE~~ 0 No - Irrlerview next HH member. End interview if 'ast (espondent. and fill item 13 or. ~Gver.
CJ Yes - Fill Crime Incident Reports.
i f'
i , :-

@)
@)
*
KEYER -BEGIN NEW RECORD
Line number
Screen question number
Incident number
Notes
la, You said that during the last 12 month. - (Refer to appropriate screen question (or description of crime). In what month (did this/did the first) incident happen? (ShoW flashcard If necessary. Encourage resPond~nt to give exact month.) ,
Month (01-12)
·~
Form Approved: a.M.B. No. ~1-R2661 NOTICE - Your report to the Census Bureau is cOhfldential by law (Public Law 93-83). All Identifiable Inforlnatlon will b. used only by persons engaged In and for the purposes of the survey. and may'not be disclosed or released to others for any purpose.
U,S. DePARTMENT OF coMMERCE SOCIAL AND ECONOMIC STATISTICS ADMINISTRATION
BUREAU OF THE CENSUS ~CTINGASCOLLECTINGAGENTFORTHE
LAW ENFORCEMENT ASSISTANCE' AOMINISTRATION U.S, DEPARTMENT OF JUSTICE
CRIME INCIDENT REPORT NATIONAL C!,\ ME SURVEY CENTRAL CITIES SAMPLE
Sa. Were you a customer, employee; or /)Wner?
1 LJ Customer 2 [~~ Employee 3 Cl Owner
41~J Other - SpecifY:::;:::::::::::=:::==::::;::::::=:==:=;:===j b. Old tho person(s) stea: 0; TRY to steal anything belonging
to the ~tore, rostaurant, office, factory, etc?
N C S
" Is this incident report for a series of crimes? <IT9 1 r:l Yes }
CHECK t 1 [J No - SKIP to 2 ~r N:o SKIP to Check Item B 1\1 ITEM A 2 [] Yes - (Note: series must have 3 or ,. ~ on't know
more similar inCidents which 7:'---;----:----:-:--;------1 C b. In what month(s) did these incidents take place? ther •• s a a guest 0' a workman?
respondent can't recall separately) 60. D~:~~!(C fender(s) Ilv~ there or have 0 right to be
(Mark 0/1 thor apply) I~l: I Yes SKIP to Check Item 13 1 l':J Spring (March. April. May) 21~~' N'Q D 2 [] Summer (June. July, August)
@) 3 [J Fall (September, October, No~ember) -".;-/-___________________ --1 ~
3'_ on't know E 41, ] Winter (December, January, February) <:\ ~ b. Did the offender(s) actually get in or just TRY to get
. • "" in the building? N c. Ho~ many inclden" were Involved In this serie.?, . 16 I (-l Actuall ot in @ 11.1Threeorfour ~ - yg
2 rJ Five to ten ~ 2l::J Just tried to get in T 3 L] Eleven or more . ,..3.:.I',.:.:.;..l,..D_o_n_·t_k_n_o_w_,--__ -: __ -:-___ -:-__ -:-__ .., 4 rl Don't know . "'" c. Was there any evidence, such as a broken lock or broken R
2.
@)
30.
INTERVIEWER -If series. the following ques"tki.n~~ Window, that the offender(s) (I!>rced his way infrRIED only to the most recent Incident. /"'--. "'-") , to force his way in) the building?
Ab,out what time did (this/the mosit"'.~t ~ @)1C:NoE d '" Yes - What was the evidence? Anything else? p
Inci ent happen? '\ (Mdrk all that apply) I L] Don't know ('-" 2 0 Broken lock or Hi ndow '\ 2 L] During the day (6 a~. 6 p.m.) ! 0
: f.: 1 ~~.;;~~~ t:i~na.~~ 4! : ~~~:~::)screen t~K2':.eck R At night (6 p.m. to " 3D Forced door nr Window J 51':'1 Don't know' s!:~ Other - Speci(Y7 Item B T
Old this incident take place t .. lde the lim lis of this _________ . ___ _ city or somewhere else? 1 [J Inside limits of this city - SKIP to 4 2 r:J Somewhere e'se in the United States 3 ! :J Outside the United States - END INCIDENT REPOI\'T
@) d. How did the offender(s) (ge' in/try to get in)?
1 0 Through unlocked doc, or window 2 Cl Had key
b. In what State and county did this Incident occur? 3 [J Don't know
State
County @ Did it happen inside the limits of 0 city, town, village, etc •. 1 [::J No 20 Yes - Enter nome o( city, town, etc. f
II II J I Where did this Incident tak .. place? 1 [J At or in own dwell ing, in garage or
other building on property (Includes break-in or attempted break-In)
20 At or in vacation home, hotel!motel 3 [J Inside commercial building such as
store, restaurant, bank, gas station, public conveyance or station
40 Inside office, factory, or warehouse 5 L] Near own home; yard, sidewalk,
driveway, carport, apartment hall (Does not include break-In or attempted break-in)
60 On the street, in a park, field, playground. school grounds or parking lot
4 [::J Other - Specify
CHECK .. ITEM B .,
Was, respondent or any other member of this household present when thIS incident 'occurred? (If not sure, ASK)
1 [J No - SKIP to 130 2 [1 Yes
Did the persan(s) have a weapon such as a gun or k"ile, or something he was using as a weapon, such as a bottle, or wrench?
IONo
2 [J DOll't know
Yes - What was the weapon? (Mark all that apply) 30Gun
4 U Knife
sOOther - Specify
Did the person(s) hit you, knack you down, or actuolly attack you in some other way?
I [J Yes - SKIP to 7f 2[] No
7 0 Inside school 8 c.J Other - Specify.,.
c. Did the person(s) threaten you with harm in ony way?
@ 1 [J No - SKIP to 7e
2 [J Yes
Page 9
59
I

-
.,,'. "." ; ... ; ';'·~'::·:;."i;·:'l CRIME INCIDENT QUESTIONS - Conllnueel F;·>., ..... ' ;,; ....... : .'
711, How were you thr •• tened? Any other way? 9c. Dld'insurance or any health benefits program pay I4r all or part of
* (Mark all rhar apply) . thot tolal medical expon.e.? @) I 0 Verbal threat of rape @ I 0 Not yet settled}
20 Verbal threat of a'ttack oth.r than rope 20 None".;", SKIP to lOa 3 0 Weapon present or threatened
·SKIP 10AII., ,., ,.: with weapon
to 40 Part 40 Attempted attack with weapon lOa d. How much did in.uranee or 0 h •• lth benefits program pay? (for example, shot at) 5 0 Object thrown at person I@ .$ . []QJ (Obroin on 'srimore, if necessary) 60 Followed, surrounded 7 0 Other - Speci fy 100. Old you do anything to prated yourself or your property
.during the Incident?
e. What actually happoned? Anything els.? @) 18 No - SKIP'!o II 2 Yes
* (Mark all rhat apply)
@) 10 Something taken without permission • b, Whol did you de? Anything el .. ? (Mark all that apply)
2 0 Attempted or threatened to @) I 0 Used/brandisoed gun or knife
take something 20 Used/tried physical force (hit, chased, threw object, used
30 Harassed, argument, abusive language oth:!r weapon, etc.)
40 Forcible entry or attempted 30 Tried to get help, attract attention, scare offender away
forcible entry of house SKIP (screamed, yelled, called for help, turned on lights, etc.)
sO Forcible entry or attempted to 40 Threatened, argued, reasoned, etc" with offender
entry of car 100 sO Resisted without force. used evasive actio~ (ran/drove away,
6 0 Damaged or destroyed property hid, hel~perty, locked door. ducked, shielded self, elc.)
7 [) Attempted or threatened to 6 0 Other(s ~~. damage or destroy property
11. Wo. Ihe crime ~r only one or more than one person? • [J Other - Speci fy II (ill) I Only one 7 20 Don't know - 30 More than one,
SKIP to 12a f. How did the porson(s) attock you? Any a.was~~~ale
" othor way? (Mark 01/ that apply) f. How many persons?
@) I [] Raped . ' r le",ale.
@ 20 Tried to rape 13 <::) Male • [] Hit with ob,ect held in hand, shot, knifed g. Were they mol. or female?
40 Hit by thrown object !~ Female @) 'OAII male
sO Hit. slapped, knocked down 20 All female
60 Grabbed, held, tripped, jumped. pushed et • 0 Male and female
70 Other SPecify 40 Don't know
80. What wer. Ihe injurle. ~au suffered, If any? ~ the person was? h. Howald would you say the • ,.,.M ... , •• , ,Mo,' • , "" .,,"~ I I 0 Under 12 young .. t wa.? @ t [] None - SKIP to 100
20 12- 14 @) , 0 Under 12 5021 or over-. 20 Raped ~ 20 12-14 SKIP to I
3 0 Attempted rape 3015-17 301S-17 60 Don't know
• 0 "',., " '.""".~ 4018-20 4018-20 5 0 Broken bones or teet k a ked out
5 [] 21 or over I. Howald would you soy the 60 Internal injuries, kn c scious old •• 1 wo.? 7 0 Brllises, black eye, cuts, s, welling 6LJ Don't know @) I 0 Under 12 40 19-20 • 0 Other Specify 20 12-14 5 [] 21 or over
c. Was the person some;Jne you b. W.r. you Injured to tho extent that you n •• ded knew or was h. a stranger? 3015-17 6 0 Don't know
med,col attention after Ih. attack? j. Were any of the persons known @) t 0 No - SKIP ro 100 @) 10 Stranger or r.lated to IOU or were they
20Yes 20 Don't know all strangers,
c, Old you receive any treatment at a hospital? • [] Known by j"lP @! , 0 AI, "'~ .. " ~ SKIP @ IONo sight only to e 20 Don't know to m
2 [] Emergency room treatment only 30 All relatives SKIP 30 Stayed overni ght or longer - 40 Casual 40 Some relatives to I
H6W many day.? II acquaintance sO AH known
@) sOWell known 6 0 Some known
d. What wo. Ihe lolal omounl of your medical d. Was the person a r.lalive k. How w.1I were they known?
expense. resulting from Ihi. Ineldont, INCLUOING * (Mark all that apply) an~lhln9 paid by ins"rance? Inclu~. ho.pltol of yours?
@> '0" """'" } ani! doctar bill., medicine, therapy, brace., and @) 10No 2 [J Casual SKIP any other injury.relaled medical exp.n ....
Yes - Whal relationship? acquaintance(s) to m
INTERVIEWER ~ If respondent does not know '0 Well known
@) exact amount. encourage him to give an estimate. 20 Spouse or ex-spguse a 0 No cost - SKIP to 100 3D Parent I. How were they ,.Iat.d to you?
.[Q[J • (Mark all thor apply)
S 40 Own child @) 10 Spouse or 40 Brothers/ x [] Don't know sO Brother or sister ex-spouse sisters
90. At the li",e of the incident, were you covered 6 0 Other relativ~ -
20 Parents sO Other-by any modlcal In.urance, or wo,. ~ou .llglble 300wn Specify, for benoflts from any olher typo of ealth SPecifYJI children benefits program, such as MediCaid, Velerons' ----Administration, or Public W.lfa/e?
@) 10 No •• , •• , } SKIP to 100 •• W .. h./~.- } m. Wore all of Ihom -
20 Don't know (@ 10 Whit.?
@ ,0Whlt.?
30Yes 20 Nogro?
b. Did you III. a claim wl1h any of th ... Insurance 20 Nogro? SKIP 300th.r? - Specify,
companlo. or programs In order to got part or all 30 Olh.r? - Specify, ~2a
@) of your medlc.1 •• pon ... paid? 40 Combination - Specify, I 0 No - SKIP to 100 20Yes 40 Don't know sO Don't know
'FOAM N.cs ... t.l. 14' Pa,.'O 60

CRIME INCIDENT QUESTIONS - Continued
·120. Wore you the only person·ther. besld.s the offender(s)?
@ I DYes-SKIPto 130 zONo
CHECK ... ITEM 0 .,.
Was a car or other motor vehicle takent (BOK 3 or 4 marked In 13f)
* @)
•
b, How many of the .. persons, not counllng yourself, were robbod, harmed, or threatened? Do not Include persons· und~r 12 years of age. a 0 None - SKIP to 130
Number of persons
c. Are any of these persons members of your household now? Do not Include household members under 12 years of age. oONo
Yes - How many, no! counting yourself?
(Also mark "Yes" In Check Item I on page 12)
130. Was something .tolen or taken without permission that belonged to you or others In the household? INTERVIEWER - Include anythillg stolen from unrecognizable business in respondent's home. Do not include anythIng stolen from a recognizable bUSIness In respondent'S home or another bUSiness, such as merchandise or cosh from a register. 10 Yes - SKIP to 13f
o No - SKIP to Check Item E
DYes
.14a. Had pernlis,lon to use the (car/mato, vehicle) ever been give" to the person who took It?
IONO •••••• }
O 0 ' k SKIP tei Check Item E 2 on t now .
30Yes
b. Did the person r.turn the (car/motor vehicle)?
@ IOYes
zONa
CHECK .. ITEM E .,.
Is Box I or 1 marked in 13f?
o No - SKIP to 150
DYes
2_0~N_O ____ · ________________ ' ______ --4~
b, Did th. person(.) ATTEMPT to take something that
c. Was the (pur,i/wallet/monoy) on your person, for Instance, in Q packet o,~ og held by you when It was laken?
I DYes ,i belonged to you or others in the household?
I C"J No - SKIP to 13e 2[]Yes .
c. What did they try to take? Anything olse? (Mark all that apPly) 10 Purse
z 0 Wallet or money
30ear 40 Other motor vehicle sO Part of car (hubcap, tape.deck,
6 0 Don't know
7 0 Other - Specify
CHECK ..
ITEM C "
Old they· or mone~'.
DNa - S DYes
d. Was the (purse/wallet/money) on your person, for In,tance In a pocket or being held?
1 DYes} 20No
SKIP to 180
• @
(BOK 0 marked in 13f)
DYes - S~IP to 160
DNa
lIogether, what was the value of the PROPERTY that was taken?
'INTERVIEWER - Exclude stolen cosh, and enter SO for stolen Checks ond credit cards, even if they were used.
$ .[9[] b. How did you decide the value of the property that Was
stolen? (Mark all thot apply) 10 Original cOSt
Z 0 Replacement cost 3D Personal estimate of current value
40 Insurance report estimate sO Police estimate
6 0 Don't knoYi 70 Other - Speclfy _____________________ _
@ ~. What did happen? (Mark oil that apply)
I Cl Attacked 160. Was all or port of the stolon money or property recovered, except for anything received from insurance? : 0 Threatened wi th harm
3 0 At\cmpted to break into house or garage
40 Attempted to break into car s 0 Harassed, argument, abusive language
G [J Damaged or destroyed property
7 0 Attempted or threatened to damage or destroy property
a 0 Other - Specify _____________ _
SKIP to 180
@ IONone} 20 All SKIP to 170
aOPart
b. What was r •• ovored?
Cash: $ ______ • ~l and lor
" Property: (Mark all that aPPly)
-~===============L_---J@ 00 Cash only recovered - SKIP to 170 f. What was token that belonged to you or othors In 1 0 Purse
the household? What elso? r;;;;:rJ. Z 0 Wallet Cash: $ • L!!Q.j andlor 3 0 Ca .• Property: (Mark all that apply) 40 Other motor vehicle 00 Only cash taken _ SKIP to 14c 50 Part of car (hubcap, tape-deck, etc.)
10 Purse zOWaliet
60 Other - Speclfy _______________ _
30Car 40 Other motor vehicle 50 Part of car (hubcap, tape·deck, etc.)
G 0 Other - Specify
Pa,e II
c. What was the value of tha property recovered (excluding recovered cooh)?
$ . !][I
61
,-----------------_._----------

. '. . J CRIME INCIDENT QUESTIONS - Continued . E.·.,.c ..., . 170. Wos tbere ony Insurance against theft? . 200. Were the police Informed of this incidont in any way?
@ IONo I [] No ..••. }
SKIP to 180 2 [1 Don't know
3 [J Yes
b. Was this loss reported to an insurance company?
1 [lNo., ..• } SKIP to 180
2 CI Don't know
30Yes
c .. Was, any of this loss recovered through insurance?·
1 [I Not yet settled } SKIP to 180
2 [J No .• , ....
3 [1 Yes
d. How much was recovered?
INTERVIEWER - If property replaced by ,"surance company Instead of cosh settlement, ask for est,mote of value of the property replaced,
'" @)
2 0 Don't know - SKIP to Check Item G Yes - Who told them? 3 O'Household member} 40 Someone else SKIP to Check /tern G sO Police on scene
b. What was the reason this incident was not reported to the police? (Mark all that apply) I 0 Nothing could'be done - lack of proof 20 Did not think it Important enough 3D Pollee wouldn't want to be bothered 40 Did not want to take time - too inconvenient sO Private or personal matter, did not want to report It 60 Did not want to get involved 70 Afraid of reprisal 80 Reported to someone else 9 0 Other - Specify
CHECK t Is this person 16 years or older? IT ERG 0 No - SKIP to Check Item H ,,2 OYes-ASK210
@ lOS to Check Item H 210. D.~t<t~ve a i,ob at the time this incident happened?
20Ye
@ $ • ~. @ arne as described in NCS·3 items 28a-e - SKIP to . f7nl ~' What was the lob? .
180. Did any household member lose any time from work <2~.' .. Check Item H because of this incident? < 2 ,fferent than described In NCS·3 Items 28a-e
f\74\ 0 [1 No - SKIP to 190 ::> c. For whom did you work? (Nome of company, bUSiness, ~ organization or other employer)
Yes - How many members?jI & \.""'-~ d. What kind of business or industry Is this? (For example: TV
-----========-----=::...~;s:~~ ~~y...p~ ahd radio mfg., retail shoe store, State Labor Dept., f?rm)
b. How much time was lost altogether? ~ @) LI :--LI_LI_IL-_________________ _ @
~ e. Were you-
175 I [" Less than I day ~ , @ I U An omplor,e of a PRIVATE company, business or 2 [., 1-5 days Individua for wages, salary or commissions?
3 [ ; 6-10 days ~ 2 0 A GOVERNMENT employe. (Federal, State, county or local)? 3 [J SELF·EMPLOYED in OWN busine.s, prof.ss'onal
4 [~_, Over 10.days practice or farm?
5 [: 1 Don't know. 40 Working WITHOUT PAY In family business or farm?
190. Was anything damaged but not~.ln this incident? f. What kind of work were you doing? (For example: electrica: For e"ampl., was a lock or window broken, clothing engineer. stock clerk, typist. farmer) damaged, or damage done to a cor, etc.?
I ~ No - SKIP to 20a
2[~lYes
b. (Was/were) the damaged item(s) repaired or replaced?
@ 1 Ll Yes - SKIP to 19d
2 [1 No
c. How much ';ould it cost te> repair or replace the damaged item(s)?
(ill) s . []QJ } SKIP to 200 X 0 Don't know
. @
62
d. How much was the repair or replacement cost?
xL: J No cost or don't know - SKIP to 200
.[EQJ e. Who paid or will pay for the repairs or replacement?
(Mark all that apply)
I 0 Household member
• 0 Landlord
30 Insurance
40 Other - Specify
g. What were your most Important activities or duties? (For example: typing, keeping account books, seiling cars, finishing concrete, etc.)
CHECK .. ITEM H.,
CHECK ~ ITEMI ....
CHECK ~ ITEMJ .,
Page 12
Summarize this incid.nt or s~ries of incldent~,
Look at 12c on Incident Report. Is there an entry for ~'How many?" ONo o Yes -Be sure you have on Incident Report for each
HH member 12 years of age or over who was robbed, harmed. or threatened 10 thi. incident.
Is this the last Incident Report to be filled for this person? o No - Go to next Incident Report. DYes - Is this the last HH member to be interviewed?
o No - Interview next HH member • DYes - END INTERVI EW. Enter total
number of Crime Incident Reports filled for thi s household in item 13 on the caver of NC$-3.
.-----------------------------~---------------..,.

REFERENCES
Amir, Menachem. Patterns in Forcible Rape. Chicago: University of Chicago Press, 1971.
Chappell, Duncan. "Forcible Rape and the American System of Criminal Justice" in Violence and Criminal Justice, Duncan Chappell and John Monahan (eds.), Lexington, Massachusetts: Lexington Books (1975).
Chappell, Duncan and Jennifer James. "Victim Seduction and Apprehension from the Rapist's Perspective." Paper presented at the 2nd International Symposium on Victimology, Boston, Massachusetts. September 8, 1976.
Conklin, John. Robbery and the Criminal Justice System. Philadelphia: J.B. Lippincott, 1972.
Curtis, Lynn A. "Present and Future Measures of Victimization in Forcible Rape," in Sexual Assault. Marcia J. Walker and Stanley A. Brodsky (eds.). Lexington, Massachusetts: Lexington Books, 1976.
Hindelang, Michael J. Criminal Victimization in Eight American Cities. Cambridge, Massachusetts: Ballinger Publishing Company, 1976.
Kelley, Clarence M. Federal Bureau of Investigation. Crime in the United States, Washington, D.C.: Government Printing Office, 1976.
Law Enforcement Assistance Administration. San Jose Methods Test of Known Crime Victims. Washington, D.C.: Government Printing Office, 1972.
MacDonald, John M. Rape Offenders and Their Victims. Springfield, Illinois: Charles C. Thomas, 1971.
MacKellar, Jean. Rape: The Bait and the Trap. New York: Crown Publishers, Inc. 1975.
63
-

Qear Reader:
U.S DEPARTMENT OF JUSTICE LAW ENFORCEMENT ASSISTANCE ADMINISTRATION
USER EVALUATION QUESTIONNAIRE
Rape Victimiza~i()n in 26 American Cities SD-VAD-6, NCJ·55878
The Criminal Justice Research Center and the law Enforcement Assistance Administration are interested in your comments and suggestions about this report. We have provided this form for whatever opinions you wish to express about it. Please cut cut both of these pages, staple them together on one corner, and fold so that the law Enforcement Assistance Administration address appears on the outside. After folding, usa tape to seal clos1:ld. No postage stamp is necessary.
Thank you for your help.
1. For what purpose did you use this report?
2. For that purpose, the report- 0 Met most of my needs 0 Met some of my needs 0 Met none of my needs
3. How will this report be useful to youi'
o Data source o Other (please specify)
o Teaching material
o Reference for article or report o Will not be IJseful to me (please explain)
o General information
o Criminal justice program planning
~-----------------------------.--------------------------------------------------------~ 4. Which parts of the report if any, were difficult to understand or use? How could they be improved?
5. Can you point out specific parts of the text or table notes that are not clear or terms that need to be defined?
Page 1

6. Can you point out any specific statistical techniques or terminology used in this report that you feel should be more adequately explained? Ho"" could these be better explained?
7. Are there ways this report could be improved that you have not mentioned?
l 1
B. Please suggest other topics you would like to see addressed in future analytic reports using National Crime Survey victimization andlor attitude data.
Pog" 2

9. In what caoacity did you use this report?
0 Researcher
0 Educator
0 Student
0 Criminal justice ilgency employee
0 Government employee other than criminal justice· Specify
0 Other· Specify
10. If you used this report as a governmental employee, please indicate the level of government
0 Federal 0 City
0 State 0 Other· Specify
0 County
11. If you used this report as a criminal justice agency employae, please indicate the sector in which you
work.
0 Law enforcement (police) 0 Corrections
0 Legal services and prosecution 0 Parole
0 Public or private defense services 0 Criminal justice planning agency , 0 Courts or court administration 0 Other criminal justice agency· Specify type
0 Probation
12. If you used this report as a criminal justice employee, please indicate the type of position you hold.
Mark all that apply
0 Agency or institution adr(linistrator 0 Program ot project manager
0 General program planner/evaluator/analyst 0 Statistician
0 Budget planner/evaluator/analyst 0 Other· Specify .- -_._ .. --0 Operations or management planner/evaluator/analyst
~.
13. Additional comments - ,..-
,-
Page 3

OPTIONAL ... Name
Number and street
City State
(Fold here)
Telephone
( )
ZIP Code
NCJ·55878 ·SD·VAD-6
________________________________________ ~ __ u __________ ---------------------------------••
U.S. DEPARTMENT OF JUSTICE Law Enforcement AlIIIlstance Administration Walhlngton, D.C. 20531
POSTAGE AND FEES PAID U.S. DEPARTMENT OF JUSTICE
JUS-436
Director, Statistics Division National Criminal Justice Information and Statistics Service Law Enforcement Assistance Administration U.S. Department of Justice Washington, D.C. 20531
~~ -U.S.MAll -
----------------------------------------------------------------------------------------(Fold here)
Page 4

~;""~I ...................... ga .. .a"~"""BH""~'~"mB"""""~"------------'''--------------------------------~----
I I I I I I I I I I I I I I I I I I
I I I I I I I I I I t I I
NCJRS REGISTRATION
NCJ.55878 SD·VAD·6
The National Criminal Justice Reference Service (NCJRS) abstracts doclImentspublished in the criminal justice field. Persons who are registered with the Reference Service receive announcements of documents in their stated fields of interest and order fOlms for free copies of LEAA and NCJISS publications. If you are not registered with the Reference Service, and wish to be, please provide your name and mailing address below and check the appropriate box.
Fame Telephone
( ) 0 Please send me a NCJRS registration
Number and street form.
0 Plesse send me the City State ZIP Code roportlUsted
below.
~ (Fold here) .~ ___________________ n __________ u _____________________ __ a ________________________________ a-
I I I , I I I I I I
UJ 2: :::i ~ :J: le!) 2: g c:t I:) (.)
I I I I I I I I I I I I I
U.S. DEPARTMENT OF JUSTiCE. Law Enforcement Assistance Administration Washington, D.C. 20531
POSTAGE AND FEES PAID U.S. DEPARTMENT OF JUSTICE
User Services Department 2 National Criminal Justice Reference Service Law Enforcement Assistance Administration U.S. Department of Justice Box 6000 Rockville, Maryland 20850
JUS-436
~ -U.S.MAIL -
-+------------------------------------------------------~---------------~------------------I I I I I I I I ,
(Fold here)
If you wish to receive copies of any of the National Criminal Justice Information and Statistics Service reports listed inside the fron t cover, please list them below and include your r.ame and address in the space provided above.

r---~--------'----------------------------------------------------------------~,
National Criminal Justice Information and Statistics Service Reports
Sinli/le cople. are /lvalleble at no chllrge from the Nallonal Crlmrnal Justice floterence Servlco, SOl( 600Cl, Rockville, Md. 20850. Muillple copies are tor ule by the Superintendent 01 Documenta, U.S. Govllrnmsnl Prlnllng Office, Wa.hlngton, D.C. 20402.
Appllcatl~'n$ ot the National Crime Survey VlctlmlZ8~lon and Attitude Osta:
Public Opinion About Crime: The Attitudes of Victims and Nonvlctims In Selected Cities, NCJ-41336
Local Victim Surveys: A Review of the Issues, NCJ-39973 The PO~;'ie lind Public Opinion: An Analysis of Victimization and
Attitude Data from 13 American Cities. NCJ-42018 An Inlroducllon !o !lia Nallonal Crlme Survey, NCJ-43732 Compensating Vlcllms 01 Vlolenl Crime:
Potential Costs and Coverage of a National Program, NCJ-43387 Crime Agaln,t Pereona In Urben, Suburban, Bnd Rural Areaa: A
Comparative Analysis of Victimization Rates, NCJ-53551 Rape Vlcllml~atlon In 26 American ClIIes, NCJ-55878
Victimization Surveys: Criminal Vlcllmlotallon In the Unlled Stetel (annual);
A Comparison of 1975 and 1976 Findings, NCJ-44132 A Comparison of 1974 ilnd 1975 Findings, NCJ-39548 A Comparison of 1973 and 1974 Findings. NCJ-343S1 1875 (final report), NCJ-44593 1974, NCJ-39467 1973, NCJ-34732
Criminal Vlcllml:/:allon Su:-veys In Boston, NCJ-34818 New Orleans, NCJ-34825 Buffalo, NCJ-34820 Oakland, NCJ-34826 Cincinnati, NCJ-34819 Pittsburgh, NCJ-34827 Houston, NCJ-34821 San Diego, NCJ-34828 Miami, NCJ-34822 SUfi Francisco, NCJ-34829 Milwaukee, NCJ-34823 Washington, D.C. NCJ-34830 Minneapolis, NCJ-34824 (final report. 13 vols.)
Criminal Victimization Surveys In 13 American CIties (summary report, 1 voL). NCJ-18471
Public Attitudes About Crime: Boslon, NCJ-46235 N!'!w O,leans, NCJ-46242 /;Iullalo, NCJ-46236 Oakt.;:nd, NCJ-46243 Cincinnati, NCJ-46237 Pittsburgh, NCJ-46244 Houston, NCJ-46238 San DIego, NCJ-4624!l Mlam!, NCJ-46239 San FrElnclsco, NCJ-46246 Milwaukee, NC.J-46240 Washington, D.C. NCJ-46241 Minneapolis, NCJ-46241 (final report, 13 vols.)
Criminal Vlcllml:i:alfon Surveys In Chicago, Detroit, Los Angeles, New York, and Philadelphia: A Comparison 011972 and 1974 Findings, NCJ·36360
Crlr.nlnaj VI!:l1m12:.allon Surveys In the Nation's Five l.argest ClIles: National Crime Panel Surveys in Chicago. Detroit. Los Angeles. Now York. and Philadelphia. 1972. NCJ-16909
";rlmlnal VlcUmlzation Surveys in Eight American CIties: A Comparison 011971172 and 1974/75 ~indings-National Crime Surveys In Atlanta, Baltimore, Cleveland, Oallas, Denver. Newark. Portland. and 51. Louis. NCJ-36361
Crimlls and Victims: A Report C'1 the Dayton-San Jose Pilo! Survey of Victimizalion. NCJ-013314
Nallonal Prisoner Statistics: Capital Punlshmen: (annual):
1978 advance report. NCJ-19i7 (final report), NCJ-49657
Prisoners In Sta'e and Federal jnslftutlon~ (annual): December 31, V78. advance report. NCJ· December 31, Wi'? (final report). NCJ-52701
Census of State Correctional Fecl\llles, 1974: Advance Repert, NCJ-25642
Survey of Inmates of Sta!e Correctfonal Facilities, 1974: Advance Report. NCJ .. 34267
Census of Prisoners In Slate Correctional Facflflleu, 1973, NCJ-34729
Census of Jails and SUNey 01 Jail Inmates 1978: Preliminary Report. NCJ·55172
The Nallon's JaUr.: A report on the census of jails from the 1972 Survey of Inmates of tocal Jails. NCJ-19067
Survey of Inmates 01 Local Jails 1972: Advance Report, NCJ-13313
Uniform Parole Reports: Parole In the United States: 1976 and 1977, NCJ-49702
Children In Custody: Juvenile Detention and ·Correctional Facility Census
Advance Report. 1975 census. NCJ-43528 Advance Report. 1974 census. NCJ·38820 Final Report. 1973 census. NCJ-44777 Final Report. 1971 census, NCJ-13403
My\hs and Realitfes About Crime: A Nontechnical Presentation of Selected Information from the National Prisoner Stalistlcs Program and the i\Jational Crime Survey, NCJ-46249
National Survey of Court Organl:atfon; 1977 Supplement to State Judicial Systems. NCJ-40022 1975 Supplement to State Judicial Systems. NCJ-29433 1971 (full report). NCJ-11427
Slatl' Court Caseload Statistics: The State of tl-e Art. NCJ-46934 Adv€lnce A"nual Report. 1975. NCJ-51884 Annual Report. 1975. NCJ-518B5
Trenda In Expenditure and Employment Dala for the Criminal Justice System, 1971-76 (annual). NCJ-45685
Expenditure and Employment Dsta lor the Criminal Justice System (annual) 1977 tinal report. NCJ-53206
Slate and Local Probation and Parole Syslems, NCJ-41335
State and Local Prosecution and Civil Attorney Systems, NCJ-41334
Criminal Justice Agencies In Regions 1-10 (10 vols. by state). NCJ-17930-38. 15151
Dlcllonllry .:If Criminal Justice Data fermlnology: Terms and Dflfinitions Proposed for IL\erstate and National Data ColIE'ction and Ex~hange. NCJ-36747
Program I'lan for Statistics, 1977-81, NCJ-37811
Utlllzatrnn of Criminal Jusllce Statistics Project: Sourcebook of Crl-,Insl Justice Statistics 1978 (annual). NCJ-53207 Public Opln!on Regarding Crime, Criminal Justice. <lnd Related
Topice. NCJ-17419 New Directions In ProcessIng 01 Juvenile Offenders: The Denver
Model, NCJ-17420 Who Gels Detained? An Empirical AnalysiS of the Pre-Adjudicatory
Detention of Juveniles in Denver. NCJ-17417 JU'lenile Dillposmons: Social and Legal Factors Related to the
Processing of Denver Delinquency Gases. NCJ-17418 O~fillnder-aased Transaction S\atlstic~: New Directions in Data
Collection and Reporting, NCJ-29645 Sentencing 01 Ca\llorola Felony Offenders, NCJ-29646 The Judicial Processing of Aasault and Burglary Offenders
ir Selected Calilorn.;a Counties. NCJ-29644 1>re-AdJudlcatory Detention In Three Juvenile Courts, NCJ-34730 Delinquency Disposllions: An Empirical Analysis of PrGcessing
Decisions in ThreE' Juvenile Courts, NCJ-34734 The Pallerns and Dlstrlbullon 01 Assault Incident CharacterlsllcG
Among Social Areas. NC J-40025 Patterns 01 Robbery Characlerlslfcs and Their Occurrence Among
Social Areas. NCJ-40026 l.i'lme·Speclflc Analysis:
The Characteristics of Burglary Incidents. NCJ-42093 An Erolpirical Examination of Burglary Olfender Characteristics
NCJ-43131 An Empirical Examination of Burglary Offenders and Offense
-Characteristics. NCJ-42476 Sources of National Criminal Justice Stallsllcs: An Annotated
Bibliography. NCJ-45006 F~deral Criminal SentenCing: Perspectives of AnalysiS and a DeSign
for Research. NCJ-33683 Variations In Federal Criminal Sentenc~s:
A Statistical Assessment at the National Level, NCJ-33684 Federal SentenCing Patterns: A Study of Geographical Variations
NCJ-33685 ' Predlctfnn Sentences In Federal Courts: The Feasibility of a National
Sentencing Policy. NCJ-33686
t-____ -" .... ___ -. ........... __ ' ... , :_. ____ iOII~_:.t:'li __________ .... _______________ _

----------------------------__________ um __ ~.u __ ~a. ____ ~ ...... , .... aa .............. T ........... uaa
I I , !