E UROPEAN UROLOGY XXX (2017) XXX–XXX · by XXX on pp. x-y of this issue Diagnostic Performance of...
11
Platinum Priority – Prostatic Disease Editorial by XXX on pp. x-y of this issue Diagnostic Performance of Magnetic Resonance Imaging for the Detection of Bone Metastasis in Prostate Cancer: A Systematic Review and Meta-analysis Sungmin Woo a,1 , Chong Hyun Suh b,c,1 , Sang Youn Kim a, *, Jeong Yeon Cho a,d , Seung Hyup Kim a,d a Department of Radiology, Seoul National University College of Medicine, Seoul, Korea; b Department of Radiology and Research Institute of Radiology, University of Ulsan College of Medicine, Asan Medical Center, Seoul, Republic of Korea; c Department of Radiology, Namwon Medical Center, Jeollabuk-do, Republic of Korea; d Institute of Radiation Medicine and Kidney Research Institute, Seoul National University Medical Research Center, Seoul, Korea E U R O P E A N U R O L O G Y X X X ( 2 0 1 7 ) X X X – X X X ava ilable at www.sciencedirect.com journa l homepage: www.europea nurology.com Article info Article history: Accepted March 28, 2017 Associate Editor: Giacomo Novara Keywords: Magnetic resonance imaging Prostate cancer Bone metastasis Systematic review Meta-analysis Abstract Context: Magnetic resonance imaging (MRI) has been tested for detecting bone metas- tasis and has shown promising results. Yet, consensus has not been reached regarding whether it can replace the role of bone scintigraphy in this clinical setting or not. Objective: To review the diagnostic performance of contemporary (1.5 T) MRI for the detection of bone metastasis in patients with prostate cancer. Evidence acquisition: MEDLINE and EMBASE were searched up to January 22, 2017. We included studies that used MRI using 1.5-T scanners for the detection of bone metastasis in patients with prostate cancer, using histopathology or best value com- parator as the reference standard. Two independent reviewers assessed the methodo- logical quality using the Quality Assessment of Diagnostic Accuracy Studies-2 tool. Per- patient sensitivity and specificity of included studies were calculated, and pooled and plotted in a hierarchical summary receiver operating characteristic plot. Meta-regres- sion and sensitivity analyses were performed. Evidence synthesis: Ten studies (1031 patients) were included. Pooled sensitivity was 0.96 (95% confidence interval [CI] 0.87–0.99) with a specificity of 0.98 (95% CI 0.93– 0.99). At meta-regression analysis, only the number of imaging planes (2 vs 1) was a significant factor affecting heterogeneity (p < 0.01). Sensitivity analyses showed that specificity estimates were comparable and consistently high across all subgroups, but sensitivity estimates demonstrated some differences. Studies using two or more planes (n = 4) had the highest sensitivity (0.99 [95% CI 0.98–1.00]). Conclusions: Contemporary MRI shows excellent sensitivity and specificity for detec- tion of bone metastasis in patients with prostate cancer. Using two or more imaging planes may further improve sensitivity. However, caution is needed in applying our results due to the heterogeneity among the included studies. Patient summary: We reviewed studies using contemporary magnetic resonance im- aging (MRI) for the detection of bone metastasis in prostate cancer patients. MRI shows excellent diagnostic performance in finding patients with bone metastasis. # 2017 European Association of Urology. Published by Elsevier B.V. All rights reserved. 1 These authors contributed equally. * Corresponding author. Department of Radiology, Seoul National University Hospital, 101 Daehak- ro, Jongno-gu, Seoul 110-744, Korea. Tel. +82 2 2072 4897; Fax: +82 2 743 6385. E-mail address: [email protected] (S.Y. Kim). EURURO-7324; No. of Pages 11 Please cite this article in press as: Woo S, et al. Diagnostic Performance of Magnetic Resonance Imaging for the Detection of Bone Metastasis in Prostate Cancer: A Systematic Review and Meta-analysis. Eur Urol (2017), http://dx.doi.org/10.1016/ j.eururo.2017.03.042 http://dx.doi.org/10.1016/j.eururo.2017.03.042 0302-2838/# 2017 European Association of Urology. Published by Elsevier B.V. All rights reserved.
Transcript of E UROPEAN UROLOGY XXX (2017) XXX–XXX · by XXX on pp. x-y of this issue Diagnostic Performance of...

EURURO-7324; No. of Pages 11
Platinum Priority – Prostatic DiseaseEditorial by XXX on pp. x-y of this issue
Diagnostic Performance of Magnetic Resonance Imaging for the
Detection of Bone Metastasis in Prostate Cancer: A Systematic
Review and Meta-analysis
Sungmin Woo a,1, Chong Hyun Suh b,c,1, Sang Youn Kim a,*, Jeong Yeon Cho a,d, Seung Hyup Kim a,d
a Department of Radiology, Seoul National University College of Medicine, Seoul, Korea; b Department of Radiology and Research Institute of Radiology,
University of Ulsan College of Medicine, Asan Medical Center, Seoul, Republic of Korea; c Department of Radiology, Namwon Medical Center, Jeollabuk-do,
Republic of Korea; d Institute of Radiation Medicine and Kidney Research Institute, Seoul National University Medical Research Center, Seoul, Korea
E U R O P E A N U R O L O G Y X X X ( 2 0 1 7 ) X X X – X X X
ava i lable at www.sc iencedirect .com
journa l homepage: www.europea nurology.com
Article info
Article history:
Accepted March 28, 2017
Associate Editor:
Giacomo Novara
Keywords:
Magnetic resonance imaging
Prostate cancer
Bone metastasis
Systematic review
Meta-analysis
Abstract
Context: Magnetic resonance imaging (MRI) has been tested for detecting bone metas-tasis and has shown promising results. Yet, consensus has not been reached regardingwhether it can replace the role of bone scintigraphy in this clinical setting or not.Objective: To review the diagnostic performance of contemporary (�1.5 T) MRI for thedetection of bone metastasis in patients with prostate cancer.Evidence acquisition: MEDLINE and EMBASE were searched up to January 22, 2017. Weincluded studies that used MRI using �1.5-T scanners for the detection of bonemetastasis in patients with prostate cancer, using histopathology or best value com-parator as the reference standard. Two independent reviewers assessed the methodo-logical quality using the Quality Assessment of Diagnostic Accuracy Studies-2 tool. Per-patient sensitivity and specificity of included studies were calculated, and pooled andplotted in a hierarchical summary receiver operating characteristic plot. Meta-regres-sion and sensitivity analyses were performed.Evidence synthesis: Ten studies (1031 patients) were included. Pooled sensitivity was0.96 (95% confidence interval [CI] 0.87–0.99) with a specificity of 0.98 (95% CI 0.93–0.99). At meta-regression analysis, only the number of imaging planes (�2 vs 1) was asignificant factor affecting heterogeneity (p < 0.01). Sensitivity analyses showed thatspecificity estimates were comparable and consistently high across all subgroups, butsensitivity estimates demonstrated some differences. Studies using two or more planes(n = 4) had the highest sensitivity (0.99 [95% CI 0.98–1.00]).Conclusions: Contemporary MRI shows excellent sensitivity and specificity for detec-tion of bone metastasis in patients with prostate cancer. Using two or more imagingplanes may further improve sensitivity. However, caution is needed in applying ourresults due to the heterogeneity among the included studies.Patient summary: We reviewed studies using contemporary magnetic resonance im-aging (MRI) for the detection of bone metastasis in prostate cancer patients. MRI showsexcellent diagnostic performance in finding patients with bone metastasis.
soc
ute. De0-74v@e
# 2017 European As
1 These authors contrib* Corresponding authorro, Jongno-gu, Seoul 11E-mail address: iwishlu
Please cite this article in press as: Woo S, et al. Diagnostic PerformMetastasis in Prostate Cancer: A Systematic Review and Mj.eururo.2017.03.042
http://dx.doi.org/10.1016/j.eururo.2017.03.0420302-2838/# 2017 European Association of Urology. Published by Elsevier
iation of Urology. Published by Elsevier B.V. All rights reserved.
d equally.partment of Radiology, Seoul National University Hospital, 101 Daehak-4, Korea. Tel. +82 2 2072 4897; Fax: +82 2 743 6385.mpas.com (S.Y. Kim).
ance of Magnetic Resonance Imaging for the Detection of Boneeta-analysis. Eur Urol (2017), http://dx.doi.org/10.1016/
B.V. All rights reserved.

E U R O P E A N U R O L O G Y X X X ( 2 0 1 7 ) X X X – X X X2
EURURO-7324; No. of Pages 11
1. Introduction
Determining the presence of bone metastasis is important
in the management of prostate cancer. It not only represents
the most common site of initial metastases, but also is a
major cause of morbidity and mortality in patients with
prostate cancer. Therefore, it is crucial to accurately detect
bone metastasis in order to plan the most optimal
management for patients with prostate cancer [1]. Current-
ly, Tc 99m bone scintigraphy (BS) is recommended by
guidelines as the initial work-up modality for bone
metastasis despite its poor accuracy, because it is widely
available compared with more advance modalities [2]. How-
ever, magnetic resonance imaging (MRI) has continuously
been tested for the purpose of detecting bone metastasis
during the past 3 decades and has shown promising results
[3]. Recent studies have shown that axial skeleton MRI,
whole-body MRI, and even routine prostate MRI are
excellent in determining bone metastasis in patients with
prostate cancer [4–6]. Yet, consensus has not been reached
regarding whether it can replace the role of BS in this
clinical setting or not.
Therefore, we performed a systematic review and meta-
analysis to evaluate the diagnostic performance of contem-
porary MRI for the detection of bone metastasis in patients
with prostate cancer.
2. Evidence acquisition
The present meta-analysis was written according to the
Preferred Reporting Items for Systematic Reviews and
Meta-Analyses guidelines. The research question for the
purpose of this meta-analysis was formulated based on
the following Patient Index test Comparator Outcomes
Study design (PICOS) criteria [7]: What is the diagnostic
performance of contemporary MRI (magnetic field
strength �1.5 T) for the detection of bone metastasis in
patients with prostate cancer, as compared with histo-
pathological results or best value comparator (BVC; a
combination of imaging/clinical/biological studies and at
least 6 mo of follow-up)?
2.1. Literature search
A computerized search of MEDLINE and EMBASE databases
up to January 22, 2017 was performed to identify studies
that were relevant to our research question. The search
query combined synonyms for prostate cancer, MRI, bone,
and diagnostic accuracy as follows: ([‘‘prostat* cancer’’] OR
[‘‘prostat* carcinoma’’] OR [‘‘prostat* neoplasm’’] OR [‘‘pro-
stat* tumor’’]) AND ([bone] OR [skeletal]) AND ([‘‘magnetic
resonance imaging’’] OR [‘‘MR imaging’’] OR [MRI] OR [MR])
AND ([detection] OR [detectability] OR [positivity] OR
[sensitivity] OR [specificity] OR [diagnosis] OR [diagnostic]
OR [accuracy] OR [performance]). Bibliographies of identi-
fied articles were screened to identify additional relevant
studies. The search was limited to studies on ‘‘humans’’
using the ‘‘English’’ language.
Please cite this article in press as: Woo S, et al. Diagnostic PerformMetastasis in Prostate Cancer: A Systematic Review and Mj.eururo.2017.03.042
2.2. Study selection
2.2.1. Inclusion criteria
We included studies that met the following PICOS criteria
(10): (1) patients diagnosed with prostate cancer, (2) MRI
used as the index test for detection of bone metastasis, (3)
histopathology or BVC as the reference standard for
comparison, (4) sufficient information to reconstruct
2 � 2 contingency tables regarding sensitivity and specific-
ity, and (5) publication type of original articles.
2.2.2. Exclusion criteria
The exclusion criteria were as follows: (1) study population
of <10 patients; (2) study population comprising patients
with tumors other than prostate cancer (however, studies
were included if the diagnostic performance was separately
provided for each type of tumor); (3) review articles,
guidelines, consensus statements, letters, editorials, and
conference abstracts; (4) MRI with a magnetic field strength
of <1.5 T; (5) MRI used for the detection of bone metastasis
in prostate tumor, but focusing on topics rather than on
diagnostic accuracy; (6) overlapping patient population;
and (7) insufficient data for the reconstruction of
2 � 2 tables. In case of an overlapping study population,
the study with the largest study population was included.
Authors of the studies were contacted for provision of
further information when 2 � 2 tables could not be
reconstructed.
The literature search and study selection process was
independently performed by two reviewers (S.W. and
C.H.S., with 4 yr of experience in performing systematic
reviews and meta-analyses) with consultation from a third
reviewer (S.Y.K.) for reaching a consensus when disagree-
ment was present.
2.3. Data extraction and quality assessment
The following data were extracted from the selected studies
using a standardized form: (1) patient characteristics—
number of patients, number of patients with bone
metastasis, clinical setting (newly diagnosed vs treated
and risk stratification of bone metastasis according to
clinical criteria), median age and range of patients, prostate-
specific antigen (PSA) level, PSA doubling time, Gleason
score (based on biopsy and radical prostatectomy [RP]
specimens in primary and treated prostate cancer, respec-
tively), and clinical T stage (pathological T stage in post-RP
patients); (2) study characteristics—origin of study
(authors, institution, and duration of patient recruitment),
publication year, study design (prospective vs retrospective,
multicenter vs single center, and consecutive vs noncon-
secutive enrollment), reference standard, interval between
MRI and reference standard, blinding to reference standard,
and characteristics of readers (number and experience);
and (3) MRI characteristics—magnet field strength; scanner
model and manufacturer; coverage of MRI (whole body,
axial skeleton or pelvis [as included in routine prostate
multiparametric MRI]); type of MRI sequences used among
diffusion-weighted imaging (DWI), contrast-enhanced (CE)
ance of Magnetic Resonance Imaging for the Detection of Boneeta-analysis. Eur Urol (2017), http://dx.doi.org/10.1016/
E U R O P E A N U R O L O G Y X X X ( 2 0 1 7 ) X X X – X X X 3
EURURO-7324; No. of Pages 11
MRI, T1-weighted imaging (T1WI), T2-weighted imaging
(T2WI), or short tau inversion recovery (STIR), and their
corresponding technical parameters; and criteria for bone
metastasis.
The methodological quality of the included studies was
assessed using the Quality Assessment of Diagnostic
Accuracy Studies-2 (QUADAS-2) tool [8]. Data extraction
and quality assessment were performed independently by
two reviewers (S.W. and C.H.S.), and consensus was reached
via discussion with a third reviewer (S.Y.K.).
2.4. Data synthesis and analysis
The primary outcome of this meta-analysis was the per-
patient diagnostic performance of MRI for the detection of
bone metastasis in patients with prostate cancer. As a
secondary outcome, we aimed to assess the presence of
heterogeneity among the included studies and explore
potential causes.
Two by two tables were tabulated for the included
studies to calculate their sensitivity and specificity. If
diagnostic performance of several MRI sequences were
separately assessed, we selected the results using the most
advanced MRI sequence or most comprehensive MRI
protocol (ie, DWI + conventional sequences > DWI >
conventional sequences). When results from multiple
independent readers were given, the result with the highest
accuracy was used. Of note, although one study included in
our meta-analysis [9] assessed bone metastasis on a per-
lesion basis, it was analyzed as per-patient for the following
reasons: (1) this was the only study not providing per-
patient diagnostic performance and (2) the mean number of
lesions per patient in this study was 1.1 (26/24).
Summary estimates of sensitivity and specificity were
calculated using hierarchical logistic regression modeling
including bivariate and hierarchical summary receiver
operating characteristic (HSROC) modeling [10–12]. These
results were plotted using HSROC curves with 95%
confidence and prediction regions. Publication bias was
evaluated using visual analysis of the Deeks et al’s funnel
plot and calculating the p value using Deeks et al’s
asymmetry test [13].
Heterogeneity was determined using the following: (1)
Cochran’s Q test with p < 0.05 indicating the presence of
heterogeneity; (2) Higgins I2 test with the following criteria
for the interpretation of the degree of heterogeneity:
inconsistency index (I2) = 0–40%, heterogeneity might not
be important; 30–60%, moderate heterogeneity may be
present; 50–90%, substantial heterogeneity may be present;
and 75–100%, considerable heterogeneity [14]; and (3)
testing for the presence of a threshold effect (a positive
correlation between sensitivity and false positive rate)
among the selected studies.
Meta-regression analyses using several covariates were
performed to explore the cause of heterogeneity as follows:
(1) clinical setting (newly diagnosed vs treated), (2)
reference standard (BVC only vs inclusion of histopatholo-
gy), (3) magnet field strength (1.5 vs 3 T), (4) MRI coverage
(pelvis vs axial skeleton/whole body), (5) MRI sequence
Please cite this article in press as: Woo S, et al. Diagnostic PerformMetastasis in Prostate Cancer: A Systematic Review and Mj.eururo.2017.03.042
(only conventional sequences vs DWI included), (6) number
of imaging planes (1 vs �2), and (7) minimum slice
thickness among sequences used (�4 vs >4 mm). In
addition, sensitivity analyses for the various settings
stratified to the covariates described above were performed.
The ‘‘midas’’ module in Stata 10.0 (StataCorp LP, College
Station, TX, USA) and ‘‘mada’’ package in R software version
3.2.1 (R Foundation for Statistical Computing, Vienna,
Austria) were used for statistical analyses, with
p < 0.05 indicating statistical significance.
3. Evidence synthesis
3.1. Literature search
The systematic literature search initially yielded 1689 arti-
cles. After removing 697 duplicates, screening of the
992 titles and abstracts yielded 46 potentially eligible
original articles. Full-text reviews were considered and
36 studies were excluded due to the following reasons: not
in the field of interest (n = 21), insufficient data to
reconstruct 2 � 2 tables (n = 9), <10 patients (n = 2), study
population shared with other studies (n = 3), and non-
English publication (n = 1). Ultimately, 10 studies including
1031 patients evaluating the diagnostic performance of MRI
for the detection of bone metastasis in patients with
prostate cancer were included in this meta-analysis [4–
6,9,15–20]. The study selection process is summarized in
Figure 1.
3.2. Characteristics of included studies
The patient characteristics are described in Table 1. The size
of the study population ranged from 21 to 308 patients,
with the percentage of patients with bone metastasis
ranging from 6.8% to 71.4%. Four studies included only
patients with newly diagnosed prostate cancer, three
included only those with treated prostate cancer, and three
included a mixed population of newly diagnosed and
treated prostate cancer. The patients had a median age of
63–78 yr. Six studies were based on patients with a
clinically ‘‘high risk’’ of bone metastasis, two studies
included patients with any risk, and two studies were
unclear regarding this risk. The median PSA and Gleason
scores were 2.7–31 ng/ml and 7–9, respectively.
The study characteristics are summarized in Table 2. The
study design was prospective in six studies and retrospec-
tive in four. All but two studies were single-center studies.
Patient recruitment was consecutive in all but two studies
(nonconsecutive 1:3 matching for normal and metastasis in
one study and not explicit in another). Four studies used
either histopathology or BVC as the reference standard;
while the other six used only BVC. The imaging modalities
used in the included studies for BVC included BS, targeted x-
ray, computed tomography (CT), MRI, and positron emis-
sion tomography/CT. The interval between MRI and the
reference standard was not provided in three studies. MRI
was interpreted blinded to the reference standard in all but
one study, which was not explicit.
ance of Magnetic Resonance Imaging for the Detection of Boneeta-analysis. Eur Urol (2017), http://dx.doi.org/10.1016/

Fig. 1 – Flow diagram showing study selection process for meta-analysis. MRI = magnetic resonance imaging.
E U R O P E A N U R O L O G Y X X X ( 2 0 1 7 ) X X X – X X X4
EURURO-7324; No. of Pages 11
The MRI characteristics are shown in Table 3. Six studies
used 3-T scanners, two used 1.5-T scanners, and two used
1.5- or 3-T scanners. Regarding coverage of MRI, four
studies used whole-body MRI, two assessed the axial
skeleton, and four covered only the pelvis using a routine
prostate MRI protocol. A combination of DWI and conven-
tional sequences (T1WI, T2WI, and/or STIR) was used in five
studies, only DWI in one study, and only conventional
sequences in four studies. The criteria for bone metastasis
were explicit in seven studies; however, three studies were
not clear on this issue as one study was not explicit
regarding the role of T1WI and STIR, another study did not
provide any criteria, and the other simply stated the use of a
five-point Likert scale.
3.3. Quality assessment
Overall, the quality of the studies was considered moderate,
with eight of the 10 studies satisfying at least four of the
seven QUADAS-2 domains (Fig. 2). Regarding the patient
selection domain, one study was considered to have a high
risk of bias due to a nonconsecutive case/control design
[19]. In addition, one study was considered to have an
unclear risk of bias, as it did not explicitly mention whether
patient enrollment was consecutive or not [9]. There was
high concern for applicability in one study, as it included
patients with no metastasis or oligometastasis (<5 metas-
tases) based on conventional imaging and excluding those
with polimetastasis [15]. Regarding the index test domain,
there was an unclear risk of bias in four studies, as it was
unclear whether MRI was evaluated blinded to the
reference standard in one study [9] and whether a
prespecified threshold was used in three studies
[15,16,19]. There was low concern for applicability in all
Please cite this article in press as: Woo S, et al. Diagnostic PerformMetastasis in Prostate Cancer: A Systematic Review and Mj.eururo.2017.03.042
10 studies. Regarding the reference standard domain, all the
studies had an unclear risk of bias, as it was unclear whether
the derivation of the reference standard was blinded to MRI.
There was unclear concern for applicability in three studies,
as they did not explicitly mention whether MRI–reference
standard interval was at least 6 mo when BVC was used as
the reference standard [6,15,20]. Regarding the flow and
timing domain, three studies had a high risk of bias as
different reference standards were applied within the study
[4,6,16,19]. Two studies were considered to have an unclear
risk of bias as the MRI–reference standard interval was not
provided [15,20].
3.4. Diagnostic accuracy
The sensitivity and specificity of the 10 individual studies
were 72–100% and 70–100%, respectively. Although the
Cochran’s Q test suggested that heterogeneity was not
present (Q = 2.970, p = 0.113), the Higgins I2 statistics
demonstrated substantial heterogeneity with regard to
both sensitivity (I2 = 81.44%) and specificity (I2 = 85.85%).
No threshold effect was shown upon visualization of the
coupled forest plot of sensitivity and specificity (Fig. 3), with
a correlation coefficient between sensitivity and false
positive rate of –0.581 (95% confidence interval [CI] –
0.886 to 0.077).
For all 10 studies combined, the pooled sensitivity and
specificity were 0.96 (95% CI 0.87–0.99) and 0.98 (95% CI
0.93–0.99), respectively. In the HSROC curve, there was a
large difference between the 95% confidence and prediction
regions, additionally indicating that heterogeneity was
present between the studies (Fig. 4). The area under the
HSROC curve was 0.99 (95% CI 0.98–1.00). According to the
Deeks et al’s [13] funnel plot, the likelihood of publication
ance of Magnetic Resonance Imaging for the Detection of Boneeta-analysis. Eur Urol (2017), http://dx.doi.org/10.1016/

Ta
ble
1–
Pa
tie
nt
cha
ract
eri
stic
s
Firs
ta
uth
or
No
.o
fp
ati
en
tsC
lin
ica
lse
ttin
gA
ge
PS
AP
SA
-DT
aC
lin
ica
lT
sta
ge
Gle
aso
nsc
ore
To
tal
(n)
Me
tast
asi
s(n
)M
eta
sta
sis
(%)
Ne
wo
rtr
ea
ted
Ris
ko
fb
on
em
eta
sta
sis
Me
dia
nR
an
ge
Me
dia
nR
an
ge
Me
dia
nR
an
ge
Me
dia
nR
an
ge
Me
dia
nR
an
ge
Co
nd
e-M
ore
no
[15
]3
52
57
1.4
Tre
ate
dU
ncl
ea
rb
70
52
–8
01
24
.54
–7
5.8
6N
RN
RT
3a
T1
–T
47
5–
9
Kit
aji
ma
[16
]9
51
61
6.8
Tre
ate
dU
ncl
ea
rc
65
.74
9–
87
2.7
0.5
8–
68
.3N
RN
RN
RN
R7
2–
10
Leco
uv
et
[4]
66
41
62
.1M
ixe
dH
igh
74
46
–8
5N
RN
RN
R�
12
NR
NR
NR
NR
Leco
uv
et
[5]
10
06
86
8.0
Mix
ed
Hig
h6
9d
53
–8
83
2e
12
–7
8e
5.4
/6.7
1.2
–1
1.6
�T
3b
NR
�8
NR
Mo
sav
i[1
7]
49
51
0.2
Ne
wly
dia
gn
ose
dH
igh
67
57
–8
01
41
.3–
95
0N
/AN
AT
3T
1c–
T4
98
–1
0
Pa
sog
lou
[18
]3
01
03
3.3
Mix
ed
Hig
h6
9d
NR
31
dN
RN
R�
12
NR
NR
NR
NR
Pic
card
o[9
]2
16
28
.6T
rea
ted
Hig
h7
87
0–
85
4.9
2.2
–1
3.4
NR
NR
NR
NR
87
–9
Va
rga
s[1
9]
22
85
72
5.0
Ne
wly
dia
gn
ose
dA
ny
63
36
–8
36
.30
.4–
22
2N
/AN
AT
1c
T1
c–T
47
6–�
8
Ve
nk
ita
ram
an
[20
]9
91
41
4.1
Ne
wly
dia
gn
ose
dH
igh
66
44
–8
32
6.5
2–
16
00
N/A
NA
NR
NR
76
–1
0
Wo
o[6
]3
08
21
6.8
Ne
wly
dia
gn
ose
dA
ny
68
.5d
38
–9
13
0.9
d1
.2–
95
5.5
N/A
NA
NR
NR
76
–1
0
N/A
=n
ot
av
ail
ab
le;
NR
=n
ot
rep
ort
ed
;P
SA
=p
rost
ate
-sp
eci
fic
an
tig
en
;P
SA
-DT
=p
rost
ate
-sp
eci
fic
an
tig
en
do
ub
lin
gti
me
;R
P=
rad
ica
lp
rost
ate
cto
my
.a
For
tre
ate
dp
ati
en
ts.
bN
om
eta
sta
sis
or
oli
go
me
tast
asi
sb
ase
do
nco
nv
en
tio
na
lim
ag
ing
.c
Cli
nic
all
ysu
spe
cte
dre
curr
en
cea
fte
rR
P.
dM
ea
n.
eFo
rn
ew
lyd
iag
no
sed
pro
sta
teca
nce
rp
ati
en
ts.
E U R O P E A N U R O L O G Y X X X ( 2 0 1 7 ) X X X – X X X 5
EURURO-7324; No. of Pages 11
Please cite this article in press as: Woo S, et al. Diagnostic PerformMetastasis in Prostate Cancer: A Systematic Review and Mj.eururo.2017.03.042
bias was low, with a p value of 0.23 for slope coefficient
(Fig. 5).
3.5. Exploration of heterogeneity
The results of meta-regression analyses are shown in
Table 4. Only the number of imaging planes used was shown
to be a significant factor affecting heterogeneity (p < 0.01).
Specifically, sensitivity was significantly higher when using
two or more imaging planes (0.99 [95% CI 0.98–1.00])
compared with when using only one plane (0.87 [95% CI
0.80–0.94], p < 0.01). Although specificity also showed
‘‘statistically’’ higher values when using two or more planes,
the difference was not considered meaningful: 0.99 (95% CI
0.98–1.00) versus 0.95 (95% CI 0.90–1.00; p = 0.01). Other-
wise, clinical setting, reference standard, magnet field
strength, MRI coverage, type of MRI sequences used, and
minimum slice thickness were not shown to be significant
factors affecting the heterogeneity.
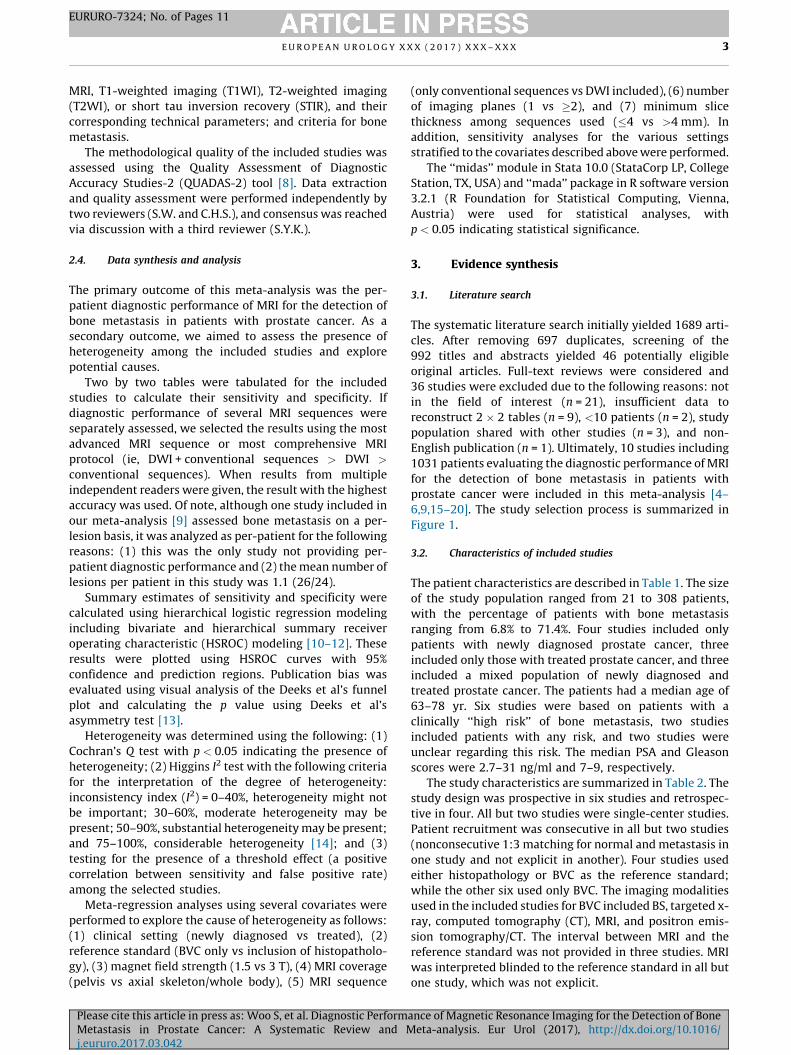
The results of sensitivity analyses are shown in
Figure 6. The specificity estimates were comparable with
consistently high values across all subgroups (0.91–0.99). In
general, the sensitivity estimates were also comparable
across most subgroups with pooled sensitivity ranging from
0.93 to 1.00; however, a few subgroups showed slightly
lower pooled sensitivity. Specifically, studies that included
only patients with treated prostate cancer (0.89 [95% CI
0.74–1.00]), used both 1.5- or 3-T scanners (0.89 [95% CI
0.80–0.94]), and used only one imaging plane for analysis
(0.87 [95% CI 0.80–0.94]) tended to show lower sensitivity.
However, pooling the results for studies including patients
with any risk and those using both 1.5- or 3-T scanners were
considered unstable as only two studies were included in
these subgroups. In addition, when a sensitivity analysis
was performed using nine studies, excluding a single study
[15] that (1) was considered to have high concern for
applicability regarding patient selection and (2) showed
particularly inferior diagnostic performance in terms of
both sensitivity and specificity, the degree of heterogeneity
was substantially decreased (I2 = 57.14 and 75.64 for
sensitivity and specificity, respectively) with sensitivity of
0.97 (95% CI 0.89–0.99) and 0.98 (95% CI 0.95–0.99).
3.6. Discussion
In the current meta-analysis, we evaluated the diagnostic
accuracy of contemporary MRI (using scanners with a
magnetic field strength of 1.5 T or higher) for the detection of
bone metastasis in patients with prostate cancer. Our results
show that the pooled per-patient sensitivity and specificity
of the 10 included studies were 0.96 (95% CI 0.87–0.99) and
0.98 (95% CI 0.93–0.99), respectively. Based on this excellent
diagnostic performance of MRI for the detection of bone
metastasis, MRI could be used as one of the primary
modalities for triaging patients with newly diagnosed or
treated prostate cancer and to help decide on the most
optimal management. Although we did not directly compare
the performance between MRI and BS, which would be best
addressed by well-designed randomized controlled trials,
ance of Magnetic Resonance Imaging for the Detection of Boneeta-analysis. Eur Urol (2017), http://dx.doi.org/10.1016/

Table 2 – Study characteristics
First author Origin of study Study design Reference standard Blinding Reader characteristics
Publication
year
Duration
of patient
recruitment
Institution Prospective Multicenter Consecutive
enrollment
Methods Details of BVC MRI–reference
standard
interval
No. Consensus Experience
(yr)
Conde-Moreno [15] 2016 10.2014–3.2015 Consorcio
Hospitalario
Provincial de
Castellon
Yes No Yes BVC All imaging studies (BS, CT, WB-
DW-MRI, choline-PET/CT) by a
multidisciplinary team
NR Yes NR NR NR
Kitajima [16] 2014 6.2009–4.2012 Mayo Clinic No No Yes BVC or
histopathology
Dedicated CT, MRI, or PET–CT
and follow-up after 6 mo
NR Yes 2 Independent 22/2
Lecouvet [4] 2007 NR a Cliniques
universitaires
Saint Luc
Yes No Yes BVC or
histopathology
CT correlation for equivocal MRI
findings or imaging (BS, MRI),
clinical, and biological follow-
up at 6 mo by specialists for
each modality
NR Yes 2 Consensus Senior MSK
radiologist/
senior resident
Lecouvet [5] 2012 3.2007–3.2010 Cliniques
universitaires
Saint Luc
Yes No Yes BVC All available imaging tests (BS/
TXR, WB-MRI) and clinical/
biological follow-up after 6 mo
by specialists for each modality
NR Yes 2 Independent Senior MSK
radiologist/
fellow
Mosavi [17] 2012 10.2009–3.2011 Uppsala
University
Hospital
Yes No Yes BVC BS, MRI (T1WI, STIR), and
follow-up using 18F-NaF PET/CT
and DWI
�7 mo Yes 2 Consensus 20
Pasoglou [18] 2015 2.2012–12.2012 Cliniques
universitaires
Saint Luc,
Centre
Hospitalier
Universitaire
Vaudois
Yes Yes Yes BVC Consensus session of all
available MRI by radiologists,
prospective clinical and
biological follow-up by uro-
oncologist, and imaging follow-
up at 6 mo
NR Yes NR NR NR
Piccardo [9] 2014 NR E.O. Galliera
Hospital, Azienda
Sanitaria dell’Alto
Adige
Yes Yes NR BVC Contrast-enhanced CT and
multiparametric MRI at 12 mo
follow-up, and response to
treatment, lab tests, other
imaging studies (x-ray, BS)
12–18 mo NR NR NR NR
Vargas [19] 2016 1.2000–6.2014 Memorial Sloan
Kettering
Cancer Center
No No No BVC or
histopathology
At least 1 yr or imaging/clinical
follow-up
>1 yr Yes 2 Independent 5/7
Venkitaraman [20] 2009 1.2001–10.2005 Royal Marsden
Hospital
No No Yes BVC MRI, BS, or other imaging (TXR,
CT) and follow-up studies (BS or
MRI) assessing treatment
response
NR Yes 1 NR
Woo [6] 2016 1.2013–12.2013 Seoul National
University Hospital
No No Yes BVC or
histopathology
Comprehensive review of initial
and follow-up BS, MRI, CT, TXR,
and PET, and clinical/laboratory
follow-up at a multidisciplinary
urological–oncological
conference
NR Yes 2 Independent 20/34
BS = bone scintigraphy; BVC = best value comparator; CT = computed tomography; DW = diffusion weighted; DWI = diffusion-weighted imaging; MRI = magnetic resonance imaging; MSK = musculoskeletal; NR = not
reported; PET = positron emission tomography; STIR = short tau inversion recovery; TXR = targeted x-ray; T1WI = T1-weighted imaging; WB = whole body.a Duration of patient recruitment not reported, but overlap with Lecouvet et al [5] (3.2007–3.2010) not possible.
E U
R O
P E
A N
U
R O
L O
G Y
X
X X
(
2 0
1 7
)
X X
X –
X X
X6 E
UR
UR
O-7
32
4;
No
. o
f P
ag
es
11
Ple
ase
cite th
is a
rticle in
pre
ss a
s: W
oo
S,
et
al.
Dia
gn
ostic
Pe
rform
an
ce o
f M
ag
ne
tic R
eso
na
nce
Ima
gin
g fo
r th
e D
ete
ction
of
Bo
ne
Me
tasta
sis
in
Pro
state
C
an
cer:
A
S
yste
ma
tic
Re
vie
w
an
d
Me
ta-a
na
lysis.
E
ur
U
rol
(2
01
7),
h
ttp://d
x.d
oi.o
rg/1
0.1
01
6/
j.eu
ruro
.20
17
.03
.04
2

Ta
ble
3–
MR
Ich
ara
cte
rist
ics
Firs
ta
uth
or
Ma
gn
et
stre
ng
th
(T)
Ve
nd
or
Ma
chin
eC
ov
era
ge
Se
qu
en
ceu
sed
No
.o
f
ima
gin
g
pla
ne
s
Min
imu
m
ST
(mm
)
Ex
pli
cit
MR
I
crit
eri
a
DW
IT
1W
IT
2W
IS
TIR
Ima
gin
g
pla
ne
ST
(mm
)B
va
lue
s
(s/m
m2)
Ima
gin
g
pla
ne
ST
(mm
)Im
ag
ing
pla
ne
ST
(mm
)Im
ag
ing
pla
ne
ST
(mm
)
Co
nd
e-M
ore
no
[15
]1
.5S
iem
en
sM
ag
ne
tom
Av
an
toW
ho
leb
od
yD
WI/
T1
WI/
ST
IR1
5N
oA
55
0,
90
0A
5/N
RA
5/N
R
Kit
aji
ma
[16
]1
.5o
r3
GE
MR
75
0,
Sig
na
Pe
lvis
DW
I/T
1W
I/T
2W
I/
DC
E-M
RI
12
.5N
oA
5–
7/0
–1
0,
60
0,
10
00
A6
/1A
/C/S
2.5
–3
/0–
0.5
Leco
uv
et
[4]
1.5
Ph
ilip
sA
chie
va
Ax
ial
ske
leto
nT
1W
I/T
2W
I2
5Y
es
S5
–6
/0.5
–0
.6S
/C5
–6
/0.5
–0
.6
Leco
uv
et
[5]
1.5
Ph
ilip
sA
chie
va
Wh
ole
bo
dy
DW
I/T
1W
I/S
TIR
25
Ye
sA
5/0
.50
,8
00
C6
/1C
6/1
Mo
sav
i[1
7]
1.5
Ph
ilip
sG
yro
sca
nIn
tera
Wh
ole
bo
dy
DW
I1
6Y
es
A6
/00
,1
00
0
Pa
sog
lou
[18
]3
Sie
me
ns
Ve
rio
Wh
ole
bo
dy
DW
I/T
1W
I2
1.2
Ye
sA
5/0
.50
,8
00
C1
.2/0
Pic
card
o[9
]1
.5G
ES
ign
aH
Dx
tP
elv
isS
TIR
15
Ye
sA
5/0
.5
Va
rga
s[1
9]
1.5
or
3G
EN
RP
elv
isT
1W
I1
5N
oA
5/1
Ve
nk
ita
ram
an
[20
]1
.5N
RN
RA
xia
l
ske
leto
n
T1
WI/
ST
IR1
8Y
es
S8
/1S
8/1
Wo
o[6
]3
Sie
me
ns,
Ph
ilip
s
Tri
o/V
eri
o,
Ing
en
ia
Pe
lvis
DW
I/T
1W
I/T
2W
I/
DC
E-M
RI
33
Ye
sA
3.5
/00
,1
00
0A
3–
3.5
/0A
/C/S
3–
4/0
–0
.4
A=
ax
ial;
C=
coro
na
l;D
CE
=d
yn
am
icco
ntr
ast
en
ha
nce
d;
DW
I=
dif
fusi
on
-we
igh
ted
ima
gin
g;
MR
I=
ma
gn
eti
cre
son
an
ceim
ag
ing
;N
R=
no
tre
po
rte
d;
ST
=sl
ice
thic
kn
ess
;T
1W
I=
T1
-we
igh
ted
ima
gin
g;
T2
WI
=T
2-w
eig
hte
d
ima
gin
g;
S=
sag
itta
l;S
TIR
=sh
ort
tau
inv
ers
ion
reco
ve
ry.
E U R O P E A N U R O L O G Y X X X ( 2 0 1 7 ) X X X – X X X 7
EURURO-7324; No. of Pages 11
Please cite this article in press as: Woo S, et al. Diagnostic PerformMetastasis in Prostate Cancer: A Systematic Review and Mj.eururo.2017.03.042
we speculate that MRI is a more superior modality in terms
of the sensitivity and specificity for detecting bone
metastasis in patients with prostate cancer, given the
well-known limited diagnostic performance of BS in the
literature (ie, pooled sensitivity and specificity of 0.71 and
0.91, respectively) [21]. However, as our meta-analysis was
based on a per-patient basis and we did not assess the per-
lesion diagnostic performance of MRI, whether MRI can be
used to identify the metastatic burden or as a modality for
assessing global treatment response cannot be answered
from the results of our study.
There was significant heterogeneity among the includ-
ed studies. Based on meta-regression analysis, the only
statistically significant factor that may be attributable to
this heterogeneity was the number of imaging planes
used for the determination of bone metastasis. Specifi-
cally, studies that used two or more planes (0.99) showed
significantly greater sensitivity compared with those
using only one plane (0.87). Regarding MRI technology,
use of DWI or slice thickness (�4 or >4 mm) was not
shown to affect the heterogeneity. Regarding slice
thickness, the cutoff value of 4 mm was based on practical
guidelines and may not have been a significant factor as
all but two of the included studies had a minimum slice
thickness of 5 or less [17,20,22,23]. However, it is unclear
why the addition of DWI did not result in superior results
compared with using only conventional sequences of
T1WI, T2WI, or STIR. Of note, CE MRI was not separately
analyzed as a covariate in the current meta-analysis, as it
was used in only two studies, where it was not a
dominant sequence but rather one among several MRI
sequences included in their multiparametric prostate
MRI protocol [6,16]. Further studies may be needed to
verify the added value of DWI and CE MRI in determining
bone metastasis. Collectively, based on these results
with regard to technical aspects of MRI, guidelines
should recommend that at least two different planes be
used when assessing bone metastasis from prostate
cancer.
The current study highlights that regardless of the
coverage of MRI—that is, whether it covered only the pelvis
in routine prostate MRI, or whether a dedicated axial
skeleton or whole-body MRI was utilized—there was
consistently high per-patient sensitivity (0.94, 0.95, and
0.97, respectively) and specificity (0.99, 0.94, and 0.97,
respectively). This is substantiated by the literature in that
although the use of axial skeleton or whole-body MRI may
allow identification of a greater number of metastatic bone
lesions, the probability of missing a patient with metastasis
is negligible due to the fact that isolated peripheral
metastasis is highly uncommon as prostate cancer primari-
ly metastasizes to the lower spine and pelvis before
spreading throughout the whole body [4,6,24]. The decision
to simply use routine prostate MRI, or perform additional
axial skeleton or whole-body MRI should be based on
further studies assessing cost effectiveness, where the latter
two would be more effective in terms of per-lesion
detection, but would increase cost in terms of MRI
acquisition time and medical costs.
ance of Magnetic Resonance Imaging for the Detection of Boneeta-analysis. Eur Urol (2017), http://dx.doi.org/10.1016/

Fig. 2 – Grouped bar charts showing risk of bias (left) and concerns for applicability (right) of 10 included studies using QUADAS-2. QUADAS-2 = QualityAssessment of Diagnostic Accuracy Studies-2.
Fig. 3 – Coupled forest plots of pooled sensitivity and specificity. Numbers are pooled estimates with 95% CIs in parentheses. Correspondingheterogeneity statistics are provided at bottom right corners. Horizontal lines indicate 95% CIs. CI = confidence interval.
E U R O P E A N U R O L O G Y X X X ( 2 0 1 7 ) X X X – X X X8
EURURO-7324; No. of Pages 11
Please cite this article in press as: Woo S, et al. Diagnostic Performance of Magnetic Resonance Imaging for the Detection of BoneMetastasis in Prostate Cancer: A Systematic Review and Meta-analysis. Eur Urol (2017), http://dx.doi.org/10.1016/j.eururo.2017.03.042

Fig. 4 – Hierarchical summary receiver operating characteristic curve ofthe diagnostic performance of MRI for detection of bone metastasis inpatients with prostate cancer. AUC = area under the curve;MRI = magnetic resonance imaging; SENS = sensitivity; SPEC = specificity;SROC = summary receiver operating characteristic.
Fig. 5 – Deeks et al’s [13] funnel plot for per-patient analysis. A p valueof 0.23 suggests that the likelihood of publication bias islow. ESS = effective sample size.
E U R O P E A N U R O L O G Y X X X ( 2 0 1 7 ) X X X – X X X 9
EURURO-7324; No. of Pages 11
The clinical setting (newly diagnosed or treated prostate
cancer) is a major factor when determining bone metastasis
in prostate cancer patients. Although not significant at meta-
regression analysis, sensitivity analysis showed that studies
including only treated prostate cancer patients showed a
tendency for lower sensitivity compared with those includ-
ing only patients with newly diagnosed prostate cancer
(0.89 vs 0.93). We speculate that in patients who have
already received systemic treatment (ie, androgen depriva-
tion therapy), the imaging characteristics of metastatic bone
lesions may have changed compared with the original (or
pretreatment) appearance, thereby hindering accurate
detection [25,26]. This may not be applicable for patients
treated with local therapy such as RP; however, we were
Table 4 – Results of meta-regression analysis of MRI for the detection
Covariates Subgroup
Clinical setting Newly diagnosed
Treated
Reference standard BVC only
BVC or histopathology
Magnetic field strength 3 T used
1.5 T only
MRI coverage Pelvis
Axial skeleton or whole body
MRI sequence DWI used
Conventional sequences only
Number of imaging planes �2
1
Minimum slice thickness �4 mm
>4 mm
BVC = best value comparator; CI = confidence interval; DWI = diffusion-weighted
Please cite this article in press as: Woo S, et al. Diagnostic PerformMetastasis in Prostate Cancer: A Systematic Review and Mj.eururo.2017.03.042
unable to perform separate analyses according to the type of
treatment as the included studies did not provide separate
diagnostic performance values. Another aspect of clinical
setting is the risk stratification for possibility of bone
metastasis. Guidelines recommend that screening for bone
metastasis be performed in high-risk patients [2]. Based on
sensitivity analysis, the pooled sensitivity and specificity
were comparable in studies including only high-risk patients
(0.95 and 0.93, respectively), in studies on patients with any
risk (0.91 and 0.99, respectively), and for all 10 studies
(0.96 and 0.98, respectively). However, one study included
only patients with no or less than five metastatic bone
lesions based on conventional imaging, and reported
distinctively inferior diagnostic performance compared with
the other nine studies (sensitivity of 0.72 and specificity of
0.70). This study was considered to have high concern for
applicability as in real-life clinical practice; metastatic
screening would not be employed for patients with low or
of bone metastasis in patients with prostate cancer
Meta-analytic summary estimates
Sensitivity(95% CI)
Specificity(95% CI)
p
0.97 (0.93–1.00) 0.96 (0.91–1.00) 0.10
0.93 (0.83–1.00) 0.99 (0.97–1.00)
0.96 (0.87–1.00) 0.98 (0.95–1.00) 0.86
0.95 (0.88–1.00) 0.98 (0.95–1.00)
0.95 (0.87–1.00) 0.99 (0.98–1.00) 0.08
0.96 (0.91–1.00) 0.95 (0.89–1.00)
0.94 (0.86–1.00) 0.99 (0.97–1.00) 0.34
0.97 (0.92–1.00) 0.96 (0.91–1.00)
0.96 (0.89–1.00) 0.99 (0.96–1.00) 0.68
0.95 (0.89–1.00) 0.96 (0.90–1.00)
0.99 (0.98–1.00) 0.99 (0.98–1.00) <0.01
0.87 (0.80–0.94) 0.95 (0.90–1.00)
0.96 (0.88–1.00) 0.99 (0.98–1.00) 0.18
0.96 (0.90–1.00) 0.96 (0.91–1.00)
imaging; MRI = magnetic resonance imaging.
ance of Magnetic Resonance Imaging for the Detection of Boneeta-analysis. Eur Urol (2017), http://dx.doi.org/10.1016/
Fig. 6 – Forest plots of sensitivity analyses showing pooled sensitivity and specificity estimates and corresponding 95% CIs for various subgroups.BVC = best value comparator; CI = confidence interval; DWI = diffusion-weighted imaging; ST = slice thickness. a Risk of bone metastasis based onclinical criteria (Gleason grade, clinical T stage, prostate-specific antigen, or prostate-specific antigen doubling time). b Unstable pooled estimates (<3studies). c Excluding study by Conde-Moreno et al [15].
E U R O P E A N U R O L O G Y X X X ( 2 0 1 7 ) X X X – X X X10
EURURO-7324; No. of Pages 11
intermediate risk of bone metastasis only. Therefore, we
performed sensitivity analysis excluding this single study,
and yielded consistent diagnostic performance with a
substantially lower degree of heterogeneity: sensitivity
and specificity of 0.97 (95% CI 0.89–0.99) and 0.98 (95% CI
0.95–0.99), respectively; I2 = 57.4 and 75.64, respectively.
One of the major limitations of our meta-analysis is that all
included studies used BVC or predominantly BVC as the
reference standard. As BVC is based on a combination of
clinical, laboratory, imaging, and follow-up studies, this
inherently imposes a significant risk for differential verifica-
tion biases among all included patients. However, it is unlikely
that any further study will solely use biopsy or surgery to
obtain histopathological results for the reference standard
when determining bone metastasis, as this would not be
feasible in clinical practice and would be ethically unjustifi-
able. Another limitation of this meta-analysis is that we were
unable to assess the per-lesion diagnostic performance of
MRI, as only two studies provided such information. Future
studies may be needed to elucidate the per-lesion sensitivity
and specificity of MRI for the detection of bone metastasis in
patients with prostate cancer. Furthermore, caution is needed
in applying our results to routine clinical practice, as there was
substantial heterogeneity among the included studies and we
used the results with the highest accuracy when diagnostic
performance from multiple independent readers were
provided in the included studies.
4. Conclusions
MRI shows excellent sensitivity and specificity for the
detection of bone metastasis in patients with prostate
cancer. Studies using two or more planes for assessment
Please cite this article in press as: Woo S, et al. Diagnostic PerformMetastasis in Prostate Cancer: A Systematic Review and Mj.eururo.2017.03.042
showed the highest sensitivity and specificity, while
diagnostic performance was consistently high across
multiple subgroups.
Author contributions: Sang Youn Kim had full access to all the data in the
study and takes responsibility for the integrity of the data and the
accuracy of the data analysis.
Study concept and design: Woo, Suh, S.Y. Kim.
Acquisition of data: Woo, Suh, S.Y. Kim.
Analysis and interpretation of data: Woo, Suh, S.Y. Kim.
Drafting of the manuscript: Woo.
Critical revision of the manuscript for important intellectual content: Suh,
S.Y. Kim, Cho, S.H. Kim.
Statistical analysis: Suh.
Obtaining funding: None.
Administrative, technical, or material support: None.
Supervision: S.Y. Kim, Cho, S.H. Kim.
Other: None.
Financial disclosures: Sang Youn Kim certifies that all conflicts of
interest, including specific financial interests and relationships and
affiliations relevant to the subject matter or materials discussed in the
manuscript (eg, employment/affiliation, grants or funding, consultan-
cies, honoraria, stock ownership or options, expert testimony, royalties,
or patents filed, received, or pending), are the following: None.
Funding/Support and role of the sponsor: None.
References
[1] Carlin BI, Andriole GL. The natural history, skeletal complications,
and management of bone metastases in patients with prostate
carcinoma. Cancer 2000;88:2989–94.
[2] Mottet N, Bellmunt J, Bolla M, et al. EAU-ESTRO-SIOG guidelines on
prostate cancer. Part 1: screening, diagnosis, and local treatment
with curative intent. Eur Urol 2017;71:618–29.
ance of Magnetic Resonance Imaging for the Detection of Boneeta-analysis. Eur Urol (2017), http://dx.doi.org/10.1016/
E U R O P E A N U R O L O G Y X X X ( 2 0 1 7 ) X X X – X X X 11
EURURO-7324; No. of Pages 11
[3] Daffner RH, Lupetin AR, Dash N, Deeb ZL, Sefczek RJ, Schapiro RL.
MRI in the detection of malignant infiltration of bone marrow. AJR
Am J Roentgenol 1986;146:353–8.
[4] Lecouvet FE, Geukens D, Stainier A, et al. Magnetic resonance
imaging of the axial skeleton for detecting bone metastases in
patients with high-risk prostate cancer: diagnostic and cost-effec-
tiveness and comparison with current detection strategies. J Clin
Oncol 2007;25:3281–7.
[5] Lecouvet FE, El Mouedden J, Collette L, et al. Can whole-body
magnetic resonance imaging with diffusion-weighted imaging re-
place Tc 99m bone scanning and computed tomography for single-
step detection of metastases in patients with high-risk prostate
cancer? Eur Urol 2012;62:68–75.
[6] Woo S, Kim SY, Kim SH, Cho JY. JOURNAL CLUB: identification of
bone metastasis with routine prostate MRI: a study of patients with
newly diagnosed prostate cancer. AJR Am J Roentgenol 2016;206:
1156–63.
[7] Liberati A, Altman DG, Tetzlaff J, et al. The PRISMA statement for
reporting systematic reviews and meta-analyses of studies that
evaluate health care interventions: explanation and elaboration. J
Clin Epidemiol 2009;62:e1–34.
[8] Whiting PF, Rutjes AW, Westwood ME, et al. QUADAS-2: a revised
tool for the quality assessment of diagnostic accuracy studies. Ann
Intern Med 2011;155:529–36.
[9] Piccardo A, Paparo F, Piccazzo R, et al. Value of fused 18F-Choline-
PET/MRI to evaluate prostate cancer relapse in patients showing
biochemical recurrence after EBRT: preliminary results. Biomed Res
Int 2014;2014:103718.
[10] Suh CH, Park SH. Successful publication of systematic review and
meta-analysis of studies evaluating diagnostic test accuracy. Kore-
an J Radiol 2016;17:5–6.
[11] Kim KW, Lee J, Choi SH, Huh J, Park SH. Systematic review and meta-
analysis of studies evaluating diagnostic test accuracy: a practical
review for clinical researchers—part I. General guidance and tips.
Korean J Radiol 2015;16:1175–87.
[12] Lee J, Kim KW, Choi SH, Huh J, Park SH. Systematic review and meta-
analysis of studies evaluating diagnostic test accuracy: a practical
review for clinical researchers—part II. Statistical methods of meta-
analysis. Korean J Radiol 2015;16:1188–96.
[13] Deeks JJ, Macaskill P, Irwig L. The performance of tests of publica-
tion bias and other sample size effects in systematic reviews of
diagnostic test accuracy was assessed. J Clin Epidemiol 2005;58:
882–93.
[14] Higgins J, Green S. Cochrane handbook for systematic reviews of
interventions. Version 5.1.0. The Cochrane Collaboration. http://
handbook.cochrane.org/chapter_9/
9_5_2_identifying_and_measuring_heterogeneity.htm.
Please cite this article in press as: Woo S, et al. Diagnostic PerformMetastasis in Prostate Cancer: A Systematic Review and Mj.eururo.2017.03.042
[15] Conde-Moreno AJ, Herrando-Parreno G, Muelas-Soria R, et al.
Whole-body diffusion-weighted magnetic resonance imaging
(WB-DW-MRI) vs choline-positron emission tomography-comput-
ed tomography (choline-PET/CT) for selecting treatments in recur-
rent prostate cancer. Clin Transl Oncol. In press. http://dx.doi.org/
10.1007/s12094-016-1563-4.
[16] Kitajima K, Murphy RC, Nathan MA, et al. Detection of recurrent
prostate cancer after radical prostatectomy: comparison of 11C-
choline PET/CT with pelvic multiparametric MR imaging with
endorectal coil. J Nucl Med 2014;55:223–32.
[17] Mosavi F, Johansson S, Sandberg DT, Turesson I, Sorensen J, Ahl-
strom H. Whole-body diffusion-weighted MRI compared with
(18)F-NaF PET/CT for detection of bone metastases in patients with
high-risk prostate carcinoma. AJR Am J Roentgenol 2012;199:
1114–20.
[18] Pasoglou V, Michoux N, Peeters F, et al. Whole-body 3D T1-weighted
MR imaging in patients with prostate cancer: feasibility and evalua-
tion in screening for metastatic disease. Radiology 2015;275:155–66.
[19] Vargas HA, Schor-Bardach R, Long N, et al. Prostate cancer bone
metastases on staging prostate MRI: prevalence and clinical fea-
tures associated with their diagnosis. Abdom Radiol (NY) 2017;42:
271–7.
[20] Venkitaraman R, Cook GJ, Dearnaley DP, et al. Does magnetic
resonance imaging of the spine have a role in the staging of prostate
cancer? Clin Oncol 2009;21:39–42.
[21] Cheng X, Li Y, Xu Z, Bao L, Li D, Wang J. Comparison of 18F-FDG PET/
CT with bone scintigraphy for detection of bone metastasis: a meta-
analysis. Acta Radiol 2011;52:779–87.
[22] Lecouvet FE. Whole-body MR imaging: musculoskeletal applica-
tions. Radiology 2016;279:345–65.
[23] Padhani AR, Lecouvet FE, Tunariu N, et al. METastasis Reporting and
Data System for Prostate Cancer: practical guidelines for acquisi-
tion, interpretation, and reporting of whole-body magnetic reso-
nance imaging-based evaluations of multiorgan involvement in
advanced prostate cancer. Eur Urol 2017;71:81–92.
[24] Batson OV. The function of the vertebral veins and their role in the
spread of metastases. Ann Surg 1940;112:138–49.
[25] Messiou C, Collins DJ, Giles S, de Bono JS, Bianchini D, de Souza NM.
Assessing response in bone metastases in prostate cancer with
diffusion weighted MRI. Eur Radiol 2011;21:2169–77.
[26] Dafni H, Kim SJ, Bankson JA, Sankaranarayanapillai M, Ronen SM.
Macromolecular dynamic contrast-enhanced (DCE) MRI detects
reduced vascular permeability in a prostate cancer bone metastasis
model following anti-platelet-derived growth factor receptor
(PDGFR) therapy, indicating a drop in vascular endothelial growth
factor receptor (VEGFR) activation. Magn Reson Med 2008;60:
822–33.
ance of Magnetic Resonance Imaging for the Detection of Boneeta-analysis. Eur Urol (2017), http://dx.doi.org/10.1016/