Carbon Dioxide Monitor with Controller by ACMAS Technologies Pvt Ltd.

REPORT OUT DAY – MSR-FAPESP INSTITUTE FOR IT RESEARCHPROJECT: e-phenology
e-phenologye-phenology: The application of new
technologies to monitor plant phenology and track climate
changes in the tropics
Patrícia MorellatoPhenology Laboratory
Departament of BotanyUNESP Rio Claro, SP
Ricardo TorresRECOD
Institute of ComputingUNICAMP Campinas, SP
Program FAPESP de Pesquisa em Mudanças Climáticas Globais – PFPMCG

REPORT OUT DAY – MSR-FAPESP INSTITUTE FOR IT RESEARCH
PHENOLOGY “Phainestai”, the ancient Greek word meaning to show or to appear.
“The scientific study of periodic biological phenomena, such as flowering, breeding, and migration, in relation to climatic conditions.”
The American Heritage Dictionary
2
PROJECT: e-phenology
PFPMCG

e- Phenology (e-fenologia)
e-science – termo que se refere ao método de se resolver problemas científicos através da utilização de ferramentas computacionais intensivas para a análise, visualização e organização de grandes volumes de dados.

PHENOLOGY RESEARCH
BIOTIC FACTORS
CLIMATE
EVOLUTIONARY FACTORS
PFPMCG

Phenology and Climatic Change
Dates of leaf bud burst of the
horse-chestnut in Geneva,
1808–2000. Smoothing:
Gauss low-pass filter with a
period of 20 years (extended
according to Defila 1996)
PFPMCG

REPORT OUT DAY – MSR-FAPESP INSTITUTE FOR IT RESEARCHPROJECT: e-phenology
Monitoring phenology with a network of webcams
Jun
e 2
8
M
ay 1
8
M
ay 1
A. Richardson website
Quantify temporal
(seasonal, annual) and
spatial patterns of variation
in phenology
• Interannual variation
• Across different ecosystems
• Correlation with environmental factors
6
PFPMCG

Tower mounted webcams offer
great potential for quantifying
patterns of canopy phenology
across sites, without the need for
intensive field monitoring by an
observer.
PHENOCAM
http://phenocam.sr.unh.edu/
________________________
e-PhenologyPFPMCG
REPORT OUT DAY – MSR-FAPESP INSTITUTE FOR IT RESEARCH
gaea-habitat.blogspot.com
GROUND PHENOLOGY X SATELLITE REMOTE PHENOLOGY
Alberton, BC
+ =
Data collected at individual level
Restricted areas
Labor of human observers
Locations worldwide
Cloudy areas have patchytemporal resolution
Cerrado savanna (Morellato, LPC)m8
PROJECT: e-phenology
PFPMCG

REPORT OUT DAY – MSR-FAPESP INSTITUTE FOR IT RESEARCH
LEAF PHENOLOGY
LEAF FLUSHING and SENESCENCE are key events in plants life cycles;At the LEAF LEVEL - fundamental to understand a range of processes in the
ecosystem, such as…
PROJECT: e-phenology
GROWTH SEASON
NUTRIENT CYCLING
PHOTOSYNTHESIS
CARBON BALANCE
WATER AND GAS EXCHANGE
PFPMCG

REPORT OUT DAY – MSR-FAPESP INSTITUTE FOR IT RESEARCH
Recent studies – Richardson et al., 2007, 2009; Ahrends et al., 2008, Crimmins & Crimmins, 2008, Ahrends et al., 2009, Graham et al., 2010, Ide & Oguma, 2010, Kurc & Benton, 2010, Sonnentag et al., 2011, Migliavacca et al., 2011, Sonnentag et al., 2012, Junbin et al., 2012 – TEMPERATE AND SUBTROPICAL REGIONS
TROPICAL SYSTEMS – no published data for phenological cameras.
NEAR SURFACE REMOTE PHENOLOGY The use of Digital cameras has great potential – high resolution data to characterize phenological patterns for different sites.
PROJECT: e-phenology
http://pen.agbi.tsukuba.ac.jp/index_e.html
PFPMCG

REPORT OUT DAY – MSR-FAPESP INSTITUTE FOR IT RESEARCH
e-phenology: The application of new technologies to monitor plant phenology and track climate changes in
the tropics
(a) use of new technologies of environmental monitoring - remote
phenology monitoring systems;
(b) provide models, methods, and algorithms to support
management, integration, and analysis of remote phenology data.
(a) create a protocol for a future Brazilian Network - long term
phenology monitoring program;
For more information, visit
http://www.recod.ic.unicamp.br/ephenology/
11
PROJECT: e-phenology
PFPMCG

REPORT OUT DAY – MSR-FAPESP INSTITUTE FOR IT RESEARCHPROJECT: e-phenology
Contributions
Phenologymodels and methodologies for climate change analysis based on the exploration of new remote phenology indices
Computer Science: models, tools and techniques concerning:Image Processing
extract and index image content descriptors associated to different seasons and types of vegetation
databases - concentrating on scientific data management
data mining and fusion
time series processing
data annotation
PROJECT: e-phenology
PFPMCG

REPORT OUT DAY – MSR-FAPESP INSTITUTE FOR IT RESEARCHPROJECT: e-phenology
Main Results
The e-phenology project
Some contributions:
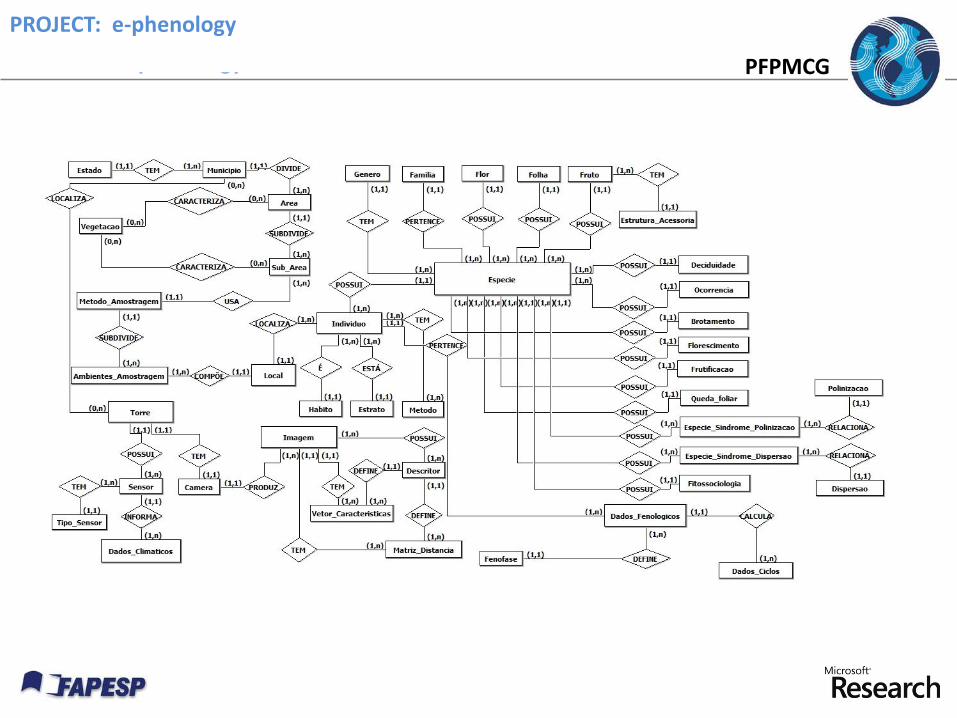
Database Modeling
Data Acquisition
Machine Learning
Image Processing
Future Perspectives13
PROJECT: e-phenology
PFPMCG

REPORT OUT DAY – MSR-FAPESP INSTITUTE FOR IT RESEARCH
Using phenological cameras to track the green up in
tropical cerrado savanna and its on-the-ground
validation
BRUNA ALBERTON
JURANDY ALMEIDA; RAIMUND HENNEKEN; RICARDO DA S. TORRES; ANNETTE MENZEL;
PATRICIA C. MORELLATO
First Results
Ecol. Inform. Accepted
PROJECT: e-phenology
PFPMCG

REPORT OUT DAY – MSR-FAPESP INSTITUTE FOR IT RESEARCH
STUDY AREA core study site
Cerrado sensu stricto - a savanna-like vegetation, 260 ha, Itirapina, Sao Paulo
Climate is Cwa – a dry season (April to September), and a wet season (October to March)
Walter and Lieth (1960-67) climatic diagram, period of1972 to 2002, for Itirapina, Sao Paulo State, Brazil.(CRHEA).
Location of (a) the cerrado-savanna study site at Botelho Farm, Itirapina, São Paulo, Southeastern Brasil.
PROJECT: e-phenology

IMAGE ANALYSIS
The analysis was based on over 2,700 images (five images/hour – 65 images/day), recorded between August 28th and October 3rd, (doy 241 to 278) 2011, during the main leafing season
MATERIALS AND METHODS__________________________________________________________________________________________________________
Remote Phenology: applying digital images for monitoring leafphenology.
At the end of the dry season in August, the newleaves start to flush, peaking in September.Mean data collected from 2005 to 2010. Cerradosensu stricto site, at Itirapina, Sao Paulo State.
(Morellato et al. unpublished data)
0
200
400
600
0
20
40
60
J F M A M J J A S O N D
Ra
infa
ll (m
m)
% o
f in
div
idu
als
Months
Rainfall Initial Date Peak
r = 0.852, P = <0.01,
N = 714r = 0.741, P = <0.01,
N = 1342
b)
0
10
20
30
40
Tem
pe
ratu
re ( C
)
Tmax Tmin Tmean
a)
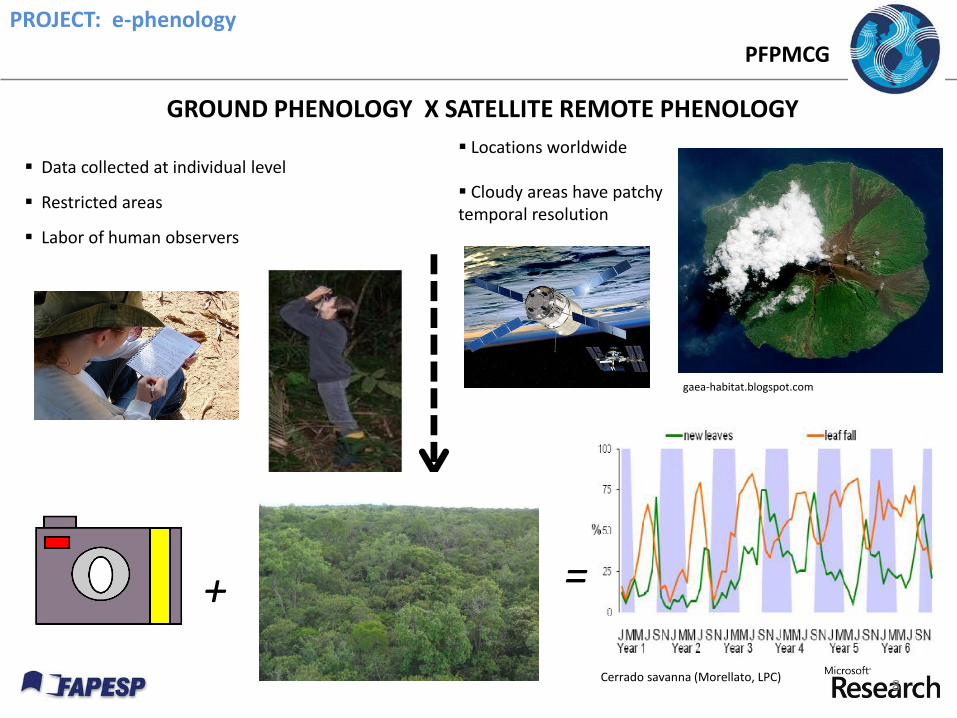
Script 1 – split images(Python Software
Foundation)
IMAGE ANALYSIS
EXTRACTING COLOR CHANNELS FROM DIGITAL IMAGES
RGB
Script 2Apply a ROI andquantify RGB channels
RGB Cromatic coordinates (RGBcc)
________________________
e-PhenologyPFPMCG

IMAGE ANALYSIS
ROI – REGIONS OF INTEREST selected in the original image Binary image was created as a mask
________________________
e-PhenologyPFPMCG

IMAGE ANALYSIS
ROI – REGIONS OF INTEREST selected in the original image; Binary image was created as a mask.
Aspidosperma tomentosum, Caryocar brasiliensis, Pouteria torta, Pouteria ramiflora, Myrcia guianensis, Miconia rubiginosa
________________________
e-PhenologyPFPMCG

20Miconia guianensis
Pouteria tortaCariocar
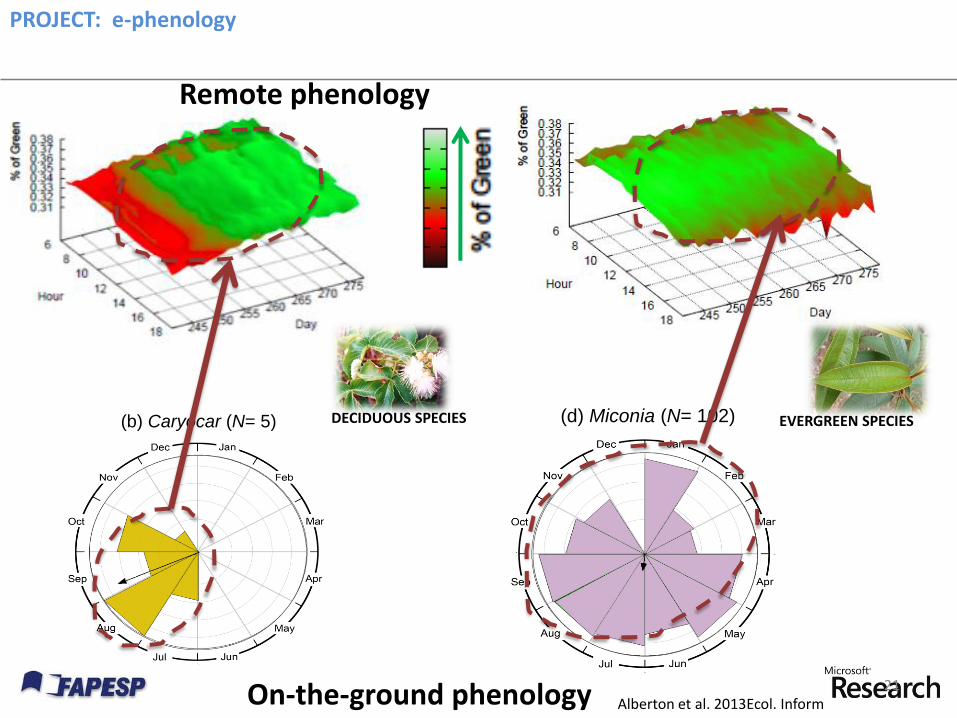
REPORT OUT DAY – MSR-FAPESP INSTITUTE FOR IT RESEARCH
(d) Miconia (N= 102) (b) Caryocar (N= 5)
On-the-ground phenology
Remote phenology
EVERGREEN SPECIESDECIDUOUS SPECIES
21
PROJECT: e-phenology
Alberton et al. 2013Ecol. Inform

REPORT OUT DAY – MSR-FAPESP INSTITUTE FOR IT RESEARCH
CONCLUSIONS
Digital images are a reliable tool to monitor the high diversity in the cerrado vegetation
ROIs for cerrado plant community were not sensitive to changes, at least within the time span analyzed
It is possible to detect changes on cerrado green values over time and validate the trend with on-the-ground phenology data
We identified changes on green values at the species level (species ROI) and the data validation revealed that digital images may be able to distinguish functional groups of plants in relation to leafing behavior.
PROJECT: e-phenology
PFPMCG
REPORT OUT DAY – MSR-FAPESP INSTITUTE FOR IT RESEARCH
Agenda
The e-phenology project
Some contributions:
Database Modeling
Data Acquisition
Machine Learning
Image Processing
Future Perspectives23
PROJECT: e-phenology
PFPMCG

REPORT OUT DAY – MSR-FAPESP INSTITUTE FOR IT RESEARCH
Mariano 2013 – Dissertação mestradoMariano et al. In prepMariano et al. 2012, VI e-Science workshop – CSBC 2012, Curitiba.
PROJECT: e-phenology
PFPMCG

REPORT OUT DAY – MSR-FAPESP INSTITUTE FOR IT RESEARCHPROJECT: e-phenology
25
Legacy data + field observations = phenological time series
Metadata+ image features = Image data
Climate sensor dataDatabase
Feature
Vectors
Images &
Metadata
Taxonomic
Data
Climate
Data
Phenological
Data
PROJECT: e-phenology
REPORT OUT DAY – MSR-FAPESP INSTITUTE FOR IT RESEARCHPROJECT: e-phenology
PROJECT: e-phenology
PFPMCG

REPORT OUT DAY – MSR-FAPESP INSTITUTE FOR IT RESEARCHPROJECT: e-phenology
Agenda
The e-phenology project
Some contributions:
Database Modeling
Data Acquisition
Machine Learning
Image Processing
Future Perspectives27
PROJECT: e-phenology
PFPMCG

Target problem: Data acquisition support
28

Total:
Year:
12 months
88 months
(set 2004 to dec 2011)12,732 records
(1 month)1,120,416
records
29
Month:
2,122
individuals
6 spreadsheets
152,784
records
(1 year)
Data acquisition support: target problem

Annotation in spreadsheets
30

31
Annotation in smart phones
vamosjapararcomisso.blogspot.com

Data acquisition: mobile devices + cloud infrastructure

Prototype design in graduate classes
33

Prototype implementation

REPORT OUT DAY – MSR-FAPESP INSTITUTE FOR IT RESEARCHPROJECT: e-phenology
Agenda
The e-phenology project
Some contributions:
Database Modeling
Data Acquisition
Machine Learning
Image Processing
Future Perspectives35
PROJECT: e-phenology
REPORT OUT DAY – MSR-FAPESP INSTITUTE FOR IT RESEARCHPROJECT: e-phenology
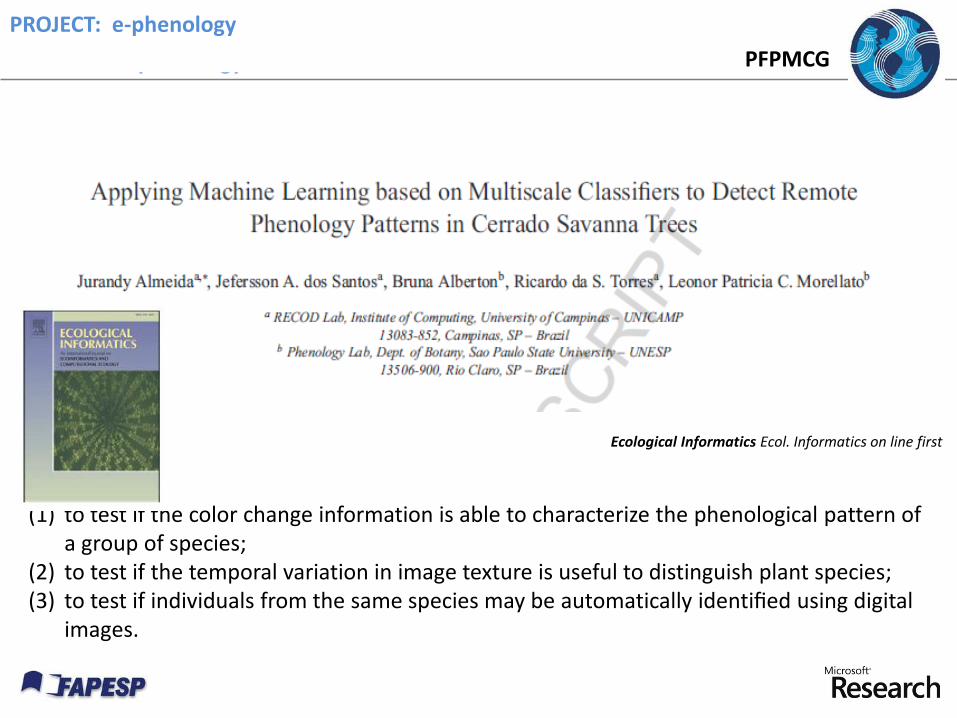
Ecological Informatics Ecol. Informatics on line first
(1) to test if the color change information is able to characterize the phenological pattern of a group of species;
(2) to test if the temporal variation in image texture is useful to distinguish plant species; (3) to test if individuals from the same species may be automatically identified using digital
images.
PROJECT: e-phenology
PFPMCG

Caryocar brasiliensis
Pouteria tortaMyrcia guianensis
RGB representation Time seriesextraction
A
B
C
D
E
Fig. 2. Lukas et al. [9] approach.
in the reference pattern noise. According to the author, the
high frequencies (e.g., object edges) existing in an image can
contaminate its PRNU component, and lead to unsatisfactory
camera identification results through sensor pattern noise. The
author proposed a sensor pattern noise enhancement method
to reduce the influence of the scene content in the noise
component. Considering one image I p 2 I , after extracting
its noise n = RI paccording to Eq. 1, the authors applied a
normalization in each pixel n(x, y), generating the enhanced
noise ne(x, y). The model which yielded the best results is
defined by
ne(x, y) =
⇢e− 0.5n 2 ( x ,y ) / ↵ 2
, if 0 n2 (x, y);
− e− 0.5n 2 ( x ,y ) / ↵ 2, otherwise;
(4)
where ↵ is defined by the user. The best value reported in
that work for this normalization is ↵ = 7. Fig. 3 shows the
original image (a), its sensor pattern noise (b) and its enhanced
sensor pattern noise (c). The author reports accuracy of 94%
in a scenario with six cameras, considering a center 512⇥512
region of the image.
(a) (b) (c)
Fig. 3. (a) An input image. (b) Its noise residual calculated as in [9]. (c)Noise residual enhancement calculated as in Li’s work [10].
The approach presented by Lukas et al. [9] and its
enhancement proposed by Li [10] allowed the development of
other approaches based on their concepts, as approaches that
aim at identifying the common source of image pairs [17] or
clustering of image sets [18], [19]. Considering source camera
identification by sensor noise, there are some approaches
whose objective is to discover inconsistencies in camera
identification methods and explore how these inconsistencies
can make the source camera identification task difficult [20],
[21]. These approaches are called counter-forensic techniques,
and are also important in a forensic research field because they
can help improve the resilience of existing forensic methods.
However, we do not consider the existence of counter-forensic
techniques in the present work.
? ?
? ? ?
?
?
?
?
?
?
? ?
Fig. 4. Example of Open Set classification. In essence, open set recognitionexplicitly presumes not all classes are known a priori. The above diagramshows a known class of interest (“pentagon”), surrounded by other classesthat are not of interest, which can be known (“ triangle” , “circle” , “square”),or unknown (“?” ).
Although the approaches presented in [9] and [10] are
effective for source camera attribution, it is important to note
that, for estimating the threshold T , the authors assumed they
had examples from all the cameras, and have subsequently
labelled the entire space in a binary fashion as either positive
(generated by the camera under investigation) or negative
(otherwise). Considering that T is linear, this approach may
not be so effective if we need to analyze images generated
by an unknown camera at training time. When we do not
have access to all cameras in an investigation, we believe (and
give evidence supporting our belief) that machine learning
techniques are better suited to calculate a hyperplane to
separate the positive and negative classes in such a scenario,
and that is the main subject of this paper.
I I I . OPEN SET CLASSIFICATION AND RELATED WORK
A Closed Set scenario assumes that the camera that
generated the image under investigation is among the set of
cameras available during training. The Open Set approach,
on the other hand, does not assume that the image under
investigation was generated by an available camera. Some
available cameras are considered, but not all images come
from these cameras, thereby optimizing the solution for the
unknowns as well as the known. The important difference
is that all positive examples are similar, but each negative
example has its own particularities [22]. Fig. 4 depicts an
example of Open Set classification.
In machine learning, most of the time we do not need, do
not have access to, or do not know all possible classes to
consider. For instance, when classifying whether or not an
image contains a hidden message [1] we might have training
examples of only pristine images (with no hidden messages)
and perhaps some images of only one or two algorithms for
hiding messages. A robust classifier must consider all other
possible types algorithms for hiding messages as relevant
features as a negative class. In many cases, to model this
negative class is non-viable or impossible (for instance,
considering all existent algorithms for hiding messages).
Open Set recognition has received only limited treatment
in the pattern recognition literature. For instance, in a study
of face recognition evaluation methods outlined by Phillips
et al. [23], the authors define a threshold T where all face
Possible solution: Classification problem
FIs it possible to automatically identify individuals of
the same functional group using digital images?
Feature space
37

Classification Accuracies
38
PFPMCG

Aspidosperma tomentosum
7:00
DetectedManually
DetectedAutomatically
39
PFPMCG

Conclusions
• Machine learning can be applied to detect phenological patterns in the high diversity of the tropical cerrado savanna vegetation
• The extreme hours (morning and afternoon) have shown the best results
• Different plant species present a different behavior with respect to the color change information
– we were able to distinguish functional groups of plants using digital images
• We have introduced a new tool to help phenology experts in the species identification on-the-ground, making such a task much easier and faster
40
PFPMCG

REPORT OUT DAY – MSR-FAPESP INSTITUTE FOR IT RESEARCHPROJECT: e-phenology
Agenda
The e-phenology project
Some contributions:
Database Modeling
Data Acquisition
Machine Learning
Image Processing
Future Perspectives41
PROJECT: e-phenology
PFPMCG
JSTARS Subm

Time-oriented Image Representations
43
VISUAL RHYTHM-BASED TIME SERIES ANALYSIS FOR PHENOLOGY STUDIESJurandy Almeida, Jefersson A. dos Santos, Bruna C. Alberton,Leonor Patricia C. Morellato, and Ricardo da S. TorresICIP 2013, Submitted.
Equivalent Results Low Computational Cost

REPORT OUT DAY – MSR-FAPESP INSTITUTE FOR IT RESEARCHPROJECT: e-phenology
PROJECT: e-phenology
PFPMCG
REPORT OUT DAY – MSR-FAPESP INSTITUTE FOR IT RESEARCHPROJECT: e-phenology
Agenda
The e-phenology project
Some contributions:
Database Modeling
Data Acquisition
Machine Learning
Image Processing
Future Perspectives45
PROJECT: e-phenology
PFPMCG
REPORT OUT DAY – MSR-FAPESP INSTITUTE FOR IT RESEARCHPROJECT: e-phenology
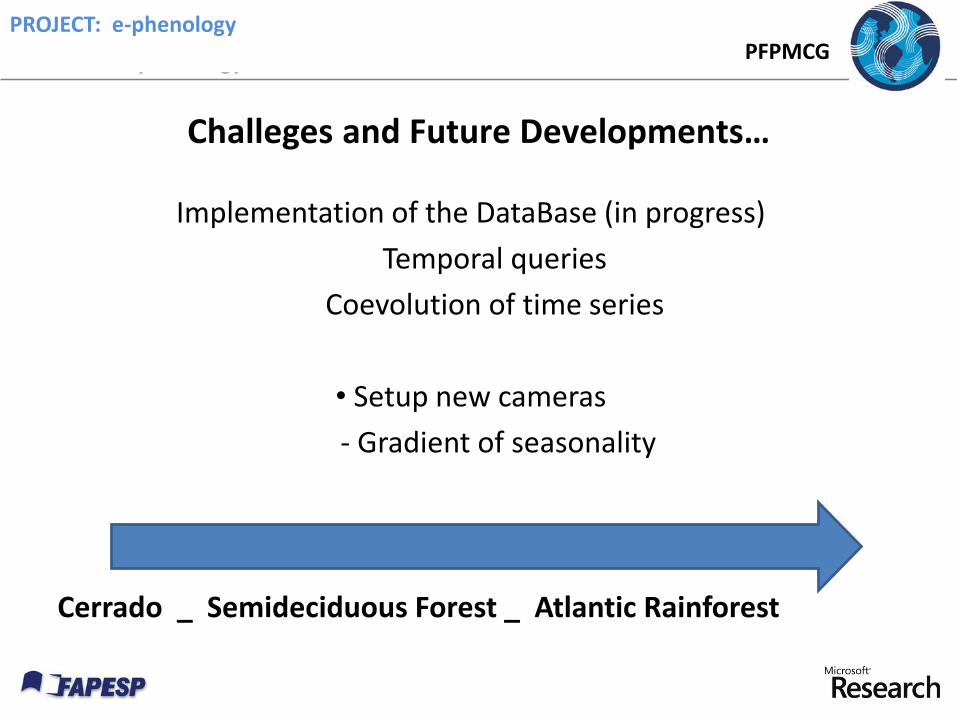
Implementation of the DataBase (in progress)
Temporal queries
Coevolution of time series
• Setup new cameras
- Gradient of seasonality
Challeges and Future Developments…
Cerrado _ Semideciduous Forest _ Atlantic Rainforest
PROJECT: e-phenologyPFPMCG

REPORT OUT DAY – MSR-FAPESP INSTITUTE FOR IT RESEARCHPROJECT: e-phenology
Future Developments…
Cerrado “Campo úmido” – Reserva Ecológica Itirapina
Cerrado sensu stricto vegetation -Itirapina
Cerrado sensu stricto vegetation“pé de gigante”- Santa Rita do Passa Quatro
Semideciduous Forest – Estação Ecológica de Angatuba
Evergreen Rainforest – Santa Virgínea Core
Campos rupestres – Serra do Cipó - MG
PROJECT: e-phenology
PFPMCG

Future camera set ups

REPORT OUT DAY – MSR-FAPESP INSTITUTE FOR IT RESEARCHPROJECT: e-phenology
Cerrado “Campo úmido” –Reserva Ecológica Itirapina
Campos rupestres – Serra do Cipó -MG
PROJECT: e-phenology
PFPMCG

REPORT OUT DAY – MSR-FAPESP INSTITUTE FOR IT RESEARCHPROJECT: e-phenology
PROJECT: e-phenology
PFPMCG
CAATINGAFLUX

REPORT OUT DAY – MSR-FAPESP INSTITUTE FOR IT RESEARCHPROJECT: e-phenology
e-phenology
Combinando novas tecnologias para monitoramento da fenologia: das
folhas ao ecossistema
Patrícia MorellatoPhenology Laboratory
Departament of BotanyUNESP Rio Claro, SP
Ricardo TorresRECOD
Institute of ComputingUNICAMP Campinas, SP
e-phenology: combining new technologies to monitor phenology
from leaves to ecosystems
PFPMCG

REPORT OUT DAY – MSR-FAPESP INSTITUTE FOR IT RESEARCHPROJECT: e-phenology
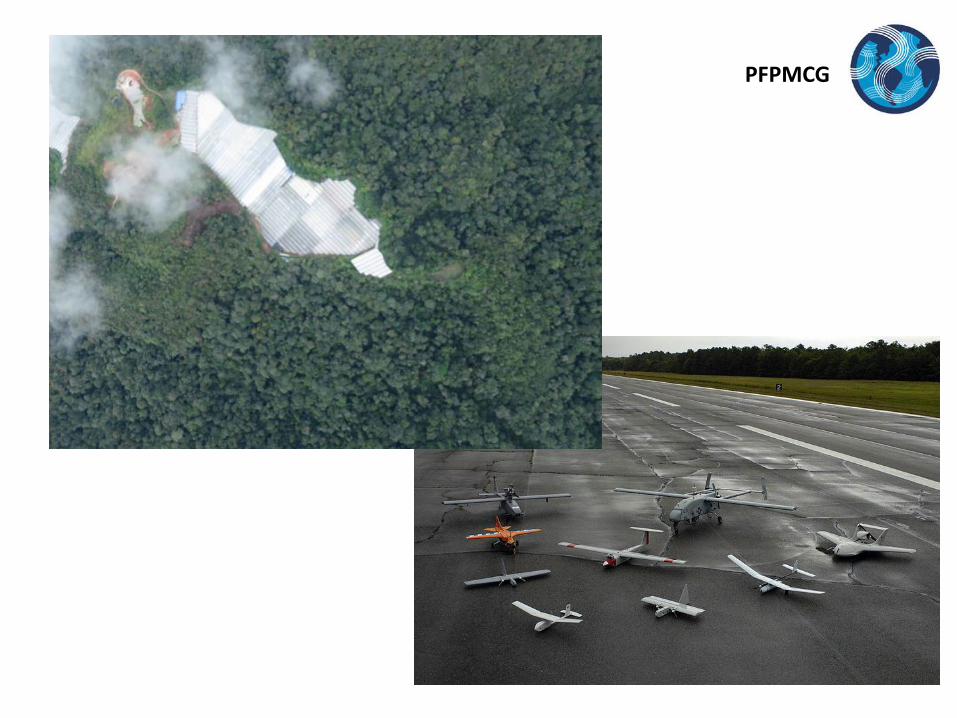
e-phenology: combining new technologies to monitor phenology from leaves to ecosystems
We aim to apply new technologies to enhance the capabilities of near-surface remote phenological observation to detect changes on various scales, from leaves to ecosystems.
Our goal is to address theoretical and practical problems involving the combination of two near-remote phenology monitoring systems digital and hyperspectral cameras at three scales: on-the-ground, phenology tower, and near-space using Unmanned Aerial Vehicle (UAV).
PROJECT: e-phenology
PFPMCG

REPORT OUT DAY – MSR-FAPESP INSTITUTE FOR IT RESEARCHPROJECT: e-phenology
PROJECT: e-phenology
PFPMCG

REPORT OUT DAY – MSR-FAPESP INSTITUTE FOR IT RESEARCHPROJECT: e-phenology
Validation with spectrometer data
54
PROJECT: e-phenology
PFPMCG

REPORT OUT DAY – MSR-FAPESP INSTITUTE FOR IT RESEARCHPROJECT: e-phenology
PROJECT: e-phenology
PFPMCG
PFPMCG

REPORT OUT DAY – MSR-FAPESP INSTITUTE FOR IT RESEARCHPROJECT: e-phenology
PROJECT: e-phenology
Environmental Damage
Hyperspectral imaging can detect
subtle variations in plant stress.
One example is detection of
pipeline leaks and their impact on
surrounding vegetation.
•F. Salem - Hyperspectral Image
Analysis for Oil Spill Mitigation
•L. Spangler et al.- A shallow
subsurface controlled release
facility in Bozeman, Montana, USA,
for testing near surface CO2
detection techniques and transport
models.
PFPMCG
THANKS!
unesp
PFPMCG
CAATINGAFLUX