E nv i ro m onmental Rajamanickam and Nagan Civil nviron ... · o g a oe ae oa. oe 8 e 2 1000304...
13
Volume 8 • Issue 2 • 1000304 J Civil Environ Eng, an open access journal ISSN: 2165-784X Rajamanickam and Nagan, J Civil Environ Eng 2018, 8:2 DOI: 10.4172/2165-784X.1000304 Review Article Open Access J o u r n a l o f C i v il & E n v i r o n m e n t a l E n g i n e e r i n g ISSN: 2165-784X Journal of Civil & Environmental Engineering Assessment of Air Quality Index for Cities and Major Towns in Tamil Nadu, India Rajamanickam R 1 * and Nagan S 2 1 Department of Environmental Engineering, Tamil Nadu Pollution Control Board, Chennai, Tamil Nadu, India 2 Department of Civil Engineering, Thiagarajar College of Engineering, Madurai, Tamil Nadu, India Abstract Air Pollution may be defined as any atmospheric condition in which certain substances are present in such concentrations that they can produce undesirable effects on man and his environment. The Air Quality Index (AQI) is a reporting system and an important tool of risk communication. It informs the public about the level of ambient air quality, and the potential health risk it would impose. AQI converts complex air quality data of various pollutants into a single number (index value), nomenclature and colour. AQI is represented as numeric value varies from 0 to 500. If score is 0, it is the best air quality and if score is 500, it is the worst air quality. There are six AQI categories, namely Good, Satisfactory, Moderate, Poor, Very Poor, and Severe. Each of these categories is decided based on ambient concentration values of air pollutants and their likely health impacts. In Tamil Nadu, under National Ambient Air Quality Monitoring Programme, Ambient Air Quality (AAQ) is being monitored by Central Pollution Control Board in association with Tamil Nadu Pollution Control Board in 28 locations covering cities, major towns and major industrial areas viz. Chennai, Salem, Coimbatore, Madurai, Trichy, Cuddalore, Mettur, and Thoothukudi. The AAQ data from January 2015 to December 2015 for the above cities and towns is collected and AQI is calculated for four months covering four seasons (i.e.,) January (winter), May (summer), July (monsoon), November (post monsoon). Almost all the stations’ AQI fall under good and satisfactory category except Trichy where the majority of the days the AQI fall under moderate category. From the AQI of all the stations, it is observed that responsible pollutant is PM 10 . The other parameter (i.e.,) SO 2 and NO 2 fall under good category for all stations for all days. The higher value of PM 10 is mainly due to vehicular pollution. *Corresponding author: Rajamanickam R, Environmental Engineer, Department of Environmental Engineering, Tamil Nadu Pollution Control Board, 76, Mount Salai, Guindy, Chennai- 600032, Tamil Nadu, India, Tel: 044-22353134–139, Fax: 044-22353068; E-mail: [email protected]` Received June 26, 2017; Accepted February 23, 2018; Published March 01, 2018 Citation: Rajamanickam R, Nagan S (2018) Assessment of Air Quality Index for Cities and Major Towns in Tamil Nadu, India. J Civil Environ Eng 8: 304. doi: 10.4172/2165-784X.1000304 Copyright: © 2018 Rajamanickam R, et al. This is an open-access article distributed under the terms of the Creative Commons Attribution License, which permits unrestricted use, distribution, and reproduction in any medium, provided the original author and source are credited. Keywords: Air Quality Index (AQI); Chennai; Cities and major towns; Tamil nadu Introduction e systematic pollution of our environment is one of the biggest hazards that humanity faces. People are becoming increasingly aware of the threat posed by pollution and governments are enacting legislations aimed at protecting the environment. Air pollution may be defined as any atmospheric condition in which certain substances are present in such concentrations that they can produce undesirable effects on man and his environment. ese substances include gases (sulphur oxides, nitrogen oxides, carbon monoxide, hydrocarbons, etc.), particulate matter (smoke, dust, fumes, and aerosols), radioactive materials and many others. Most of these substances are naturally present in the atmosphere in low (background) concentrations and are usually considered to be harmless [1]. Literature Review Indian national ambient air quality standards An air quality standard is a description of a level of air quality that is adopted by a regulatory authority as enforceable. e basis of development of standards is to provide a rational for protecting public health from adverse effects of air pollutants, to eliminate or reduce exposure to hazardous air pollutants, and to guide national/ local authorities for pollution control decisions. With these objectives, Central Pollution Control Board (CPCB) notified Indian National Ambient Air Quality Standards for 12 parameters (Table 1) [2]. Air Quality Index (AQI) e Air Quality Index (AQI) is a reporting system and an important tool of risk communication. It informs the public about the level of ambient air quality, and the potential health risk it would impose, particularly on vulnerable groups such as children, the elderly, and those with existing cardiovascular and respiratory diseases [3]. People use the AQI to make decisions on outdoor activities; for example, schools and sports organizations may check the latest AQI figures to decide whether outdoor sporting events should be conducted on a certain day [4]. e concept of AQI that transforms weighted values of individual air pollution related parameters (e.g. SO 2 , CO, visibility, etc.) into a single number or set of numbers is widely used for air quality communication and decision making in many countries [2]. Air Quality Index converts complex air quality data of various pollutants into a single number (index value), nomenclature and colour. AQI is represented as numeric value varies from 0 to 500. If score is 0, it is the best air quality and if score is 500, it is the worst air quality (Higher AQI higher pollution). ere are six AQI categories, namely Good, Satisfactory, Moderate, Poor, Very Poor, and Severe. Each of these categories is decided based on ambient concentration values of air pollutants and their likely health impacts (known as health breakpoints). Air Quality sub-index and health break points are evolved for eight pollutants (PM 10 , PM 2.5 , NO 2 , SO 2 , CO, O 3 , NH 3 , and Pb) for which short-term (up to 24-hours) National Ambient Air Quality Standards are prescribed. Based on the measured ambient concentrations of a pollutant, sub-index is calculated, which is a linear function of concentration (e.g. the sub-index for PM 2.5 will be 51 at concentration 31 μg/m 3 , 100 at concentration 60 μg/m 3 , and 75 at concentration of 45 μg/m 3 ). e worst sub-index determines the overall AQI. AQI categories and health breakpoints for the eight
Transcript of E nv i ro m onmental Rajamanickam and Nagan Civil nviron ... · o g a oe ae oa. oe 8 e 2 1000304...

Volume 8 • Issue 2 • 1000304J Civil Environ Eng, an open access journalISSN: 2165-784X
Rajamanickam and Nagan, J Civil Environ Eng 2018, 8:2DOI: 10.4172/2165-784X.1000304
Review Article Open Access
Jour
nal o
f Civi
l &Environmental Engineering
ISSN: 2165-784X
Journal of Civil & Environmental Engineering
Assessment of Air Quality Index for Cities and Major Towns in Tamil Nadu, IndiaRajamanickam R1* and Nagan S2
1Department of Environmental Engineering, Tamil Nadu Pollution Control Board, Chennai, Tamil Nadu, India2Department of Civil Engineering, Thiagarajar College of Engineering, Madurai, Tamil Nadu, India
AbstractAir Pollution may be defined as any atmospheric condition in which certain substances are present in such
concentrations that they can produce undesirable effects on man and his environment. The Air Quality Index (AQI) is a reporting system and an important tool of risk communication. It informs the public about the level of ambient air quality, and the potential health risk it would impose. AQI converts complex air quality data of various pollutants into a single number (index value), nomenclature and colour. AQI is represented as numeric value varies from 0 to 500. If score is 0, it is the best air quality and if score is 500, it is the worst air quality. There are six AQI categories, namely Good, Satisfactory, Moderate, Poor, Very Poor, and Severe. Each of these categories is decided based on ambient concentration values of air pollutants and their likely health impacts. In Tamil Nadu, under National Ambient Air Quality Monitoring Programme, Ambient Air Quality (AAQ) is being monitored by Central Pollution Control Board in association with Tamil Nadu Pollution Control Board in 28 locations covering cities, major towns and major industrial areas viz. Chennai, Salem, Coimbatore, Madurai, Trichy, Cuddalore, Mettur, and Thoothukudi. The AAQ data from January 2015 to December 2015 for the above cities and towns is collected and AQI is calculated for four months covering four seasons (i.e.,) January (winter), May (summer), July (monsoon), November (post monsoon). Almost all the stations’ AQI fall under good and satisfactory category except Trichy where the majority of the days the AQI fall under moderate category. From the AQI of all the stations, it is observed that responsible pollutant is PM10. The other parameter (i.e.,) SO2 and NO2 fall under good category for all stations for all days. The higher value of PM10 is mainly due to vehicular pollution.
*Corresponding author: Rajamanickam R, Environmental Engineer, Department of Environmental Engineering, Tamil Nadu Pollution Control Board, 76, Mount Salai, Guindy, Chennai- 600032, Tamil Nadu, India, Tel: 044-22353134–139, Fax: 044-22353068; E-mail: [email protected]`
Received June 26, 2017; Accepted February 23, 2018; Published March 01, 2018
Citation: Rajamanickam R, Nagan S (2018) Assessment of Air Quality Index for Cities and Major Towns in Tamil Nadu, India. J Civil Environ Eng 8: 304. doi: 10.4172/2165-784X.1000304
Copyright: © 2018 Rajamanickam R, et al. This is an open-access article distributed under the terms of the Creative Commons Attribution License, which permits unrestricted use, distribution, and reproduction in any medium, provided the original author and source are credited.
Keywords: Air Quality Index (AQI); Chennai; Cities and majortowns; Tamil nadu
IntroductionThe systematic pollution of our environment is one of the biggest
hazards that humanity faces. People are becoming increasingly aware of the threat posed by pollution and governments are enacting legislations aimed at protecting the environment. Air pollution may be defined as any atmospheric condition in which certain substances are present in such concentrations that they can produce undesirable effects on man and his environment. These substances include gases (sulphur oxides, nitrogen oxides, carbon monoxide, hydrocarbons, etc.), particulate matter (smoke, dust, fumes, and aerosols), radioactive materials and many others. Most of these substances are naturally present in the atmosphere in low (background) concentrations and are usually considered to be harmless [1].
Literature ReviewIndian national ambient air quality standards
An air quality standard is a description of a level of air quality that is adopted by a regulatory authority as enforceable. The basis of development of standards is to provide a rational for protecting public health from adverse effects of air pollutants, to eliminate or reduce exposure to hazardous air pollutants, and to guide national/local authorities for pollution control decisions. With these objectives, Central Pollution Control Board (CPCB) notified Indian National Ambient Air Quality Standards for 12 parameters (Table 1) [2].
Air Quality Index (AQI)
The Air Quality Index (AQI) is a reporting system and an important tool of risk communication. It informs the public about the level of ambient air quality, and the potential health risk it would impose, particularly on vulnerable groups such as children, the elderly, and those with existing cardiovascular and respiratory diseases [3]. People use the AQI to make decisions on outdoor activities; for example, schools and
sports organizations may check the latest AQI figures to decide whether outdoor sporting events should be conducted on a certain day [4].
The concept of AQI that transforms weighted values of individual air pollution related parameters (e.g. SO2, CO, visibility, etc.) into a single number or set of numbers is widely used for air quality communication and decision making in many countries [2]. Air Quality Index converts complex air quality data of various pollutants into a single number (index value), nomenclature and colour. AQI is represented as numeric value varies from 0 to 500. If score is 0, it is the best air quality and if score is 500, it is the worst air quality (Higher AQI higher pollution). There are six AQI categories, namely Good, Satisfactory, Moderate, Poor, Very Poor, and Severe. Each of these categories is decided based on ambient concentration values of air pollutants and their likely health impacts (known as health breakpoints). Air Quality sub-index and health break points are evolved for eight pollutants (PM10, PM2.5, NO2, SO2, CO, O3, NH3, and Pb) for which short-term (up to 24-hours) National Ambient Air Quality Standards are prescribed. Based on the measured ambient concentrations of a pollutant, sub-index is calculated, which is a linear function of concentration (e.g. the sub-index for PM2.5 will be 51 at concentration 31 μg/m3, 100 at concentration 60 μg/m3, and 75 at concentration of 45 μg/m3). The worst sub-index determines the overall AQI. AQI categories and health breakpoints for the eight
shiny-l
Highlight
REVIEW ARTICLE

Volume 8 • Issue 2 • 1000304J Civil Environ Eng, an open access journalISSN: 2165-784X
Citation: Rajamanickam R, Nagan S (2018) Assessment of Air Quality Index for Cities and Major Towns in Tamil Nadu, India. J Civil Environ Eng 8: 304. doi: 10.4172/2165-784X.1000304
Page 2 of 13
3. The sub-indices for monitored pollutants are calculated and disseminated, even if data are inadequate for determining AQI. The Individual pollutant-wise sub-index will provide air quality status for that pollutant.
4. The web-based system is designed to provide AQI on real time basis. It is an automated system that captures data from continuous monitoring stations without human intervention, and displays AQI based on running average values (e.g. AQI at 6 A.M on a day will incorporate data from 6 A.M on previous day to the current day).
5. For manual monitoring stations, an AQI calculator is developed wherein data can be fed manually to get AQI value.
AQI Calculation
( )( ) ( )I HI LO
P P LO LOHI LO
I IC B I
B B
− = × − + −
Where
Ip= Sub Index for a given pollutant concentration
BHI = Break point concentration greater or equal to given concentration (CP)
BLO= Break point concentration smaller or equal to given concentration (CP)
IHI = AQI value corresponding to BHI
ILO = AQI value corresponding to BLO; subtract one from ILO, if ILO is greater than 50
CP = Pollutant concentration
AQI = Max (Ip) (where p = 1, 2…n; whereas ‘n’ denotes no. of pollutants)
Material and MethodsAmbient air quality monitoring in Tamil Nadu under NAMP
Tamil Nadu is the eleventh-largest state in India by area and the sixth-most populous. Under NAMP, Ambient Air Quality is being monitored by CPCB in association with Tamil Nadu Pollution Control Board (TNPCB) in 28 locations covering cities, major towns and major industrial areas viz. Chennai, Salem, Coimbatore, Madurai, Trichy, Cuddalore, Mettur, Thoothukudi. All these stations are manual operated stations. The ambient air samples are collected through high volume samplers by running 24 hours and twice a week. Thus in each stations, not less than 108 samplings are done in a year. PM10, SO2 and NO2 are monitored. Out of these 28 stations, 10 stations were selected to calculate historical AQI so as to know the air quality of the cities and towns [5]. The location of the stations is given in Table 4.
Chennai is the capital of the state. The population is 46,46,732 (2011 Census). Chennai is located in 13.08389°N and 80.27000°E. The area of Greater Chennai Corporation is 426 km2. Chennai elevation is 6 m above mean sea level. Chennai is tropical wet and dry climate city. The weather is hot and humid for most of the year. The city gets most of
pollutants are given in Table 2. Health impacts on each range of AQI are given in Table 3 [2].
Air quality monitoring
In India, CPCB implements the National Ambient Air Quality Monitoring (NAMP) through a Network comprising 544 operating ambient air quality stations covering 224 cities / towns in 26 States and 5 Union territories of the country in compliance with the mandate under the Air (Prevention and Control of Pollution) Act, 1981 to collect compile and disseminate the information on ambient air quality [5]. The air quality monitoring network in India can be classified as (i) online and (ii) manual. The pollutant parameters, frequency of measurement and monitoring methodologies for two networks are very different.
Online monitoring network
These are automated air quality monitoring stations which record continuous hourly, monthly or annually averaged data. In the automatic monitoring stations parameters like PM10, PM2.5, NO2, SO2, CO, O3, etc. are monitored continuously. Data from these stations are available almost in real-time. Thus such networks are most suitable for computation of AQI sub-indices, as information on AQI can be generated in real time. For AQI to be more useful and effective there is a need to set up more online monitoring stations for continuous and easy availability of air quality data for computation of AQI for more Indian cities [6].
Manual
The manual stations involve mostly intermittent air quality data collection, thus such stations are not suitable for AQI calculation particularly for its quick dissemination. In India most of the air quality monitoring stations under NAMP is manually operated stations, and only three criteria pollutants viz. PM10, sulphur dioxide (SO2) and nitrogen dioxide (NO2) are measured, at some stations PM2.5 and Pb are also measured. The monitoring frequency is twice a week. Such manual networks are not suitable for computing AQI, as availability of monitored data could have a lag of 1-3 days and sometimes not available at all. However, some efforts are required to use the information in some productive manner. Historical AQIs on weekly basis can be calculated and used for data interpretation and ranking of cities or towns for further prioritization of actions on air pollution control [2].
Calculation of AQI
The CPCB has given guidelines on calculating AQI as follows [2]:
1. The Sub-indices for individual pollutants at a monitoring location are calculated using its 24-hourly average concentration value (8-hourly in case of CO and O3) and health breakpoint concentration range. The worst sub-index is the AQI for that location.
2. All the eight pollutants may not be monitored at all the locations. Overall AQI is calculated only if data are available for minimum three pollutants out of which one should necessarily be either PM2.5 or PM10. Else, data are considered insufficient for calculating AQI. Similarly, a minimum of 16 hours’ data is considered necessary for calculating sub-index.
Pollutant SO2 NO2 PM2.5 PM10 O3 CO (mg/m3) Pb NH3
Averaging time (hr) 24 24 24 24 1 8 1 8 24 24Standard 80 80 60 100 180 100 4 2 1 400
Note: All units are in μg/m3 unless mentioned otherwise. Source: CPCB.
Table 1: Indian national ambient air quality standards.
Volume 8 • Issue 2 • 1000304J Civil Environ Eng, an open access journalISSN: 2165-784X
Citation: Rajamanickam R, Nagan S (2018) Assessment of Air Quality Index for Cities and Major Towns in Tamil Nadu, India. J Civil Environ Eng 8: 304. doi: 10.4172/2165-784X.1000304
Page 3 of 13
AQI Category PM10 PM2.5 NO2 O3 CO SO2 NH3 Pb(Range) 24-hr 24-hr 24-hr 8-hr 8-hr (mg/ m3) 24-hr 24-hr 24-hr
Good0-50 0-30 0-40 0-50 0-1.0 0-40 0-200 0-0.5
(0-50)Satisfactory
51-100 31-60 41-80 51-100 1.1-2.0 41-80 201-400 0.6 –1.0(51-100)Moderate
101-250 61-90 81-180 101-168 2.1- 10 81-380 401-800 1.1-2.0(101-200)
Poor251-350 91-120 181-280 169-208 10.1-17 381-800 801-1200 2.1-3.0
(201-300)Very poor
351-430 121-250 281-400 209-748* 17.1-34 801-1600 1201-1800 3.1-3.5(301-400)
Severe430 + 250+ 400+ 748+* 34+ 1600+ 1800+ 3.5+
(401-500)*One hourly monitoring (for mathematical calculation only)
Table 2: Breakpoints for AQI scale 0-500 (Units: μg/m3 unless mentioned otherwise).
AQI Associated Health ImpactsGood
Minimal Impact(0–50)
SatisfactoryMay cause minor breathing discomfort to sensitive people
(51–100)Moderate May cause breathing discomfort to the people with lung disease such as asthma and discomfort to people with heart disease, children and older
adults(101–200)Poor
May cause breathing discomfort to people on prolonged exposure and discomfort to people with heart disease with short exposure(201–300)Very Poor
May cause respiratory illness to the people on prolonged exposure. Effect may be more pronounced in people with lung and heart diseases(301–400)
Severe May cause respiratory effects even on healthy people and serious health impacts on people with lung/heart diseases. The health impacts may be experienced even during light physical activity(401-500)
Table 3: Health statements for AQI categories.
S. No. Sampling station location Land use pattern1 Chennai - Adyar Residential area2 Chennai- T.Nagar Commercial area3 Chennai- Manali Industrial area4 Coimbatore – Near Railway Junction Mixed zone5 Salem - Kondalampatti Mixed zone6 Mettur – SIDCO (Salem District) Industrial area7 Madurai – Corporation South Zone Office Mixed zone8 Trichy – Main Guard Gate Traffic zone9 Cuddalore – SIPCOT Kudikadu Industrial area
10 Thoothukudi - SIPCOT Industrial area
Table 4: Sampling station location and the land use pattern.
its seasonal rainfall from the north-east monsoon winds, from mid-October to mid-December. Cyclones in the Bay of Bengal sometimes hit the city. Temperature varies from 24.3°C (min) to 32.9°C (max). Annual rainfall in the region is in the range from 1286 to 1233 mm. The city is situated on the eastern coastal plains. Drained by Cooum river through the centre, Adyar river to the south and Kortalaiyar on the northern fringes. Soil is mostly clay, shale and sandstone [5]. Coimbatore, Salem, Madurai, Trichy, Thoothukudi, Cuddalore are the district headquarters with industrial areas. Mettur in Salem district is an industrial area with thermal power plants and chemical industries [7-9].
The AAQ data from January 2015 to December 2015 for the above 10 stations is collected and AQI is calculated for four months covering four seasons (i.e.,) January (winter), May (summer), July (monsoon), November (post-monsoon). Each month, there are eight set of monitoring data. In some of the months, the no. of data was less due to force of majeure like power failure, rainfall etc.
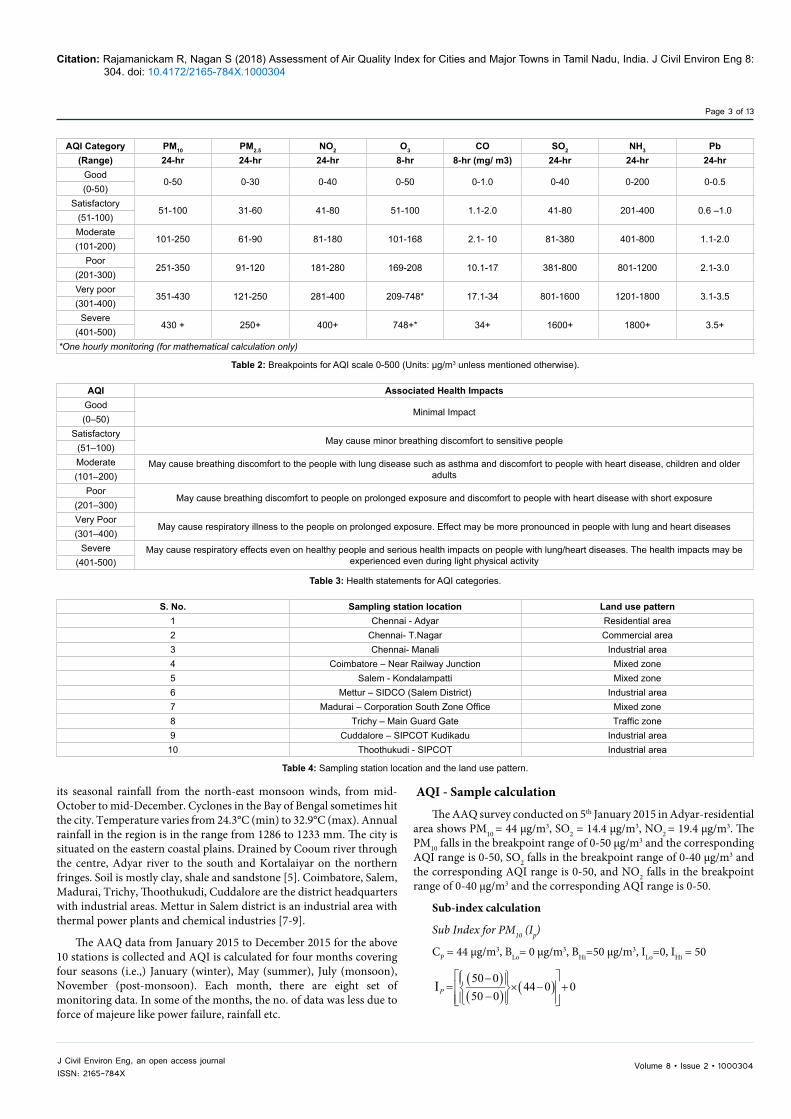
AQI - Sample calculation
The AAQ survey conducted on 5th January 2015 in Adyar-residential area shows PM10 = 44 µg/m3, SO2 = 14.4 µg/m3, NO2 = 19.4 µg/m3. The PM10 falls in the breakpoint range of 0-50 µg/m3 and the corresponding AQI range is 0-50, SO2 falls in the breakpoint range of 0-40 µg/m3 and the corresponding AQI range is 0-50, and NO2 falls in the breakpoint range of 0-40 µg/m3 and the corresponding AQI range is 0-50.
Sub-index calculation
Sub Index for PM10 (Ip)
CP = 44 µg/m3, BLo= 0 µg/m3, BHi=50 µg/m3, ILo=0, IHi = 50
( )( ) ( )50 0
44 0 050 0
IP
− = × − + −

Volume 8 • Issue 2 • 1000304J Civil Environ Eng, an open access journalISSN: 2165-784X
Citation: Rajamanickam R, Nagan S (2018) Assessment of Air Quality Index for Cities and Major Towns in Tamil Nadu, India. J Civil Environ Eng 8: 304. doi: 10.4172/2165-784X.1000304
Page 4 of 13
S. No. SeasonSampling 24 Hours average in µg/m3 Sub- Index
AQIdate PM10 SO2 NO2 PM10 SO2 NO2
1
Winter
5-Jan-15 44 14.4 19.4 44 18 24 442 19-Jan-15 64 13.4 18.4 64 17 23 643 21-Jan-15 57 12.4 19.8 57 16 25 574 23-Jan-15 46 14.1 20.6 46 18 26 465 28-Jan-15 55 13.3 17.8 55 17 22 556 30-Jan-15 42 12.4 19.2 42 16 24 427
Summer
5-May-15 35 14.1 18.3 35 18 23 358 7-May-15 49 15.2 17.3 49 19 22 499 12-May-15 44 13.4 16.2 44 17 20 44
10 14-May-15 47 16.2 19.4 47 20 24 4711 29-May-15 41 15.1 19.1 41 19 24 4112
Monsoon
3-Jul-15 46 13.3 16.9 46 17 21 4613 7-Jul-15 66 14.1 17.8 66 18 22 6614 10-Jul-15 40 14.9 17.1 40 19 21 4015 14-Jul-15 64 13.4 16.2 64 17 20 6416 17-Jul-15 55 12.9 16.6 55 16 21 5517 21-Jul-15 39 11.8 16.5 39 15 21 3918 24-Jul-15 39 12.4 15.5 39 16 19 3919 28-Jul-15 16 12.6 19.5 16 16 24 2420
Post-monsoon
3-Nov-15 37 9.7 13.3 37 12 17 3721 3-Nov-15 25 10.3 12 25 13 15 2522 11-Nov-15 32 11.7 14.8 32 15 19 3223 20-Nov-15 29 9 14 29 11 18 2924 26-Nov-15 38 14.4 15.6 38 18 20 3825 30-Nov-15 32 12 15.1 32 15 19 32
Table 5: Chennai-Adyar residential area - Air quality index.
IP = 44
Sub Index for SO2 (Ip)
CP = 14.4 µg/m3, BLo= 0 µg/m3, BHi=40 µg/m3, ILo=0, IHi = 50
( )( ) ( )50 0
14.4 0 040 0
IP
− = × − + −
IP= 18
Sub Index for NO2 (Ip)
CP = 19.4 µg/m3, BLo= 0 µg/m3, BHi=40 µg/m3, ILo=0, IHi = 50
( )( ) ( )50 0
19.4 0 040 0
IP
− = × − + −
IP= 24.25
AQI = Max (44, 18, 24.25) = 44
Result and Discussion The ambient air quality level and the calculated AQI for the ten
stations are given in the Tables 5 to 14. Almost all the stations’ AQIs fall under good and satisfactory category except Trichy where the majority
S. No. Season Sampling date24 Hours average in µg/m3 Sub- Index
AQIPM10 SO2 NO2 PM10 SO2 NO2
1
Winter
2-Jan-15 86 22.7 28.7 86 28 36 862 6-Jan-15 88 27.9 29.5 88 35 37 883 20-Jan-15 91 32 28.7 91 40 36 914 22-Jan-15 78 26.8 26.8 78 34 34 785 27-Jan-15 93 28.2 27.5 93 35 34 936 29-Jan-15 95 26.8 26.2 95 34 33 957
Summer6-May-15 66 16.6 21.4 66 21 27 66
8 13-May-15 56 15.6 36.7 56 20 46 569 15-May-15 77 18.1 23.9 77 23 30 7710
Monsoon
1-Jul-15 65 16.4 24.6 65 21 31 6511 6-Jul-15 125 13.6 20.8 117 17 26 11712 9-Jul-15 81 17.6 22.5 81 22 28 8113 13-Jul-15 143 15.7 33.3 129 20 42 12914 15-Jul-15 89 15.1 31.4 89 19 39 8915 20-Jul-15 137 13.6 21.6 125 17 27 12516 22-Jul-15 100 14.7 20.6 100 18 26 10017 27-Jul-15 38 15.7 21.6 38 20 27 3818 29-Jul-15 92 16.6 22.8 92 21 29 92

Volume 8 • Issue 2 • 1000304J Civil Environ Eng, an open access journalISSN: 2165-784X
Citation: Rajamanickam R, Nagan S (2018) Assessment of Air Quality Index for Cities and Major Towns in Tamil Nadu, India. J Civil Environ Eng 8: 304. doi: 10.4172/2165-784X.1000304
Page 5 of 13
19Post-monsoon
12-Nov-15 65 12.4 NM 65 16 6520 19-Nov-15 71 15 NM 71 19 7121 27-Nov-15 56 13.7 18.3 56 17 23 56
Table 6: Chennai-T. Nagar commercial area - Air quality index.
S. No. Season Sampling date24 Hours average in µg/m3 Sub- Index
AQIPM10 SO2 NO2 PM10 SO2 NO2
1
Winter
5-Jan-15 33 10.2 15 33 13 19 33
2 12-Jan-15 36 11.4 14.1 36 14 18 36
3 19-Jan-15 44 12.6 11.9 44 16 15 44
4 22-Jan-15 37 12.7 13.6 37 16 17 37
5 29-Jan-15 40 10 11.4 40 13 14 40
6
Summer
4-May-15 33 15.6 17.6 33 20 22 33
7 7-May-15 26 13.2 19.6 26 17 25 26
8 11-May-15 35 15.3 17.3 35 19 22 35
9 14-May-15 27 11.6 17.7 27 15 22 27
10 18-May-15 32 14.9 15.1 32 19 19 32
11 21-May-15 44 15.2 14.5 44 19 18 44
12 25-May-15 44 12.8 18.4 44 16 23 44
13 28-May-15 42 13.1 13.9 42 16 17 42
14
Monsoon
2-Jul-15 51 12.9 18.6 51 16 23 51
15 6-Jul-15 17 14.1 20.5 17 18 26 26
16 9-Jul-15 48 12.5 19.3 48 16 24 48
17 13-Jul-15 32 13.1 20.5 32 16 26 32
18 16-Jul-15 31 15.6 16.8 31 20 21 31
19 20-Jul-15 31 15.3 16.7 31 19 21 31
20 23-Jul-15 26 10.9 20.1 26 14 25 26
21 27-Jul-15 46 13.6 16.6 46 17 21 46
22
Post-monsoon
2-Nov-15 59 12.3 17.7 59 15 22 59
23 5-Nov-15 44 13.3 17.2 44 17 22 44
24 9-Nov-15 23 15.7 15.1 23 20 19 23
25 12-Nov-15 49 19.1 19.3 49 24 24 49
26 16-Nov-15 16.4 19.3 21 24 24
27 19-Nov-15 48 14.4 19 48 18 24 48
28 23-Nov-15 47 13.1 19 47 16 24 47
29 26-Nov-15 45 12.6 19.3 45 16 24 45
30 30-Nov-15 34 14.3 21 34 18 26 34
Table 7: Chennai-Manali industrial area - Air quality index.
S. No. SeasonSampling 24 Hours average in µg/m3 Sub- Index
AQIdate PM10 SO2 NO2 PM SO2 NO2
1
Winter
5-Jan-15 50 4.8 23.6 50 6 30 502 8-Jan-15 60 4 33.2 60 5 42 603 12-Jan-15 54 4.9 28.5 54 6 36 544 19-Jan-15 61 4 23.9 61 5 30 615 22-Jan-15 64 4 26.3 64 5 33 646 29-Jan-15 51 4 24.1 51 5 30 51

Volume 8 • Issue 2 • 1000304J Civil Environ Eng, an open access journalISSN: 2165-784X
Citation: Rajamanickam R, Nagan S (2018) Assessment of Air Quality Index for Cities and Major Towns in Tamil Nadu, India. J Civil Environ Eng 8: 304. doi: 10.4172/2165-784X.1000304
Page 6 of 13
7
Summer
4-May-15 37 4 25 37 5 31 378 7-May-15 36 4 24.5 36 5 31 369 11-May-15 45 4 25 45 5 31 45
10 21-May-15 39 4 27.1 39 5 34 3911 25-May-15 34 4.9 26.1 34 6 33 3412 28-May-15 29 4 30.6 29 5 38 3813
Monsoon
13-Jul-15 39 <4 21.3 39 5 27 3914 16-Jul-15 70 4.2 25.7 70 5 32 7015 20-Jul-15 42 <4 22.4 42 5 28 4216 23-Jul-15 31 <4 26.7 31 5 33 3317 27-Jul-15 39 <4 24.2 39 5 30 3918
Post-monsoon
2-Nov-15 25 <4.0 26.8 25 5 34 3419 5-Nov-15 21 <4.0 30.2 21 5 38 3820 9-Nov-15 57 <4.0 25 57 5 31 5721 12-Nov-15 47 <4.0 31.9 47 5 40 4722 16-Nov-15 32 <4.0 31.9 32 5 40 4023 19-Nov-15 30 <4.0 31.4 30 5 39 3924 23-Nov-15 25 <4.0 22.8 25 5 29 2925 26-Nov-15 66 4.5 23.8 66 6 30 6626 30-Nov-15 59 <4.0 23.2 59 5 29 59
Table 8: Coimbatore-Near railway junction - mixed zone - Air quality index.
S.No. Season Sampling date24 Hours average in µg/m3 Sub- Index
AQIPM10 SO2 NO2 PM10 SO2 NO2
1
Winter
2-Jan-15 41 13.8 20.8 41 17 26 412 6-Jan-15 99 10.4 23.3 99 13 29 993 9-Jan-15 74 11.7 22.4 74 15 28 744 13-Jan-15 48 15.9 24.6 48 20 31 485 20-Jan-15 105 16.5 26.9 104 21 34 1046 23-Jan-15 65 16.8 23.4 65 21 29 657 27-Jan-15 54 16.8 27.6 54 21 35 548 30-Jan-15 60 14.5 24.9 60 18 31 609
Summer
5-May-15 55 12 27 55 15 34 5510 8-May-15 71 14 33 71 18 41 7111 12-May-15 56 9 48 56 11 60 6012 15-May-15 63 13 30 63 16 38 6313 22-May-15 96 11 34 96 14 43 9614 29-May-15 76 12 28 76 15 35 7615
Monsoon
3-Jul-15 63 11 25 63 14 31 6316 10-Jul-15 61 11 20 61 14 25 6117 14-Jul-15 90 14 29 90 18 36 9018 17-Jul-15 57 12 23 57 15 29 5719 21-Jul-15 61 15 25 61 19 31 6120 24-Jul-15 59 13 22 59 16 28 5921 28-Jul-15 101 16 28 101 20 35 10122 31-Jul-15 68 11 21 68 14 26 6823 3-Jul-15 58 14 20 58 18 25 5824
Post-monsoon
13-Nov-15 78 17 24 78 21 30 7825 17-Nov-15 45 14 26 45 18 33 4526 20-Nov-15 101 17 28 101 21 35 10127 24-Nov-15 55 16 18 55 20 23 5528 27-Nov-15 88 19 24 88 24 30 88
Table 9: Madurai-Corporation south zone office - mixed zone - Air quality index.

Volume 8 • Issue 2 • 1000304J Civil Environ Eng, an open access journalISSN: 2165-784X
Citation: Rajamanickam R, Nagan S (2018) Assessment of Air Quality Index for Cities and Major Towns in Tamil Nadu, India. J Civil Environ Eng 8: 304. doi: 10.4172/2165-784X.1000304
Page 7 of 13
S.No. Season Sampling date24 Hours average in µg/m3 Sub- Index
AQIPM10 SO2 NO2 PM10 SO2 NO2
1
Winter
2-Jan-15 46.9 7.4 27.1 47 9 34 472 5-Jan-15 49.3 8 25.7 49 10 32 493 7-Jan-15 47.2 7.7 23.7 47 10 30 474 9-Jan-15 56.8 7.6 22.8 57 10 29 575 12-Jan-15 64.9 7.5 25.4 65 9 32 656 14-Jan-15 66.1 7.8 22.9 66 10 29 667 19-Jan-15 61.7 6.9 23.5 62 9 29 628 21-Jan-15 50.2 10 29.1 50 13 36 509 24-Jan-15 55.5 10.4 26.5 56 13 33 56
10 28-Jan-15 50.4 7 25.3 50 9 32 5011 30-Jan-15 46.1 7.9 26 46 10 33 4612
Summer
6-May-15 58.6 7.7 30.5 59 10 38 5913 8-May-15 61 8.9 28.7 61 11 36 6114 11-May-15 63 7.8 29.5 63 10 37 6315 13-May-15 55.3 8 31.1 55 10 39 5516 15-May-15 48.7 8.2 26.8 49 10 34 4917 18-May-15 55.5 8.5 27 56 11 34 5618 20-May-15 59.9 7.3 24.9 60 9 31 6019 22-May-15 59 9.2 31 59 12 39 5920 27-May-15 42.4 8.6 25.7 42 11 32 4221
Monsoon
14-Jul-15 45.4 7.3 25.6 45 9 32 4522 16-Jul-15 52.9 7.7 26.2 53 10 33 5323 20-Jul-15 53.1 7.9 29.7 53 10 37 5324 22-Jul-15 50.5 7.9 24.2 51 10 30 5125 24-Jul-15 51.3 8.5 23.7 51 11 30 5126 27-Jul-15 49.7 10.5 26.8 50 13 34 5027 29-Jul-15 43.1 7.7 27.9 43 10 35 4328
Post-monsoon
2-Nov-15 57 7.9 20 57 10 25 5729 5-Nov-15 47 7.4 28 47 9 35 4730 10-Nov-15 122 8.6 32 115 11 40 11531 12-Nov-15 49 8.2 23.3 49 10 29 4932 16-Nov-15 44 7.6 34.2 44 10 43 4433 18-Nov-15 44 7.9 29.1 44 10 36 4434 20-Nov-15 43 8 27.8 43 10 35 4335 23-Nov-15 44 8.1 28.3 44 10 35 4436 25-Nov-15 58 7.7 25.4 58 10 32 5837 27-Nov-15 45 7.3 22.5 45 9 28 4538 30-Nov-15 48 7.4 28.4 48 9 36 48
Table 10: Salem-Sowdeswari College - Mixed zone – Air quality index.
S.No. Season Sampling date24 Hours average in µg/m3 Sub- Index
AQIPM10 SO2 NO2 PM10 SO2 NO2
1
Winter
5-Jan-15 103 13 15.2 102 16 19 1022 12-Jan-15 111 15.4 18 108 19 23 1083 19-Jan-15 86 13.3 17.1 86 17 21 864 4-May-15 114 20.2 23 110 25 29 1105
Summer11-May-15 90 18.1 20.5 90 23 26 90
6 18-May-15 105 18 21 104 23 26 1047 25-May-15 113 16 19.4 109 20 24 1098
Monsoon14-Jul-15 140 13.9 22 127 17 28 127
9 21-Jul-15 131 14 23 121 18 29 12110 28-Jul-15 142 14.7 23.5 128 18 29 12811
Post Monsoon
2-Nov-15 121 11.4 20.8 114 14 26 11412 16-Nov-15 127 12.6 23.7 118 16 30 11813 23-Nov-15 95 9.8 18 95 12 23 9514 30-Nov-15 119 10.19 21 113 13 26 113
Table 11: Trichy-Mainguard gate - traffic area - Air quality index.

Volume 8 • Issue 2 • 1000304J Civil Environ Eng, an open access journalISSN: 2165-784X
Citation: Rajamanickam R, Nagan S (2018) Assessment of Air Quality Index for Cities and Major Towns in Tamil Nadu, India. J Civil Environ Eng 8: 304. doi: 10.4172/2165-784X.1000304
Page 8 of 13
S. No. Season Sampling date24 Hours average in µg/m3 Sub-Index
AQIPM10 SO2 NO2 PM10 SO2 NO2
1
Winter
8-Jan-15 41 7 18.5 41 9 23 412 12-Jan-15 42 7.4 21 42 9 26 423 19-Jan-15 53 6.8 18.5 53 9 23 534 22-Jan-15 40 6 15.4 40 8 19 405 27-Jan-15 47 8.9 21.8 47 11 27 476 30-Jan-15 44 7.5 19.1 44 9 24 447
Summer
4-May-15 29 8.1 20.9 29 10 26 298 7-May-15 33 9.5 21.1 33 12 26 339 11-May-15 41 9.2 22.5 41 12 28 4110 14-May-15 38 9.6 20 38 12 25 3811 18-May-15 39 9.6 21 39 12 26 3912 21-May-15 35 9 22.1 35 11 28 3513 25-May-15 38 9.3 21.6 38 12 27 3814 28-May-15 35 8.5 21.6 35 11 27 3515
Monsoon
16-Jul-15 30 8.3 21 30 10 26 3016 21-Jul-15 31 9.6 21.2 31 12 27 3117 24-Jul-15 41 9.3 22.4 41 12 28 4118 28-Jul-15 39 9.2 20.2 39 12 25 3919
Post-monsoon
4-Nov-15 41 9.9 14.9 41 12 19 4120 7-Nov-15 41 8.2 13.1 41 10 16 4121 11-Nov-15 39 8.2 13.5 39 10 17 3922 14-Nov-15 41 6.1 12.7 41 8 16 4123 18-Nov-15 43 7.5 18.9 43 9 24 4324 21-Nov-15 36 10.5 17.1 36 13 21 3625 25-Nov-15 40 8.1 17.2 40 10 22 4026 28-Nov-15 41 8.2 13.8 41 10 17 41
Table 12: Cuddalore SIPCOT office-industrial area - Air Quality Index.
S. No. Season Sampling date24 Hours average in µg/Nm3 Sub- Index
AQIPM10 SO2 NO2 PM10 SO2 NO2
1
Winter
5-Jan-15 25 10.1 11.4 25 13 14 252 8-Jan-15 44 14.2 14.1 44 18 18 443 12-Jan-15 85 14.9 15.2 85 19 19 854 19-Jan-15 56 14.7 15.9 56 18 20 565 22-Jan-15 87 15.3 15.3 87 19 19 876 29-Jan-15 48 14.9 16.3 48 19 20 487
Summer
4-May-15 95 15.5 20.28 95 19 25 958 7-May-15 124 14.92 21 116 19 26 1169 11-May-15 69 15.39 22.28 69 19 28 69
10 14-May-15 75 14.91 22.86 75 19 29 7511 18-May-15 157 16.2 21.54 138 20 27 13812 21-May-15 117 15.39 22.8 112 19 29 11213 25-May-15 100 15.51 22.56 100 19 28 10014 28-May-15 79 9.64 13.51 79 12 17 7915
Monsoon
2-Jul-15 93 15.9 21.49 93 20 27 9316 6-Jul-15 91 14.96 22.37 91 19 28 9117 9-Jul-15 81 15.33 24.39 81 19 30 8118 13-Jul-15 123 16.02 20.69 116 20 26 11619 16-Jul-15 189 8.23 11.01 159 10 14 15920 20-Jul-15 201 9.76 16.65 167 12 21 16721 23-Jul-15 92 10.59 15.45 92 13 19 9222 27-Jul-15 118 15.99 22.23 112 20 28 11223
Post-monsoon
2-Nov-15 131 13.05 14.48 121 16 18 12124 5-Nov-15 109 16.42 21.99 106 21 27 10625 9-Nov-15 38 5.14 7.05 38 6 9 3826 12-Nov-15 98 10.15 15.59 98 13 19 9827 16-Nov-15 99 9.99 13.33 99 12 17 9928 19-Nov-15 89 15.63 18.96 89 20 24 8929 23-Nov-15 NM NM NM30 26-Nov-15 65 15.92 24.71 65 20 31 6531 30-Nov-15 54 14.38 22.16 54 18 28 54
Table 13: Thoothukudi SIPCOT-industrial area –Air quality index.

Volume 8 • Issue 2 • 1000304J Civil Environ Eng, an open access journalISSN: 2165-784X
Citation: Rajamanickam R, Nagan S (2018) Assessment of Air Quality Index for Cities and Major Towns in Tamil Nadu, India. J Civil Environ Eng 8: 304. doi: 10.4172/2165-784X.1000304
Page 9 of 13
of the days the AQI fall under moderate category. From the AQIs of all the 10 stations, it is observed that responsible pollutant is PM10. The other parameter (i.e.,) SO2 and NO2 fall under good category for all stations for all days.
Chennai-Adyar AQI varies from 24 to 66. Majority of days, AQI falls in good category and in monsoon period AQI falls in satisfactory category. Vehicular pollution is the main cause for increase in PM10 level. Chennai-T.Nagar AQI varies from 38 to 129. Almost all the days of monitoring, the air quality is at satisfactory level. Whereas during monsoon period the ambient air quality was at moderate level. It is a commercial area, vehicular movement is the cause for PM10
contribution. Chennai-Manali AQI was in the range of 23-59. All most all the days, the air quality was good and in monsoon and post monsoon period it reached to the satisfactory level.
Coimbatore-Near railway junction AQI was in the range of 29-70. In the winter season, the ambient air quality was in the satisfactory level. In other season, the air quality falls under good category. It is a mixed residential area with heavy traffic flow. Madurai AQI was in the
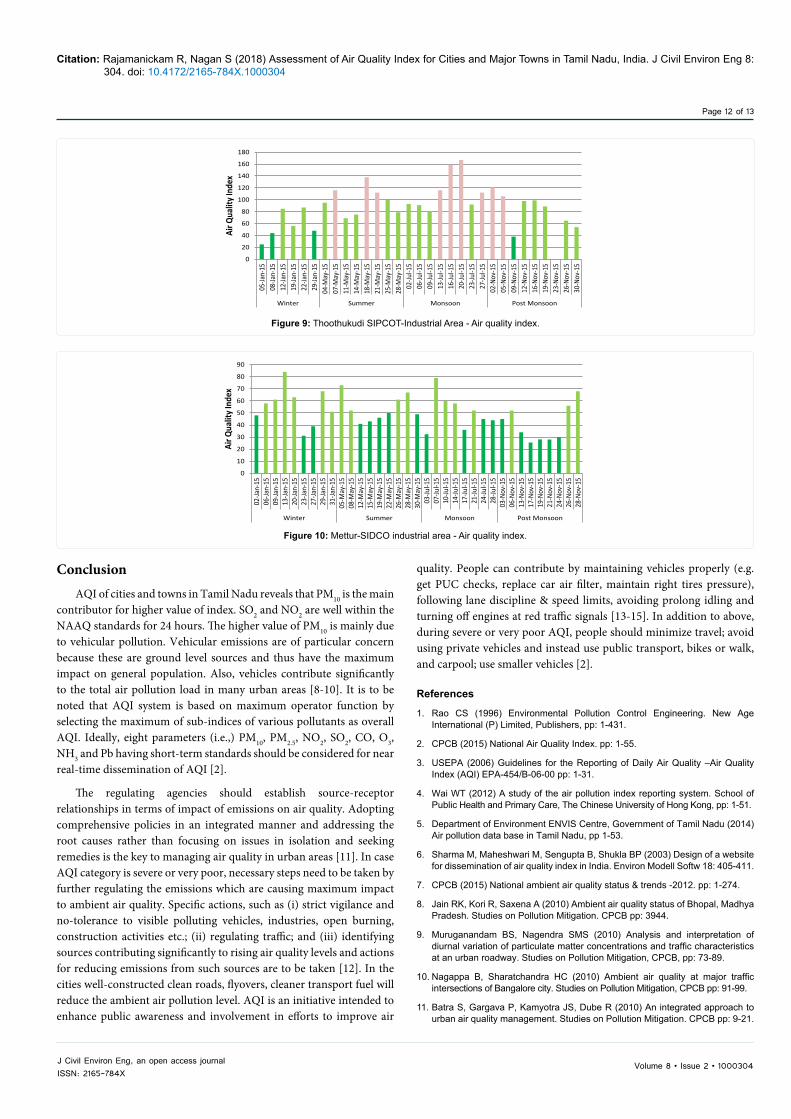
range of 41-104. Most of the days, the air quality was in satisfactory level. The maximum index was recorded in winter season. Salem AQI was in the range of 42 – 115. In most of the days, the index was in good and satisfactory level. The maximum index occurred in post monsoon period. In Trichy-Main Guard gate area, the AQI was in the range of 86-128 and most of days the ambient air quality was in moderate level. This is a traffic junction area, hence high contribution of PM10. In Cuddalore-SIPCOT Industrial complex, the AQI was in the range of 29-53. Almost all the days, the ambient air quality is in good level. This Industrial complex is housing chemical and pharmaceutical units, and this Industrial complex is near to the Bay of Bengal getting sea breeze leading for better dispersion. AQI for Thoothukudi –SIPCOT Industrial complex was in the range of 25-167. Most of the days the ambient air quality is in satisfactory or moderate level. The cause of high level of PM10 is due to the presence of major power plants, copper smelter plant, fertilizer plant and other units. The AQI of Mettur-SIDCO Industrial Estate was in the range of 26-84 and it falls in good and satisfactory level. The AQI for all the 10 stations are given in pictorial form in Figures 1 to 10.
S. No. Season24 Hours average in µg/Nm3 Sub- Index
AQIPM10 SO2 NO2 PM10 SO2 NO2
1
Winter
2-Jan-15 48 8.7 31.9 48 11 40 482 6-Jan-15 58 9.6 33.6 58 12 42 583 9-Jan-15 61 8.8 34.1 61 11 43 614 13-Jan-15 84 8.9 28.4 84 11 36 845 20-Jan-15 63 8.3 27.7 63 10 35 636 23-Jan-15 30 8.5 24.9 30 11 31 317 27-Jan-15 39 8.7 27.7 39 11 35 398 29-Jan-15 68 9.2 27 68 12 34 689 31-Jan-15 51 8.5 29.6 51 11 37 51
10
Summer
5-May-15 73 9.6 23.3 73 12 29 7311 8-May-15 52 7.3 19 52 9 24 5212 12-May-15 41 8.8 22.3 41 11 28 4113 15-May-15 43 7.9 20 43 10 25 4314 19-May-15 46 9.6 25.4 46 12 32 4615 22-May-15 50 9.3 25.04 50 12 31 5016 26-May-15 61 8.4 25.3 61 11 32 6117 28-May-15 67 9.5 26 67 12 33 6718 30-May-15 49 9.1 25.3 49 11 32 4919
Monsoon
3-Jul-15 31 8.7 25.9 31 11 32 3220 7-Jul-15 79 8.7 26.4 79 11 33 7921 10-Jul-15 60 7.7 25 60 10 31 6022 14-Jul-15 58 8.9 27.7 58 11 35 5823 17-Jul-15 36 8.8 25.6 36 11 32 3624 21-Jul-15 52 9.2 26 52 12 33 5225 24-Jul-15 45 8.5 23 45 11 29 4526 28-Jul-15 44 7.5 26.3 44 9 33 4427
Post-monsoon
3-Nov-15 45 8.4 24 45 11 30 4528 6-Nov-15 52 7.3 21.4 52 9 27 5229 13-Nov-15 34 6.4 12.5 34 8 16 3430 17-Nov-15 19 6 20.4 19 8 26 2631 19-Nov-15 21 7.3 22.5 21 9 28 2832 21-Nov-15 28 6.8 21.1 28 9 26 2833 24-Nov-15 28 6.9 24 28 9 30 3034 26-Nov-15 56 9.5 28.4 56 12 36 5635 28-Nov-15 68 9.2 35 68 12 44 68
Table 14: Mettur-SIDCO industrial area - Air quality index.

Volume 8 • Issue 2 • 1000304J Civil Environ Eng, an open access journalISSN: 2165-784X
Citation: Rajamanickam R, Nagan S (2018) Assessment of Air Quality Index for Cities and Major Towns in Tamil Nadu, India. J Civil Environ Eng 8: 304. doi: 10.4172/2165-784X.1000304
Page 10 of 13
0
10
20
30
40
50
60
70
05-Ja
n-15
19-Ja
n-15
21-Ja
n-15
23-Ja
n-15
28-Ja
n-15
30-Ja
n-15
05-M
ay-1
507
-May
-15
12-M
ay-1
514
-May
-15
29-M
ay-1
503
-Jul-1
507
-Jul-1
510
-Jul-1
514
-Jul-1
517
-Jul-1
521
-Jul-1
524
-Jul-1
528
-Jul-1
503
-Nov
-15
03-N
ov-1
511
-Nov
-15
20-N
ov-1
526
-Nov
-15
30-N
ov-1
5
Winter Summer Monsoon Post-monsoon
Air Q
ualit
y In
dex
Figure 1: Chennai-Adyar residential area - Air quality index.
020406080
100120140
02-Ja
n-15
06-Ja
n-15
20-Ja
n-15
22-Ja
n-15
27-Ja
n-15
29-Ja
n-15
06-M
ay-1
5
13-M
ay-1
5
15-M
ay-1
5
01-Ju
l-15
06-Ju
l-15
09-Ju
l-15
13-Ju
l-15
15-Ju
l-15
20-Ju
l-15
22-Ju
l-15
27-Ju
l-15
29-Ju
l-15
12-N
ov-1
5
19-N
ov-1
5
27-N
ov-1
5
Winter Summer Monsoon Post-monsoon
Air Q
ualit
y In
dex
Figure 2: Chennai-T. Nagar commercial zone - Air quality index.
0
10
20
30
40
50
60
70
05-Ja
n-15
,12
-Jan-
1519
-Jan-
1522
-Jan-
1529
-Jan-
1504
-May
-15
07-M
ay-1
511
-May
-15
14-M
ay-1
518
-May
-15
21-M
ay-1
525
-May
-15
28-M
ay-1
502
-Jul-1
506
-Jul-1
509
-Jul-1
513
-Jul-1
516
-Jul-1
520
-Jul-1
523
-Jul-1
527
-Jul-1
502
-Nov
-15
05-N
ov-1
509
-Nov
-15
12-N
ov-1
516
-Nov
-15
19-N
ov-1
523
-Nov
-15
26-N
ov-1
530
-Nov
-15
Winter Summer Monsoon Post Monsoon
Air Q
ualit
y In
dex
Figure 3: Chennai-Manali industrial area - Air quality index.
0
10
20
30
40
50
60
70
80
05-Ja
n-15
08-Ja
n-15
12-Ja
n-15
19-Ja
n-15
22-Ja
n-15
29-Ja
n-15
04-M
ay-1
5
07-M
ay-1
5
11-M
ay-1
5
21-M
ay-1
5
25-M
ay-1
5
28-M
ay-1
5
13-Ju
l-15
16-Ju
l-15
20-Ju
l-15
23-Ju
l-15
27-Ju
l-15
02-N
ov-1
5
05-N
ov-1
5
09-N
ov-1
5
12-N
ov-1
5
16-N
ov-1
5
19-N
ov-1
5
23-N
ov-1
5
26-N
ov-1
5
30-N
ov-1
5
Winter Summer Mansoon Post Monsoon
Air Q
ualit
y In
dex
Figure 4: Coimbatore-Mixed zone - Air quality index.

Volume 8 • Issue 2 • 1000304J Civil Environ Eng, an open access journalISSN: 2165-784X
Citation: Rajamanickam R, Nagan S (2018) Assessment of Air Quality Index for Cities and Major Towns in Tamil Nadu, India. J Civil Environ Eng 8: 304. doi: 10.4172/2165-784X.1000304
Page 11 of 13
0
20
40
60
80
100
120
02-Ja
n-15
06-Ja
n-15
09-Ja
n-15
13-Ja
n-15
20-Ja
n-15
23-Ja
n-15
27-Ja
n-15
30-Ja
n-15
05-M
ay-1
508
-May
-15
12-M
ay-1
515
-May
-15
22-M
ay-1
529
-May
-15
03-Ju
l-15
10-Ju
l-15
14-Ju
l-15
17-Ju
l-15
21-Ju
l-15
24-Ju
l-15
28-Ju
l-15
31-Ju
l-15
03-Ju
l-15
13-N
ov-1
517
-Nov
-15
20-N
ov-1
524
-Nov
-15
27-N
ov-1
5
Winter Summer Monsoon Post Monsoon
Air Q
ualit
y In
dex
Figure 5: Madurai-Mixed zone – Air quality index.
0
20
40
60
80
100
120
140
02-Ja
n-15
07-Ja
n-15
12-Ja
n-15
19-Ja
n-15
24-Ja
n-15
30-Ja
n-15
08-M
ay-1
5
13-M
ay-1
5
18-M
ay-1
5
22-M
ay-1
5
14-Ju
l-15
20-Ju
l-15
24-Ju
l-15
29-Ju
l-15
05-N
ov-1
5
12-N
ov-1
5
18-N
ov-1
5
23-N
ov-1
5
27-N
ov-1
5
Winter Summer Monsoon Post Monsoon
Air Q
ualit
y Ind
ex
Figure 6: Salem-Sowdeswari College mixed zone - Air quality index.
0
20
40
60
80
100
120
140
05-Ja
n-15
12-Ja
n-15
19-Ja
n-15
04-M
ay-1
5
11-M
ay-1
5
18-M
ay-1
5
25-M
ay-1
5
14-Ju
l-15
21-Ju
l-15
28-Ju
l-15
02-N
ov-1
5
16-N
ov-1
5
23-N
ov-1
5
30-N
ov-1
5
Winter Summer Monsoon Post Monsoon
Air Q
ualit
y Ind
ex
Figure 7: Trichy-Mainguard Gate-Traffic area - Air quality index.
0
10
20
30
40
50
60
08-Ja
n-15
12-Ja
n-15
19-Ja
n-15
22-Ja
n-15
27-Ja
n-15
30-Ja
n-15
04-M
ay-1
507
-May
-15
11-M
ay-1
514
-May
-15
18-M
ay-1
521
-May
-15
25-M
ay-1
528
-May
-15
16-Ju
l-15
21-Ju
l-15
24-Ju
l-15
28-Ju
l-15
04-N
ov-1
507
-Nov
-15
11-N
ov-1
514
-Nov
-15
18-N
ov-1
521
-Nov
-15
25-N
ov-1
528
-Nov
-15
Winter Summer Monsoon Post Monsoon
Air Q
ualit
y Ind
ex
Figure 8: Cuddalore SIPCOT Office industrial area - Air quality index.
Volume 8 • Issue 2 • 1000304J Civil Environ Eng, an open access journalISSN: 2165-784X
Citation: Rajamanickam R, Nagan S (2018) Assessment of Air Quality Index for Cities and Major Towns in Tamil Nadu, India. J Civil Environ Eng 8: 304. doi: 10.4172/2165-784X.1000304
Page 12 of 13
0
20
40
60
80
100
120
140
160
180
05-Ja
n-15
08-Ja
n-15
12-Ja
n-15
19-Ja
n-15
22-Ja
n-15
29-Ja
n-15
04-M
ay-1
507
-May
-15
11-M
ay-1
514
-May
-15
18-M
ay-1
521
-May
-15
25-M
ay-1
528
-May
-15
02-Ju
l-15
06-Ju
l-15
09-Ju
l-15
13-Ju
l-15
16-Ju
l-15
20-Ju
l-15
23-Ju
l-15
27-Ju
l-15
02-N
ov-1
505
-Nov
-15
09-N
ov-1
512
-Nov
-15
16-N
ov-1
519
-Nov
-15
23-N
ov-1
526
-Nov
-15
30-N
ov-1
5
Winter Summer Monsoon Post Monsoon
Air Q
ualit
y Ind
ex
Figure 9: Thoothukudi SIPCOT-Industrial Area - Air quality index.
0
10
20
30
40
50
60
70
80
90
02-Ja
n-15
06-Ja
n-15
09-Ja
n-15
13-Ja
n-15
20-Ja
n-15
23-Ja
n-15
27-Ja
n-15
29-Ja
n-15
31-Ja
n-15
05-M
ay-1
508
-May
-15
12-M
ay-1
515
-May
-15
19-M
ay-1
522
-May
-15
26-M
ay-1
528
-May
-15
30-M
ay-1
503
-Jul-1
507
-Jul-1
510
-Jul-1
514
-Jul-1
517
-Jul-1
521
-Jul-1
524
-Jul-1
528
-Jul-1
503
-Nov
-15
06-N
ov-1
513
-Nov
-15
17-N
ov-1
519
-Nov
-15
21-N
ov-1
524
-Nov
-15
26-N
ov-1
528
-Nov
-15
Winter Summer Monsoon Post Monsoon
Air Q
ualit
y Ind
ex
Figure 10: Mettur-SIDCO industrial area - Air quality index.
ConclusionAQI of cities and towns in Tamil Nadu reveals that PM10 is the main
contributor for higher value of index. SO2 and NO2 are well within the NAAQ standards for 24 hours. The higher value of PM10 is mainly due to vehicular pollution. Vehicular emissions are of particular concern because these are ground level sources and thus have the maximum impact on general population. Also, vehicles contribute significantly to the total air pollution load in many urban areas [8-10]. It is to be noted that AQI system is based on maximum operator function by selecting the maximum of sub-indices of various pollutants as overall AQI. Ideally, eight parameters (i.e.,) PM10, PM2.5, NO2, SO2, CO, O3, NH3 and Pb having short-term standards should be considered for near real-time dissemination of AQI [2].
The regulating agencies should establish source-receptor relationships in terms of impact of emissions on air quality. Adopting comprehensive policies in an integrated manner and addressing the root causes rather than focusing on issues in isolation and seeking remedies is the key to managing air quality in urban areas [11]. In case AQI category is severe or very poor, necessary steps need to be taken by further regulating the emissions which are causing maximum impact to ambient air quality. Specific actions, such as (i) strict vigilance and no-tolerance to visible polluting vehicles, industries, open burning, construction activities etc.; (ii) regulating traffic; and (iii) identifying sources contributing significantly to rising air quality levels and actions for reducing emissions from such sources are to be taken [12]. In the cities well-constructed clean roads, flyovers, cleaner transport fuel will reduce the ambient air pollution level. AQI is an initiative intended to enhance public awareness and involvement in efforts to improve air
quality. People can contribute by maintaining vehicles properly (e.g. get PUC checks, replace car air filter, maintain right tires pressure), following lane discipline & speed limits, avoiding prolong idling and turning off engines at red traffic signals [13-15]. In addition to above, during severe or very poor AQI, people should minimize travel; avoid using private vehicles and instead use public transport, bikes or walk, and carpool; use smaller vehicles [2].
References
1. Rao CS (1996) Environmental Pollution Control Engineering. New Age International (P) Limited, Publishers, pp: 1-431.
2. CPCB (2015) National Air Quality Index. pp: 1-55.
3. USEPA (2006) Guidelines for the Reporting of Daily Air Quality –Air Quality Index (AQI) EPA-454/B-06-00 pp: 1-31.
4. Wai WT (2012) A study of the air pollution index reporting system. School of Public Health and Primary Care, The Chinese University of Hong Kong, pp: 1-51.
5. Department of Environment ENVIS Centre, Government of Tamil Nadu (2014) Air pollution data base in Tamil Nadu, pp 1-53.
6. Sharma M, Maheshwari M, Sengupta B, Shukla BP (2003) Design of a website for dissemination of air quality index in India. Environ Modell Softw 18: 405-411.
7. CPCB (2015) National ambient air quality status & trends -2012. pp: 1-274.
8. Jain RK, Kori R, Saxena A (2010) Ambient air quality status of Bhopal, Madhya Pradesh. Studies on Pollution Mitigation. CPCB pp: 3944.
9. Muruganandam BS, Nagendra SMS (2010) Analysis and interpretation of diurnal variation of particulate matter concentrations and traffic characteristics at an urban roadway. Studies on Pollution Mitigation, CPCB, pp: 73-89.
10. Nagappa B, Sharatchandra HC (2010) Ambient air quality at major traffic intersections of Bangalore city. Studies on Pollution Mitigation, CPCB pp: 91-99.
11. Batra S, Gargava P, Kamyotra JS, Dube R (2010) An integrated approach to urban air quality management. Studies on Pollution Mitigation. CPCB pp: 9-21.

Volume 8 • Issue 2 • 1000304J Civil Environ Eng, an open access journalISSN: 2165-784X
Citation: Rajamanickam R, Nagan S (2018) Assessment of Air Quality Index for Cities and Major Towns in Tamil Nadu, India. J Civil Environ Eng 8: 304. doi: 10.4172/2165-784X.1000304
Page 13 of 13
12. CPCB (2007) Document on conceptual guidelines and common methodology for air quality monitoring, emission inventory and source apportionment studies for Indian cities.
13. Schwela D (2006) Urban air pollution in Asian cities: status, challenges and management. Routledge, USA.
14. Sarasamma JD (2014) Air quality assessment in the surroundings of KMML industrial area, Chavara in Kerala, South India. Aerosol Air Qual Res 14: 1769-1778.
15. Bhuyan B, Gupta R (2014) Assessment of urban air quality in Guwahati city, India, using air quality index. Zenith International Journal of Multidisciplinary Research 4: 90-99.