E-mobility in the Netherlands
38
Towards electric mobility in The Netherlands An invitation to cooperation The electric cars that drove around in the first science fiction films seemed to represent life in a society way off into the future. Cars were powered by petrol and later occasionally by LPG and diesel. Now, the fantasy has become a reality. Electric cars have now become so advanced that they have become accessible to the man in the street. Driving electric is good for the environment and good for the economy. Actually making the switch requires cooperation at all kinds of levels – economic, technological, governmental – between commercial and non-commercial parties. In this brochure, Essent and Enexis invite you to join them on an accelerated journey towards sustainable mobility and help make the Netherlands a pioneer in the field of electric transportation. Attaining such a position will create opportunities for our knowledge and services economy. Let us together make the most of these opportunities! On the way to sustainable mobility!
description
About the introduction of e-mobility and electric cars in the Netherlands.
Transcript of E-mobility in the Netherlands

Towards electric mobility in The Netherlands
An invitation to cooperation
The electric cars that drove around in the first science
fiction films seemed to represent life in a society way
off into the future. Cars were powered by petrol and
later occasionally by LPG and diesel. Now, the fantasy
has become a reality. Electric cars have now become so
advanced that they have become accessible to the man
in the street.
Driving electric is good for the environment and
good for the economy. Actually making the switch
requires cooperation at all kinds of levels – economic,
technological, governmental – between commercial
and non-commercial parties.
In this brochure, Essent and Enexis invite you to join
them on an accelerated journey towards sustainable
mobility and help make the Netherlands a pioneer in
the field of electric transportation. Attaining such a
position will create opportunities for our knowledge
and services economy. Let us together make the most
of these opportunities!
On the way to sustainable mobility!

Mobility: the key to a sustainable future
1

�
It is a major factor in both our work and our private
lives. The fact that the economy is growing and
society is becoming more individualised means
that the need for mobility is also growing.
The downside of the increasing number of
kilometres we are travelling are well-documented,
namely air pollution, noise nuisance, congested
roads and severe dependency on fossil fuels, of
which sources are becoming more and more scarce.
If we want the economy to continue growing and
want to carry on living comfortably, travelling and
engaging in leisure activities, we will have to find
ways of making our mobility a lot cleaner and
more sustainable. By switching to electrically-
powered cars, we take a huge step towards
sustainable mobility and with that towards a
sustainable future in the Netherlands.
1 Mobility is a fast-growing necessity
Private cars All forms of mobilityLight transport 2007 2025
0 1 2 3 4 5 6 7 8
2000
1995
2005
1990
1985
1980
0 5 10 15 20 25 30 35 40 45 50
the Netherlands
Flevoland
Drenthe
Noord-Brabant
Overijssel
Zeeland
Gelderland
Limburg
Friesland
Utrecht
Zuid-Holland
Noord-Holland
0 50 100 150 200
2005
2000
1995
1990
1985
Groningen
Share of one-person households per province, 2007 and 2025
Society is becoming more and more individual and that will lead to an additional increase in the need for mobility

�
Car 48%
Motorcycle/bicycle 28%
Leisure time 38%
Shopping 21%
Commuting 17%
Other 11%
Education 9%
Business 3%
Walking 17%
Public transport 5%
Other 1%
Car Walking Other
Motor cycle Public transport
Leisure time Commuting Business
OtherShopping Business
Cars play an important role in economic and leisure activities.
Modes of transportMobility motives
Growth in the cumulative distance travelled per year (in billions of km)
Number of private cars (in millions of vehicles)
Private cars All forms of mobilityLight transport 2007 2025
0 1 2 3 4 5 6 7 8
2000
1995
2005
1990
1985
1980
0 5 10 15 20 25 30 35 40 45 50
the Netherlands
Flevoland
Drenthe
Noord-Brabant
Overijssel
Zeeland
Gelderland
Limburg
Friesland
Utrecht
Zuid-Holland
Noord-Holland
0 50 100 150 200
2005
2000
1995
1990
1985
Groningen
The number of private cars and the number of kilometres travelled have increased in recent years

Electricity: the most powerful motor of sustainable mobility
2
�
Electric transportation: clean, silent and efficient 2
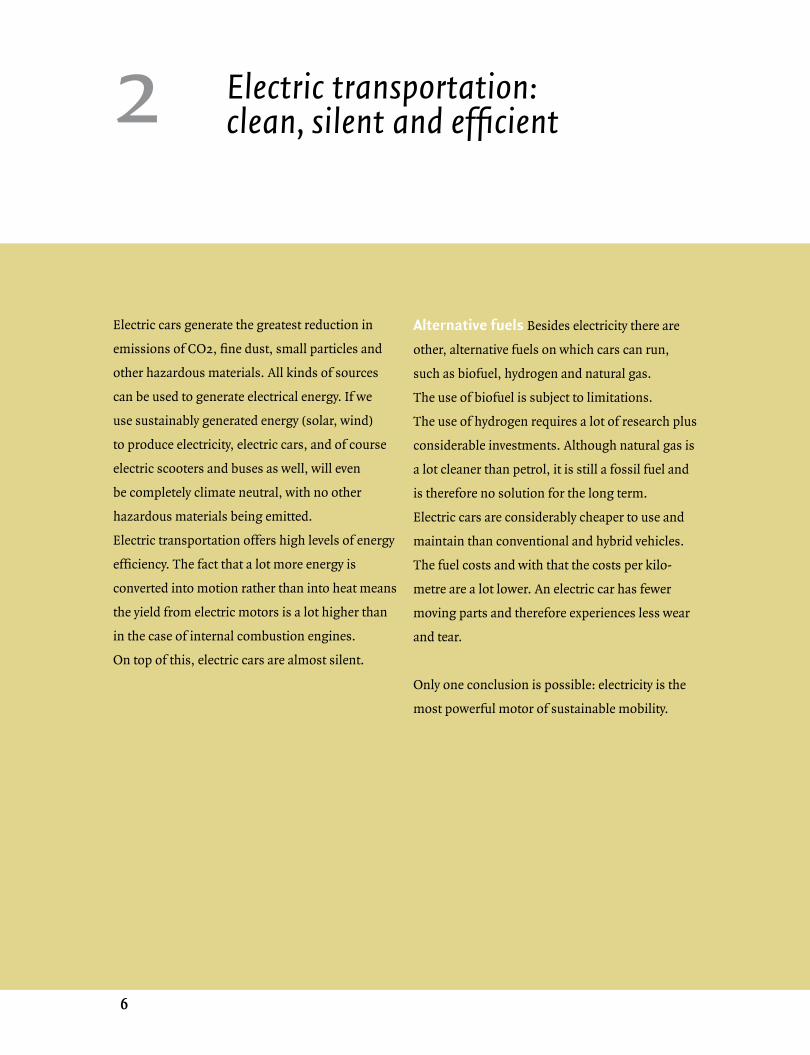
Electric cars generate the greatest reduction in
emissions of CO2, fine dust, small particles and
other hazardous materials. All kinds of sources
can be used to generate electrical energy. If we
use sustainably generated energy (solar, wind)
to produce electricity, electric cars, and of course
electric scooters and buses as well, will even
be completely climate neutral, with no other
hazardous materials being emitted.
Electric transportation offers high levels of energy
efficiency. The fact that a lot more energy is
converted into motion rather than into heat means
the yield from electric motors is a lot higher than
in the case of internal combustion engines.
On top of this, electric cars are almost silent.
Alternative fuels Besides electricity there are
other, alternative fuels on which cars can run,
such as biofuel, hydrogen and natural gas.
The use of biofuel is subject to limitations.
The use of hydrogen requires a lot of research plus
considerable investments. Although natural gas is
a lot cleaner than petrol, it is still a fossil fuel and
is therefore no solution for the long term.
Electric cars are considerably cheaper to use and
maintain than conventional and hybrid vehicles.
The fuel costs and with that the costs per kilo-
metre are a lot lower. An electric car has fewer
moving parts and therefore experiences less wear
and tear.
Only one conclusion is possible: electricity is the
most powerful motor of sustainable mobility.
�
Petrol
Diesel
LPG
Ethanol/petrol
Oil
Biofuel crops
Oil
Biofuel crops Sun
Wind
Coal
Natural gas
Electricity
CNG*Natural gas/Green Gas
* Compressed Natural Gas
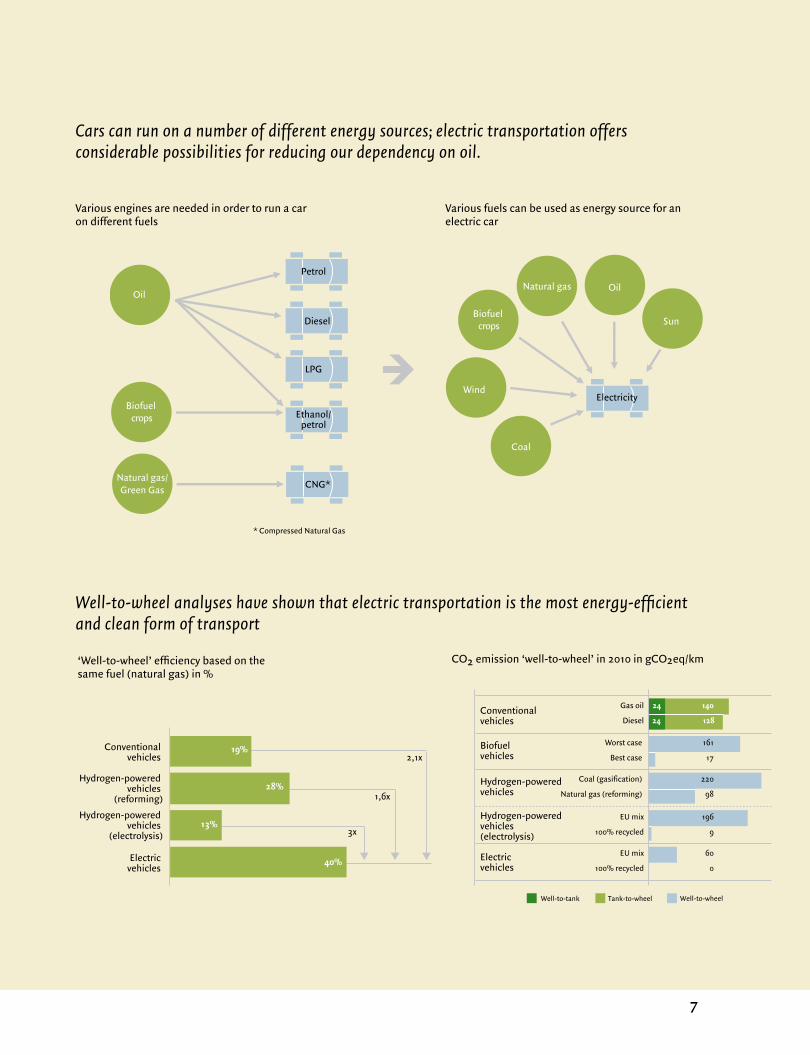
Various engines are needed in order to run a car on different fuels
Various fuels can be used as energy source for an electric car
Cars can run on a number of different energy sources; electric transportation offers considerable possibilities for reducing our dependency on oil.
Biofuel vehicles
Conventional vehicles
Gas oil 24 140
Diesel 24 128
Worst case
Best case
161
17
Coal (gasification)
Natural gas (reforming)
EU mix
100% recycled
EU mix
100% recycled
220
98
196
9
60
0
Hydrogen-powered vehicles
Hydrogen-powered vehicles (electrolysis)
Electric vehicles
Well-to-wheelTank-to-wheelWell-to-tank
40%
13%
28%
19%2,1x
1,6x
3x
Conventional vehicles
Hydrogen-powered vehicles
(reforming)
Hydrogen-powered vehicles
(electrolysis)
Electric vehicles
Well-to-wheel analyses have shown that electric transportation is the most energy-efficient and clean form of transport
‘Well-to-wheel’ efficiency based on the same fuel (natural gas) in %
CO2 emission ‘well-to-wheel’ in 2010 in gCO2eq/km

�
Electric cars generate the greatest reduction in emissions of CO2, fine dust, small particles and other hazardous materials
2

�
60 g CO2/km1.2 MJ/km E-car on 100% sustainable fuel
CO2: 1.5 Mton/yearEnergy: 17 PJ/year
E-car on 100% sustainable fuelCO2: 2.3 Mton/yearEnergy: 34 PJ/year
164 g CO2/km2.4 MJ/km
0 g CO2/km0 MJ/km fossil energy
Fuel mix
1.2 million households
1.8 million households
Oil
Sustainable
Electricity
Electricity
Petrol
Sample calculation: one million electric vehicles would reduce energy consumption in the Netherlands by 17-34 PJ per year, and CO2 emissions by 1.5-2.3 Mton per year
Comparable with emissions of:Saving
Personenauto’s en bestelwagens Totale wegtransport
0 50 100 150 200 250 300
2010
2005
2000
1995
1990
Personenauto’s en bestelwagens Totale wegtransport
0 5 10 15 20
2010
2005
2000
1995
1990
Amsterdam
40
196The Hague
14Utrecht
1612
4
26Zaanstad
Tilburg
Rotterdam
73
100
Number of residents x1000 of an area with an NO2 value above the permitted level
The total number of residents exposed to NO2 above the permitted level is 166,100
Number of residents x1000 of an area with a PM10 value above the permitted level
The total number of residents exposed to PM10 above the permitted level is 415,100
The top 6 Dutch cities as regards exposure to extreme values PM10 and N02 in proportion to the number of people resident in areas with PM10 and NO2 values above the permitted level in 2006
Electric transportation produces no local emissions and electric cars contribute to an additional reduction in NOx and PM10 values in cities


3
Electric transportation is playing an important role in the future of sustainable energy

1�
In the future we are going to use more and more
sustainable energy. After all, sun and wind are
available in abundance. Electric cars mean we are
able now and in the future to make optimal use of
that sustainable energy. Up to now we did not
have the means to realise the flexible storage of
- primarily - wind and solar energy despite this
being necessary given that the yield from these
sources cannot be influenced and is subject to
fluctuations. Electric cars offer the possibility of
flexible storage in their batteries. The more
electrically-powered cars there are, the more
potential storage capacity there will be, and that is
yet another incentive for the production and use of
sustainable, clean energy.
Storage facilities close to local sources
Future energy management will be characterised
by increasing decentralisation. Small local units
will start supplying more and more of the energy
required. This means there will be plenty of
opportunities to generate sustainable energy or
use windmills and solar panels. Investments in
the network are necessary to distribute the energy
generated locally across the regional network.
Creating storage facilities close to local sources
will limit the costs of these investments.
More intensive use of capacity
Intelligent control instruments will mean we can
soon respond effectively to the growing need for
energy and successfully manage its distribution
and delivery. One of those instruments is the
Mobile Smart Grid, a distribution concept with
which we can use the generating capacity and
the capacity of the existing electricity network
intelligently and more intensively. This will enable
us to meet the increasing demand for electricity
with just a limited number of extension investments
being required. This will increase the total share
of sustainable energy in the total energy mix in the
Netherlands.
Driving electric leading to considerable increase in energy storage capacity3
2009 2050
Wind
Thermal units
Solar75
20
2721
2
Available peak capacity for electricity generation in the Netherlands (GW)

1�
Supply
Shortage
Controleerbarebronnen
Solar and wind
Demand Supply
Fossil sources
Fossil sources
Intermittentsources
Demand
Surplus
Options to prevent shortage: 1) construction of more conventional power stations 2) reduce demand 3) take energy from storage
Options to prevent surplus: 1) discharge of (excess) wind energy 2) increase demand 3) add energy to storage
Solar and wind
Sustainable energy sources are not available continually and yields fluctuate. The use of electrical energy can be optimised through flexible storage and control of demand and the electric car plays a key role in this respect (2050).
Extreme situation 1: High demand, no wind and solar Extreme situation 2: Low demand, lots of wind and solar
The energy landscape
Network
Network
Future situation: central and local generation, additional energy exchange at regional level
Current situation: central generation, local use
14
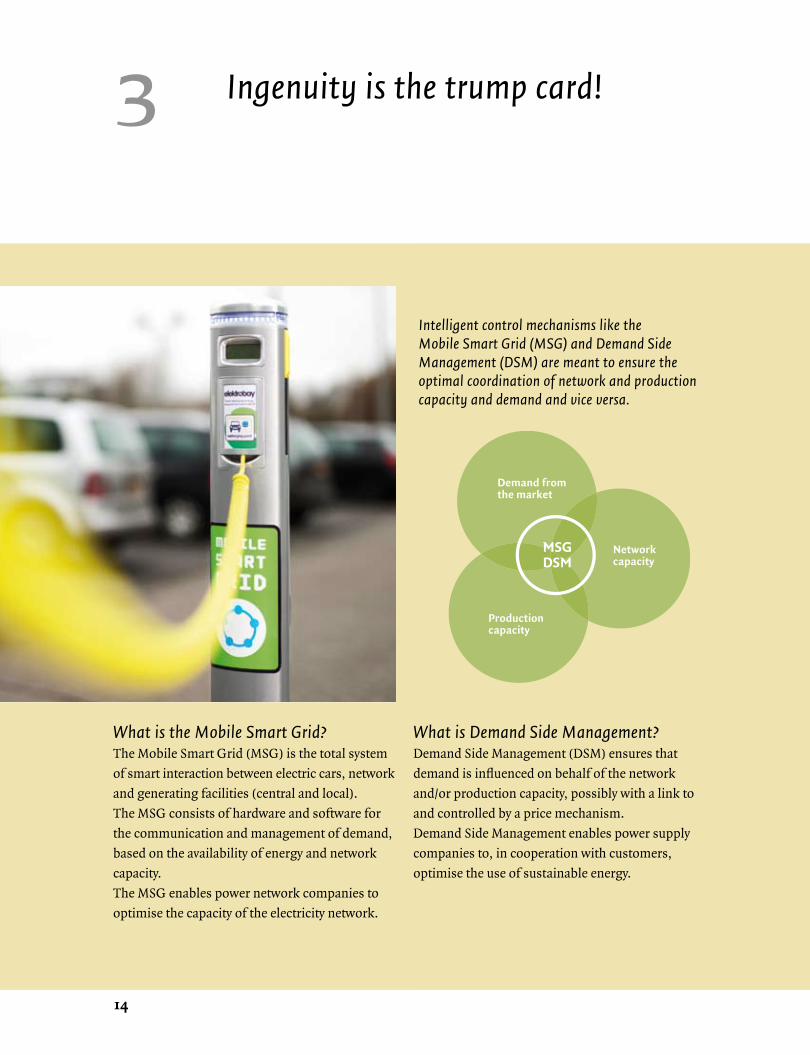
Demand from the market
Production capacity
Network capacityDSM
MSG
Ingenuity is the trump card!3
Intelligent control mechanisms like the Mobile Smart Grid (MSG) and Demand Side Management (DSM) are meant to ensure the optimal coordination of network and production capacity and demand and vice versa.
What is the Mobile Smart Grid? The Mobile Smart Grid (MSG) is the total system
of smart interaction between electric cars, network
and generating facilities (central and local).
The MSG consists of hardware and software for
the communication and management of demand,
based on the availability of energy and network
capacity.
The MSG enables power network companies to
optimise the capacity of the electricity network.
What is Demand Side Management? Demand Side Management (DSM) ensures that
demand is influenced on behalf of the network
and/or production capacity, possibly with a link to
and controlled by a price mechanism.
Demand Side Management enables power supply
companies to, in cooperation with customers,
optimise the use of sustainable energy.
15
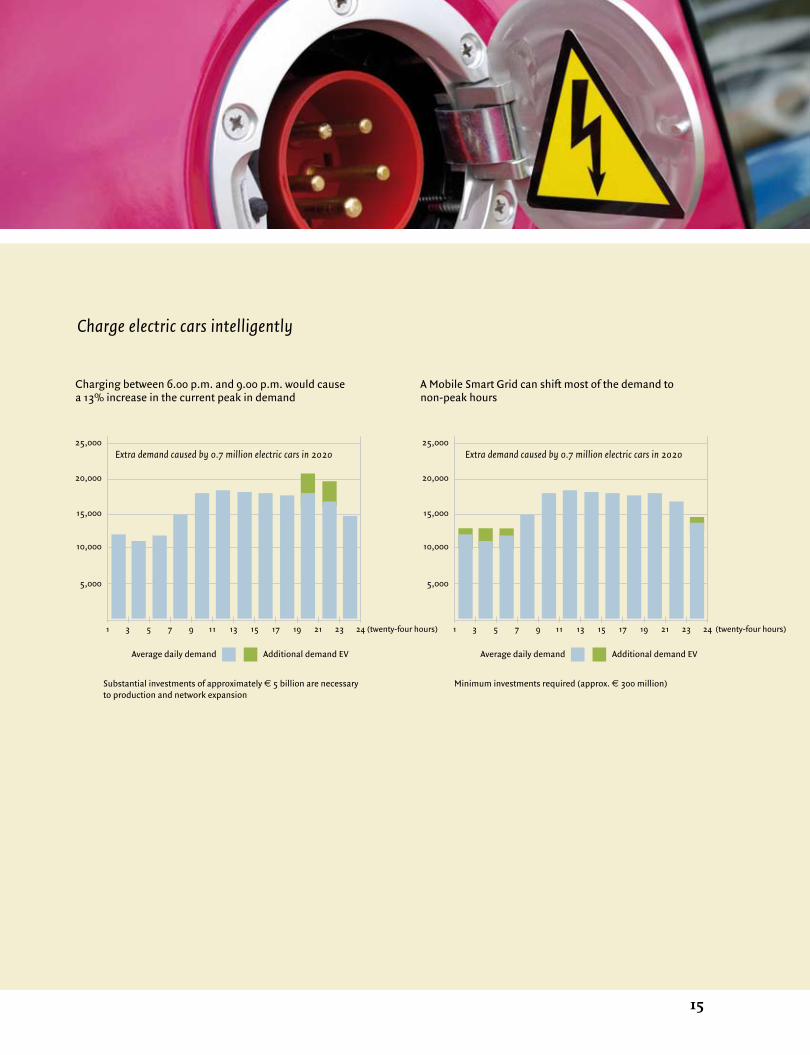
Charge electric cars intelligently
Average daily demand
Substantial investments of approximately € 5 billion are necessary to production and network expansion
Minimum investments required (approx. € 300 million)
Additional demand EV Average daily demand Additional demand EV
1 3 5 7 9 11 13 15 17 19 21 23 24 (twenty-four hours)(twenty-four hours)
20,000
25,000
15,000
10,000
5,000
1 3 5 7 9 11 13 15 17 19 21 23 24
20,000
25,000
15,000
10,000
5,000
Extra demand caused by 0.7 million electric cars in 2020 Extra demand caused by 0.7 million electric cars in 2020
Charging between 6.00 p.m. and 9.00 p.m. would cause a 13% increase in the current peak in demand
A Mobile Smart Grid can shift most of the demand to non-peak hours

Driving electric accessible to all
4

1�
Electric cars are now so technologically advanced
that they can easily compete with conventional
cars. However, competitive purchase prices are also
needed to make driving electric accessible to the
general public. The government is helping out by
providing tax incentive schemes. Mass production
is also intended to lead to attractive prices.
Various famous car makers have unfolded plans to
bring large numbers of electric cars onto the market
in the coming years. It is essential that the tax
incentive measures continue to apply. Significant
progress has been made in the field of charging
technology in recent years. With the latest
generation of batteries cars can now be produced
which can travel 5 times the average daily distance
travelled. As a result, sufficient driving capacity
is now available to the vast majority of motorists
(90%!). It takes no more than two hours to charge
batteries sufficiently for daily use. In the short to
medium term, long distance drivers could use
plug-in hybrids and other mobility solutions such
as car and train combinations.
Many-branched network In order to introduce
electric transportation successfully, there must be
sufficient charging possibilities along motorways,
at parking places, at petrol stations and at home.
A many-branched infrastructure which reaches
to every corner of our country will make driving
electric accessible to all.
The EV battery is sufficient for five times the average daily distance travelled
4

1�
Conventional car Electric car Conventional car Electric car
Fuel
Maintenance
Road tax
Private motor vehicleand motorcycle tax
Insurance
Fuel
Maintenance
Road tax
Private motor vehicleand motorcycle tax
Insurance
38 k
47 k
37 k2
33 k
Car 16 k
6 k
3 k
3 k
7 k
3 k
37 k
3 k2 k
5 k
25 k
3 k2 k
3 k3
16 k
5 k
3 k3 k
7 k
3 k
Car incl. battery1
Car incl. battery1
The maintenance costs for an electric car are 36% lower than for a conventional car.
2 Total costs of ownership for conventional cars is lower in 2020 than in 2009 due to the reduction in fuel costs due to internal combustion engine improvements.3 Electric car insurance is lower in 2020 than in 2009 because the premium is coupled to an increasingly lower purchase value.
1 Car incl. battery is calculated plus interest less residual value.
Total costs of car ownership 2009 business lease car, in euro
Total costs of car ownership 2020 business lease car, in euro
Main categories of electric cars
Regenerative braking system
Electric motor
Batteries
ICE
Fuel tankPetrol/diesel
Regenerative braking system
Electric motor
Batteries
ICE
Regenerative braking system
Electric motor
Batteries
ICE
Regenerative braking system
Electric motor
Batteries Fuel tank
Petrol/diesel Fuel tank
Petrol/diesel
Hybrid electric car Plug-in hybridelectric car
Plug-in hybrid electric car range extender
Electric range: 50-70 km Electric range: 50-70 kmElectric range: - km
Fully electric car
Electric range: ca. 200 km
0% 10 20 30 40 50 60 70 80 90 100
> 150 km
101-150 km
76-100 km
51-75 km
0.1-50 km40
200
29
41
75 2.5 x
5 x
7 x
5 x
Business
(Private)Commuting
(Private)Leisure
Total average
Average daily distance travelled The range of an electric VW Golf is 200 km (37 kWh battery)
91% of all motorists in the Netherlands travel less than 150 km per day
Daily distance travelled by car in km per segment Average daily distance travelled
Daily distances travelled in the Netherlands
Car costs in 2009 and 2020


Widespread charging infrastructure
5

��
The transition to electric transportation presents
enormous challenges and opportunities.
Where are the charging stations going to be
located? Who is going to operate them and what
additional services are to be offered? How are we
going to pay for the electricity we use in our cars
in the future? Petrol station owners, financial and
commercial service providers, network operators
and energy suppliers are all going to have work to
do to shape the new business.
City councils and provincial and national
government bodies are also going to have important
roles to play. After all, they will have to decide on
the location and design of the charging stations.
Through low emission zones and parking
incentives in town and city centres they will leave
their mark on the development of electric
transportation and on the image presented to the
public. Various pilot projects are now getting
started, generally on the basis of cooperation
between the government, energy suppliers,
network operators, hauliers, fleet managers and
car manufacturers. Various large Dutch local
authorities have developed electric transportation
plans. For example, Amsterdam has launched a
plan to construct a comprehensive network of
charging stations. Soon, anyone who enters the
capital in an electric car will also be entitled to
preferential parking. In Den Bosch charging
points are to be set up at central places in the city.
Ideas are already being put forward to use electric
buses for public transport services in and around
the capital of the province of Brabant. Last but not
least, the interests of the car drivers themselves
are another crucial factor. Those interests have to
be analysed and seriously considered in order to
make everyone enthusiastic about electric
transportation. Consumer organisations and
other pressure groups are going to follow the
development of electric transportation from close
by. How are they going to be involved in pilot
projects, how can they ensure that their voice is
heard, for example in the context of choosing the
locations of charging stations, and how will they
be informed about, for example, the pricing of
electrical energy for cars? This again presents
plenty of inviting opportunities.
Work to be done 5

��


A pioneering role for the Netherlands
6

��
The Netherlands is ideally suited for a pioneering
role as regards electric transportation thanks to
the relatively short distances travelled by car.
Most of the major cities are less than 200 kilometres
apart. The average distances travelled by car in our
country can now easily be covered using electrical
energy. We have a good and modern electricity
network which is the essential basis for a many-
branched charging infrastructure. What is more,
our power companies are leading the way as
regards the generation and application of
sustainable energy.
Public-private cooperation There is a great
deal of knowledge and innovative strength in the
energy and car sectors. We have proven convincingly
that we are strong in public-private partnerships.
The transition to electric transportation offers
huge opportunities. Cooperation between
companies, energy suppliers, universities and
research institutes is the ideal way to make optimal
use of those opportunities.
The government at national, provincial and local
levels approves of electric transportation and is
actively supporting its development in the form
of fiscal incentives, financial support for pilot
projects and other ambitious plans. The government
also wants to accelerate the construction of a
national network of charging points. The network
operators in the Netherlands are enthusiastic
supporters of electric transportation and are
keen to get involved. By 2012 they want to have
constructed around ten thousand charging points.
In short, the Netherlands has all it takes to fulfil
the role of electric transportation pioneer.
Economic benefits Driving electric opens up
prospects for innovation, research and development
and the development and marketing of new
products and services. This means activities like
the optimisation of batteries, charging technology,
the integration of car and batteries, car design and
the layout of charging stations. Sample calculation:
If there were a million electric vehicles being used
in the Netherlands, electric transportation with all
the commercial activities related to it, would
generate a turnover of 1.6 billion euros per year.
Huge opportunities are therefore going to present
themselves which will boost our knowledge and
services economy.

��
Opportunities for the Dutch knowledge and services economy
Battery production
€ 0.25 billion
€ 0.32 billion
€ 0.5 billion
€ 0.15 billion
€ 0.4 billion
Design and production
Lease and financing
Sales and service
Sales and maintenance
Installation and service
Electric cars
Production OperationCharging infrastructure
Electricity DistributionGeneration
• Car design• Integration of car and battery R&D• Assembly
• Market research• Maintenance concepts and know how• Battery reuse
• Innovative mobility solutions• (Battery) leasing
• Accu R&D• Oplaadtechnologie R&D
• Integration of payment systems and Smart Grid
• Large-scale roll out of services• Maintenance concepts and know how
• Service concepts • Charging behaviour research • Payment solutions
• Charging points R&D• Rapid charging technology R&D
• Mobile Smart Grid ICT• Mobile Smart Grid network management and regulation• Battery reuse
• Product benefits • Payment solutions
• Sustainable energy generation
• Local energy solutions
Sample calculation: a million electric cars generate a turnover of e 1.6 billion per year


Electric transportation requires close cooperation
7
�0
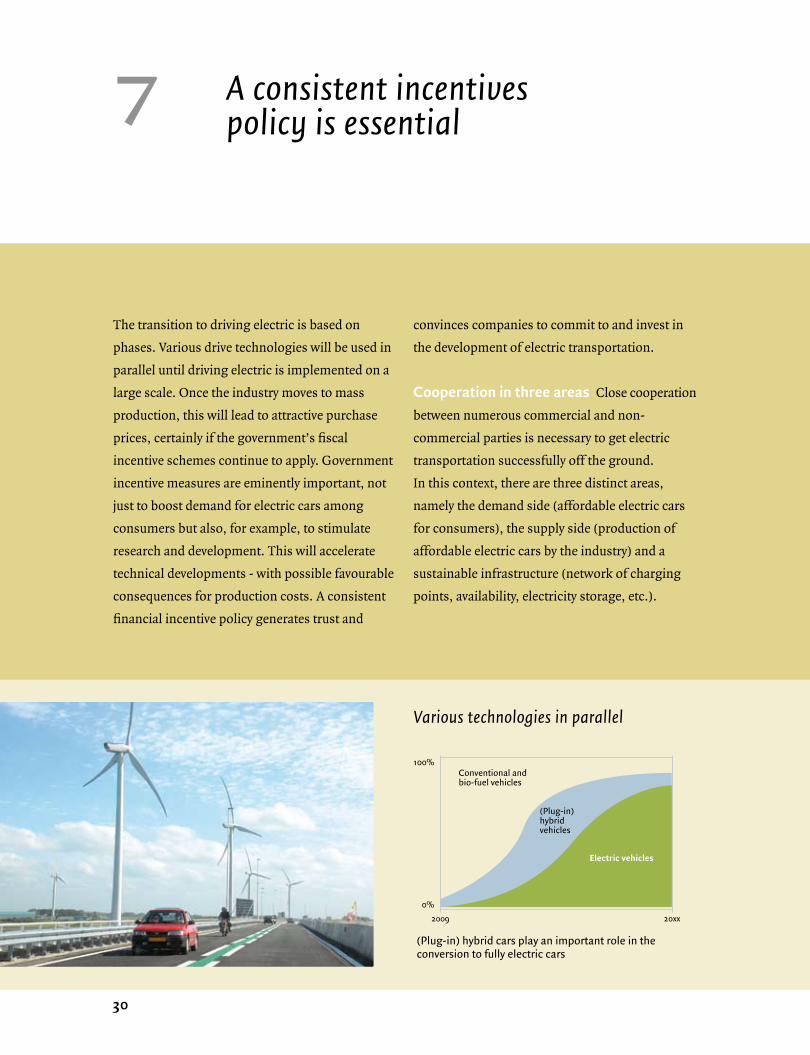
A consistent incentives policy is essential7
The transition to driving electric is based on
phases. Various drive technologies will be used in
parallel until driving electric is implemented on a
large scale. Once the industry moves to mass
production, this will lead to attractive purchase
prices, certainly if the government’s fiscal
incentive schemes continue to apply. Government
incentive measures are eminently important, not
just to boost demand for electric cars among
consumers but also, for example, to stimulate
research and development. This will accelerate
technical developments - with possible favourable
consequences for production costs. A consistent
financial incentive policy generates trust and
convinces companies to commit to and invest in
the development of electric transportation.
Cooperation in three areas Close cooperation
between numerous commercial and non-
commercial parties is necessary to get electric
transportation successfully off the ground.
In this context, there are three distinct areas,
namely the demand side (affordable electric cars
for consumers), the supply side (production of
affordable electric cars by the industry) and a
sustainable infrastructure (network of charging
points, availability, electricity storage, etc.).
Various technologies in parallel
Conventional and bio-fuel vehicles
(Plug-in) hybrid vehicles
2009 20xx
100%
0%
Electric vehicles
(Plug-in) hybrid cars play an important role in the conversion to fully electric cars

�1
Demand side Car industry
Lease companies Pressure groups
Environmental organisations Governments
Infrastructure Car industry
Owners' parking options Power network companies
Commercial power companies ICT companies
Governments
Supply side Car industry Delivery companies Financial institutions Knowledge institutes Governments
Create clear and attractive fiscal regulations to compensate the high initial purchase price for consumers.
Guarantee the car industry, car companies and knowledge institutes the possibility to develop and produce electric cars for the Dutch market.
Realise, based on a overall vision, the required infrastructure (charging
points, payment, control model) including possibilities for using
sufficient sustainable energy.
Cooperation in three areas
Total Electric cars
0 1 2 8 9 10
2010
2016
2017
2018
2019
2020
The share of electric cars could be 7% in 2020
This insight is based on Essent’s moderately optimistic scenario
Expectations of various other parties are predominantly positive but are not always consistent: • according to ECN: 10% in 2020, 45% in 2040
(numbers of cars) • government plan entitled ‘Driving electric action plan’
[Plan van Aanpak Elektrisch Rijden] of July 2009: 1 million by 2025
Expected number of cars per year in millions

��
Electric cars Conventional cars
Hybrid cars
0
10,000
20,000
30,000
40,000
50,000
2008 2010 2012 2014 2016 2018 2020
0
2008 2010 2012 2014 2016 2018 2020
10,000
20,000
30,000
40,000
50,000
60,000
70,000
80,000
Electric cars Conventional cars
Hybrid cars
Cost development of car ownership lease segment, in euros
Cost development of car ownership (private) commuting, in euros
How fast the costs of an electric car decrease depends partly on a consistent incentive policy
Sooner or later ownership of an electric car will
cost less than that of a conventional car. When the
exact turning point is reached depends partly on
how quickly the industry is able to move to mass
production and reduce the purchase price and this
can be heavily affected by a confidence-building
incentive policy.

��
Develop fiscal regime (to compensate the high initial purchase price)Customer
demand
Available EVs
Infrastructure
Proof of concept = pilots
Development of market model for charging infrastructure
Create conditions for OEMs* to start mass production
Mass production
Roll out charging points network (in anticipation of demand)
Design market model and structure of Mobile Smart Grid
Standardisation of the car - charging point communication
Standardisation
Monitoring and implementation Implementation programmes
Setting up mass production (in selective car types)
Proof of concept = pilots
Implementation of Mobile Smart Grid
2-4 years
Design Mobile Smart Grid
* OEM = Original Equipment Manufacturer
Parties involved
Car industry Lease companies Pressure groups Environmental organisations Governments
Car industry Delivery companies Financial institutions Knowledge institutes Governments
Car industry Owners’ parking options Power network companies Commercial power companies ICT companies Governments
Booking progress through cooperation

�4

�5
Essent and Enexis invite you to join in!
8
Electric transportation enables us to go some way
to meeting the growing need for sustainable
mobility. Unlike any other development, electric
transportation enables us to create a better
balance between economic growth and quality
of life. It therefore shows great promise.
The transition to electric transportation is a
long-term development. We can direct and
accelerate the transition process by working
together, carrying out research, initiating pilot
projects and creating a basis for support.
We can only fulfil the promise if we work together.
So join us now!
Additional contact details can be found at
www.essent.nl/elektrischrijden.
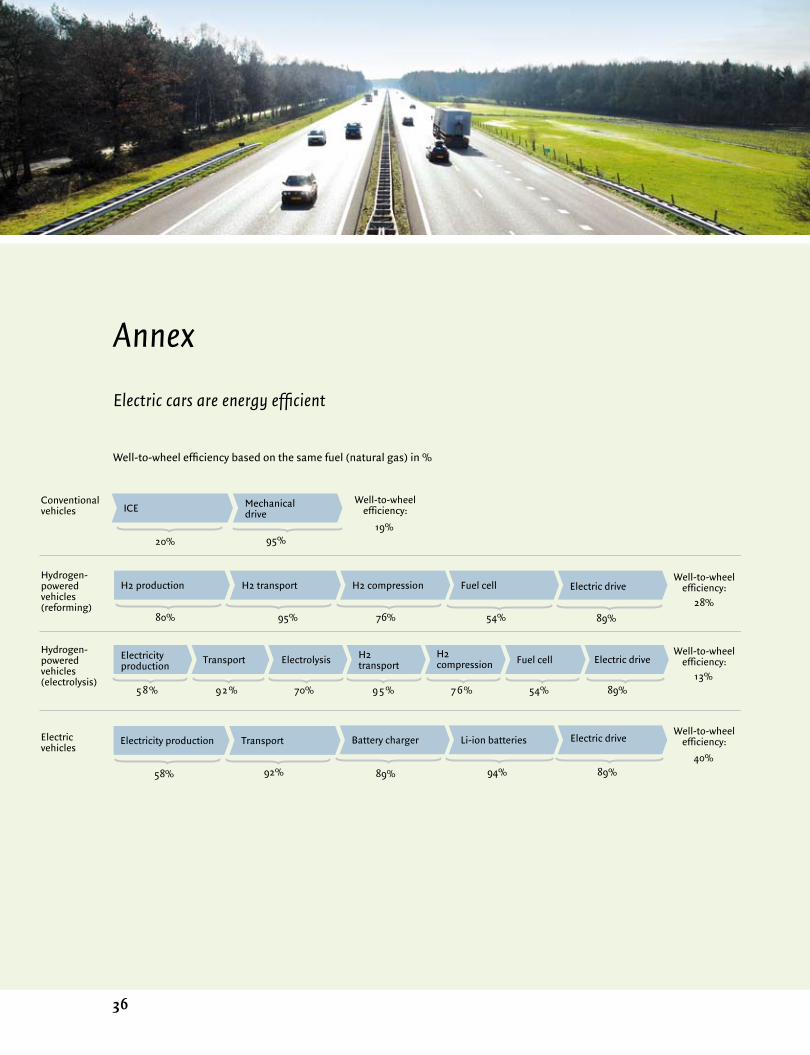
��
Electric cars are energy efficient
ICE Mechanical drive
19%95%
H2 production H2 transport H2 compression Fuel cell Electric drive
28%80% 95% 76% 89%54%
Electricity production Transport
40%92%58%
Li-ion batteries
94% 89%
Battery charger
89%
20%
Conventional vehicles
Electric vehicles
Hydrogen-powered vehicles (reforming)
13%%67%59%29%85
Transport Electrolysis H2transport
H2compression Fuel cell
Hydrogen-powered vehicles (electrolysis)
70% 89%54%
Electric drive
Electric drive
Well-to-wheel efficiency:
Well-to-wheel efficiency:
Well-to-wheel efficiency:
Well-to-wheel efficiency:
Electricity production
Annex
Well-to-wheel efficiency based on the same fuel (natural gas) in %

Publisher Essent New Energy and Enexis
Editing Albert Vondeling, Leonie Syrier
Editing advice Hans Huigen, Wouter Vermeiden,
Johan Withagen, Harry Oltheten, New Energy Electric
Transportation Team
Design and realisation Wit Creatives, Deventer
The compilers have done their very best to present
all details carefully.
If you have any comments please contact us via
www.essent.nl/elektrischrijden.
September 2009
Publisher’s details
Section 1 Statistics Netherlands [Centraal Bureau voor Statistiek]
2008, 2004 (pag. 2); RWS-AVV MON ’05 2005 (top of pag. 3);
Statistics Netherlands 2004 (bottom of pag. 3)
Section 2 IEA 2005, Siemens (pag. 7 - see also annex pag.
36); emissions registration via the Netherlands Environmental
Assessment Agency [Planbureau voor de leefomgeving] (PBL) 2007;
TNO (Netherlands Organisation for Applied Scientific Research)
Air in Research 2009 [Lucht in onderzoek 2009] (bottom of pag. 9)
Section 3 UTCE/SenterNovem (2009): “Towards a sustainable
electricity supply” [“Naar een duurzame elektriciteitsvoorziening”]
(pag. 12)
Section 4 Honda (top of pag. 19); Statistics Netherlands (CBS),
Goudappel, Netherlands Mobility Centre [Mobiliteit Centrum
Nederland] (middle of pag. 19 ); Business model for electric
transportation, Essent 2008 (bottom of pag. 19)
Section 6 Business model for electric transportation,
Essent 2008 (pag. 27)
Section 7 Business model for electric transportation,
Essent 2008 (bottom of pag. 31)
Annex Well to wheel analysis from EIA (2005) without Gasoline
production (90%) and Gasoline Transportation (98%); Efficiency of
modern gas fired power plant; Source Siemens, Alstom, GE (pag. 36)
Sources of graphs, overviews, etc. shown